simultaneous nitrification and denitrification of
TRANSCRIPT
SIMULTANEOUS NITRIFICATION AND DENITRIFICATION OF
WASTEWATER USING A SILICONE MEMBRANE AERATED BIOREACTOR
A Master’s Thesis Presented to the Faculty of California Polytechnic State University,
San Luis Obispo
In Partial Fulfillment of the Requirements for the Degree
Master of Science in Civil and Environmental Engineering
By
Kirk Hjelte Waltz
March 2009

ii
COPYRIGHT PAGE I grant permission for the reproduction of this thesis in its entirety or any parts, without
further authorization from me, provided the author and major advisor are properly
referenced.
Signature
Date

iii
COMMITTEE MEMBERSHIP PAGE SIMULTANEOUS NITRIFICATION AND DENITRIFICATION OF WASTEWATER USING A MEMBRANE AERATED BIOREACTOR
KIRK HJELTE WALTZ SUBMITTED: Committee Chair: Dr. Nirupam Pal, Ph. D Date Committee Member: Dr. Yarrow Nelson, Ph. D Date Committee Member: Dr. Tryg Lundquist, Ph. D Date

iv
ABSTRACT Simultaneous Nitrification and Denitrification of Wastewater Using a Silicon Membrane
Aerated Bioreactor
Kirk Hjelte Waltz
The purpose of this thesis is to investigate the use of a single reactor to biologically treat
wastewater by simultaneously oxidizing ammonia, and reducing nitrate and nitrite. The
Environmental Protection Agency (EPA) places strict discharge restrictions on these
compounds due to their inherent toxicity to humans, wildlife, and ecosystems. The use of
a simultaneous system can assist the conventional wastewater treatment technology that
requires separate systems, by creating a system that needs less time and smaller size to
reach effluent requirements. To conduct this research, a bench-scale membrane aerated
biofilm reactor was built using silicone tubing for aeration. Batch and continuous-flow
experiments were conducted to investigate the reactor’s capability to oxidize ammonia
using a defined growth media and monitor nitrate production and reduction. Also,
wastewater from a local reclamation facility was used to determine the reactor’s ability to
nitrify ammonia and denitrify nitrate concentrations within wastewater. The wastewater
was taken from different locations within the reclamation facility, and combinations of
primary and nitrified effluent were used to monitor ammonia and nitrate concentration
changes. The batch experiments showed the greatest changes, and one batch experiment
showed a 79% decrease in ammonium concentrations, and followed a first-order kinetics
rate constant of -0.0284 hrs-1. The continuous-flow experiments showed much greater
fluctuations in results, but one of the experiments showed an ammonia oxidation
efficiency of 86%. The wastewater experiments had even greater fluctuations, and the
effluent concentrations of ammonia, nitrate and nitrite showed no changes when
compared to the influent.

v

vi
ACKNOWLEDGMENTS I would like to thank everyone who helped me complete this thesis. I greatly appreciate all my thesis advisors for their support, assistance, and guidance throughout this project, and all the CE/ENVE graduate students that kept me company in lab and who helped me. I would like to thank Dr. Nirupam Pal for providing me with this great learning experience, and for giving me the opportunity to work on this project. I especially want to thank Ramzi Chaabane for sharing the long hours of analysis and planning needed for the project to be completed, and for doing a very good job on everything he did. Most importantly, I want to thank my family for providing me with everything I could have every dreamed of throughout my life and giving me every opportunity to succeed. Their love and support have gotten me through the toughest of times, and their unbiased and thoughtful judgments have always kept me determined and confident to stay focused and never give up.

vii
TABLE OF CONTENTS
LIST OF FIGURES ........................................................................................................... ix
LIST OF TABLES............................................................................................................. xi
CHAPTER 1: INTRODUCTION....................................................................................... 1 CHAPTER 2: BACKGROUND......................................................................................... 4
2.1 COMMON METHODS FOR REMOVAL OF AMMONIA, NITRATES AND NITRITES IN
WASTEWATER ........................................................................................................... 4
2.2 SIMULTANEOUS BIOLOGICAL NITRIFICATION/DENITRIFICATION .............................. 8
2.2.1 Biological Characteristics .................................................................................. 8 2.3 MABR CHARACTERISTICS ........................................................................................ 9
2.3.1 MABR Tubing ................................................................................................. 10
2.3.2 Biofilm and MABR Investigations .................................................................. 12
2.2.4 Previous Research with Current MABR.......................................................... 16
CHAPTER 3: MATERIALS AND METHODS .............................................................. 18 3.1 MEMBRANE AERATED BIOFILM REACTOR SETUP ................................................... 18
3.2 EXPERIMENT TYPES ................................................................................................ 22
3.2.1 Batch Experiments ........................................................................................... 22
3.2.2 Continuous Experiments.................................................................................. 23
3.3 REACTOR MEDIA..................................................................................................... 26 3.3.1 Initial 50 mg/L NH4
+ as NH4
+minimal growth media ..................................... 27
3.3.2 10 mg/L NH4+ minimal growth media............................................................. 27
3.3.3 25 mg/L NH4+ minimal growth media............................................................. 29
3.3.4 5 mg/L NH4+ minimal growth media............................................................... 30
3.4 LOCAL MUNICIPAL WASTEWATER .......................................................................... 30 3.4.1 Secondary Effluent Sample.............................................................................. 31
3.4.2 Nitrified Effluent Sample................................................................................. 32 3.4.3 Nitrified and Primary Effluent Mixtures.......................................................... 33
3.5 MEDIA SAMPLING AND ANALYSIS........................................................................... 37
3.5.1 Ammonia Analysis........................................................................................... 38
3.5.2 Nitrate Analysis ............................................................................................... 39 3.5.3 Nitrite Analysis ................................................................................................ 41
CHAPTER 4: RESULTS AND DISCUSSION................................................................ 43
4.1 BATCH EXPERIMENT RESULTS ................................................................................ 43
4.1.1 Batch Experiment B1 Results .......................................................................... 43 4.1.2 Batch Experiment B2 Results .......................................................................... 46
4.1.3 Batch Experiment B3 Results .......................................................................... 49
4.1.4 Batch Experiment B4 Results .......................................................................... 53
4.2 CONTINUOUS – FLOW EXPERIMENT RESULTS ......................................................... 57
4.2.1 Continuous – Flow Experiment C1 Results..................................................... 58 4.2.2 Continuous – Flow Experiment C2 Results..................................................... 60
4.2.3 Continuous – Flow Experiment C3 Results..................................................... 63
4.2.4 Continuous – Flow Experiment C4 Results..................................................... 65
4.2.5 Continuous – Flow Experiment C5 Results..................................................... 68
4.2.6 Continuous – Flow Experiment C6 Results..................................................... 70 4.3 LOCAL MUNICIPAL WASTEWATER RESULTS ........................................................... 73

viii
4.3.1 Secondary Effluent Experiment CW1 Results................................................. 73
4.3.2 100% Nitrified Effluent Experiment CW2 Results ......................................... 75 4.3.3 5% Primary, 95% Nitrified Effluent Experiment CW3 Results ...................... 77
4.3.4 25% Primary, 75% Nitrified Effluent Experiment CW4 Results .................... 79
4.3.5 15% Primary, 85 % Nitrified Effluent Experiment CW5 Results ................... 82
CHAPTER 5: CONCLUSIONS ....................................................................................... 86 5.1 EXPERIMENTAL CONCLUSIONS................................................................................ 86 5.2 FUTURE RESEARCH ................................................................................................. 87
REFERENCES ................................................................................................................. 88
APPENDIX A................................................................................................................... 91 AMMONIA, NITRATE AND NITRITE CALIBRATION CURVES ........................................... 91
ix
LIST OF FIGURES
Figure 2.1: Typical Activated sludge process at San Luis Obispo Water Reclamation
Facility ........................................................................................................................ 4
Figure 2.2: Ludzak-Ettinger Nitrogen Removal (Metcalf and Eddy, 2003)....................... 5
Figure 2.3: Modified Ludzak-Ettinger Nitrogen Removal (Metcalf and Eddy, 2003)....... 6 Figure 2.4: Single-sludge Nitrogen Removal (Metcalf and Eddy, 2003) ........................... 7
Figure 2.5: Bardenpho Nitrogen Removal (Metcalf and Eddy, 2003) ............................... 7
Figure 2.6: Membrane Aerated Biofilm Reactor (Terada et al., 2002)............................. 10
Figure 2.7: Concentration profile schematic (Brindle et al., 1998) ................................. 12
Figure 3.1: Three Membrane Aerated Biofilm Reactor Set-ups....................................... 18 Figure 3.2: MABR Top Schematic View ......................................................................... 19
Figure 3.3: Biofilm Growing on Silicone Tubing during the Experiment........................ 19
Figure 3.4: MABR Schematic........................................................................................... 21
Figure 3.5: Reactor Set-up with Initial Feed Tank (Left) and Replacement Feed Tank
(Right) ....................................................................................................................... 21 Figure 3.6: Secondary Clarifier Effluent San Luis Obispo Water Reclamation Facility.. 31
Figure 3.7: Nitrified Effluent from Final Clarifier San Luis Obispo Water Reclamation
Facility ...................................................................................................................... 32
Figure 3.8: Primary Effluent from Primary Clarifier of San Luis Obispo Water
Reclamation Facility ................................................................................................. 34 Figure 4.1: pH and Temperature Profile for Experiment B1 ............................................ 44
Figure 4.2: Ammonia, Nitrate and Nitrite Concentrations during Experiment B1........... 45
Figure 4.3: pH and Temperature Profile for Experiment B2 ............................................ 47
Figure 4.4: Ammonia, Nitrate and Nitrite Curves for Experiment B2 ............................. 48
Figure 4.5: First-Order Nitrification Kinetics for Experiment B2.................................... 49 Figure 4.6: pH and Temperature Profile for Experiment B3 ............................................ 50
Figure 4.7: Ammonia, Nitrate and Nitrite Concentrations for Experiment B3 MABR
Reactor ...................................................................................................................... 51
Figure 4.8: Ammonia, Nitrate and Nitrite Concentrations for Experiment B3 Anoxic
Reactor ...................................................................................................................... 52 Figure 4.9: Nitrate and Nitrite IC Curves for Experiment B3 .......................................... 53
Figure 4.10: pH and Temperature Profile for Experiment B4 .......................................... 54
Figure 4.11: Ammonia, Nitrate and Nitrite Concentrations for Experiment B4 MABR
Reactor ...................................................................................................................... 55
Figure 4.12: Ammonia, Nitrate and Nitrite Concentrations for Experiment B4 Anoxic
Reactor ...................................................................................................................... 55
Figure 4.13: Nitrate and Nitrite IC Curves for Experiment B4 ........................................ 56
Figure 4.14: pH and Temperature Profile for Experiment C1.......................................... 58
Figure 4.15: Ammonia, Nitrate and Nitrite Curves for Experiment C1 ........................... 59
Figure 4.16: Nitrate and Nitrite IC Curves for Experiment C1 ........................................ 60 Figure 4.17: pH and Temperature Profile for Experiment C2.......................................... 61
Figure 4.18: Ammonia, Nitrate and Nitrite Curves for Experiment C2 ........................... 62 Figure 4.19: pH and Temperature Profile for Experiment C3.......................................... 63
Figure 4.20: Ammonia, Nitrate and Nitrite Curves for Experiment C3 ........................... 64
Figure 4.21: Nitrate and Nitrite IC Curves for Experiment C3 ........................................ 65

x
Figure 4.22: pH and Temperature Profile for Experiment C4.......................................... 66
Figure 4.23: Ammonia, Nitrate and Nitrite Curves for Experiment C4 ........................... 67 Figure 4.24: pH and Temperature Profile for Experiment C5.......................................... 69
Figure 4.25: Ammonia, Nitrate and Nitrite Curves for Experiment C5 ........................... 70
Figure 4.26: pH and Temperature Profile for Experiment C6.......................................... 71
Figure 4.27: Ammonia, Nitrate and Nitrite Curves for Experiment C6 ........................... 72
Figure 4.28: pH and Temperature Profile for Experiment CW1 ...................................... 74 Figure 4.29: Ammonia, Nitrate and Nitrite Curves for Experiment CW1........................ 75
Figure 4.30: pH and Temperature Profile for Experiment CW2 ...................................... 76
Figure 4.31: Ammonia, Nitrate and Nitrite Curves for Experiment CW2........................ 77
Figure 4.32: pH and Temperature Profile for Experiment CW3 ...................................... 78
Figure 4.33: Ammonia, Nitrate and Nitrite Curves for Experiment CW3........................ 79 Figure 4.34: pH and Temperature Profile for Experiment CW4 ...................................... 80
Figure 4.35: Ammonia, Nitrate and Nitrite Curves for Experiment CW4........................ 81
Figure 4.36: Nitrate and Nitrite IC Curves for Experiment CW4..................................... 82
Figure 4.37: pH and Temperature Profile for Experiment CW5 ...................................... 83
Figure 4.38: Ammonia, Nitrate and Nitrite Curves for Experiment CW5........................ 84 Figure 4.39: Nitrate and Nitrite IC Curves for Experiment CW5..................................... 85

xi
LIST OF TABLES
Table 3.1: Experiment Nomenclature ............................................................................... 22
Table 3.2: Batch Experiment Specifications..................................................................... 22
Table 3.3: Continuous Experiments Specifications .......................................................... 25
Table 3.4: Initial 50 mg/L NH4+ minimal growth media .................................................. 27
Table 3.5: 10 mg/L NH4+ minimal growth media............................................................. 28
Table 3.6: 10 mg/L NH4+ minimal growth media using limited nutrients........................ 28
Table 3.7: 25 mg/L NH4+ minimal growth media............................................................. 29
Table 3.8: 25 mg/L NH4+ minimal growth media using limited nutrients........................ 29
Table 3.9: 5 mg/L NH4+ minimal growth media using limited nutrients.......................... 30
Table 3.10: Secondary Effluent Constituent Concentrations (Experiment CW1)............ 31
Table 3.11: Nitrified Effluent Constituent Concentrations (Experiment CW2) ............... 32
Table 3.12: Primary Effluent Constituent Concentrations................................................ 35
Table 3.13: 5% Primary, 95% Nitrified Effluent Mixture Constituents Concentrations
(Experiment CW3).................................................................................................... 36 Table 3.14: 25% Primary, 75% Nitrified Effluent Mixture Constituents Concentrations
(Experiment CW4).................................................................................................... 36
Table 3.15: 15% Primary, 85% Nitrified Effluent Mixture Constituents Concentrations
(Experiment CW5).................................................................................................... 37
Table 4.1: Batch Process Specifications ........................................................................... 43 Table 4.2: Continuous Process Specifications .................................................................. 57
Table 4.3: Continuous Wastewater Process Specifications .............................................. 73

1
CHAPTER 1: INTRODUCTION
Nitrogen compounds are an essential building block for the growth of microorganisms,
plants, and animals. Known as nutrients or biostimulants, they can also have extremely
negative effects when in contact with bodies of water. There are several oxidation states
of nitrogen based compounds, but the most common and important compounds to water
environments are ammonia (NH3), ammonium (NH
4
+), nitrogen gas (N
2), nitrite ions (NO
2
-
), and nitrate ions (NO3
-) (Metcalf and Eddy, 2003). These compounds can be detrimental
to water environments through the promotion of cell growth and the creation of toxic
conditions. The ammonia compound is toxic to fish and other aquatic life, and the
microbial growth increases the biological oxygen demand and decreases dissolved
oxygen concentrations within the aquatic habitat. This creates “dead zones” caused by a
lack of dissolved oxygen in the water, and is very detrimental to all aquatic life.
Short-term and long-term exposures to nitrate and nitrite can cause major health problems
to humans when contaminated drinking water is consumed. Short-term exposure to
infants through drinking water contamination can cause methemoglobinemia (LaPara and
Ghosh, 2006), also known as blue baby syndrome. The highly soluble nitrates and
nitrites attach to the hemoglobin in the blood and cause displacement of oxygen in the
blood causing oxygen deprivation, which can be fatal within only a few days. Long-term
exposures to nitrates and nitrites can cause diuresis, which is an increased starchy buildup
and hemorrhaging of the spleen (Environmental Protection Agency, 2006). For this
reason, the Environmental Protection Agency (EPA) implemented a primary drinking
water standard of 10 mg/L as NO3
- and 1 mg/L as NO
2
- in surface water and groundwater.

2
The main sources of nitrate, nitrite and ammonia contamination in surface and
groundwater come from anthropogenic sources. Fertilizers, fish canning waste,
refineries, tanneries, agricultural run-off, and domestic wastewater are a few examples,
and all can reach water environments and be detrimental to aquatic habitats, people and
animals (Sabumon, 2007). An example of the compounds’ negative effects is at the
mouth of the Mississippi River in the Northern Gulf of Mexico. Since the 1950’s and
60’s nutrient pollution that reached the Gulf of Mexico created an aquatic dead zone.
With an area of 8000 km2, the low dissolved oxygen concentrations caused a hypoxic
zone formation unable to sustain major aquatic life (LaPara and Ghosh, 2006). Drinking
water supplies are commonly contaminated with nitrogen compounds as well, and with
growing populations the contamination will only continue.
Many treatment technologies exist to treat biostimulants that are found in wastewater,
especially ammonia, nitrite, and nitrite. My study follows up an investigation of using a
membrane aerated biofilm reactor (MABR) to degrade nitrate and nitrite in a wastewater
media and convert it to nitrogen gas (Copeland, 2007).
Our study focused on the treatment of ammonia, nitrites and nitrates in a wastewater
media and nitrified wastewater with the same MABR as previously used, to investigate
the effectiveness of ammonia, nitrite, and nitrate removal. A minimal media was used to
establish bacterial growth on the silicone membranes in order for the biofilm to nitrify
ammonia used as the nitrogen source within the media. Initial concentrations ranged
from 5 to 50 mg/L NH4
+ as NH
4
+ to study the effectiveness of the inlet ammonia oxidation
within the reactor. After one complete ammonia oxidation, it was established that the
3
biofilm was capable of experiments with a local wastewater used to determine the
reactor’s ability to simultaneously degrade the ammonia, nitrite and nitrate compounds
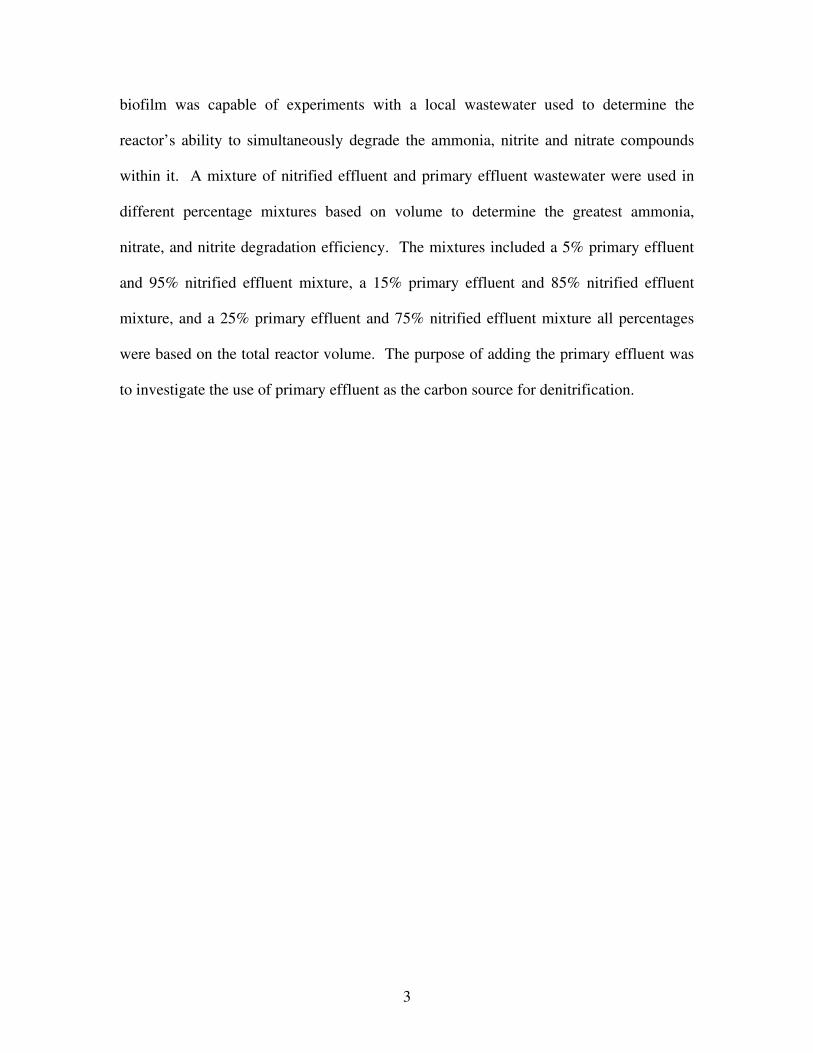
within it. A mixture of nitrified effluent and primary effluent wastewater were used in
different percentage mixtures based on volume to determine the greatest ammonia,
nitrate, and nitrite degradation efficiency. The mixtures included a 5% primary effluent
and 95% nitrified effluent mixture, a 15% primary effluent and 85% nitrified effluent
mixture, and a 25% primary effluent and 75% nitrified effluent mixture all percentages
were based on the total reactor volume. The purpose of adding the primary effluent was
to investigate the use of primary effluent as the carbon source for denitrification.
4
CHAPTER 2: BACKGROUND
2.1 Common Methods for Removal of Ammonia, Nitrates and Nitrites in
Wastewater
Due to the maximum contamination level of nitrogen concentrations in water
environments set by the EPA, wastewater treatment facilities are required to decrease
ammonia, nitrite, and nitrate concentrations in their effluent prior to discharge. Physical
and chemical methods of treatment include air stripping of ammonia, chemical oxidation
by breakpoint chlorination, ion exchange, and steam stripping of ammonia (Metcalf and
Eddy, 2003). The more prevalent treatment processes are biological, and they are an
integral part of modern treatment plant design. Common biological nitrogen removal
treatment technologies include an aerobic stage for nitrification and an anoxic stage for
denitrification. Nitrification is the process of oxidizing ammonia into nitrite and nitrate
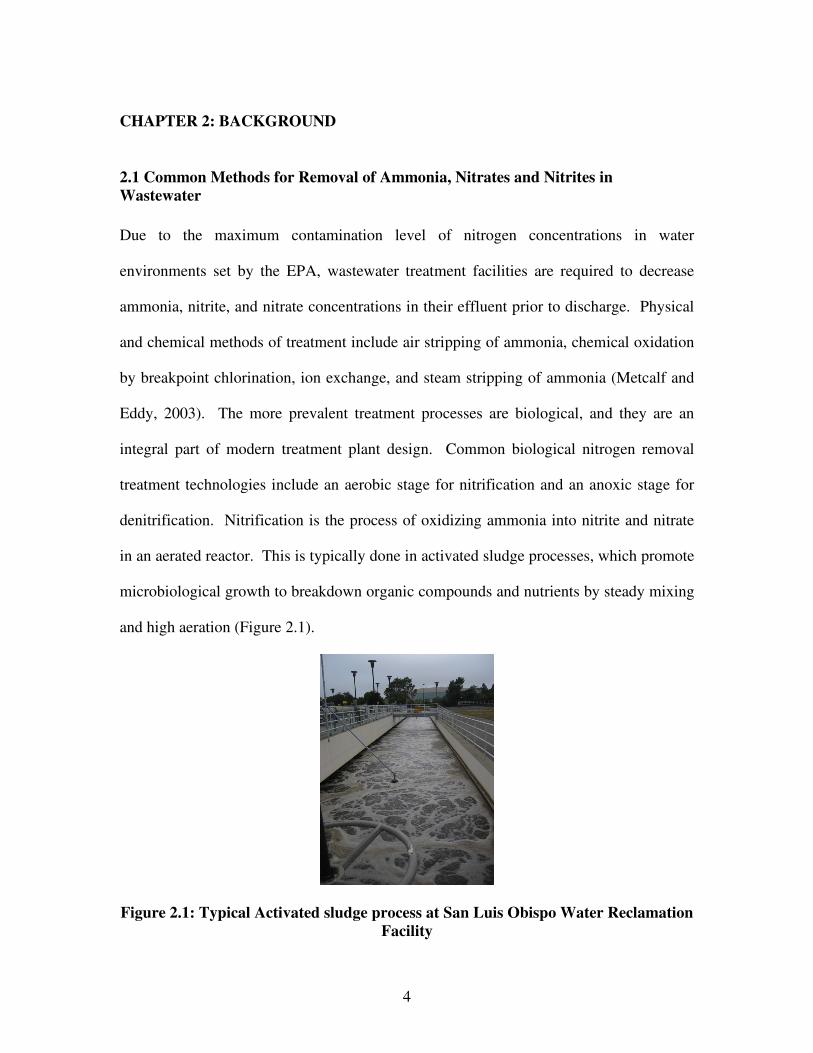
in an aerated reactor. This is typically done in activated sludge processes, which promote
microbiological growth to breakdown organic compounds and nutrients by steady mixing
and high aeration (Figure 2.1).
Figure 2.1: Typical Activated sludge process at San Luis Obispo Water Reclamation
Facility

5
In the aerated nitrification process, nitrifying bacteria have slow growth rates relative to
the growth rates of heterotrophic bacteria. The nitrifying bacteria are out-competed for
available oxygen, and as a result nitrification occurs at lower organic carbon
concentrations, and requires large hydraulic retention times (Satoh et al., 2004). The
anoxic zone following aeration than reduces nitrite and nitrate ions to the form of
nitrogen gas (Metcalf and Eddy, 2003). Using the Ludzak-Ettinger, Preanoxic nitrogen
removal process, the anoxic denitrification precedes the nitrification stage and the
bacteria present reduce the developed nitrate and nitrite ions into nitrogen gas (Figure
2.2). This sequence process was developed by Ludzak and Ettinger in 1962 (Metcalf and
Eddy, 2003). The nitrates formed in the aerobic zone return to the anoxic zone through
the returned activated sludge (RAS), entering the anoxic zone to be reduced. However,
this process is very limited since the RAS flow is the only source of nitrates to the anoxic
zone. This type of process is used most often with an increased RAS recycle rates to
prevent increased sludge quantities in the secondary clarifier caused by denitrification in
the aerobic zone (Metcalf and Eddy, 2003).
Figure 2.2: Ludzak-Ettinger Nitrogen Removal (Metcalf and Eddy, 2003)
Effluent Influent
Secondary
Clarifier
Aerobic Anoxic
Return Activated Sludge
Sludge

6
Another very common biological removal process is called the Modified Ludzak-Ettinger
process (Figure 2.3). In 1973 the Ludzak-Ettinger process was modified by Barnard to
improve the anoxic zone’s ability to denitrify the wastewater in the anoxic zone (Metcalf
and Eddy, 2003). The added internal recycle line provides higher nitrate concentrations
to enter the anoxic zone, which than increases the denitrification rate and overall nitrogen
removal. The process can have nitrate effluent concentrations ranging from 4 to 7 mg/L
as N, and can be very adaptable for existing activated sludge systems to meet EPA
effluent standards (Metcalf and Eddy, 2003).
Figure 2.3: Modified Ludzak-Ettinger Nitrogen Removal (Metcalf and Eddy, 2003) Opposite to the previous biological nitrogen removal process, another common system
uses a Postanoxic design (Figure 2.4). The Single-sludge, Postanoxic process was
developed by Wuhrmann in order to achieve nitrogen removal in an activated-sludge
system by placing an anoxic zone for denitrification prior to the aerobic nitrification
(Metcalf and Eddy, 2003). In order to maintain high denitrification rate efficiencies, the
hydraulic and sludge retention times within the anoxic tank need to be long since the
denitrification rate has a direct correlation with the endogenous respiration of the bacteria
and their slow growth rate (Metcalf and Eddy, 2003).
Effluent Influent
Secondary
Clarifier
Aerobic Anoxic
Return Activated Sludge
Sludge
Internal recycle

7
Figure 2.4: Single-sludge Nitrogen Removal (Metcalf and Eddy, 2003) Another biological nitrogen removal system uses both the Preanoxic and Postanoxic
treatment process. The Bardenpho process, invented by Barnard in 1974, (Figure 2.5)
was first developed and used for municipal wastewater treatment in South Africa during
the mid-1970s, before first being used in the United States in 1978 (Metcalf and Eddy,
2003). It consists of a four-stage process with two anoxic and two aerobic zones in
succession. The long hydraulic retention time and sludge retention time stays constant
through the Postanoxic and Preanoxic stages of the system, and the effluent nitrate
concentrations typically range from 5 to 7 mg/L as N, and can be as low as 3 mg/L nitrate
as N (Metcalf and Eddy, 2003).
Figure 2.5: Bardenpho Nitrogen Removal (Metcalf and Eddy, 2003)
Influent Effluent Anoxic Anoxic Aerobic
Secondary
Clarifier
Return Activated Sludge
Mix-liquor return
Aerobic
Sludge
Effluent Anoxic Aerobic
Secondary
Clarifier
Influent
Return Activated Sludge
Sludge

8
These multistage processes require a large footprint for treatment facilities, and take large
amounts of time to reach effluent compliance for nitrogen removal. The hydraulic
retention time of activated sludge processes and multi-stage aerobic and anoxic systems
range from a few hours to a couple days, and with the combination of nitrification and
denitrification, the process requires the latter (Metcalf and Eddy, 2003).
2.2 Simultaneous Biological Nitrification/Denitrification
In order to decrease the time it takes for total nitrogen removal of wastewater, many
investigations have been done to create simultaneous nitrification and denitrification in a
single reactor (Casey, 1998). Many investigations studied the growth and maintenance of
bacterial strains capable of oxidizing ammonia and reducing nitrates within a single-stage
bioreactor. Based on the stoichiometry for the two run experiment, both of the processes
require very separate conditions. Nitrification requires high levels of oxygen as seen
below:
3NH4
+ + 6O
2 • 3NO 3NO
3
- + 6H
+ + 3H
2O
Denitrification however requires anoxic or anaerobic conditions, where [H] equals
reducing equivalents which would be supplied by an external carbon source:
3NO3
- + 3H
+ + 15[H] • 1.5N 1.5N
2 + 9H
2O
In order to maintain both conditions, both need to be controlled and maintained (Schmidt
et al., 2003). These different chemical environments are able to keep only specific
bacteria capable of surviving in these conditions, and there are only a few known bacteria
strains that can use the conditions to their benefit (Schmidt et al., 2003).
2.2.1 Biological Characteristics

9
Simultaneous nitrification and denitrification requires both nitrifying and denitrifying
bacteria and the conditions to support them. The nitrifying bacteria are characterized as
autotrophic bacteria that derive energy from the oxidation of ammonia or nitrite.
However, there is a limited presence of bacterial genera capable of this. The most
common include Nitrosomonas and Nitrobacter. The Nitrosomonas are the best known
aerobic ammonia oxidizers, and the Nitrobacter genera oxidize nitrites to form nitrates
(Grunditz et al., 2001). The oxidized nitrogen compounds produced, can then be used as
alternative electron acceptors for the denitrifying bacteria capable of reducing the nitrates
formed. The Nitrosomonas and Nitrobacter bacteria are characterized as being
heterotrophic, and need a low carbonaceous oxygen demand for energy and carbon
supply in anoxic or anaerobic conditions to have growth capable of degrading ammonia
and nitrates (Sliekers et al., 2002; Schmidt et al., 2003). There are bacteria capable of
doing both though, and research has also been done by Shrestha et al. (2002) who studied
the bacteria strain Nitrosomonas europea and its effectiveness to both oxidize ammonia
and reduce nitrates to form nitrogen gas. The bacteria were grown lithoautotrophically in
a growth medium with the ammonium concentration of 360 mg/L as nitrogen. The
incubation time for the study was 52 hours, and results concluded the bacteria had
ammonia to nitrite conversion efficiencies of 47 and 37% respectively. The ammonia to
nitrogen gas conversion efficiencies ranged between 2.34 and 6.74% respectively
(Shrestha et al., 2002).
2.3 MABR Characteristics
10
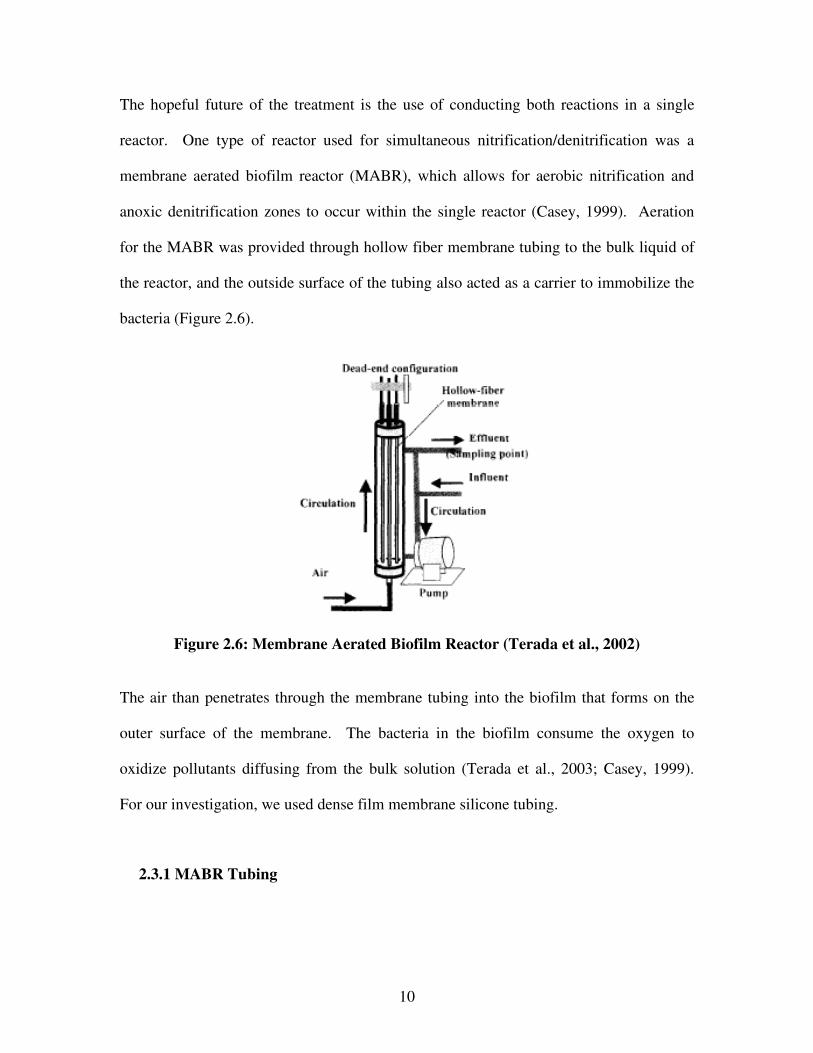
The hopeful future of the treatment is the use of conducting both reactions in a single
reactor. One type of reactor used for simultaneous nitrification/denitrification was a
membrane aerated biofilm reactor (MABR), which allows for aerobic nitrification and
anoxic denitrification zones to occur within the single reactor (Casey, 1999). Aeration
for the MABR was provided through hollow fiber membrane tubing to the bulk liquid of
the reactor, and the outside surface of the tubing also acted as a carrier to immobilize the
bacteria (Figure 2.6).
Figure 2.6: Membrane Aerated Biofilm Reactor (Terada et al., 2002)
The air than penetrates through the membrane tubing into the biofilm that forms on the
outer surface of the membrane. The bacteria in the biofilm consume the oxygen to
oxidize pollutants diffusing from the bulk solution (Terada et al., 2003; Casey, 1999).
For our investigation, we used dense film membrane silicone tubing.
2.3.1 MABR Tubing

11
Air transfer through the membrane tubing depends on the membrane classification. This
includes three types: microporous hydrophobic membranes such as polypropylene, dense
film membranes such as dimethylsiloxane (silicone), or composite membranes where a
porous membrane is coated with a thin film of dense material (Casey, 1999). The
microporous hydrophobic membrane mass transfer occurs by diffusion within the gas-
filled pores. A problem with this is the possibility of liquid penetrating into the pores,
which causes a large drop in the mass transfer coefficient. Another drawback is the low
bubble point of the membrane. This limits the maximum intramembrane pressure if
bubble formation wants to be avoided (Casey, 1999). Dense film membrane transport
mechanisms occur through solution diffusion, but the high permeability is due to the fact
that some compounds, oxygen especially, have solubility four of five times more soluble
in silicone than in water. Other benefits of using dense membranes include their ability
to withstand pressures up to 43.5 pounds per square inch (psi), and their high resistance
to chemicals and mechanical stress. Also, the high density membrane is also less likely
to have pore clogging and liquidity entry as does the microporous membranes (Casey,
1999). The composite membrane uses a 1 µm thick polymer coating on a microporous
membrane with pore sizes ranging between 0.04 and 1.0 µm. The advantage of having
microporous membranes and dense membranes allows for bubble-less aeration at
pressures up to 100 psi. This style of membrane has been used for high-rate nitrification
in both laboratory and pilot-scale studies (Casey, 1999). Other benefits of the membrane
system include the protection of the microorganisms against microbial loss by flushing,
shear stress, and inhibitory substances. The support matrix provided by the membrane
tubing helped maintain the biofilm and promoted greater flow rates through the reactor
systems (Franco-Rivera et al., 2007).

12
2.3.2 Biofilm and MABR Investigations
For conventional MABRs, a conventional biofilm’s active layer (oxic layer) ranges
typically between 50 and 200 µm thick. This thickness corresponds to the depth of
oxygen penetration into the biofilm, and if the overall biofilm thickness is larger than the
oxygen penetration from the membrane an anoxic zone develops within the boundary
layer between the bulk liquid of the reactor and the biofilm (Casey, 1999). An example
of this can be seen in Figure 2.7. The schematic illustrates the oxygen and ammonia
concentration profile through the biofilm grown on the membrane tubing. The oxygen
profile shows high oxygen concentrations within the pressurized tube (the lumen) and
within the membrane itself. As the air transfers through the biofilm the oxygen is
consumed. As the oxygen gradient decreases, the ammonia conversion conversely
changes with the higher oxygen concentration causing higher ammonia oxidation with
less being degraded as it gets closer to the bulk liquid in the reactor (Brindle et al., 1998).
Figure 2.7: Concentration profile schematic (Brindle et al., 1998)
With this dichotomy within the same reactor, the simultaneous nitrification and
denitrification can be a complimentary process. The nitrite and nitrate produced by the
nitrification can become and electron acceptor for denitrification. Also, nitrification

13
lowers pH that is than raised by denitrification, and the alkalinity generated by
denitrification is required for nitrification to occur (Terada et al., 2003). The spatial
distribution of both nitrifying and denitrifying organisms within a MABR biofilm allows
the nitrifying bacteria to predominate at the oxygen rich membrane side of the biofilm,
while the denitrifying organisms were located adjacent to the oxygen depleted biofilm-
liquid interface (Casey, 1999; Matsumoto et al., 2007). To maximize air transfer to the
active biofilm layer the ends of the membranes furthest from the air source are sealed to
ensure 100% air transfer efficiency. This configuration is known as dead-end
configuration (Brindle et al., 1998). In a MABR study using the dead-end configuration
for the removal of nitrogen in wastewater, Terada et al. (2003) found the nitrogen
removal efficiency through the research to be 83%. The bubble-less transfer through the
membrane walls directly to the biofilm suggested the aerobic zone in the biofilm was
fairly limited, while the anoxic and anaerobic zones were relatively wide.
Other Important aspects to the membrane tubing include the tubing surface area.
Removal rates for nitrification of ammonia are influenced by the membrane surface area
and the supplied air pressure. Ammonia removal rates per attached biomass decreased
with an increase in membrane surface area (Terada et al., 2006). Also, Gonzalez-
Brambila et al. (2006), and Terada et al. (2006) studied the MABR system for
simultaneous nitrification/denitrification, and concluded from their research that there
was a direct correlation between oxygen flux within a biofilm and the supplying gas
pressure to the membrane. This meant that the necessary air pressure must be provided to
establish sufficient growth on the biofilm (Gonzalez-Brambila et al., 2006; Terada et al.,
2006).

14
Another investigation for the simultaneous nitrification/denitrification within an MABR
system was conducted by Satoh et al. (2004). The MABR system contained polyurethane
hollow fiber membranes in a parallel sheet. The investigation consisted of using different
carbonaceous oxygen demand (COD) loading rates and adjusting the intra-membrane
pressures to examine where nitrification occurred in the biofilm using O2, NH
4
+, NO
2
-,
NO3
-, and pH microelectrodes. The investigation concluded that simultaneous COD
removal, nitrification and denitrification were achieved, with removal efficiencies being
90% and 95% respectively. The greatest efficiency occurred with low COD loading rates
around 1.0 g-COD/m2/day, and within the reactor denitrification occurred just above the
nitrification zones. Studies conducted on ammonia oxidizing bacteria by LaPara and
Ghosh (2006) researched the relationship between Nitrosomonas and Nitrospira bacteria
populations and the efficiency of nitrogenous pollutant removal in a full-scale municipal
wastewater treatment facility. During their study period, significantly higher bacterial
populations were detected when compared to the periods of lower reactor efficiency. The
Nitrosomonas and Nitrospira bacteria population had a direct correlation to the reactor
efficiency. Conditions within a reactor have a major affect on the growth of nitrifying
and denitrifying bacteria. Previous studies based on the simultaneous nitrification and
denitrification inhibitors have been conducted by Matsumoto et al. (2007), Grunditz et al.
(2001), Brindle et al. (1998), and Vadivelu et al. (2007). The major inhibitory factors
found from the studies included oxygen concentration, temperature, and pH within the
reactor.

15
Matsumoto et al. studied the effects of carbon/nitrogen ratio, biofilm thickness and
surface loading of oxygen to a biofilm using a simulation model to determine what
parameter has the largest effect on effluent quality for simultaneous
nitrification/denitrification. They concluded that the necessary oxygen to nitrogen ratio
by weight was 4.57 g-O2/g-N for complete nitrification, the oxygen concentration when
not high enough can become the limiting factor for nitrification when not supplied at a
necessary flow rate, and the maximum total-nitrogen removal through simultaneous
nitrification/denitrification occurred with a carbon/nitrogen ratio of 3.75.
Temperature and pH of the reactor media also plays an integral role in developing the
most beneficial environment for nitrifying bacteria (Grunditz et al., 2001). Grunditz et al.
(2001) conducted test tube experiments with isolated Nitrosomonas and Nitrobacter
bacteria, and wastewater samples were inoculated with the pure cultures to study the
effects of temperature and pH on the bacteria’s ability to nitrify the media with
ammonium concentrations of 50 mg/L as N. Grunditz et al. (2001) concluded that the
highest microbial activity for Nitrosomonas and Nitrobacter occurred at 35 and 38
degrees Centigrade. For pH the most activity occurred at pH 8.1 for Nitrosomonas, and
7.9 for Nitrobacter. However, pH and temperature are not the only inhibitors for the
nitrification and denitrification processes. The studies conducted by Brindle et al. (1998)
concluded that nitrification can be inhibited by the presence of organic matter and
suspended solids within a media, but their studies found simultaneous
nitrification/denitrification effectively removed approximately 94% ammonia as N. The
research done by Vadivelu et al. (2006) concluded that Nitrobacter bacteria showed
significant inhibitory effects in the presence of free ammonia. The inhibitory effects

16
were clearly seen at concentrations below 1.0 mg/L of ammonia as N, but inhibitory
effects leveled off at concentrations ranging 4.0 to 9.0 mg/L of ammonia as N. This is of
significant concern when trying to simultaneously nitrify ammonia and denitrify the
nitrate compounds present together in a single reactor.
2.2.4 Previous Research with Current MABR
The MABR used for this current research had previously been used to compare
denitrification rates of nitrate when compared to an aerobic reactor and an anoxic reactor
(Copeland, 2007). The aerobic reactor contained an air sparge system, and the anoxic
reactor had no aeration. Aeration occurred within the MABR system by pressurizing
silicone tubing and allowing air to permeate through the silicone tubes. Experiments
conducted included three batch experiments and two continuous flow experiments. The
batch experiments used three media with nitrate concentrations of 50 mg/L, 100 mg/L
and 20 mg/L respectively. The continuous flow experiments included the use of two
media with nitrate concentrations of 50 mg/L and 20 mg/L respectively.
The results concluded that the batch experiments conducted in the aerated reactor had
little or no denitrification, while the anoxic and MABR showed steady denitrification.
The MABR denitrification rate constants followed first-order kinetics, with rate constants
ranging between 0.03 and 0.11 hr-1. The denitrification rate within the anoxic reactor
resembled zero-order kinetics, and the rate constants ranged between 0.06 and 0.64
mg/L-hr. The continuous flow results concluded that their short run times and retention
times resulted in low removal rates, and nitrite production was depleted before exit from
the MABR and the anoxic reactor.

17

18
CHAPTER 3: MATERIALS AND METHODS
3.1 Membrane Aerated Biofilm Reactor Setup
The MABR systems were made from 41-inch tall, 6-inch diameter, schedule-40
polyvinyl-chloride (PVC) tubing, sealed at either end with 6-inch diameter, schedule-40
PVC caps. The three sampling ports were 0.5-inch diameter PVC ball valves, and the
open ends of the ball valves were connected with silicone septum caps. The total
volume of each MABR was 19-liters (Figure 3.1).
Figure 3.1: Three Membrane Aerated Biofilm Reactor Set-ups The silicone tubing aerators were assembled from five Masterflex
®, 0.25-inch (6.35-mm)
diameter, 43-inch (1.1-m) long silicone tubes, with membrane wall thickness of 0.0625-
inches (1.59-mm). The dead-end configuration was established by inserting 1-inch glass
rods in the ends of the tubing to seal the bottom ends. Each silicone membrane had a
surface area of 33.8 square inches, and each reactor had a total membrane surface area of
169 square inches. The membrane tubing was placed in a vertical configuration centrally
distributed within the MABR (Figure 3.2). Air entered the tubing at the top of the reactor

19
sourced from a wall-mounted compressed air distribution line. The supplied air allowed
the aerobic bacteria to grow along the silicone tubing (Figure 3.3). The air pressure was
controlled by a general-purpose compressed gas regulator.
Figure 3.2: MABR Top Schematic View
Figure 3.3: Biofilm Growing on Silicone Tubing during the Experiment The single air line was than distributed to the five silicone tubing membranes at the top of
the reactor. The liquid within the MABR was fed from a feed storage tank and pumped
using a Masterflex® peristaltic pump, and the inlet flow was controlled by a Masterflex
®
Bulk Liquid
Tubing Wall

20
Controller/Distributor flow meter. The reactor liquid was fed through the bottom of the
MABR, and the effluent exited the reactor through three converging effluent tubes
located at the top of the reactor. The effluent was then released to the sink adjacent to the
MABR. All of the air and feed liquid distribution was connected with 0.375-inch and
0.5-inch PVC
and vinyl
tubing, and any
necessary PVC connectors (Figure 3.4).
Feed Storage Pump Air Pump
Pressure Gauge
Peristaltic Pump
Flow Meter
Reactor Effluent
Sample Port R1A
Sample Port R1B
Sample Port R1C

21
Figure 3.4: MABR Schematic The initial liquid storage tank used was a 50-gallon PVC drum with a 1-inch diameter
ball valve near the bottom to release the feed liquid, and sealed at the top with a 0.2-µm
air filter. The feed tank connected to the peristaltic pump and the MABR using 0.25-inch
Cole-Parmer Tygon® vinyl tubing. The 50-gallon feed tank was used for the first three
experiments, but microbial growth within the feed storage tank led to it being replaced
with a different container. The replacement tank was a 5-gallon polycarbonate bottle,
sealed with a large rubber stopper and a 0.2-µm air filter. The feed line reached the
bottom of the storage bottle using 0.25-inch copper tubing and connected to the peristaltic
pump using 0.25-inch PVC tubing (Figure 3.5). The pH within the replacement tanks
was maintained at a neutral pH to avoid Cu leaching.
Figure 3.5: Reactor Set-up with Initial Feed Tank (Left) and Replacement Feed
Tank (Right)

22
3.2 Experiment Types
The MABR experiments were conducted in both batch and continuous modes, and the
reaction times ranged from about 8 to 20 days for the batch modes and 5 to 17 days for
the continuous modes respectively. The nomenclature for both experiments is as follows
(Table 3.1Error! Reference source not found.).
Table 3.1: Experiment Nomenclature
Batch
Experiment
Continuous
Minimal Media
Experiment
Continuous
Wastewater
Experiment
B1 C1 CW1
B2 C2 CW2
B3 C3 CW3
B4 C4 CW4
C5 CW5
C6
3.2.1 Batch Experiments
The batch run experiments were conducted during the months of February, March, and
April 2008. The purpose of the batch run experiment was to develop microbial growth
along the silicone tubing within the MABR, and also determine reaction times for the
nitrification of ammonia within the minimal media. The minimal media concentrations
for ammonia differed between 50 mg/L and 5 mg/L as NH4
+, and reaction times varied for
each reaction (Table 3.2Error! Reference source not found.). For comparison of
reaction times to the MABR batch reaction, an anoxic reactor with no aeration was used
and analyzed to determine the effectiveness of the MABR system. The anoxic reactor
was used for the 10 mg/L, 25 mg/L and 5 mg/L as NH4
+ concentrations run experiment.
Table 3.2: Batch Experiment Specifications
Experiment Total Run
Hours
Ammonia
Concentration
as NH4
+ (mg/L)
B1 192 50

23
B2 172 10
B3 476 25
B4 160.5 5
For each batch reaction the minimal media was mixed based on the media specifications
for each individual run. The media was measured to meet targeted ammonia
concentrations based on the 19-liter volume of the MABR, and was mixed in 5-gallon
polycarbonate bottles with DI water to meet the correct volume. The media was then
covered and mixed for 20 minutes using a magnetic stirrer and stir bar. For the anoxic
reactor analysis, the media was replicated for simultaneous comparisons. After mixing,
the media was pumped into the MABR, and initial samples were taken for analysis. The
wall mounted air pressure gauge connected to the air supply was set at a constant
pressure of 15-psi. This air pressure was used due to the occurrence of leaks within the
air feed lines at higher gauge pressures. The MABR was than inoculated with 25-mL of
returned activated sludge (RAS) from the Reclamation Facility. The MABR was than
sampled daily and analyses were conducted for ammonia, nitrate, nitrite, and DO
concentrations for each run from start to finish.
3.2.2 Continuous Experiments
The continuous run experiments were conducted from the months of April, 2008 through
August, 2008. The continuous experiments used minimal media and also wastewater
from the Reclamation Facility in separate experiments based on the varied mixtures of
the wastewater (Table 3.3Error! Reference source not found.). The minimal media
ammonia concentrations varied between 5 mg/L and 25 mg/L as NH4
+, and the
wastewater received from the Reclamation Facility had varying ammonia concentrations
due to daily natural fluctuations. The continuous run experiments were studied to

24
replicate real-life use for the MABR, and the reaction run-times were determined by
media availability and attempts to reach steady-state conditions within the MABR. The
reaction run-times varied between 43.5 and 384 hours.

25
Table 3.3: Continuous Experiments Specifications
Experiment Total Run
Hours Media Type
Inlet Ammonia
Concentration as
NH4
+ (mg/L)
C1 72 Minimal media 5
C2 66 Minimal media 10
C3 73 Minimal media 25
C4 101 Minimal media 10
C5 167 Minimal media 5
C6 43.5 Minimal media 10
CW1 101.5 Secondary Effluent
Wastewater Variable
CW2 142 100% Nitrified Effluent Variable
CW3 154 5% Primary, 95%
Nitrified Effluent Mixture Variable
CW4 164 25% Primary, 75%
Nitrified Effluent Mixture Variable
CW5 384 15% Primary, 85%
Nitrified Effluent Mixture Variable
During the initial, minimal media, continuous run experiments a 50-gallon PVC drum
was used for storing inlet media. In some cases, 5-gallon polycarbonate bottles were
used. The 50-gallon PVC drum was used for experiments C1, C2, C3, and C4. These
first four tests were conducted by first creating a minimal media and DI mixture to meet
the required ammonia concentration for the test. The large volume allowed for a multi-
day run to attempt to reach steady state within the MABR. However, the media remained
in the drum for a long period of time for each experiment and biological growth was
detected and influent concentrations of ammonia declined during the progression of the
experiment. The tank growth was remedied by the use of 5-gallon polycarbonate bottles
for the remaining experiments. The minimal media for the 5-gallon bottles was mixed
daily to maintain new media feeding into the MABR, in an attempt to keep a constant
ammonia inlet concentration and lessen the chance of microbial growth within the feed
storage. Two 5-gallon bottles were used in order for the bottles to be cleaned between
26
uses. The contents of the inlet feed were analyzed daily for nitrate, nitrite, and ammonia
respectively.
The MABR tests using Reclamation Facility wastewater were conducted in the same
manner as the 5-gallon bottle runs using the minimal media. The wastewater was
collected from the Reclamation Facility daily by taking grab samples from the primary
clarifier effluent and final clarifier nitrified effluent and stored in Nalgene® 5-gallon and
2.5-gallon bottles for transport. The amount of wastewater collected depended on
necessary volumes needed for each individual run. The primary and nitrified effluents
were then mixed in the 5-gallon feed storage bottles to obtain required nitrate
concentrations and replaced daily to maintain inlet wastewater for the MABR. Sampling
and analysis were conducted daily.
3.3 Reactor Media
The media used for each reaction was a minimal growth media. The initial compounds
within the media included glucose, monopotassium phosphate (KH2PO
4), ferrous sulfate
(FeSO4), calcium sulfate (CaSO
4), thiamine, yeast extract, and ammonium sulfate
((NH4)
2SO
4) used as the nitrogen and ammonia source. However, the concentrations of
these compounds varied based on different experiments. The concentrations in the
various experiments are listed below. Some compounds were eliminated and replaced
due to reactor complications. These will be explained in Results and Discussions,
Chapter 4. When changes were made, the replacement compounds included calcium
chloride (CaCl2), and ammonium chloride (NH
4Cl). Also the use of thiamine was
eliminated within our media due to the trace nitrate concentrations within the substance
in order eliminate false nitrate concentration readings within the reactor.
27
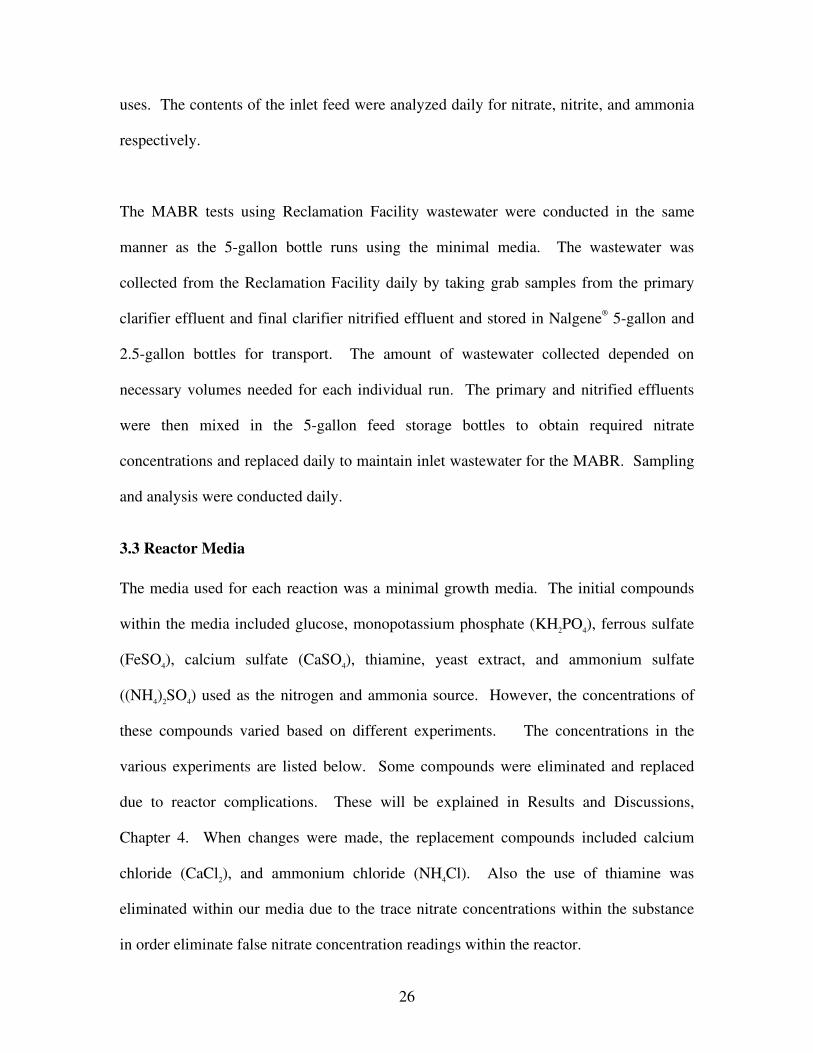
3.3.1 Initial 50 mg/L NH4+ as NH4
+minimal growth media
For the first experiment conducted, a minimal media with an ammonium concentration of
50 mg/L was used. The remaining constituents used in the media are shown in Table 3.4.
Table 3.4: Initial 50 mg/L NH4
+ minimal growth media
Compound Mass (g)
Glucose 0.500
KH2PO4 0.100
FeSO4 0.050
CaSO4 0.052
Thiamine 0.079
Yeast Extract 0.079
(NH4)2SO4 0.183
This media was used for experiment B1 that took place between February 18, 2008 and
February 26, 2008. However, after conducting this experiment, odor issues and potential
sulfide toxicity became a concern, and the media changed in order to remedy the
concerns.
3.3.2 10 mg/L NH4+ minimal growth media
This media differed from the initial 50 ppm media due to the use of NH
4Cl, as the
ammonium source, and CaCl2. The mass of the CaCl
2 remained the same, and the NH
4Cl
was adjusted accordingly based on the desired ammonia concentration for the experiment
(Table 3.5). The new minimal media was used for experiment B2 that took place
between March 1, 2008 and March 8, 2008.

28
Table 3.5: 10 mg/L NH4
+ minimal growth media
Compound Mass (g)
Glucose 0.500
KH2PO4 0.100
FeSO4 0.050
CaCl2 0.052
Thiamine 0.079
Yeast Extract 0.079
NH4Cl 0.030
The reason for altering the initial minimal media was due to odor issues within the
reactor caused by anaerobic conditions and high amounts of sulfur compounds used in
the media. Also, the opportunity for sulfide toxicity to the microorganisms within the
reactor became a concern. I still desired sulfur to in the media, but a lower concentration
seemed much more beneficial to the desired experiment.
For later experiments, we used a limited nutrient minimal media by lessening the media
constituents and halving the glucose concentration (Table 3.6). This 10 mg/L ammonium
media was used for the continuous experiment C2 between April 23, 2008 and April 26,
2008; experiment C3 between April 27, 2008 and May 1, 2008; experiment C5 between
May 6, 2008 and May 10, 2008; and experiment C8 between June 30, 2008 and July 2,
2008.
Table 3.6: 10 mg/L NH4
+ minimal growth media using limited nutrients
Compound Mass (g)
Glucose 0.25
KH2PO4 0.026
FeSO4 0.026
CaCl2 0.026
Yeast Extract 0.0053
NH4Cl 0.03

29
The use of thiamine was also eliminated due to trace concentrations of nitrate found in
the substance, and might have caused false positives of the nitrate within the MABR.
However, this media was not used until the April 1, 2008 experiments.
3.3.3 25 mg/L NH4+ minimal growth media
The 25 mg/L ammonia media was used for experiment B3, which was conducted
between March 8, 2008 and March 28, 2008 (Table 3.7)
Table 3.7: 25 mg/L NH4
+ minimal growth media
Compound Mass (g)
Glucose 0.250 KH2PO4 0.100
FeSO4 0.050
CaCl2 0.052
Thiamine 0.079
Yeast Extract 0.079
NH4Cl 0.151
The 25 mg/L minimal growth media was used for both the MABR reactor and the anoxic
reactor.
The other reaction that occurred using a 25 mg/L ammonia media was experiment C4
conducted between May 1, 2008 and May 4, 2008 (Table 3.8) using the limited nutrient
concentration minimal media.
Table 3.8: 25 mg/L NH4
+ minimal growth media using limited nutrients
Compound Concentration
(mg/L)
Glucose 0.250
KH2PO4 0.026
FeSO4 0.026
CaCl2 0.026
Yeast Extract 0.0053
NH4Cl 0.151

30
3.3.4 5 mg/L NH4+ minimal growth media
The 5 ppm ammonia limited nutrient media was used for all experiments at this
concentration (Table 3.9), including the MABR batch and anoxic experiment B4 for the
dates of April 1, 2008 to April 8, 2008. The run experiment that also used this media
were experiment C1 between April 16, 2008 and April 19, 2008; and experiment C6
between June 4, 2008 to June 11, 2008.
Table 3.9: 5 mg/L NH4
+ minimal growth media using limited nutrients
Compound Concentration
(mg/L)
Glucose 0.250
KH2PO4 0.026
FeSO4 0.026
CaCl2 0.026
Yeast Extract 0.0053
NH4Cl 0.015
3.4 Local Municipal Wastewater
Wastewater from the City of San Luis Obispo (California) Water Reclamation Facility
was used to test the MABR’s effectiveness at nitrification and denitrification of
municipal wastewater. The San Luis Obispo Water Reclamation Facility (Reclamation
Facility) treats an average daily load of 4.5 million gallons of wastewater to tertiary
treatment levels. For this investigation, three locations within the Reclamation Facility’s
treatment process were chosen to study the MABR’s ability to nitrify and denitrify the
wastewater. Three wastewater types were secondary effluent, nitrified effluent, and a
mixture of nitrified and primary effluent. Grab samples were taken daily at each location
and stored in 5-gallon and 2.5-gallon Nalgene® water containers for transport, which were
then transferred to the 5-gallon storage bottles which fed the reactor. Analytical data
from the Water Reclamation Facility Laboratory was used to calculate BOD, ammonia,
nitrate, and nitrite concentrations of the wastewater media being used for the MABR
31
experiments. Ammonia concentrations were determined by the Laboratory using the
Ammonia-Selective Electrode Method number 4500, nitrate and nitrite concentrations
were determined by HACH methods 8153 and 8039, and BOD concentrations were
determined using a BOD correlation to total suspended solids (TSS) determined in the
Reclamation Facility lab. The TSS value was multiplied by a factor of 1.2 to find the
BOD concentration.
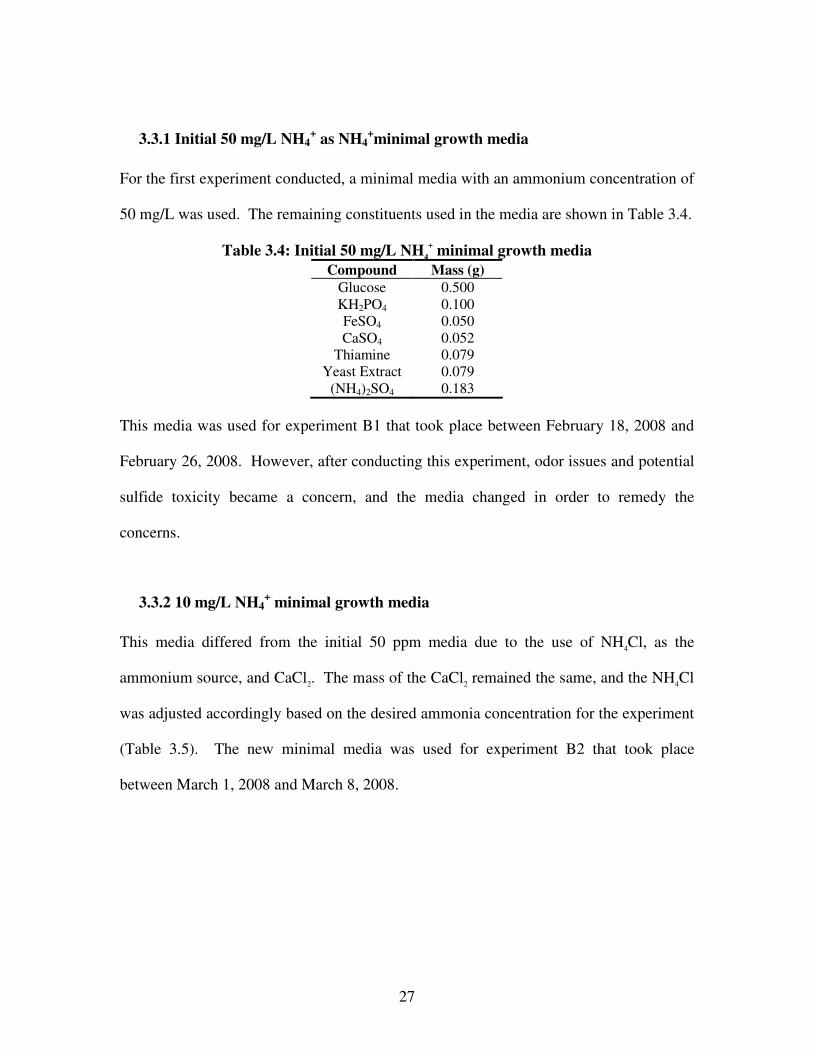
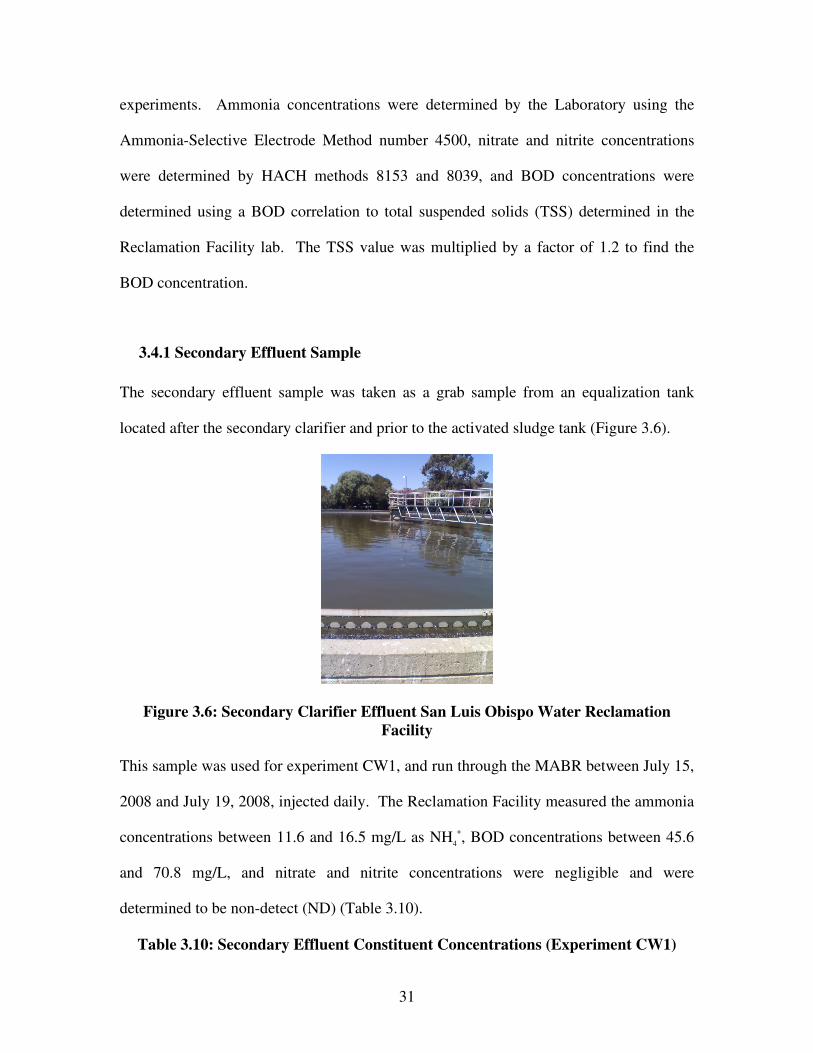
3.4.1 Secondary Effluent Sample
The secondary effluent sample was taken as a grab sample from an equalization tank
located after the secondary clarifier and prior to the activated sludge tank (Figure 3.6).
Figure 3.6: Secondary Clarifier Effluent San Luis Obispo Water Reclamation
Facility This sample was used for experiment CW1, and run through the MABR between July 15,
2008 and July 19, 2008, injected daily. The Reclamation Facility measured the ammonia
concentrations between 11.6 and 16.5 mg/L as NH4
+, BOD concentrations between 45.6
and 70.8 mg/L, and nitrate and nitrite concentrations were negligible and were
determined to be non-detect (ND) (Table 3.10).
Table 3.10: Secondary Effluent Constituent Concentrations (Experiment CW1)
32
Day Ammonia as
NH4
+ (mg/L)
Nitrate as
NO3
- (mg/L)
Nitrite as
NO2
- (mg/L)
BOD (mg/L)
1 12.4 ND ND 70.8 2 13.6 ND ND 61.2 3 16.5 ND ND 48.0 4 11.6 ND ND 49.2 5 11.9 ND ND 45.6
Average 13.2 ND ND 55.0
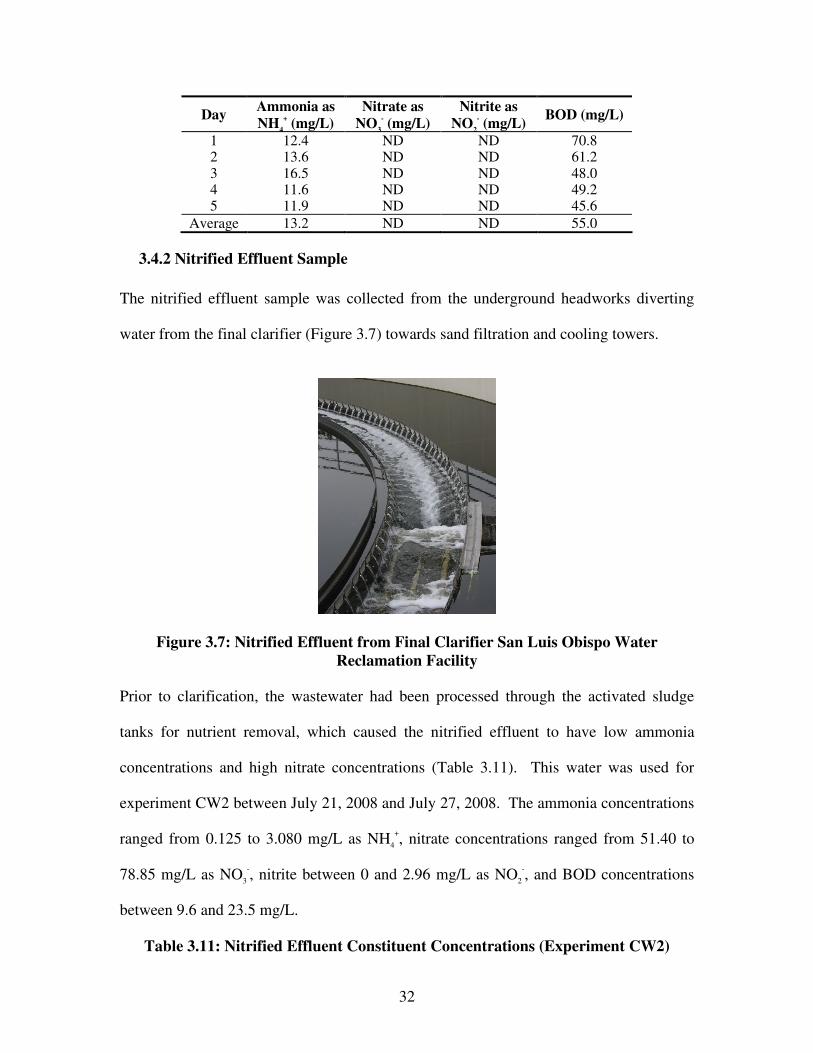
3.4.2 Nitrified Effluent Sample
The nitrified effluent sample was collected from the underground headworks diverting
water from the final clarifier (Figure 3.7) towards sand filtration and cooling towers.
Figure 3.7: Nitrified Effluent from Final Clarifier San Luis Obispo Water
Reclamation Facility Prior to clarification, the wastewater had been processed through the activated sludge
tanks for nutrient removal, which caused the nitrified effluent to have low ammonia
concentrations and high nitrate concentrations (Table 3.11). This water was used for
experiment CW2 between July 21, 2008 and July 27, 2008. The ammonia concentrations
ranged from 0.125 to 3.080 mg/L as NH4
+, nitrate concentrations ranged from 51.40 to
78.85 mg/L as NO3
-, nitrite between 0 and 2.96 mg/L as NO
2
-, and BOD concentrations
between 9.6 and 23.5 mg/L.
Table 3.11: Nitrified Effluent Constituent Concentrations (Experiment CW2)

33
Day Ammonia as
NH4
+ (mg/L)
Nitrate as
NO3
- (mg/L)
Nitrite as
NO2
- (mg/L)
BOD
(mg/L)
1 0.159 73.98 0.99 12.5
2 0.125 77.08 0.99 13.9
3 0.180 51.40 0 12.0
4 0.827 75.31 0 23.5
5 3.080 65.56 0 17.3
6 0.480 78.85 0.99 21.6
7 0.277 75.75 2.96 9.6
Average 0.733 71.13 0.85 15.8
3.4.3 Nitrified and Primary Effluent Mixtures
For the next set of experiments, the effluent from the primary clarifiers was combined
with the nitrified effluent from the final clarifiers. The purpose of the combining of the
two streams was to use the primary effluents as the external carbon source to promote
heterotrophic nitrification. The primary effluent experiments consisted of 5%, 15%, and
25% by volume primary wastewater mixtures, with the nitrified effluent percentages
being 95%, 85%, and 75% by volume mixtures, respectively. Primary effluent samples
collected were grab samples taken from the primary clarifier effluent prior to entering the
headworks and pump station directing the wastewater to the trickling filters for secondary
treatment at the Reclamation Facility (Figure 3.8).

34
Figure 3.8: Primary Effluent from Primary Clarifier of San Luis Obispo Water
Reclamation Facility The primary effluent concentrations of BOD and ammonia were much higher when
compared to the nitrified effluent, which offered higher concentrations of BOD and
ammonia for the MABR influent. The primary and nitrified effluent mixtures were used
during the end of July and the entire month of August tests (Table 3.12).

35
Table 3.12: Primary Effluent Constituent Concentrations
Day Ammonia as
NH4
+ (mg/L)
BOD (mg/L)
1 28.6 46.8
2 38.2 48.0
3 38.5 60.0
4 32.1 74.4
5 37.6 37.2
6 31.5 36.0
7 33.4 32.4
8 30.5 38.4
9 33.8 68.4
10 40.3 86.4
11 24.7 64.8
12 34.7 49.2
13 37.8 37.2
14 41.2 34.8
15 28.4 85.2
16 29.7 32.4
17 48.1 32.4
18 36.2 66.0
19 32.7 72.0
20 30.6 63.6
21 38.8 85.2
22 27.2 62.4
23 32.5 32.4
24 41.3 32.4
25 39.5 56.4
26 43.0 54.0
27 36.4 44.4
28 32.4 49.2
29 39.1 40.8
30 52.0 42.0
31 29.7 45.6
The 5% primary, 95% nitrified effluent mixture was used for experiment CW3 in a seven
day test between July 29, 2008 and August 4, 2008. The ammonia concentrations for the
mixture during the test period ranged from 1.68 and 2.33 mg/L as NH4
+, the nitrate
concentrations ranged from 13.60 and 18.60 mg/L as NO3
-, nitrite concentrations ranged
from 0.00 and 0.90 mg/L as NO2
-, and BOD ranged between 10.56 and 16.54 mg/L
(Table 3.13).

36
Table 3.13: 5% Primary, 95% Nitrified Effluent Mixture Constituents
Concentrations (Experiment CW3)
Day Ammonia as
NH4
+ (mg/L)
Nitrate as
NO3
- (mg/L)
Nitrite as
NO2
- (mg/L)
BOD
(mg/L)
1 1.68 16.80 0.30 16.48
2 2.33 14.90 0.90 16.54
3 2.20 16.80 0.90 10.75
4 1.78 16.10 0.90 10.56
5 2.09 18.30 0.60 15.08
6 1.76 13.60 0.00 12.74
7 1.85 18.60 0.30 13.93
Average 1.96 16.44 0.56 13.73
The 25% primary, 75% nitrified effluent mixture was used for experiment CW4 which
was an eight day analysis period between August 4, 2008 and August 12, 2008. The
ammonia concentrations for this testing period ranged from 9.44 to 10.36 mg/L as NH4
+,
the nitrate concentrations ranged from 15.90 to 18.60 gm/L as NO3
-, nitrite concentrations
ranged between 0.00 and 0.30 mg/L as NO3
-, and BOD concentrations ranged between
17.8 and 72.96 mg/L (Table 3.14).
Table 3.14: 25% Primary, 75% Nitrified Effluent Mixture Constituents
Concentrations (Experiment CW4)
Day Ammonia as
NH4
+ (mg/L)
Nitrate as
NO3
- (mg/L)
Nitrite as
NO2
- (mg/L)
BOD
(mg/L)
7 10.19 18.60 0.30 17.8
8 9.44 15.90 0.00 72.96
9 10.36 16.00 0.30 36.18
10 10.2 14.90 0.00 36.36
11 6.26 15.00 0.30 28.8
12 8.75 16.20 0.30 22.38
13 9.51 18.80 0.90 20.1
14 12.14 14.20 0.30 19.14
Average 9.61 16.2 0.30 31.72
The 15% primary, 85% nitrified effluent mixture was used for experiment CW5 to
conduct an extended reaction period. The reaction ranged from August 15, 2008 to
August 31, 2008. Based on the lab analysis conducted by the Reclamation Facility, the
ammonia concentrations ranged between 4.37 and 8.33 mg/L as NH4
+, nitrate

37
concentrations ranged from 16.0 to 26.6 mg/L as NO3
-, nitrite concentrations ranged from
0.00 to 1.20 mg/L as NO2
-, and BOD concentrations ranged between 11.39 and 23.39
mg/L (Table 3.15).
Table 3.15: 15% Primary, 85% Nitrified Effluent Mixture Constituents
Concentrations (Experiment CW5)
Date Ammonia as
NH4
+ (mg/L)
Nitrate as
NO3
- (mg/L)
Nitrite as
NO2
- (mg/L)
BOD
(mg/L)
15 8.33 23.60 0.90 23.39
16 6.46 20.80 0.60 15.88
17 7.47 17.60 0.30 13.43
18 5.47 19.50 0.00 17.65
19 4.94 21.80 1.20 21.82
20 4.63 22.00 0.00 20.96
21 6.16 26.60 0.90 20.94
22 4.37 16.20 0.60 17.52
23 4.92 23.90 0.00 11.39
24 6.23 18.80 0.90 14.24
25 6.71 16.00 0.00 18.25
26 6.49 19.60 0.30 15.44
27 5.49 12.70 0.00 13.19
28 4.89 18.60 0.00 17.58
29 5.90 21.10 0.60 15.10
30 7.82 23.70 0.60 16.91
31 4.49 21.80 0.00 18.67
Average 5.93 17.58 0.37 17.20
3.5 Media Sampling and Analysis
Ammonia, nitrate and nitrite were analyzed daily during both the batch experiments and
continuous experiments. Also, dissolved oxygen (DO) concentrations, and volumetric
flow rate were calculated.
Sample extraction from the reactor was done using 60-mL PVC syringes and plungers,
with 6-inch and 12-inch steel hypodermic needles. The syringe and hypodermic needles
were injected through the silicone septum of each sample port along the MABR, and
approximately 35-mL of liquid was extracted for analysis. The sample collection from

38
inlet media and wastewater was collected by grab samples from the 5-gallon storage
bottles using similar syringes and plungers. After extraction from the sample ports, the
samples were placed into a 40-mL glass beaker, and pH and temperature were analyzed
using an OAKTON, Acorn Series pH and temperature probe. The samples were then
filtered using 0.45-µm Fisher glass fiber filters prior to any further analysis, and also 0.2-
µm Fisher membrane filters for nitrate and nitrite analysis. The purpose of the 0.45-µm
filtering of all samples was to eliminate suspended solids or biomass that would interfere
with spectrophotometric analysis. The samples were then separated into sealed glass
vials for ammonia, nitrate and nitrite analyses. The DO concentrations were measured
using a SensIon 6 DO meter, and flow rate was determined by timing the filling of a
graduated cylinder with 100-mL reactor effluent.
3.5.1 Ammonia Analysis
Two methods were used for ammonia analysis. The initial method was based on the
Standard Method 4500-NH3 F, Ammonia-Selective Electrode Method (APHA, 1992).
This method uses a hydrophobic gas-permeable membrane to separate the sample
solution from an electrode internal solution of ammonium chloride, and the dissolved
ammonia in the analyzed samples was converted to aqueous ammonia by raising the pH
to above 11 with a strong base. The internal pH within the electrode changes when it
contacts the solution, and the electrode tracks these changes (APHA, 1992). The
selective ammonia probe used was an Orion 9512 Ammonia Probe, and the pH adjusting
solution was an Ammonia pH electrode, Ionic Strength Adjusting (ISA) solution. 2-mL
of the ISA solution was added per 100-mL of sample, and additional ISA solution could
have been added until the correct pH for ammonia measurement was reached. The
39
electrode readings were in millivolts, and in order to determine the corresponding
concentrations a 3 to 5-point calibration curve was made for each analysis using known
ammonia concentrations. Ammonia concentrations as ammonia for the calibration curve
included 1, 5, 10, 50 and 100-mg/L. The three concentrations used for calibration were
determined based on expected ammonia concentrations for each analysis.
The ammonia-selective electrode method was used throughout the batch run experiments
and a few of the continuous run experiments. However, due to its eventual malfunction,
the HACH Method 8155: Salicylate Method was used for the remaining continuous run
experiment to calculate the ammonia concentrations. The HACH method used Ammonia
Salicylate Reagent Powder Pillows and Ammonia Cyanurate Powder Pillows added to a
mixture of 4.5-mL of DI water and 0.5-mL of 0.45-µm filtered MABR samples. After
addition of the Powder Pillows, the sample mixture was allowed to react for 20 minutes
to produce a green color. The sample was than analyzed for absorbance in a Hitachi: U-
3010 Spectrophotometer at a 655-nm wavelength. The concentration was determined by
making a three-point calibration curve of known ammonia concentrations with the 0.5-
mL sample and 4.5-mL DI samples. For low-anticipated ammonia concentrations a
concentrated solution calibration curve was made by making a 3 to 5-point calibration
curve using 5-mL of known ammonia concentration samples and no DI dilution.
3.5.2 Nitrate Analysis
The nitrate analysis was conducted using two different methods for redundancy
comparison. The first nitrate analysis technique used ion chromatography. Ion
chromatography uses ion exchange of compounds bound to a solid surface being replaced
by compounds in solution being analyzed, and the concentration of the compounds in the

40
samples are than determined based on their corresponding conductivity readings. The
analyzed samples were initially filtered using 0.22-µm Millipore Membrane filters and
60-mL HDPE syringes and plungers. The filtered samples were then placed in 5-mL
Dionex Polyvials and sealed with 0.2-µm Dionex plain filter caps. If the samples could
not be analyzed the same day of filtering and storage in the Polyvials, the samples were
stored in a freezer with temperatures below 4 ºC. For analysis, the samples were injected
individually into an eluent, electrolyte solution stream and passed through an ion
exchange separator column within a Dionex: DX-120 Ion Chromatograph with internal
pressure maintained between 2000 and 2300 psi. The eluent was an AS22 Eluent
Concentrate with a 4.5-mM sodium carbonate and a 1.4-mM sodium bicarbonate
concentration after the required 100X dilution, and was pressurized to a constant pressure
of 60 psi with a constant flow rate of 1.20-mL/min. Prior to connection to the ion
chromatograph, the eluent was degassed using Ultra High Purity helium for 20-minutes.
Within the Ion Chromatograph, the ions were than separated based on their affinities for
an ion exchange resin contained in the separator column, which was a Dionex RFIC
IonPac® AS22 4x250-mm separation column. The eluent and sample mixture was then
passed through a suppressor that eliminated the background conductivity of the eluent, so
the conductivity that remained was based on the ions found in the sample. After passing
through the suppressor, the solution reached a conductivity cell and electrical
conductivity was measured using Dionex Chromeleon software. The separate ions
conductivities and concentrations were based on the retention times through the
separation column and compared to a calibration curve with known ion concentrations
using a Dionex Seven Anion Standard II (Lot #: 38-15AS). The nitrate concentration
within the Seven Anion Standard was 100 mg/L as sodium, which is equivalent to a

41
nitrate concentration of 269.6 mg/L as nitrate within the solution. The solution was than
diluted to different concentrations to create a 3-point calibration curve for the anions
analyzed. The dilutions used were 50%, 10%, 5% and 1% dilutions, and the
corresponding nitrate concentrations include 134.8 mg/L, 26.96 mg/L, 13.48 mg/L and
2.696 mg/L as nitrate respectively. The most appropriate 3-point calibration points used
depended on expected nitrate concentrations within the analyzed samples.
The second method followed the HACH Method 8039: Cadmium Reduction Method.
This method used a NitraVer 5 Nitrate Reagent Powder Pillow that mixed with 10-mL of
a 0.45-µm filtered sample. The Powder Pillow was added to the sample, rigorously
shaken for one minute, and then was allowed a five minute reaction time. Samples
containing nitrate resulted in a brown color. After five minutes, the absorbance was
measured using the Hitachi: U-3010 Spectrophotometer at a 500-nm wavelength. The
absorbance readings were converted to corresponding concentrations using a 3 to 5-point
calibration curve using known ammonia concentrations.
3.5.3 Nitrite Analysis
Two methods were also used for the analysis of nitrite. The first was the Ion
Chromatography method that was used for the nitrate analysis. The nitrite analysis
differed based on the nitrites shorter retention time within the separation column. The
nitrite concentration that corresponded to the conductivity reading produced by the ion
exchange was determined based on a 3 to 5-point calibration curve using the Dionex
Seven Anion Standard II. The nitrite concentration within the Seven Anion Standard II
was 100-mg/L as sodium for the sodium nitrite compound. This corresponds to a nitrite
concentration of 200-mg/L as nitrite. The known nitrite concentrations used for the 3 to

42
5-point calibration curve included 50%, 10%, 5%, and 1% dilutions of the Seven Anion
Standard II solution. The corresponding concentrations to the dilutions include 100, 20,
10, and 2-mg/L as nitrite respectively. The most appropriate concentrations for the
calibration curve were used based on the expected concentrations within the samples
being analyzed.
The second analysis method was the HACH Method 8153: Ferrous Sulfate Method. This
method used a NitriVer 2 Reagent Powder Pillow and a 10-mL, 0.45-µm filtered sample.
The Reagent Powder Pillow was added to the sample and mixed by shaking. The
prepared sample has a ten minute reaction time, and if nitrite was present a greenish-
brown color developed. After the ten minutes, the samples were than analyzed in the
Hitachi: U-3010 Spectrophotometer at a 585-nm wavelength. The absorbance reading is
than corresponded to a known concentration using a 3 to 5-point calibration curve. The
known concentrations used for the calibration curve were determined based on expected
concentrations for the samples being analyzed.

43
CHAPTER 4: RESULTS AND DISCUSSION
4.1 Batch Experiment Results
The goal of the batch experiments was to analyze ammonia, nitrate and nitrite
concentration changes. The ammonia concentrations were expected to decline due to
nitrification, and nitrate and nitrite concentrations would hopefully have an initial
increase and then decline by the time denitrification (Table 4.1).
Table 4.1: Batch Process Specifications
Experiment Total Run
Hours
Ammonia
Concentration
as NH4
+ (mg/L)
B1 192 50
B2 172 10
B3 476 25
B4 160.5 5
Each reaction performed differently however, and changing initial ammonia
concentrations produced varying results throughout the batch experiments.
4.1.1 Batch Experiment B1 Results
This batch reaction ran for a total of eight days, using the 50 mg/L initial ammonium
concentration in a minimal medium. The temperature fluctuated a few degrees
throughout the entire reaction, and the changes were based on the ambient temperature
changes. The pH was attempted to be maintained between 7 and 8 throughout the
reaction, but the unpredictability of the changing biological reactions it was readjusted to
these levels when measured too low (Figure 4.1). The initial pH drop was likely due to
the biological reaction with the carbon source glucose within the MABR. The pH was
adjusted back to between 7 and 8 by the addition of 1 to 3-mL of 10-N sodium hydroxide
(NaOH) to the 19-L reactor.

44
Figure 4.1: pH and Temperature Profile for Experiment B1
The ammonia, nitrate and nitrite fluctuations throughout the batch reaction showed
promising results during the beginning of the reaction. The ammonia readings initially
were higher than the proposed 50 mg/L ammonium concentrations (56.23 mg/L as N),
but the trends of the decreasing ammonia and increasing nitrate levels followed
anticipated trends. The ammonia concentration decreased to 24.9 mg/L as N within the
first four days of the reaction. The first nitrate peak reached a total nitrate concentration
of 30.2 mg/L, which seems high, but based on stoichiometric molar ratios the nitrate
concentration can reach up to 3.4 times the initial ammonium concentration (Figure 4.2).
This means that the with the initial ammonium concentrations reading 56.23 ppm, this
could coincide an eventual nitrate concentration to reach almost 191.2 mg/L as N. This is
not the case however, since all the ammonia was not exhausted within the MABR (Figure
4.2). With the change of ammonium being a 31.3 ppm decrease, the corresponding
nitrate increase could potentially reach up to 106.4 mg/L as N. The result of 106.4 ppm
seemed promising in that respect. However, the 31.3 ppm decrease in ammonium

45
concentration never increased any greater than that, so the nitrate concentration that
reached 49.2 mg/L as N near the 150th hour of the reaction was higher than expected
(Figure 4.2). Also, the nitrite concentration never reached significantly high levels
throughout the reaction, and it is assumed that the nitrite was quickly converted to nitrate
within the MABR.
0
10
20
30
40
50
60
0 50 100 150 200
Co
nc
en
tra
tio
n (
mg
/L)
Run Time (hours)
Ammonia as N
Nitrate as N
Nitrite as N
Figure 4.2: Ammonia, Nitrate and Nitrite Concentrations during Experiment B1
After two days of this batch reaction we noticed a darkening of the media within the
MABR, which eventually became so severe, that the silicone tubing could not be seen. It
was assumed to be a precipitate formed due to the anoxic conditions being formed within
the bulk liquid of the reactor. Also due to the anoxic bulk liquid, the reactor liquid
sampled was very malodorous and was determined to be the excess sulfur within our
media compounds. The eventual ammonia concentration plateau near 32 mg/L as N
(Figure 4.2) could have been due to sulfide toxicity experienced by the possible H2S

46
formation. The darkening of the bulk liquid also was determined to cause the sudden
drastic increase in the nitrate concentration near the end of the reaction. Therefore, the
last three data-points for the very high nitrate concentration are suspected outliers. Since
there was no additional glucose added during the reaction the reactor was assumed to be
exhausted and the nitrifying run experiment had ceased, due to the plateau of ammonium
concentrations and the sudden decrease on the nitrate concentration near the 100th hour
(Figure 4.2).
4.1.2 Batch Experiment B2 Results
For this 10 mg/L ammonium reaction, the reaction lasted seven days. This reaction was
the first to use a minimal media with less sulfur compounds, in a hope to decrease the
formation of malodorous compounds. During the first 24-hours the reaction experienced
a quick drop in pH, and reached a pH of 3.92 before being adjusted using the 10-N NaOH
(Figure 4.3). Though the initial pH of the reactor was at 9.07, the pH for the entire
reaction was maintained between 7 and 8.5. Temperature changed with ambient
temperatures in the surrounding area.

47
Figure 4.3: pH and Temperature Profile for Experiment B2
As in the previous reaction, the intended initial ammonia concentration was 10 mg/L, but
the concentration calculated was slightly lower at 4.85 mg/L as N (6.23 mg/L as NH4
+).
Both nitrate and nitrite also showed positive initial concentrations. This could have been
due to the thiamine used in the minimal media, or be residual concentrations from the
previous reaction (Figure 4.4). Based on the stoichiometric molar ratios the expected
nitrate concentrations could have reached approximately 16.5 mg/L as N, and nitrite
concentrations could have reached 12.5 mg/L as N. However, the nitrate concentration
reached up to 9.26 mg/L as N near the 80th hour of the seven day experiment (Figure 4.4).
This could have been due to inaccurate initial ammonia readings, or due to the residual
nitrate and nitrite compounds within the reactor at the beginning of the batch experiment.
The nitrite concentration however reached a maximum peak of 4.79 mg/L as N, which
was within the stoichiometric possible range of expected concentrations. The nitrate and
nitrite concentrations than decreased as expected and the ammonia concentration

48
plateaued near 1.0 mg/L as N and the reaction was ended with final nitrate and nitrite
concentrations of 2.32 and 2.05 mg/L respectively (Figure 4.4).
0
1
2
3
4
5
6
7
8
9
10
0 50 100 150 200
Co
nc
en
tra
tio
n(m
g/L
)
Run Time (hours)
Nitrate as N
Ammonia as N
Nitrite as N
Figure 4.4: Ammonia, Nitrate and Nitrite Curves for Experiment B2
The degradation of ammonia during the first 50 hours of the reaction had a 79%
degradation rate of ammonia. In order to determine the degradation rate constant, first-
order kinetics was used (Figure 4.5). The rate constant for the beginning of the
experiment calculated to be -0.0284 hours-1.

49
y = -0.0284x + 1.7055R² = 0.9116
0
0.2
0.4
0.6
0.8
1
1.2
1.4
1.6
1.8
0.00 10.00 20.00 30.00 40.00 50.00
Ln
(Am
mo
nia
Co
nc
en
tra
tio
n a
s N
)
Run Time (hours)
Ammonia Oxidation
Figure 4.5: First-Order Nitrification Kinetics for Experiment B2
During this reaction, the contents of the reactor turned black similar to the previous
experiment B1. As in the first reaction, it was caused by the formation of precipitates due
to the anoxic conditions within the bulk liquid. There was still an extensive biofilm along
the tubing, but the eventual darkening of the bulk liquid made it difficult to monitor the
biofilm.
4.1.3 Batch Experiment B3 Results
This 20 day test was using an initial ammonia concentration of 25 mg/L as NH
4
+ (19.4
mg/L as N), and was conducted using both the MABR and an anoxic reactor in series.
The pH and temperature followed similar paths with temperature changing with the
ambient air temperature in the laboratory, and the initial pH decline was determined to be
due to acid production from the glucose in the media. The pH readjustments were made
with the addition of 10-N NaOH (Figure 4.6). Around the 130th hour the pH did not

50
require adjustment, which we determined to mean the glucose was exhausted within both
reactors. To remedy this we added an additional 4.75-g (0.25 g/L) of glucose to continue
the experiment.
Figure 4.6: pH and Temperature Profile for Experiment B3
For the first 100 hours of the MABR reaction the data showed very positive results. The
ammonia concentration decreased to half the initial concentration, nitrate increased to a
peak of 7.0 mg/L as N, and nitrite increased to 2.97 mg/L as N (Figure 4.7). While the
reactor data showed a steep decline of nitrate concentrations, the ammonia concentration
continued to decline until it reached a low concentration of 6.12 mg/L as N by the 159th
hour. The nitrate than had a second peak that reached 5.87 mg/L as N and nitrite reached
a maximum concentration of 2.97 mg/L as NO2
- at 132 hours. The ammonia than
inexplicably began to increase and the batch experiment was ended (Figure 4.7).

51
0.0
2.0
4.0
6.0
8.0
10.0
12.0
14.0
16.0
18.0
20.0
0 50 100 150 200 250 300 350 400 450 500
Co
ncen
trati
on
(m
g/L
)
Run Time (hours)
Ammonia as NNitrate as NNitrite as N
Figure 4.7: Ammonia, Nitrate and Nitrite Concentrations for Experiment B3 MABR
Reactor For the anoxic reactor the ammonia curves were very similar (Figure 4.8). The initial
concentration was determined to be 17.5 mg/L as N and decreased to 4.82 mg/L by the
159th hour of the reaction. The nitrate and nitrite data varied, and the nitrate
concentrations were inconclusive during the first 132 hours of the reaction due to their
negative values. However, it did have an eventual increase reaching a concentration of
6.68 mg/L as N by the 259th hour and nitrite concentrations reached a maximum
concentration of 2.05 mg/L as N at the 259th hour (Figure 4.8).
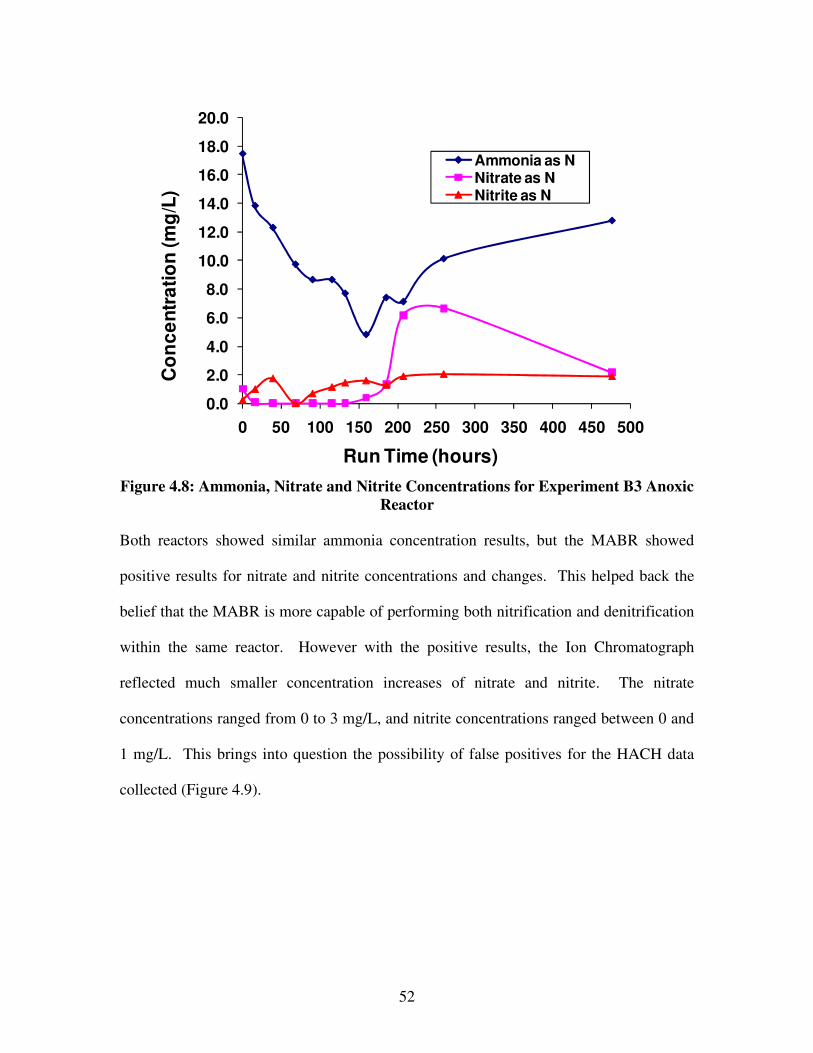
52
0.0
2.0
4.0
6.0
8.0
10.0
12.0
14.0
16.0
18.0
20.0
0 50 100 150 200 250 300 350 400 450 500
Co
nc
en
tra
tio
n (
mg
/L)
Run Time (hours)
Ammonia as NNitrate as NNitrite as N
Figure 4.8: Ammonia, Nitrate and Nitrite Concentrations for Experiment B3 Anoxic
Reactor Both reactors showed similar ammonia concentration results, but the MABR showed
positive results for nitrate and nitrite concentrations and changes. This helped back the
belief that the MABR is more capable of performing both nitrification and denitrification
within the same reactor. However with the positive results, the Ion Chromatograph
reflected much smaller concentration increases of nitrate and nitrite. The nitrate
concentrations ranged from 0 to 3 mg/L, and nitrite concentrations ranged between 0 and
1 mg/L. This brings into question the possibility of false positives for the HACH data
collected (Figure 4.9).

53
0
1
2
3
4
5
6
7
8
9
10
0 100 200 300 400 500
Co
nc
en
tra
tio
n (
mg
/L)
Run Time (hours)
Nitrate as NNitrite as NAnoxic: Nitrate as NAnoxic: Nitrite as N
Figure 4.9: Nitrate and Nitrite IC Curves for Experiment B3
4.1.4 Batch Experiment B4 Results
The second MABR and anoxic comparison was done at an ammonia concentration of 5
mg/L as NH4
+ (3.89 mg/L as N). The reaction ran for 7 days, and temperature and pH
followed similar paths during the entire reaction (Figure 4.10). The pH dropped initially
as before in the previous run experiment, and the pH was adjusted with the 10-N NaOH.
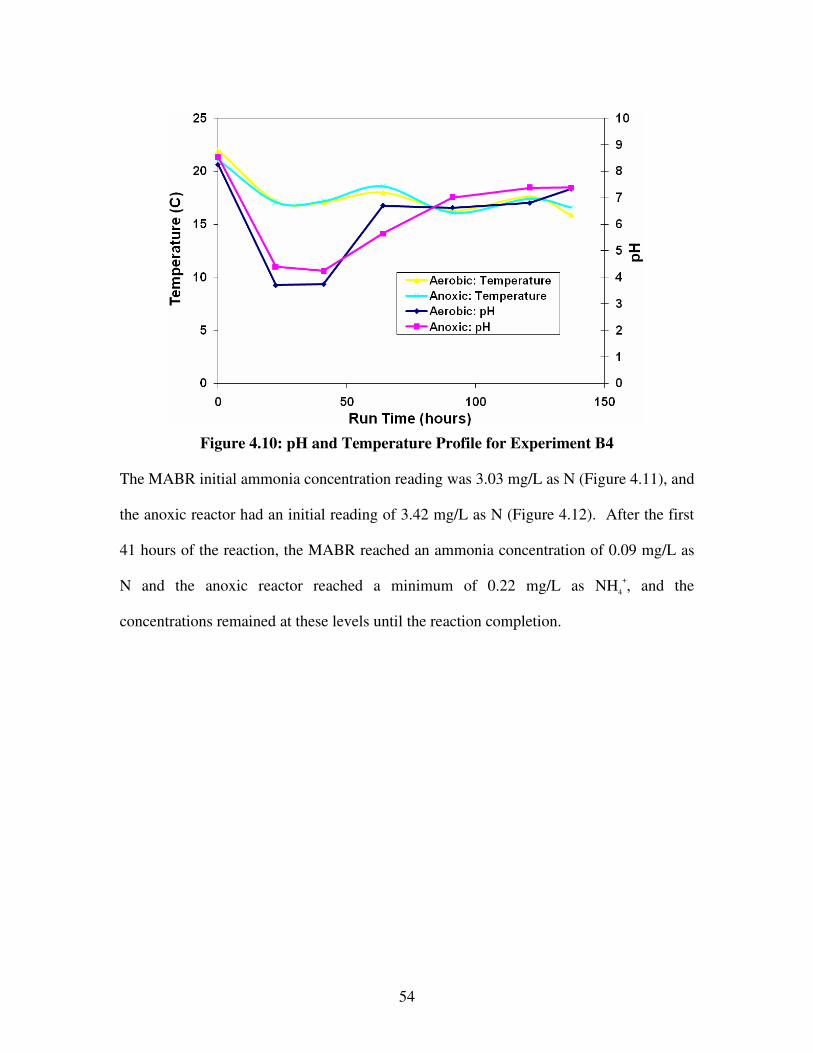
54
Figure 4.10: pH and Temperature Profile for Experiment B4
The MABR initial ammonia concentration reading was 3.03 mg/L as N (Figure 4.11), and
the anoxic reactor had an initial reading of 3.42 mg/L as N (Figure 4.12). After the first
41 hours of the reaction, the MABR reached an ammonia concentration of 0.09 mg/L as
N and the anoxic reactor reached a minimum of 0.22 mg/L as NH4
+, and the
concentrations remained at these levels until the reaction completion.

55
0.0
1.0
2.0
3.0
4.0
5.0
6.0
7.0
8.0
9.0
10.0
0 50 100 150
Co
nc
en
tra
tio
n (
mg
/L)
Run Time (hours)
Ammonia as NNitrate as NNitrite as N
Figure 4.11: Ammonia, Nitrate and Nitrite Concentrations for Experiment B4
MABR Reactor
0.0
1.0
2.0
3.0
4.0
5.0
6.0
7.0
8.0
9.0
10.0
0 50 100 150
Co
nc
en
tra
tio
n (
mg
/L)
Run Time (hours)
Ammonia as N
Nitrate as N
Nitrite as N
Figure 4.12: Ammonia, Nitrate and Nitrite Concentrations for Experiment B4
Anoxic Reactor The similarities with the ammonia degradation were very similar again as in the previous
25 mg/L reaction. As in the previous example as well, the major differences were the

56
results concerning nitrate and nitrite readings. For the MABR the nitrate concentration
peaked at a concentration of 4.58 mg/L as N by the 64th hour, and the nitrite concentration
peaked after the 23rd hour at 2.05 mg/L as N (Figure 4.11). The anoxic reactor showed
inconclusive initial results, but reached a maximum nitrate concentration of 5.06 mg/L as
N after 91 hours, and the nitrite concentration reached a maximum of 2.21 mg/L as N at
the 91st hour (Figure 4.12). Both reactors again had similar ammonia curves, but the
MABR again showed more valid nitrate and nitrite results. However, confirmation
samples were taken on April 1st, 3
rd, and 4
th for Ion Chromatograph confirmation samples
and the results did not reflect the data found using the HACH method (Figure 4.13).
0
1
2
3
4
5
6
7
8
9
10
0.0 50.0 100.0
Co
nc
en
tra
tio
n (
mg
/L)
Run Time (hours)
Nitrate as N
Nitrite as N
Anoxic: Nitrate as N
Anoxic: Nitrite as N
Figure 4.13: Nitrate and Nitrite IC Curves for Experiment B4
The MABR had the only positive result with a nitrate peak of 3 mg/L around the 50
th
hour, while the rest of the data for nitrate and nitrite for both reactors showed 0
concentrations for the confirmation samples. Again this brings up the question of false
positives or inaccuracies with the calculating of concentrations from the media collected.

57
4.2 Continuous – Flow Experiment Results
The purpose of the continuous run experiment was to determine the MABR’s ability to
nitrify the chosen ammonia concentrations, and denitrify the nitrates and nitrites formed.
The chosen flow rate was determined by maintaining the peristaltic pump to its lowest
setting that was capable of overtaking the static head of the vertical reactor. However,
the pump was as consistent as we could make it work, and there were slight differences
between each experiment (Table 4.2).
Table 4.2: Continuous Process Specifications
Experiment Total Run
Hours Media Type
Inlet Ammonia
Concentration as
NH4
+ (mg/L)
C1 72 Minimal media 5
C2 66 Minimal media 10
C3 73 Minimal media 25
C4 101 Minimal media 10
C5 167 Minimal media 5
C6 43.5 Minimal media 10
The media was stored in a 50-gallon drum for the first four run experiment, until its
eventual malfunction and biological growth problems caused for a new method that did
not require so much stagnation of the media prior to pumping through the reactor. The 5-
gallon bottles were than chosen and media was needed to be made and added daily. The
5-gallon bottles were also used with the Reclamation Facility water samples. While the
reactor was running, samples were taken from the sample ports, and analyzed for
ammonia, nitrate and nitrite concentrations. Ion Chromatograph samples were also taken
in order to have confirmation samples for the data calculated. As in the batch run
experiment, each reaction acted very differently with the differing ammonia
concentrations that were tested.

58
4.2.1 Continuous – Flow Experiment C1 Results
The first continuous reaction used the 50-gallon drum and the minimal media used was
made to have an ammonia concentration of 5 mg/L as NH4
+ (3.89 mg/L as N). The
average hydraulic residence time (HRT) for the reaction was 27.3 hours, which equaled
an average flow rate of 11.6 mL/min. The pH showed slight changes within the reactor
during the reaction, but the pH remained within the 4.5 and 3 ranges due to a decision
that was made to not adjust the pH within the media (Figure 4.14). The temperature
followed very similar paths throughout the reaction, and the fluctuations were based on
the ambient temperature within the laboratory (Figure 4.14).
0
1
2
3
4
5
6
7
8
9
10
0
5
10
15
20
25
0 10 20 30 40 50
pH
Te
mp
era
utr
e (C
)
Run Time (hours)
Inlet: Temperature
R1A: Temperature
R1B: Temperature
R1C: Temperature
Inlet: pH
R1A: pH
R1B: pH
R1C: pH
Figure 4.14: pH and Temperature Profile for Experiment C1
For the entire reaction, the influent ammonia concentration readings ranged between 1.3
and 2.5 mg/L as N. The nitrate and nitrite concentrations were expected to be near zero
for the influent of the minimal media, but the readings found for the nitrate concentration
zero concentrations for the inlet and outlet data, and the nitrite levels remained at 1.9
mg/L as N (Figure 4.15).

59
0.0
1.0
2.0
3.0
4.0
5.0
6.0
7.0
8.0
9.0
10.0
0 10 20 30 40 50
Co
nc
en
tra
tio
n (
mg
/L)
Run Time (hours)
Inlet: Ammonia as NInlet: Nitrate as NInlet: Nitrite as NOutlet: Ammonia as NOutlet: Nitrite as N
Figure 4.15: Ammonia, Nitrate and Nitrite Curves for Experiment C1
Within the first HRT for the MABR, the ammonia concentration dropped from the initial
reading of 1.63 mg/L as N to a reading of 0.04 mg/L at the outlet. This concentration
remained low throughout the remaining time of the 3 day reaction. However, nitrite
levels within the reactor fluctuated between 1.6 and 2.36 mg/L as NO2
- and nitrate levels
remained zero (Figure 4.15). Looking at the Ion Chromatograph data however, the
readings for nitrate and nitrite were different. Nitrate concentrations reached a maximum
concentration of approximately 3.3 mg/L as N by the final day of sampling, and nitrite
levels were found to be zero throughout the reaction (Figure 4.16).
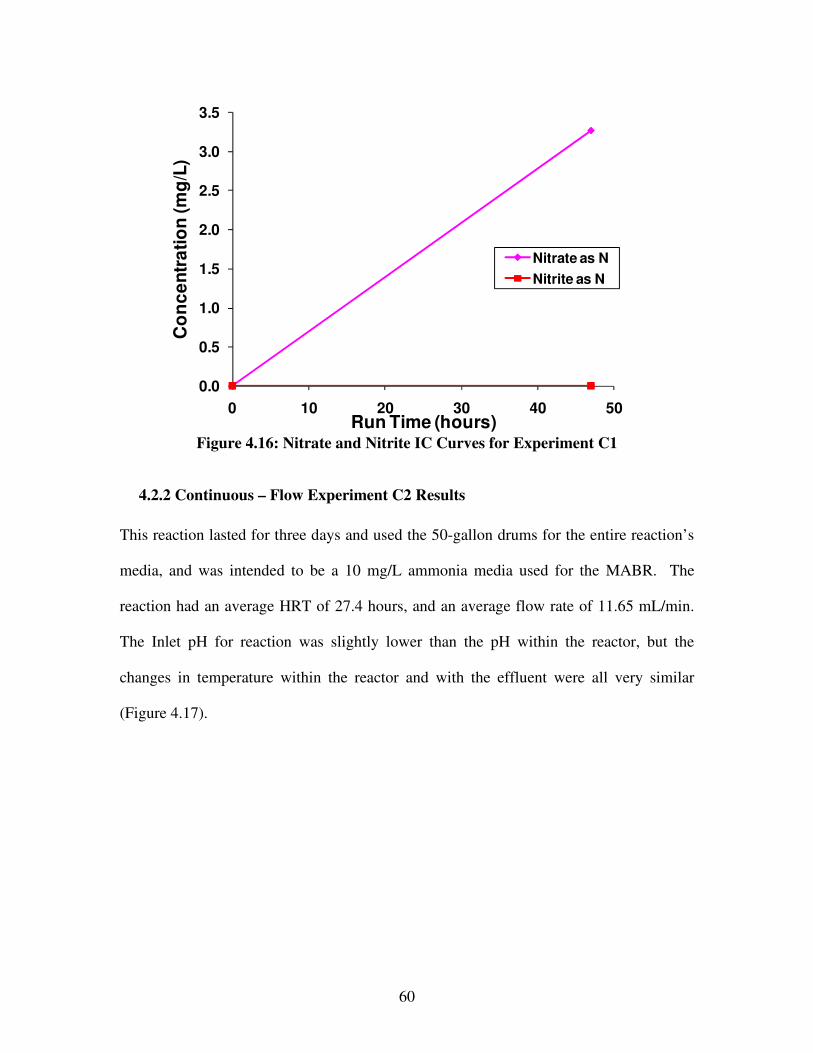
60
0.0
0.5
1.0
1.5
2.0
2.5
3.0
3.5
0 10 20 30 40 50
Co
nc
en
tra
tio
n (
mg
/L)
Run Time (hours)
Nitrate as N
Nitrite as N
Figure 4.16: Nitrate and Nitrite IC Curves for Experiment C1
4.2.2 Continuous – Flow Experiment C2 Results
This reaction lasted for three days and used the 50-gallon drums for the entire reaction’s
media, and was intended to be a 10 mg/L ammonia media used for the MABR. The
reaction had an average HRT of 27.4 hours, and an average flow rate of 11.65 mL/min.
The Inlet pH for reaction was slightly lower than the pH within the reactor, but the
changes in temperature within the reactor and with the effluent were all very similar
(Figure 4.17).
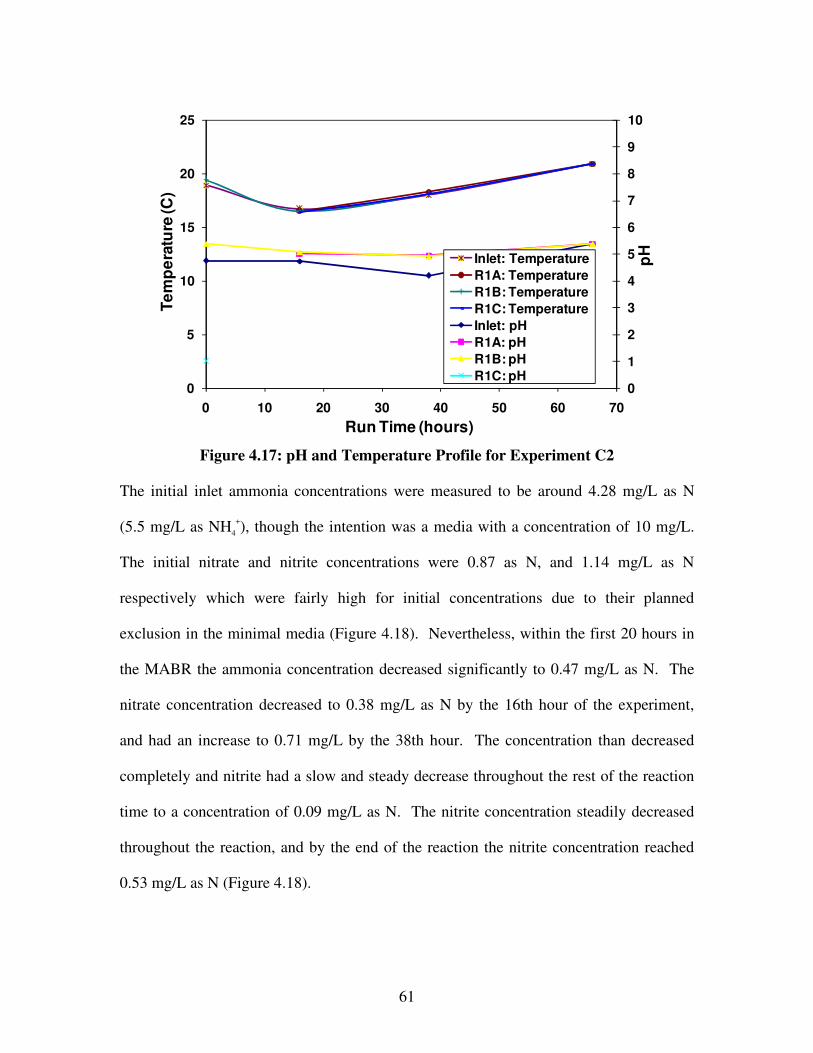
61
0
1
2
3
4
5
6
7
8
9
10
0
5
10
15
20
25
0 10 20 30 40 50 60 70
pH
Te
mp
era
ture
(C)
Run Time (hours)
Inlet: Temperature
R1A: Temperature
R1B: Temperature
R1C: Temperature
Inlet: pH
R1A: pH
R1B: pH
R1C: pH
Figure 4.17: pH and Temperature Profile for Experiment C2
The initial inlet ammonia concentrations were measured to be around 4.28 mg/L as N
(5.5 mg/L as NH4
+), though the intention was a media with a concentration of 10 mg/L.
The initial nitrate and nitrite concentrations were 0.87 as N, and 1.14 mg/L as N
respectively which were fairly high for initial concentrations due to their planned
exclusion in the minimal media (Figure 4.18). Nevertheless, within the first 20 hours in
the MABR the ammonia concentration decreased significantly to 0.47 mg/L as N. The
nitrate concentration decreased to 0.38 mg/L as N by the 16th hour of the experiment,
and had an increase to 0.71 mg/L by the 38th hour. The concentration than decreased
completely and nitrite had a slow and steady decrease throughout the rest of the reaction
time to a concentration of 0.09 mg/L as N. The nitrite concentration steadily decreased
throughout the reaction, and by the end of the reaction the nitrite concentration reached
0.53 mg/L as N (Figure 4.18).

62
0.0
1.0
2.0
3.0
4.0
5.0
6.0
7.0
8.0
9.0
10.0
0 10 20 30 40 50 60 70
Co
nti
nu
ou
s (m
g/L
)
Run Time (hours)
Inlet: Ammonia as NInlet: Nitrate as NInlet: Nitrite as NOutlet: Ammonia as NOutlet: Nitrate as NOutlet: Nitrite as N
Figure 4.18: Ammonia, Nitrate and Nitrite Curves for Experiment C2
Confirmation samples were taken for analysis with the Ion Chromatograph, and as in the
run experiment before, the nitrate and nitrite concentrations were quite different. The
samples were taken from the initial sample and on the 16th hour, and the initial nitrate
concentration was 0.5 mg/L as N and zero concentrations on the 16th hour, and nitrite
concentrations did not show any occurrence of nitrite concentrations on either sampling
event.
However, the inlet ammonia concentration was also decreasing during this time. Within
38 hours of the reaction, the inlet ammonia concentration decreased to 1.6 mg/L as N. It
was concluded that this was due to biological growth within the 50-gallon drum, and the
drum was washed extensively to avoid the occurrence for future experiments. With the
continuously different values for calculating concentrations within the reactor, it is
difficult to make any valuable conclusions on the MABR effectiveness. The IC data was
not included, since the nitrite concentrations were zero throughout the samples analyzed,

63
and the nitrate concentration had an initial concentration of 0.5 while the remaining
samples were zero.
4.2.3 Continuous – Flow Experiment C3 Results
For this three day reaction the intended initial ammonia concentration was 25 mg/L as
NH4
+ (19.4 mg/L as N). And prior to mixing the three days worth of media into the 50-
gallon drum, the drum was washed thoroughly to avoid biological growth. For this
reaction the average HRT was 14.4 hours, and had a flow rate of 27.9 mL/min. This
HRT was about half the normal HRT, and it was due to the use of a new peristaltic pump
because the original needed to be replaced. For the entire reaction the pH and
temperatures changes followed similar trends, and the large temperature flux was due to
the ambient laboratory temperatures (Figure 4.19).
0
1
2
3
4
5
6
7
8
9
10
0
5
10
15
20
25
0 10 20 30 40 50 60 70
pH
Te
mp
era
ture
(C)
Run Time (hours)
Inlet: Temperature
R1A: Temperature
R1B: Temperature
R1C: Temperature
Inlet: pH
R1A: pH
R1B: pH
R1C: pH
Figure 4.19: pH and Temperature Profile for Experiment C3
Throughout the reaction ammonia steadily decreased with an initial concentration of 13.3
mg/L as N. By the end of the reaction, the concentration had reached a concentration of

64
4.0 mg/L. The nitrite concentration was maintained between 1.3 and 0.69 mg/L as NO2
-,
and nitrate concentrations were inconclusive due to their negative values throughout the
three day reaction (Figure 4.20).
0.0
2.0
4.0
6.0
8.0
10.0
12.0
14.0
0 10 20 30 40 50 60 70
Co
nc
en
tra
tio
n (
mg
/L)
Run Time (hours)
Inlet: Ammonia as N
Inlet: Nitrate as N
Inlet: Nitrite as N
Outlet: Ammonia as N
Outlet: Nitrate as N
Outlet: Nitrite as N
Figure 4.20: Ammonia, Nitrate and Nitrite Curves for Experiment C3
The largest issue with this reaction was the similar shape of the ammonia degradation
curve to the inlet ammonia concentrations, and the similar nitrite curves from the 50-
gallon drum. The MABR did show some minor degradation of nitrate within the reactor,
and the ammonia degradation was steeper within the MABR than when compared to the
inlet ammonia concentrations. This showed some positive effects within the MABR, but
the ammonia degradation within the storage drum was disconcerting. Also, the nitrate
levels within the storage drum and the MABR were inconclusive and the increase of
nitrate concentrations within the reactor that were hoped never showed up within our data
analysis. When the data was compared to the Ion Chromatograph data collected, the
results showed only an increase of approximately 2 mg/L as N during the second day of

65
the reaction, and the nitrite levels remained at zero with all the confirmation samples
(Figure 4.21).
0
0.5
1
1.5
2
2.5
0 10 20 30 40 50 60 70
Co
nc
en
tra
tio
n (
mg
/L)
Run Time (hours)
Continuous: Nitrate as N
Continuous: Nitrite as N
Figure 4.21: Nitrate and Nitrite IC Curves for Experiment C3
4.2.4 Continuous – Flow Experiment C4 Results
This four day reaction was the first reaction using the 5-gallon bottles for media storage.
The new media was mixed daily and the use of two alternating bottles allowed each
bottle to be cleaned and dried prior to the next day’s use. This reaction used an ammonia
concentration of 10 mg/L minimal media, and the new pump was also calibrated and to
match the initial flow-rates through the reactor. The average HRT was 27.4 hours, and
the average flow rate was 11.7 mL/min. The temperatures again followed similar
fluctuations during the reaction, but the inlet pH stayed higher than the pH within the
reactor throughout the reaction (Figure 4.22). The inlet pH ranged between 5.6 and 7.69
while the sample ports in the MABR had pH readings all near 4.
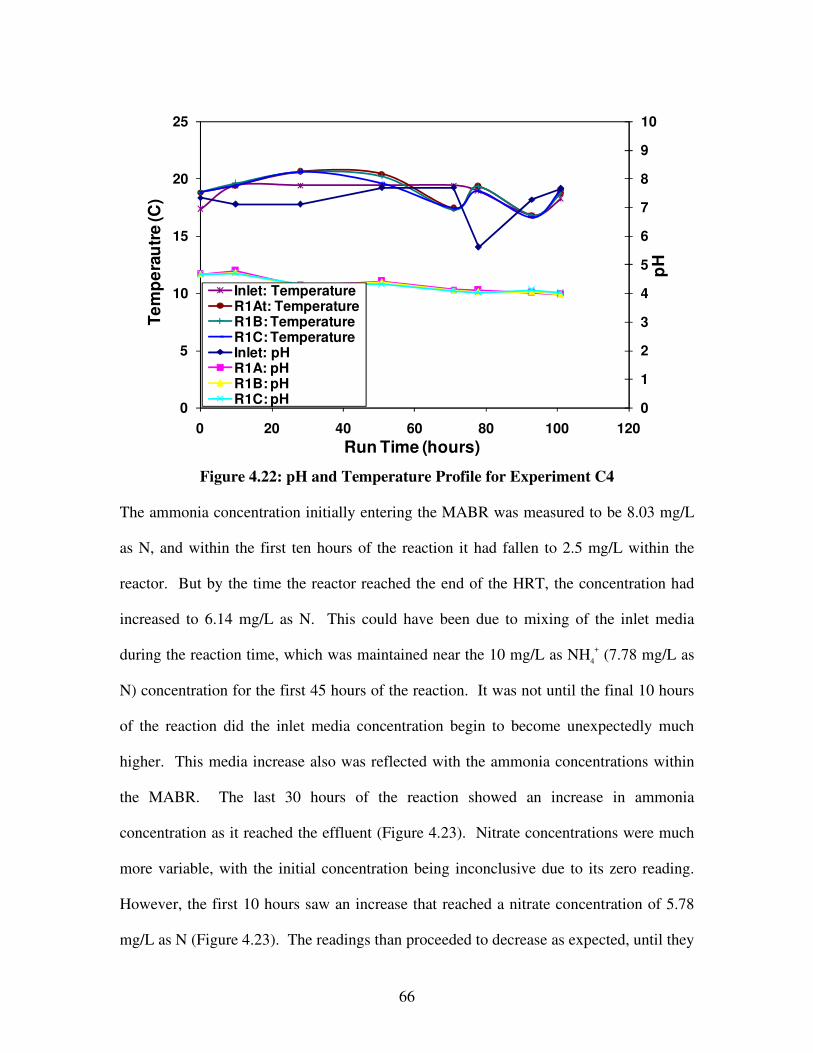
66
0
1
2
3
4
5
6
7
8
9
10
0
5
10
15
20
25
0 20 40 60 80 100 120
pH
Te
mp
era
utr
e (C
)
Run Time (hours)
Inlet: TemperatureR1At: TemperatureR1B: TemperatureR1C: TemperatureInlet: pHR1A: pHR1B: pHR1C: pH
Figure 4.22: pH and Temperature Profile for Experiment C4
The ammonia concentration initially entering the MABR was measured to be 8.03 mg/L
as N, and within the first ten hours of the reaction it had fallen to 2.5 mg/L within the
reactor. But by the time the reactor reached the end of the HRT, the concentration had
increased to 6.14 mg/L as N. This could have been due to mixing of the inlet media
during the reaction time, which was maintained near the 10 mg/L as NH4
+ (7.78 mg/L as
N) concentration for the first 45 hours of the reaction. It was not until the final 10 hours
of the reaction did the inlet media concentration begin to become unexpectedly much
higher. This media increase also was reflected with the ammonia concentrations within
the MABR. The last 30 hours of the reaction showed an increase in ammonia
concentration as it reached the effluent (Figure 4.23). Nitrate concentrations were much
more variable, with the initial concentration being inconclusive due to its zero reading.
However, the first 10 hours saw an increase that reached a nitrate concentration of 5.78
mg/L as N (Figure 4.23). The readings than proceeded to decrease as expected, until they

67
reached the negative range. Also, the final nitrate concentration reading was not used due
to its unusually high reading of 174.1 mg/L as N. The inlet nitrate concentration though
stayed consistently zero. The nitrite concentrations maintained between 0.53 and 0.99
mg/L as N except until the 93rd hour of the reaction where the concentration dropped to
0.23 mg/L and than increased to 7.58 mg/L as N at the completion of the reaction as it
was reaching the effluent of the reactor. This increase could have been due to the
increased ammonia inlet concentration and the potential increase of nitrite production
within the reactor, since the inlet nitrite concentration stayed constant at 1.36 mg/L as N
(Figure 4.23).
0
2
4
6
8
10
12
14
16
18
0 10 20 30 40 50 60 70 80 90 100 110
Co
nc
en
tra
tio
n (
mg
/L)
Run Time (hours)
Inlet: Ammonia as N
Inlet: Nitrate as N
Inlet: Nitrite as N
Outlet: Ammonia as N
Outlet: Nitrate as N
Outlet: Nitrite as N
Figure 4.23: Ammonia, Nitrate and Nitrite Curves for Experiment C4
The Ion Chromatograph data showed minimal increases of nitrate and no nitrite
production at all with the confirmation samples taken on May 6th, and 9
th. The nitrate
concentration peaked with an initial reading of 0.36 mg/L. The rest of the samples for
nitrate and nitrite were zero.

68
After completion of this reaction, it was discovered that the air-line inlet was
malfunctioning. The gauge readings read the desired air pressure of 15 psi within the
line, but the actual air entering the silicone tubes from the laboratory air line was
significantly lower. There was almost no air flow whatsoever. The initial thought was
that the silicone tubes had experienced bio-fouling, but the tubes could not be cleaned
significantly due to the lack of access to the tubes by the MABR’s design. The silicone
tubes were than replaced with new silicone tubes of the same length and diameter. The
air line was than replaced and switched with a functioning air source.
4.2.5 Continuous – Flow Experiment C5 Results
This six day reaction was intended to have a 5 mg/L ammonium concentration. This was
also the first reaction using a HACH method for detecting ammonia concentrations. This
came after the malfunction of the ammonia probe used for the previous analysis. The
average HRT throughout the reaction was 27.32 hours, and the average flow rate was
11.6 mL/min. With the limited pH and temperature readings taken, the temperatures
followed similar paths, while the inlet pH stayed higher than the pH within the reactor
until the final reading of the reaction (Figure 4.24).

69
0
1
2
3
4
5
6
7
8
9
10
0
5
10
15
20
25
30
0 50 100 150 200
pH
Te
mp
era
ture
(C)
Run Time (hours)
Inlet: Temperature
R1A: Temperature
Inlet: pH
R1A: pH
Figure 4.24: pH and Temperature Profile for Experiment C5
The only positive ammonia concentration was in the inlet minimal media, but the peak
only showed a concentration of 0.58 mg/L as N. Without any positive readings of
ammonia, the positive nitrate and nitrite readings are fairly suspect. During the reaction
time the nitrate concentration decreased from 0.71 mg/L to 0.39 mg/L as N, and nitrite
readings increased from 0.84 mg/L to 1.14 mg/L as N (Figure 4.25). The inlet
concentrations for nitrate stayed consistently at 0.71 mg/L as N, and nitrite inlet
concentrations stayed at 0.84 mg/L as N, which was unusual since the was not supposed
to be any concentrations of either within the minimal media (Figure 4.25).

70
0.0
1.0
2.0
3.0
4.0
5.0
6.0
7.0
8.0
9.0
10.0
0 50 100 150 200
Co
nc
etn
rati
on
(m
g/L
)
Run Time (hours)
Inlet: Ammonia as N
Inlet: Nitrate as N
Inlet: Nitrite as N
Outlet: Ammonia as N
Outlet: Nitrate as N
Outlet: Nitrite as N
Figure 4.25: Ammonia, Nitrate and Nitrite Curves for Experiment C5
This run showed no successful results or MABR characteristics, and nitrate and nitrite
concentrations within the MABR were determined to be due to residual compounds from
previous run experiment. The media could have had positive readings of nitrates and
nitrites due to some sort of contamination of the media or inaccurate readings and
analysis. The Ion Chromatograph confirmation sample was taken on June 8th, the 87
th
hour, and the nitrate and nitrite analysis showed no concentrations of nitrate or nitrite.
4.2.6 Continuous – Flow Experiment C6 Results
The three day reaction looked at a 10 mg/L concentration of ammonium (7.78 mg/L as N)
in the media. The average HRT through the MABR was 25 hours, and the flow rate was
12.8 mL/min. Temperatures taken during the reaction followed similar paths, but sample
port R1A showed greater fluctuations. Also, the inlet pH was greater than the pH taken

71
from the sample ports. The inlet pH ranged between 7.74 and 6.55 while the reactor pH
ranged from 4.61 to 4.39 (Figure 4.26).
0
1
2
3
4
5
6
7
8
9
10
0
5
10
15
20
25
0 10 20 30 40 50
pH
Te
mp
era
ture
(C)
Run Time (hours)
Inlet: TemperatureR1A: TemperatureR1B: TemperatureR1C: TemperatureInlet: pHR1A: pHR1B: pHR1C: pH
Figure 4.26: pH and Temperature Profile for Experiment C6
For the C6 experiment the initial ammonia concentration was calculated to be 7.33 mg/L
as N, and by the time it reached the top sample port R1A the concentration had decreased
to 0.90 mg/L as N (Figure 4.27). Nitrate had an initial concentration of 2.0 mg/L as N
inexplicably, and nitrite had an initial concentration of 1.9 mg/L as N. However, the
concentrations did decrease within the first 25 hours. The rest of the experiment showed
a quick decrease in ammonium within the next 25 hours, but nitrate levels went from zero
to a concentration of 1.07 mg/L as N and nitrite concentrations went from 0.23 mg/L to
0.076 mg/L as N (Figure 4.27). The initial decrease of ammonia concentration within the
MABR during the first 25 hours of the reaction show an 86% decrease in ammonia
concentration as it passes through the reactor, and eventually degradation rate slowly
lessened.

72
0
1
2
3
4
5
6
7
8
9
10
0 10 20 30 40 50
Co
nc
en
tra
tio
n (
mg
/L)
Run Time (hours)
Inlet: Ammonia as N
Inlet: Nitrate as N
Inlet: Nitrite as N
Outlet: Ammonia as N
Outlet: Nitrate as N
Outlet: Nitrite as N
Figure 4.27: Ammonia, Nitrate and Nitrite Curves for Experiment C6
Inlet concentrations also began to experience fluctuations within each 5-gallon bottles
used. Each peak of the ammonia inlet curve represented the initial concentration, and the
decrease of the ammonia concentration was determined to be due to degradation of
ammonia within the bottles, but nitrate concentrations were still very low and nitrite
concentrations fluctuated between 1.14 and 0.076 mg/L as N (Figure 4.27). Due to the
possible inaccuracies and confusion caused by the Ion Chromatograph, the analysis was
not conducted for this experiment.

73
4.3 Local Municipal Wastewater Results
The Local Municipal Wastewater reaction experiments used wastewater from different
locations at the San Luis Obispo Reclamation Facility (Table 4.3). The samples were
collected from the Reclamation Facility, transported to the laboratory and stored in the 5-
gallon bottles to run the wastewater through the MABR. While the wastewater traveled
through the reactor, the ammonia, nitrate and nitrite concentrations were measured to
track changes and determine the MABR’s effectiveness.
Table 4.3: Continuous Wastewater Process Specifications
Experiment Total Run
Hours Media Type
Ammonia
Concentration as
NH4
+ (mg/L)
CW1 101.5 Secondary Effluent
Wastewater Variable
CW2 142 100% Nitrified Effluent Variable
CW3 154 5% Primary, 95%
Nitrified Effluent Mixture Variable
CW4 164 25% Primary, 75%
Nitrified Effluent Mixture Variable
CW5 384 15% Primary, 85%
Nitrified Effluent Mixture Variable
4.3.1 Secondary Effluent Experiment CW1 Results
The secondary effluent experiment CW1 lasted for four days. The average HRT was
27.55 hours, and the average flow rate was 11.5 mL/min. The temperature curves for the
influent and all the sample ports all followed common fluctuation trends throughout the
run, but the inlet pH stayed higher than the pH from the sample ports. For sample port
R1A, the pH had dropped between 0.3 and 0.5 pH units prior to reaching the effluent
tubes (Figure 4.28).

74
0.0
1.0
2.0
3.0
4.0
5.0
6.0
7.0
8.0
9.0
10.0
0
5
10
15
20
25
0 10 20 30 40 50 60 70 80 90 100 110
pH
Te
mp
era
ture
(C)
Run Time (hours)
Inlet: TemperatureR1A: TemperatureR1B: TemperatureR1C: TemperatureInlet: pHR1A: pHR1B: pHR1C: pH
Figure 4.28: pH and Temperature Profile for Experiment CW1
For the continuous run, the change in concentration vs. change in time was broken up due
to the inlet fluctuations of the wastewater, and the broken lines show each individual 5-
gallon wastewater sample as it traveled through the reactor. The three sections show the
change of ammonia and nitrate concentrations based on their initial concentrations
(Figure 4.29). The first 30 hours of the reaction showed a small decrease in nitrate
concentration, but the ammonia concentration remained fairly stable. However, between
the 30th and 70
th hour of the reaction the concentrations of ammonia and nitrate showed
major decreases. For the last 40 hours of the reaction, the ammonia concentration change
leveled off and nitrate concentrations initially decreased and eventually had an increase
(Figure 4.29). Nitrite concentrations were not analyzed the entire reaction or within the
reactor, due to the lack of analysis supplies, and Ion Chromatograph data was not taken
due to its previous issues and data inconsistencies.

75
0
5
10
15
20
25
30
35
0 10 20 30 40 50 60 70 80 90 100 110
Co
nc
en
tra
tio
n (
mg
/L)
Run Time (hours)
Inlet: Ammonia as N
Inlet: Nitrate as N
Inlet: Nitrite as N
Outlet: Ammonia as N
Outlet: Nitrate as N
Outlet: Nitrite as N
Figure 4.29: Ammonia, Nitrate and Nitrite Curves for Experiment CW1
Inlet concentrations from the Reclamation Facility did not have as drastic fluctuations as
did our data analysis (Figure 4.29), which could have been due to changes occurring
during transport or the possible different sampling times compared to the Reclamation
facility laboratory analysis. The inconsistencies with constant concentrations of the
influent were due to the natural daily fluctuations of the wastewater, even when it was
sampled and transported around the same time every day. The changes within the
MABR during this reaction showed positive results with the drop in ammonia and nitrate
concentrations, but the run experiment were very inconsistent.
4.3.2 100% Nitrified Effluent Experiment CW2 Results
The 100% nitrified effluent experiment CW2 lasted for 6 days. The average HRT for the
reaction was 27.55 hours, and the average flow rate was 11.5 mL/min. Since the nitrified
effluent is treated and clarified, the results of the experiment were expected to show

76
minimal activity. The temperature data that was taken showed little changes within the
reactor, but the pH within the reactor showed similar trends until the last 60 hours of the
reaction (Figure 4.30). It showed a drop in pH from 7.25 in the influent to a pH of 6.95
in sample port R1A near the effluent. This led to the belief of unexpected
microbiological activity.
0
1
2
3
4
5
6
7
8
9
10
0
5
10
15
20
25
0 20 40 60 80 100 120 140 160
pH
Te
mp
era
ture
(C)
Run Time (hours)
Inlet: Temperature
R1A: Temperature
Inlet: pH
R1A: pH
Outlet: pH
Figure 4.30: pH and Temperature Profile for Experiment CW2
The reaction analysis was again broken up based on influent changes, and each line
indicates when the new day’s media was added to the reactor (Figure 4.31). There were
major fluctuations with nitrate concentration between 50th and 100
th hour, and an even
greater increase near the end of the reaction, but the ammonia levels remained very low,
and there wouldn’t be enough in the wastewater to cause these large fluctuations The
trend however is very similar to the influent concentration changes of all three
constituents: ammonia, nitrate, and nitrite (Figure 4.31). Ammonia and nitrite stayed
very low, and it was determined that since the nitrate concentrations mimicked the
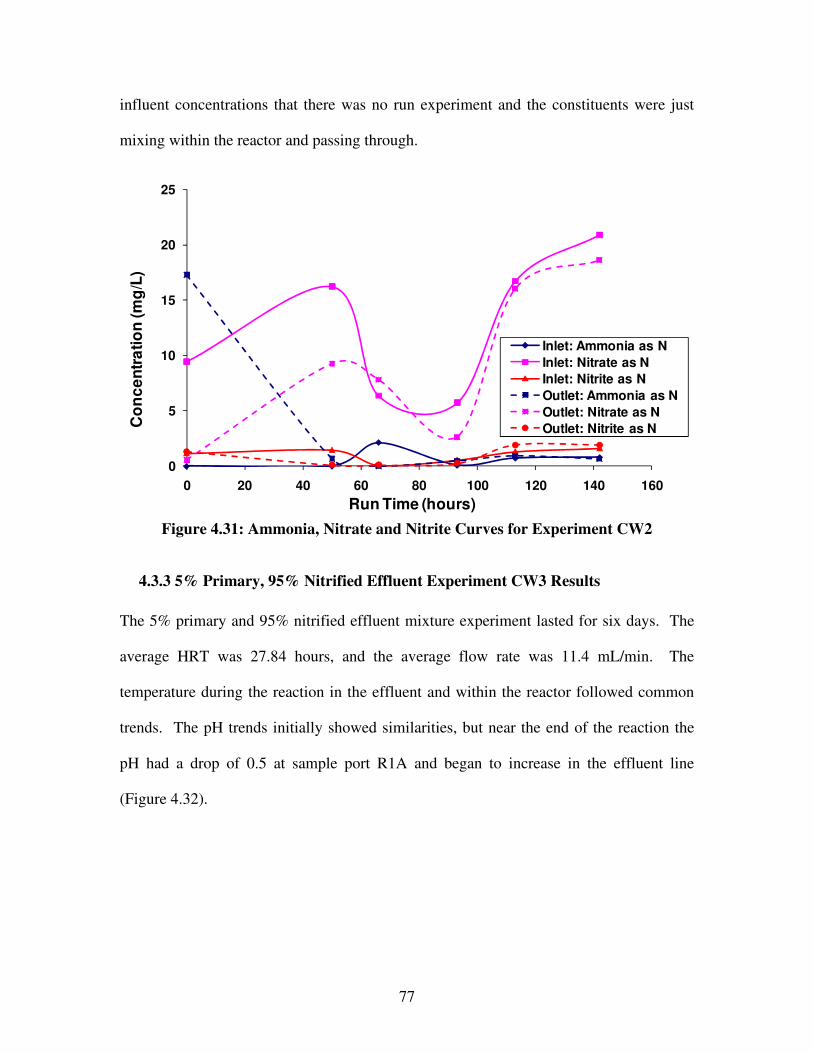
77
influent concentrations that there was no run experiment and the constituents were just
mixing within the reactor and passing through.
0
5
10
15
20
25
0 20 40 60 80 100 120 140 160
Co
nc
en
tra
tio
n (
mg
/L)
Run Time (hours)
Inlet: Ammonia as N
Inlet: Nitrate as N
Inlet: Nitrite as N
Outlet: Ammonia as N
Outlet: Nitrate as N
Outlet: Nitrite as N
Figure 4.31: Ammonia, Nitrate and Nitrite Curves for Experiment CW2
4.3.3 5% Primary, 95% Nitrified Effluent Experiment CW3 Results
The 5% primary and 95% nitrified effluent mixture experiment lasted for six days. The
average HRT was 27.84 hours, and the average flow rate was 11.4 mL/min. The
temperature during the reaction in the effluent and within the reactor followed common
trends. The pH trends initially showed similarities, but near the end of the reaction the
pH had a drop of 0.5 at sample port R1A and began to increase in the effluent line
(Figure 4.32).

78
0
1
2
3
4
5
6
7
8
9
10
0
5
10
15
20
25
30
0 20 40 60 80 100 120 140
pH
Te
mp
era
ture
(C)
Run Time (hours)
Inlet: Temperature
R1A: Temperature
Inlet: pH
R1A: pH
Outlet: pH
Figure 4.32: pH and Temperature Profile for Experiment CW3
For the entire reaction the ammonia concentration stayed low, and the nitrate
concentration was very high. This was due to the fact that the wastewater samples were
received after the nitrification at the Reclamation Facility, but the nitrates would
hopefully be treated as they passed through the MABR (Figure 4.33). During the
continuous reaction, the nitrate concentration fluctuated between 4.5 and 27.1 mg/L as N,
and each break represented the addition on influent with differing concentrations than
previously added (Figure 4.33). During the time periods between the 50th hour and the
125th hour, the nitrate concentrations showed promising trends with the increase up to
27.01 mg/L as N and than decreased to 6.53 mg/L as N. However, the ammonia and
nitrite concentrations remained low throughout the fluctuations (Figure 4.33).
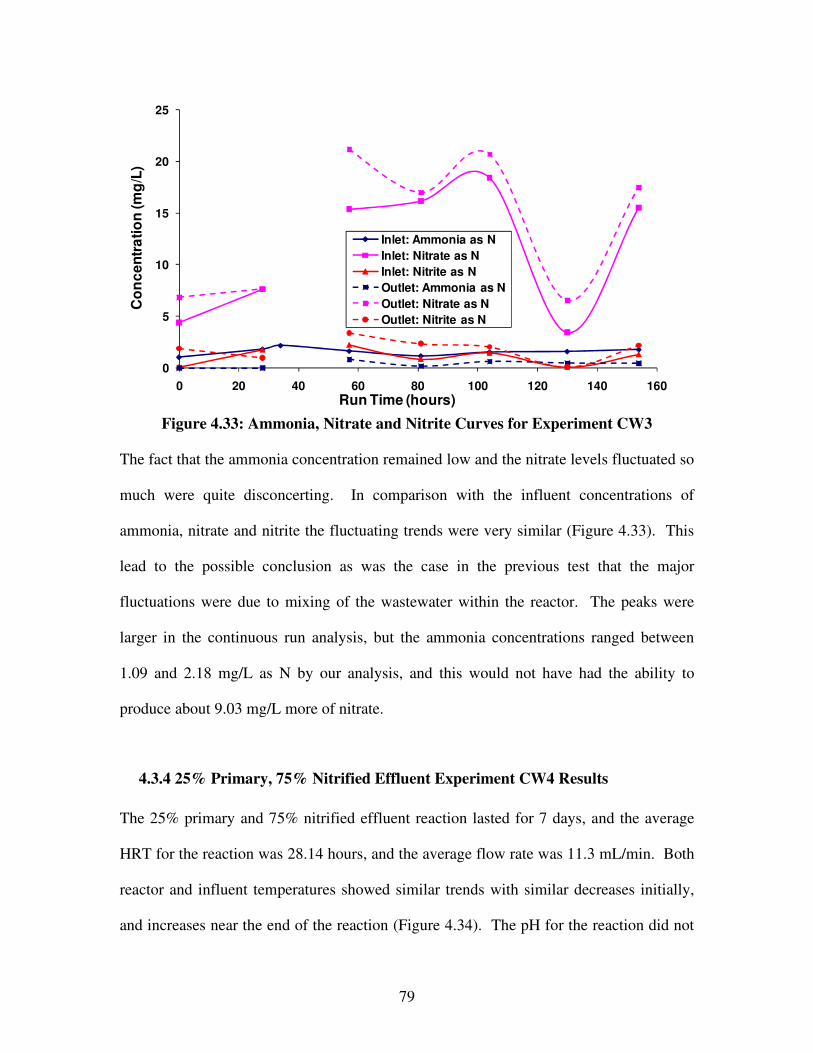
79
0
5
10
15
20
25
0 20 40 60 80 100 120 140 160
Co
nc
en
tra
tio
n (
mg
/L)
Run Time (hours)
Inlet: Ammonia as N
Inlet: Nitrate as N
Inlet: Nitrite as N
Outlet: Ammonia as N
Outlet: Nitrate as N
Outlet: Nitrite as N
Figure 4.33: Ammonia, Nitrate and Nitrite Curves for Experiment CW3
The fact that the ammonia concentration remained low and the nitrate levels fluctuated so
much were quite disconcerting. In comparison with the influent concentrations of
ammonia, nitrate and nitrite the fluctuating trends were very similar (Figure 4.33). This
lead to the possible conclusion as was the case in the previous test that the major
fluctuations were due to mixing of the wastewater within the reactor. The peaks were
larger in the continuous run analysis, but the ammonia concentrations ranged between
1.09 and 2.18 mg/L as N by our analysis, and this would not have had the ability to
produce about 9.03 mg/L more of nitrate.
4.3.4 25% Primary, 75% Nitrified Effluent Experiment CW4 Results
The 25% primary and 75% nitrified effluent reaction lasted for 7 days, and the average
HRT for the reaction was 28.14 hours, and the average flow rate was 11.3 mL/min. Both
reactor and influent temperatures showed similar trends with similar decreases initially,
and increases near the end of the reaction (Figure 4.34). The pH for the reaction did not

80
show similar trends, with the lowest pH found from the R1A samples. The influent and
effluent samples showed the highest pH with the two samples fluctuating between 7.1
and 7.5, while sample port R1A remained near the pH 7 range. Though the pH samples
were different, the changes don’t show major significance to consider them changes due
to microbial effects (Figure 4.34).
0
1
2
3
4
5
6
7
8
9
10
0
5
10
15
20
25
0 20 40 60 80 100 120 140 160 180
pH
Te
mp
era
ture
(C)
Run Time (hours)
Inlet: TemperatureR1A: TemperatureOutlet: TemperatureInlet: pHR1A: pHOutlet: pH
Figure 4.34: pH and Temperature Profile for Experiment CW4
For this continuous experiment, the ammonia and nitrite levels remained low compared
to the nitrate levels. The ammonia concentrations were slightly higher in this reaction,
due to the increased ammonia rich primary effluent added for this reaction (Figure 4.35).
Initially, the increase in nitrate concentration from 19.1 to 23.3 mg/L as N looked
promising and had the potential to be produced by the biofilm attached to the silicone
tubes. Nitrite and ammonia concentrations stayed fairly consistent, and when the
analyzed data for the wastewater traveling through the MABR was compared to the
influent concentrations, the data again looked very similar (Figure 4.35). This leads to
the conclusion that mixing and no microbial activity were occurring within the reactor

81
still. The low concentrations were lower in the influent analysis, but the MABR
concentrations analyzed had been mixed within the reactor but the flow was low enough
to cause potentially a plug flow which would have the nitrate concentration peaks and
valleys corresponding to the influent concentrations.
0
5
10
15
20
25
0 20 40 60 80 100 120 140 160 180
Co
nc
en
tra
tio
n (
mg
/L)
Run Time (hours)
Inlet: Ammonia as N
Inlet: Nitrate as N
Inlet: Nitrite as N
Outlet: Ammonia as N
Outlet: Nitrate as N
Outlet: Nitrite as N
Figure 4.35: Ammonia, Nitrate and Nitrite Curves for Experiment CW4
Confirmation analysis was done again with the Ion Chromatograph, and samples had
nitrate concentrations between 4.79 and 51.3 mg/L as N. These concentrations were
even higher than the samples analyzed using the HACH, and the concentrations seemed
abnormally high. Nitrite concentrations ranged between 0.61 and 2.13 mg/L as N and did
correspond to the nitrite concentration changes during the continuous run, but the
concentrations were still fairly different (Figure 4.36).

82
0
20
40
60
0 20 40 60 80 100 120 140 160 180
Co
nc
en
tra
tio
n (
mg
/L)
Run Time (hours)
Inlet: Nitrate as N
Inlet: Nitrite as N
Outlet: Nitrate as N
Outlet: Nitrite as N
Figure 4.36: Nitrate and Nitrite IC Curves for Experiment CW4
4.3.5 15% Primary, 85 % Nitrified Effluent Experiment CW5 Results
For the final continuous reaction a 15% primary and 85% nitrified effluent mixture was
used, and this reaction lasted for 15 days in order to find out if any steady state could be
reached with the MABR. The average HRT was 28.01 hours, and the average flow rate
was 11.3 mL/min. In order to attempt to decrease the daily fluctuations of the influent
nitrate, nitrite and ammonia concentrations, we began taking larger samples from the
Reclamation Facility and stored them in the laboratory prior to analysis. With this new
method, the temperatures stayed constant, and the pH fluctuated between 7.7 and 6.8,
with the influent pH having the highest pH. The rest of the sample ports and the effluent
line stayed between ph of 7.2 and 6.8 (Figure 4.37).

83
0
1
2
3
4
5
6
7
8
9
10
0
5
10
15
20
25
0 50 100 150 200 250 300 350 400
pH
Te
mp
era
ture
(C)
Run Time (hours)
Inlet: Temperature
R1A: Temperature
R1B: Temperature
R1C: Temperature
Outlet: Temperature
Inlet: pH
R1A: pH
R1B: pH
R1C: pH
Outlet: pH
Figure 4.37: pH and Temperature Profile for Experiment CW5
Using this method to try and control the influent concentrations, the process worked to
control the fluctuating ammonia concentrations. However, nitrate and nitrite
concentrations still had large fluctuations. Nitrate changes were much more severe, and
made analysis of the acquired data much more difficult to analyze the possibility of
differences between the influent fluctuations and the wastewater that had traveled
through the MABR and was hopefully treated (Figure 4.38). Due to the fact that the
ammonia concentrations between the two graphs were very similar, the nitrate peaks
were determined to be due to the influent nitrate concentrations and not due to the
nitrification of the ammonia within the MABR. However, there was still possibility of
denitrification to occur within the reactor. The changes between the initial concentration
of 26.9 mg/L as N at the 37th hour of running and the effluent concentration of 9.91 mg/L
as N at the 64th hour could be due to denitrification within the reactor (Figure 4.38). But
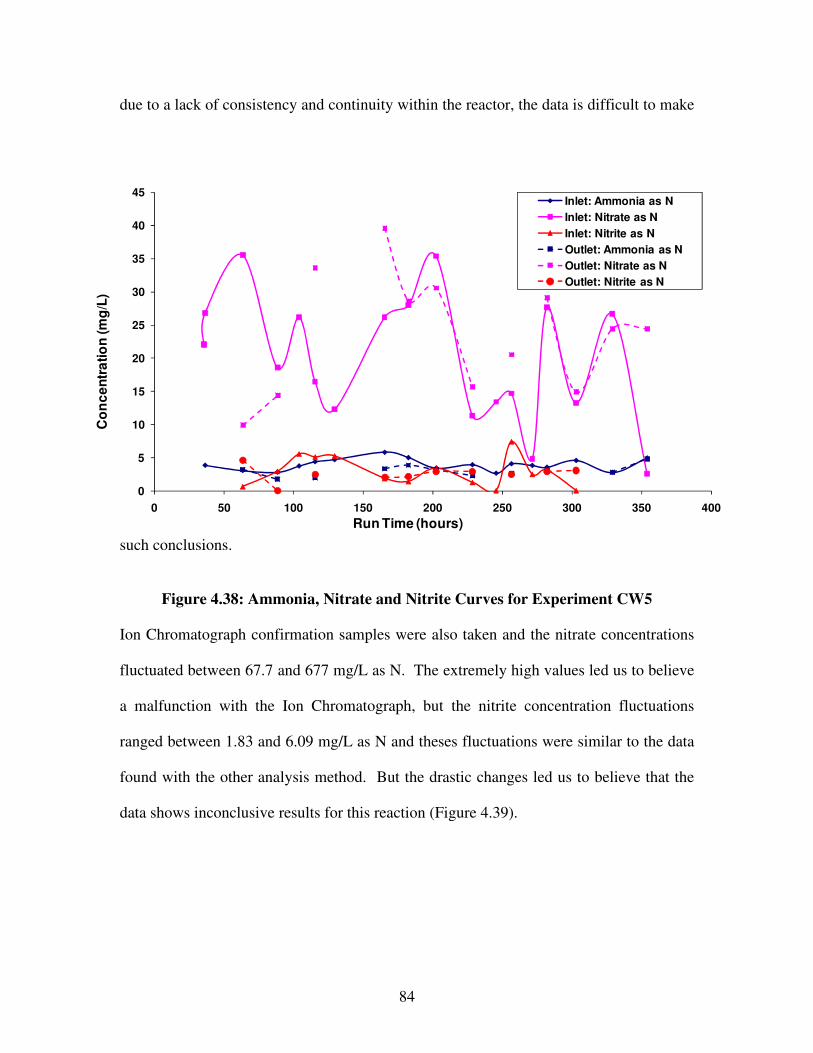
84
due to a lack of consistency and continuity within the reactor, the data is difficult to make
such conclusions.
Figure 4.38: Ammonia, Nitrate and Nitrite Curves for Experiment CW5 Ion Chromatograph confirmation samples were also taken and the nitrate concentrations
fluctuated between 67.7 and 677 mg/L as N. The extremely high values led us to believe
a malfunction with the Ion Chromatograph, but the nitrite concentration fluctuations
ranged between 1.83 and 6.09 mg/L as N and theses fluctuations were similar to the data
found with the other analysis method. But the drastic changes led us to believe that the
data shows inconclusive results for this reaction (Figure 4.39).
0
5
10
15
20
25
30
35
40
45
0 50 100 150 200 250 300 350 400
Co
nc
en
tra
tio
n (
mg
/L)
Run Time (hours)
Inlet: Ammonia as N
Inlet: Nitrate as N
Inlet: Nitrite as N
Outlet: Ammonia as N
Outlet: Nitrate as N
Outlet: Nitrite as N

85
0
250
500
750
0 50 100 150 200 250 300
Co
nc
en
tra
tio
n (
mg
/L)
Run Time (hours)
Inlet: Nitrate as N
Inlet: Nitrite as N
Outlet: Nitrate as N
Outlet: Nitrite as N
Figure 4.39: Nitrate and Nitrite IC Curves for Experiment CW5

86
CHAPTER 5: CONCLUSIONS
5.1 Experimental Conclusions
From the data acquired and analyzed, there is potential for the MABR to successfully
nitrify and denitrify ammonia in a minimal media and wastewater, but the biggest
necessity to acquire better results is to simplify the investigation and try to have more
control of the run experiment that are being used.
The batch experiments at the beginning of the investigation showed positive nitrification
results with initial decreases in ammonia concentrations, and simultaneously increasing
the nitrate concentrations within the reactor. Batch experiment B2 showed the best
results, with an initial ammonia removal of 79% following first-order kinetics. However,
the results were could not be replicated in further experiments.
The continuous – flow experiments also appeared to function successfully, but the
biggest issues with these experiments came with the constant changes of ammonia,
nitrate, and nitrite concentrations and the inability to reach steady state. Experiment C6
had an 86% ammonia degradation during the first half of the experiment, but the nitrate
and nitrite concentrations never had the increases that were hoped for. The minimal
media never maintained a constant concentration during this experiment, and the other
experiments had the same issues. The use of many different growth media ammonia
concentrations eliminated the ability to thoroughly examine a single experiment, and
made analysis difficult.
87
The continuous – flow experiments using municipal wastewater did not show any
analyzable data. The variability of ammonium, nitrate, and nitrite concentrations during
the entire wastewater experiments made analysis almost impossible. The constant
fluctuations could not be controlled, and more research needs to be done to be able to
utilize the MABR for the municipal wastewater studies.
The MABR apparatus also had un-foreseeable problems that added analytical problems
to the investigation. The malfunctioning air-line and the inability to increase the air
pressure due to the designs inability to hold very high pressures limited the investigation
of the effects of changes in air pressure. Reactor optimization needs to be investigated
more thoroughly to better understand the needs for these experiments to take place in
controllable ways.
5.2 Future Research
For future research, the biggest goal is to create experimental scenarios that are more
controlled and understood in all aspects of the reaction. There needs to be more focus on
individual experiment success instead of trying multiple experiments that repeatedly do
not have measureable results. This also includes the importance of reaction optimization.
The MABR experiments have worked before in previous research (Copeland, 2007), but
a greater understanding of individual steps needs to be investigated in greater and slower
detail to find ways for the experiments to work desirably and repeatedly.

88
REFERENCES
American Public Health Association. 1992. Standard Methods for the Examination of
Water and Wastewater. 18th
edition. Washington D.C.: American Public Health
Association.
Brindle, K., T. Stephenson, M. Semmens. 1998. Nitrification and oxygen utilization in a
membrane aeration bioreactor. Journal of Membrane Science 144: 197-209.
Casey, E., B. Glennon, G. Hamer. 1999. Review of membrane aerated biofilm reactors.
Resources, Conservation and Recycling 27: 203-215.
Copeland, M. 2007. Denitrification in a silicone-membrane bioreactor designed for
simultaneous nitrification/denitrification. Graduate research thesis, California State
University, San Luis Obispo.
Environmental Protection Agency. 2006. Consumer factsheet on: nitrates/nitrites.
http://www.epa.gov/OGWDW/dwh/c-ioc/nitrates.html
Franco-Rivera, A., J. Paniagua-Michel, J. Zamora-Castro. 2007. Characterization and
performance of constructed nitrifying biofilms during nitrogen bioremediation of a
wastewater effluent. J Ind Microbial Biotechnology 34:279-287.
Gong, Z., F. Yang, S. Liu, H. Bao, S. Hu, K. Furukawa. 2007. Feasibility of a membrane-
aerated reactor to achieve single-stage autotrophic nitrogen removal based on anammox.
Chemosphere 69: 776-784.
González-Brambila, M., O. Monroy, F. López-Isunza. 2006. Experimental and theoretical
study of membrane-aerated biofilm reactor behavior under different modes of oxygen
supply for the treatment of synthetic wastewater. Chemical Engineering Science 61:
5268-5281.
Grunditz, C., G. Dalhammar. 2001. Development of nitrification inhibition assays using
pure cultures of Nitrosomonas and Nitrobacter. Water Resources 35:433-440.
Hao, X., J. Heijnen, M. Van Loosdrecht. Model-based evaluation of temperature and
inflow variations on a partial nitrification-ANAMMOX biofilm process. Water Research
36:4839-4849
LaPara, T., S. Ghosh. 2006. Population dynamics of the ammonia-oxidizing bacteria in a
full-scale municipal wastewater treatment facility. Environmental Engineering Science
23:309-319.

89
Matsumoto, S., A. Terada, S. Tsuneda. 2007. Modeling of membrane-aerated biofilm:
Effects of C/N ratio, biofilm thickness and surface loading of oxygen on feasibility of
simultaneous nitrification and denitrification. Biochemical Engineering Journal 37: 98-
107.
Matsumoto, S., A. Terada, Y. Aoi, S. Tsuneda, E. Alpkvist, C. Picioreanu. 2007.
Experimental and simulation analysis of community structure of nitrifying bacteria in a
membrane-aerated biofilm. Water Science & Technology 55: 283-290.
Metcalf and Eddy, Inc. Wastewater engineering: treatment and reuse fourth edition. New
York: McGraw Hill, 2003.
Pankhania, M., K. Brindle, T. Stephenson. 1999. Membrane aeration bioreactors for
wastewater treatment: completely mixed and plug-flow operation. Chemical Engineering
Journal 73: 131-136.
Sabumon, P. 2007. Anaerobic ammonia removal in presence of organic matter: a novel
route. Journal of Hazardous Materials
Satoh, H., H. Ono, B. Rulin, J. Kamo, S. Okabe, K. Fukushi. 2004. Macroscale and
microscale analyses of nitrification and denitrification in biofilms attached on membrane-
aerated biofilm reactors. Water Research 38: 1633-1641.
Schmidt, I., O. Sliekers, M. Schmid, E. Bock, J. Fuerst, J. Gijs Kuenen, M. Jetten, M.
Strous. 2003. New concepts of microbial treatment processes for the nitrogen removal in
wastewater. FEMS Microbiology Reviews 27:481-492.
Shin, J., B. Sang, Y. Chung, Y. Choung. 2005. Feasibility study on the removal of nitrous
compounds with a hollow-fiber membrane biofilm reactor. Water Science & Technology
51: 365-371.
Shrestha, N., S. Hadano, T. Kamachi, I. Okura. 2002. Dinitrogen production from
ammonia by Nitrosomonas europaea. Applied Catalysis A: General 237:33-39.
Slade, C., R. Perrin. Form and Style thirteenth edition. Boston: Houghton Mifflin
Company, 2008.
Sliekers, A., N. Derwort, J. Gomez, M. Strous, J. Kuenen, M. Jetten. 2002. Completely
autotrophic nitrogen removal over nitrite in one single reactor. Water Research 36:2475-
2482.
Terada, A., K. Hibiya, J. Nagai, S. Tsuneda, A. Hirata. 2003. Nitrogen removal
characteristics and biofilm analysis of a membrane-aerated biofilm reactor applicable to
high-strength nitrogenous wastewater treatment. Journal of Bioscience and
Bioengineering 95: 170-178.

90
Terada, A., T. Yamamoto, R. Igarashi, S. Tsuneda, A. Hirata. 2006. Feasibility of a
membrane-aerated biofilm reactor to achieve controllable nitrification. Biochemical
Engineering Journal 28: 123-130.
Tsushima, I., Y. Ogasawara, T. Kindaichi, H. Satoh, S. Okabe. 2007. Development of
high-rate anaerobic ammonium-oxidizing (anammox) biofilm reactors. Water Research
41:1623-1634.
Vadivelu, V., J. Keller, Z. Yuan. 2007. Effect of free ammonia on the respiration and
growth processes of an enriched Nitrobacter culture. Water Research 41:826-834.

91
APPENDIX A
Ammonia, Nitrate and Nitrite Calibration Curves
Ammonia Probe Calibration Curve:
y = -25.697x - 26.992R² = 0.9992
-160
-140
-120
-100
-80
-60
-40
-20
0
0 1 2 3 4 5
co
nd
ucti
vit
y (m
V)
ln(concentration)
Ammonia HACH Calibration Curve:
y = 0.0386x + 0.2827R² = 0.9946
0
0.2
0.4
0.6
0.8
1
1.2
1.4
0 5 10 15 20 25 30
Ab
s (6
55
)
NH4 Concentration (mg/L)
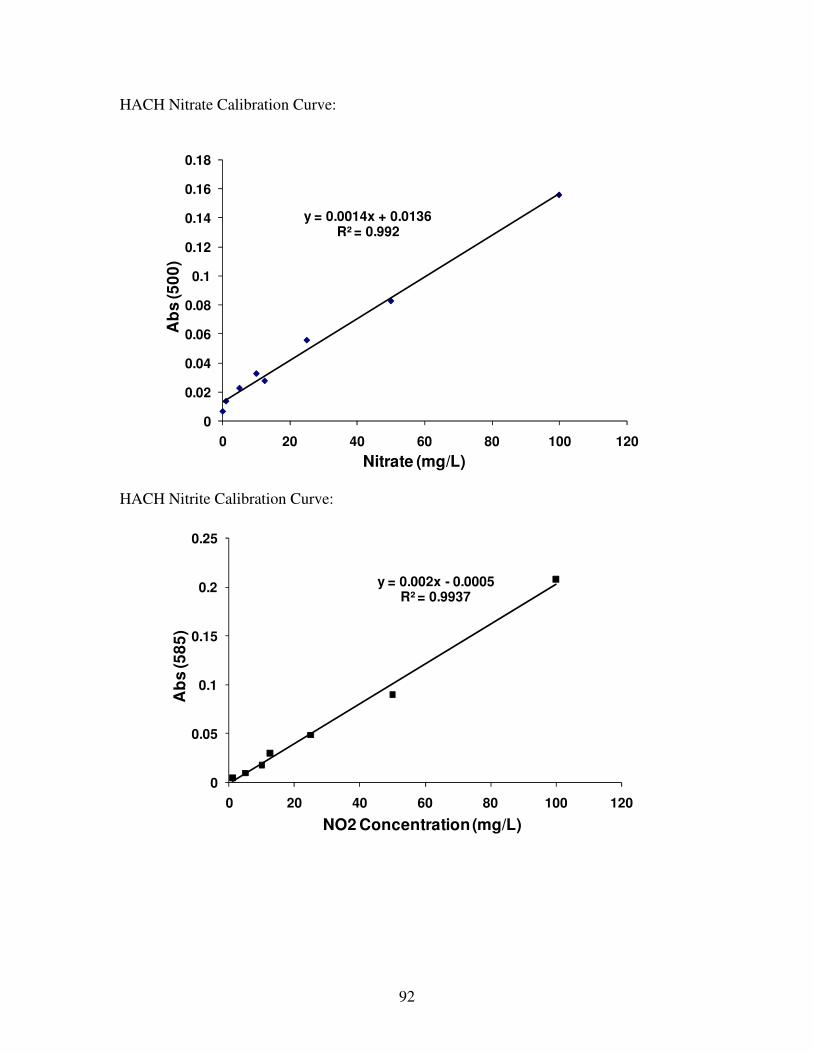
92
HACH Nitrate Calibration Curve:
y = 0.0014x + 0.0136R² = 0.992
0
0.02
0.04
0.06
0.08
0.1
0.12
0.14
0.16
0.18
0 20 40 60 80 100 120
Ab
s (5
00
)
Nitrate (mg/L)
HACH Nitrite Calibration Curve:
y = 0.002x - 0.0005R² = 0.9937
0
0.05
0.1
0.15
0.2
0.25
0 20 40 60 80 100 120
Ab
s (5
85
)
NO2 Concentration (mg/L)
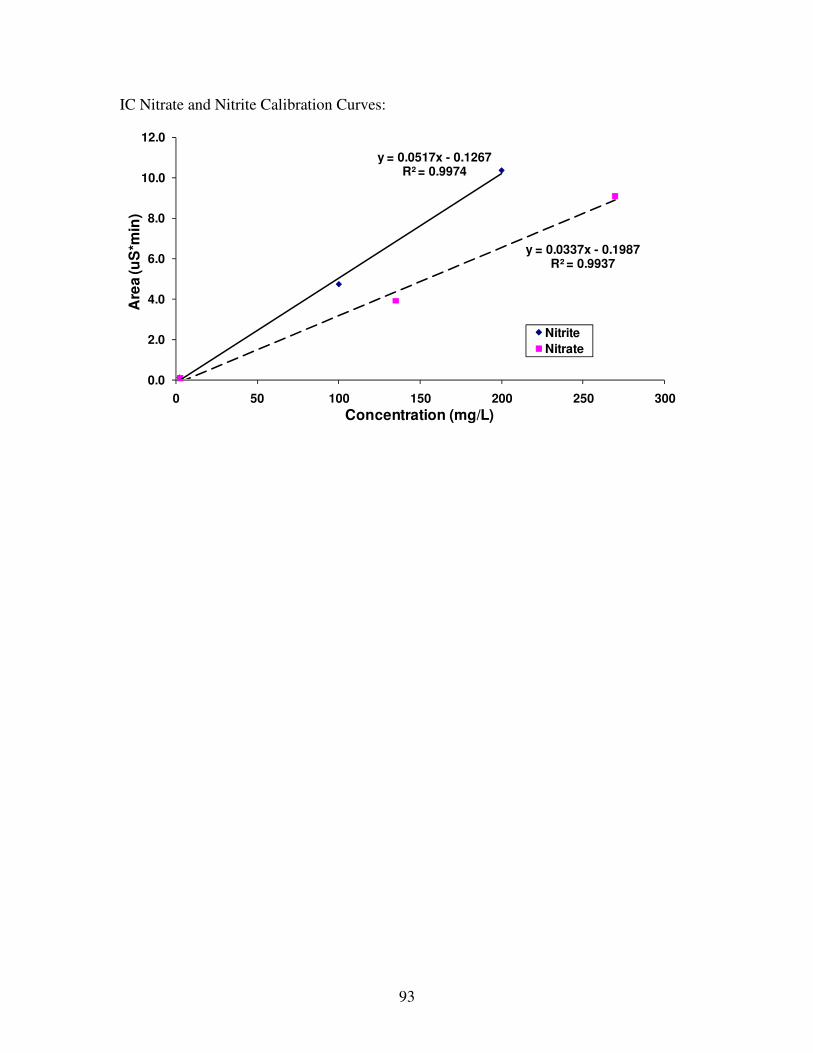
93
IC Nitrate and Nitrite Calibration Curves:
y = 0.0517x - 0.1267R² = 0.9974
y = 0.0337x - 0.1987R² = 0.9937
0.0
2.0
4.0
6.0
8.0
10.0
12.0
0 50 100 150 200 250 300
Are
a (u
S*m
in)
Concentration (mg/L)
Nitrite
Nitrate