simultaneous model predictive control and moving …hespanha/published/mpcmhe-ap_ocam_rev1_ac… ·...
TRANSCRIPT

OPTIMAL CONTROL APPLICATIONS AND METHODSOptim. Control Appl. Meth. 2016; 00:1–15Published online in Wiley InterScience (www.interscience.wiley.com). DOI: 10.1002/oca
Simultaneous Model Predictive Control and Moving HorizonEstimation for Blood Glucose Regulation in Type 1 Diabetes
David A. Copp1˚, Ravi Gondhalekar1, and Joao P. Hespanha1
1University of California, Santa Barbara, CA 93106, U.S.A.
SUMMARY
A new estimation and control approach for the feedback control of an artificial pancreas to treat type 1diabetes mellitus is proposed. In particular, we present a new output feedback predictive control approachthat simultaneously solves the state estimation and control objectives by means of a single min-maxoptimization problem. This involves optimizing a cost function with both finite forward and backwardhorizons with respect to the unknown initial state, unmeasured disturbances and noise, and future controlinputs, and is similar to simultaneously solving a Model Predictive Control (MPC) problem and a MovingHorizon Estimation (MHE) problem. We incorporate a novel asymmetric output cost in order to penalizedangerous low blood-glucose values more severely than less harmful high blood-glucose values. Wecompare this combined MPC/MHE approach to a control strategy that uses state-feedback MPC precededby a Luenberger observer for state estimation. In-silico results showcase several advantages of this newsimultaneous MPC/MHE approach, including fewer hypoglycemic events without increasing the number ofhyperglycemic events, faster insulin delivery in response to meal consumption, and shorter insulin pumpsuspensions, resulting in smoother blood-glucose trajectories.Copyright c© 2016 John Wiley & Sons, Ltd.
Received . . .
KEY WORDS: model predictive control; moving horizon estimation; output feedback control; control ofconstrained systems; optimal control; optimal estimation; artificial pancreas.
1. INTRODUCTION
Type 1 Diabetes Mellitus (T1DM) is a metabolic auto-immune disease that destroys pancreatic β-cells, making it impossible for the pancreas to produce insulin, a hormone the body uses to regulateglucose levels in the blood stream and to facilitate the absorption of glucose into many types of cells.Because of this, people with T1DM require monitoring of Blood-Glucose (BG) levels and deliveryof insulin from an external source. If BG levels are not regulated well, people with T1DM sufferfrom hyperglycemia and hypoglycemia (high and low BG levels, respectively), which can causesevere health problems. An individual who experiences hyperglycemia over long periods of timemay, for example, eventually experience cardiovascular disease, kidney failure, and retinal damage,possibly after many years. Hypoglycemia, on the other hand, may have immediate consequencesranging from dizziness and unconsciousness to possibly even coma or death.
Much recent research has been devoted to the feedback control of an Artificial Pancreas (AP)in order to reduce the burden and improve the effectiveness of T1DM treatment by automatingthe dosing and delivery of insulin [1, 2, 3]. In the AP, it is the job of a feedback controller todetermine appropriate amounts of insulin to be delivered given measurements of BG levels, and
˚Correspondence to: E-mail: [email protected]
Copyright c© 2016 John Wiley & Sons, Ltd.Prepared using ocaauth.cls [Version: 2010/03/27 v2.00]

2 D. A. COPP, R. GONDHALEKAR, J. P. HESPANHA
these closed-loop algorithms have been shown to be much more effective than open-loop insulinadministration in both simulation and clinical trials [4, 5, 6, 7]. This work focuses on control of anAP that delivers insulin using a Continuous Subcutaneous Insulin Infusion (CSII) pump and receivesBG measurements based on a Continuous Glucose Monitor (CGM) [8], as is the case with AP unitsdestined for outpatient use. Given the potentially severe consequences of excessive or insufficientinsulin delivery, the algorithms for feedback control of an AP are crucial for the successful treatmentof T1DM [3, 9].
One of the most popular control approaches for the delivery of insulin using an AP is ModelPredictive Control (MPC) [10, 11, 12]. Given a model of the plant to be controlled and the currentstate of the plant, MPC involves solving an online optimization problem over a future time horizon.This yields a sequence of optimal control inputs to be applied to the plant in the future as well aspredicted states of the plant based on these inputs [13, 14]. Only the first element of the computedinput sequence is applied as an input to the plant, and at each sampling time, this technique isrepeated. MPC has been one of the most successful advanced control methods in many industries,including the feedback control of an AP, because of its ability to explicitly handle hard state andinput constraints. For a survey of MPC applications in industry, see [15].
Classic MPC is formulated assuming full-state feedback. However, this is not practical in mostcontrol problems where only noisy measurements of the state are available. Therefore, a stateestimation scheme is needed to accompany the state feedback controller. Indeed, when designing afeedback controller for an AP, only measurements of a person’s BG from a CGM, which containnoise and delays, are available, so a state estimation strategy is required. Examples of algorithmsfor state estimation include observers, filters, and moving horizon estimation, some of which arediscussed in [16]. Some of the authors’ past work has involved the use of a Luenberger observerfor state estimation with an AP [17, 18, 19, 20]. The performance of this Luenberger observer wascompared to that of Moving Horizon Estimation (MHE) in [21], and it was found that MHE providedbetter state estimates and allowed faster insulin delivery in response to meal consumption. MHE is,in some sense, the dual of MPC and characterizes an estimate of the state by solving an optimizationproblem in real time. The optimization problem is formulated over past measurements and inputs.The use of online optimization in MHE is attractive because constraints can be accommodatedexplicitly.
In this work, we utilize a novel combination of MPC with MHE recently proposed in [22,23]. Specifically, we consider output feedback using a model that explicitly includes additivemeasurement noise and input disturbances, and formulate the combined MPC and MHE problemas a single min-max optimization over both control inputs (min) and the unknown initial state andinput disturbances (max). In this way, we solve both the MPC and MHE objectives simultaneously,which gives us an optimal (in a certain sense) control input sequence at each sampling time forworst-case (in a certain sense) estimates of the current state, disturbances, and noise.
The BG regulation problem exhibits inherent asymmetry, which poses a challenge whendesigning a controller. The asymmetry stems from the fact that hypoglycemia has more immediateand dire consequences than hyperglycemia, insulin can only be delivered, not removed, and,in the single-hormone AP considered here, there is no control action available for increasingBG. Therefore, responding assertively to hyperglycemia and commanding corrective insulin, butnot over-correcting and thereby inducing subsequent hypoglycemia, is a paramount and difficultchallenge. Many AP controllers utilize supervisory control or additional safety logic to address thischallenge. In this work, we propose an appropriate choice of the MPC cost function to address thischallenge with the goal of removing, or at least reducing, the need for additional ad hoc safeguards.Specifically, we consider an asymmetric output cost that penalizes “riskier” low BG values moreseverely than high BG values. Asymmetric output costs have been considered by others in workssuch as [12, 24] but with different implementations.
Our proposed output cost function is not only asymmetric but also assigns very low cost to BGvalues within a safe range in order to regulate BG values to be within that range, rather than trackinga particular set-point, similar to the AP controllers deployed in clinical trials [17, 20, 25]. In thisway, our output cost function enforces a small penalty for BG values within a desired range and
Copyright c© 2016 John Wiley & Sons, Ltd. Optim. Control Appl. Meth. (2016)Prepared using ocaauth.cls DOI: 10.1002/oca

SIMULTANEOUS MPC AND MHE FOR BLOOD GLUCOSE REGULATION IN TYPE 1 DIABETES 3
sharply (asymmetrically) penalizes excursions outside of that range. This approach has provenuseful in AP applications as there exists a set of BG values generally considered to be safe, andit is extremely difficult to obtain accurate physiological models [26, 27, 28]. There is often largeplant-model mismatch due to the significant variability in the physiology of a single individual overtime as well as due to differences between individuals. It is also difficult to accurately model thenoise and delays that are present in the BG measurements provided by a CGM. Therefore, regulatingto a range of BG values is one method to prevent excessive response to changes in the measurementswhen the measured BG level is safely within the desired range.
To demonstrate the differences and benefits of the combined MPC/MHE strategy, in this paperthe results are compared to results from a method that has performed successfully in outpatientclinical trials. The method is a state-feedback MPC strategy that utilizes asymmetric input costs anda Luenberger observer for state estimation and is described in [17]. Throughout the paper, we referto this approach as the MPC/LO method. In [17], the MPC/LO method is augmented with feed-forward control action following user-initiated meal announcement, insulin-on-board constraints[29], diurnal zones and constraints, and other safety features required for clinical trials. One of thegoals of this paper is to show that the novel MPC/MHE method has benefits over the MPC/LOmethod. Towards this goal, we compare the performance of MPC/MHE with that of the basicMPC/LO, and for neither algorithm do we include the safety augmentations mentioned above.While these safety features are currently required for safe execution of an automated system inhuman clinical trials, we omit them here, first, to enable a more direct comparison between theMPC laws without obscuring those differences with the effects of auxiliary safety mechanisms and,second, in order to not obfuscate the exposition of the paper. For example, it would be useful oreven necessary to consider meal announcement or detection for clinical trials; however, even whenmeal announcement or detection is available a controller must be able to handle the more difficultcase of unannounced meals, and meal-boluses and other feed-forward boluses hide or prevent theaction of the control law, making it difficult (or irrelevant) to contrast different control laws. Weleave preparation of this new control and estimation method for clinical deployment (including theincorporation of such techniques as meal detection [30]) as future work. It is thus important to clarifythat the simulation results presented here (for MPC/LO and for MPC/MHE) are not representativeof expected results in trials, since these would require additional, above-mentioned safety features.
We demonstrate the benefits of the proposed MPC/MHE approach by presenting in-silico studiesbased on the commercially available 10-subject Universities of Virginia/Padova (UVA/Padova)metabolic simulator accepted by the United States Food and Drug Administration (USFDA) [31].The in-silico results showcase several advantages of the MPC/MHE approach, including fewerhypoglycemic events without increasing the number of hyperglycemic events, faster insulin deliveryin response to meal consumption, and shorter insulin pump suspensions, resulting in smoother BGtrajectories.
The paper is organized as follows: We present the control-relevant model, desired BG range, andinput constraints in Section 2. In Section 3 we describe our combined MPC/MHE estimation andcontrol approach and compare it to a simplified version of the approach from [17] utilizing state-feedback MPC with a Luenberger observer as state estimator. In Section 4 we compare the results ofthe two estimation and control approaches and discuss the advantages of the MPC/MHE approach.Finally, we conclude with closing remarks in Section 5.
2. PROBLEM FORMULATION
2.1. Insulin-glucose transfer function
Because it is difficult to derive accurate models, and because there are long delays andsignificant noise in the CGM measurements, accurate estimation and effective control for anAP is exceptionally challenging. We use the control-relevant model proposed in [27], which hassuccessfully been employed in AP controller design in [17, 20]. The model is a discrete-time lineartime-invariant (LTI) system with sample period Ts “ 5 minutes. Denoting the current time by t, the
Copyright c© 2016 John Wiley & Sons, Ltd. Optim. Control Appl. Meth. (2016)Prepared using ocaauth.cls DOI: 10.1002/oca

4 D. A. COPP, R. GONDHALEKAR, J. P. HESPANHA
scalar plant input is the administered insulin bolus uIN,t [U] delivered per sample period, and thescalar plant output is the subject’s BG value yBG,t [mg/dL]. The plant is linearized around a steady-state that is assumed to result in a BG output ys “ 110 [mg/dL] when applying the subject-specific,basal input rate uBASAL [U/hour].
The input ut and output yt of the LTI model are defined as
ut – uIN,t ´ uBASAL ˆTs
60min{hour , yt – yBG,t ´ ys.
Denoting z´1 as the backwards shift operator, we write Upz´1q and Ypz´1q for the z-transformsof the time-domain signals of input ut and output yt, respectively. The transfer function from u to yis given by
Ypz´1q
Upz´1q“
1800g
uTDIˆ
z´3
p1´ p1z´1qp1´ p2z´1q2(1)
with poles p1 “ 0.98, p2 “ 0.965, the subject-specific total daily insulin amount uTDI [U], and withthe constant
g – ´90p1´ p1qp1´ p2q2
employed to set the correct gain and for unit conversion. The number 1800 comes from the “1800rule” to estimate BG decrease with respect to delivering rapid-acting insulin [32].
2.2. State-space model
For control, we utilize a state-space model of the form
xt`1 “ Axt `But `Ddt yt “ Cxt ` nt, (2)
with
A –
»
–
p1 ` 2p2 ´2p1p2 ´ p22 p1p
22
1 0 00 1 0
fi
fl P R3ˆ3
B –1800guTDI
“
1 0 0‰JP R3
D – ´B{10 P R3
C –“
0 0 1‰
P R1ˆ3.
The state is xt P R3. The inputs are the control input ut that belongs to the set U Ă R, and theunmeasured disturbance dt that is assumed to belong to a set D Ă R. The measurement noise ntbelongs to the set N Ă R. The nominal system ((2) without dt and nt) is an equivalent realizationof (1). We have included noise and disturbance terms nt and dt, respectively, in order to explicitlyaccount for model uncertainty, additive disturbances, and sensor noise. The matrix D is chosen toallow the disturbance to affect the state an order of magnitude smaller, and in the opposite way, thanthe insulin delivered as the control input does. Therefore, a positive disturbance d induces a rise inmodeled BG output, akin to the consumption of carbohydrates.
2.3. Desired blood-glucose range
In the MPC/LO approach that we compare with, a range of desired BG values, i.e., the BG valuesgenerally considered safe and for which delivering the insulin basal rate is appropriate, is considered.This range is rr, rs mg/dL, where r “ 80 and r “ 140, the same as in [4, 27]. For simplicity, therange is time-invariant, in contrast to [17, 20]. In order to implement this range in the controller, BGvalues are penalized according to the range excursion Z : RÑ R defined as
Zpyq – arg minαPR
tα2|y ` ys ´ α P rr, rsu. (3)
Copyright c© 2016 John Wiley & Sons, Ltd. Optim. Control Appl. Meth. (2016)Prepared using ocaauth.cls DOI: 10.1002/oca
SIMULTANEOUS MPC AND MHE FOR BLOOD GLUCOSE REGULATION IN TYPE 1 DIABETES 5
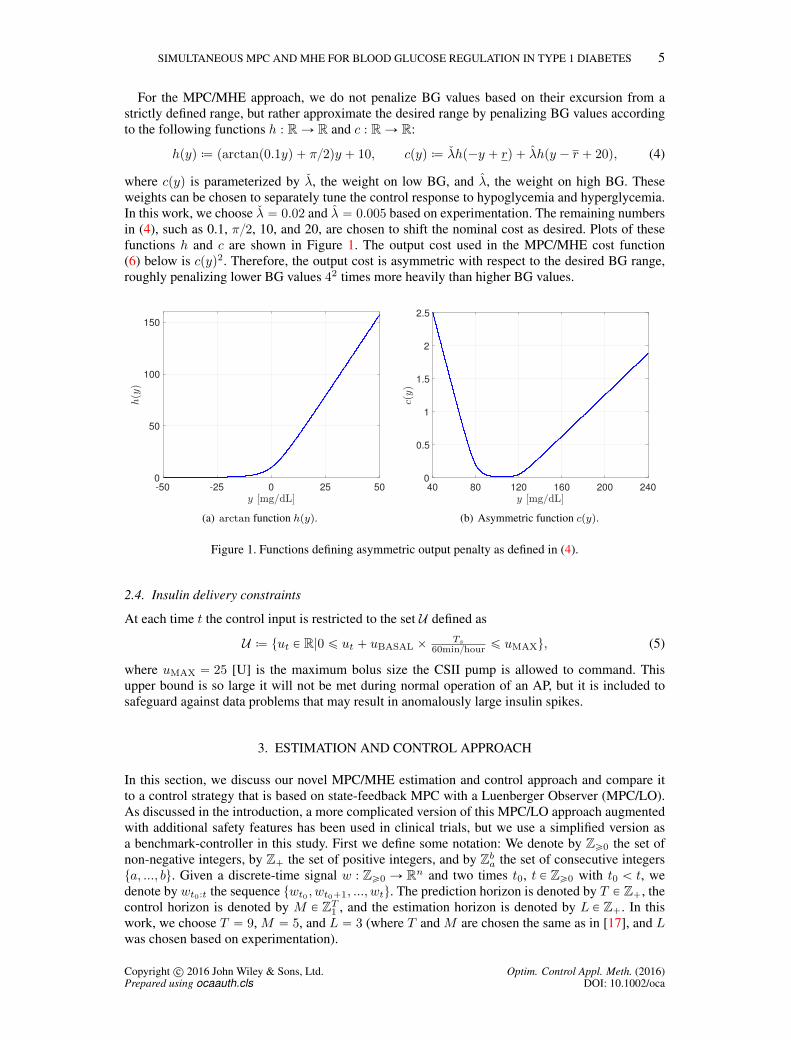
For the MPC/MHE approach, we do not penalize BG values based on their excursion from astrictly defined range, but rather approximate the desired range by penalizing BG values accordingto the following functions h : RÑ R and c : RÑ R:
hpyq – parctanp0.1yq ` π{2qy ` 10, cpyq – λhp´y ` rq ` λhpy ´ r ` 20q, (4)
where cpyq is parameterized by λ, the weight on low BG, and λ, the weight on high BG. Theseweights can be chosen to separately tune the control response to hypoglycemia and hyperglycemia.In this work, we choose λ “ 0.02 and λ “ 0.005 based on experimentation. The remaining numbersin (4), such as 0.1, π{2, 10, and 20, are chosen to shift the nominal cost as desired. Plots of thesefunctions h and c are shown in Figure 1. The output cost used in the MPC/MHE cost function(6) below is cpyq2. Therefore, the output cost is asymmetric with respect to the desired BG range,roughly penalizing lower BG values 42 times more heavily than higher BG values.
-50 -25 0 25 50
0
50
100
150
(a) arctan function hpyq.
40 80 120 160 200 240
0
0.5
1
1.5
2
2.5
(b) Asymmetric function cpyq.
Figure 1. Functions defining asymmetric output penalty as defined in (4).
2.4. Insulin delivery constraints
At each time t the control input is restricted to the set U defined as
U – tut P R|0 ď ut ` uBASAL ˆTs
60min{hour ď uMAXu, (5)
where uMAX “ 25 [U] is the maximum bolus size the CSII pump is allowed to command. Thisupper bound is so large it will not be met during normal operation of an AP, but it is included tosafeguard against data problems that may result in anomalously large insulin spikes.
3. ESTIMATION AND CONTROL APPROACH
In this section, we discuss our novel MPC/MHE estimation and control approach and compare itto a control strategy that is based on state-feedback MPC with a Luenberger Observer (MPC/LO).As discussed in the introduction, a more complicated version of this MPC/LO approach augmentedwith additional safety features has been used in clinical trials, but we use a simplified version asa benchmark-controller in this study. First we define some notation: We denote by Zě0 the set ofnon-negative integers, by Z` the set of positive integers, and by Zba the set of consecutive integersta, ..., bu. Given a discrete-time signal w : Zě0 Ñ Rn and two times t0, t P Zě0 with t0 ă t, wedenote by wt0:t the sequence twt0 , wt0`1, ..., wtu. The prediction horizon is denoted by T P Z`, thecontrol horizon is denoted by M P ZT1 , and the estimation horizon is denoted by L P Z`. In thiswork, we choose T “ 9, M “ 5, and L “ 3 (where T and M are chosen the same as in [17], and Lwas chosen based on experimentation).
Copyright c© 2016 John Wiley & Sons, Ltd. Optim. Control Appl. Meth. (2016)Prepared using ocaauth.cls DOI: 10.1002/oca

6 D. A. COPP, R. GONDHALEKAR, J. P. HESPANHA
3.1. Combined MPC and MHE
Our estimation and control approach combines MPC and MHE as discussed in [22, 23], wherethe MPC and MHE optimization objectives are incorporated within a single min-max optimizationproblem, the solution of which simultaneously characterizes solutions to the MHE and MPC sub-problems. We formulate the MPC/MHE problem as a finite-horizon min-max optimization problem,to be solved at each time t, of the form
minut:t`M´1
maxxt´L,
dt´L:t`T´1
Jtpxt´L, ut´L:t´1, ut:t`M´1, dt´L:t`T´1, nt´L:tq (6)
with cost function
Jtp¨q –
t`Tÿ
k“t`1
cpCxkq2 `
t`M´1ÿ
k“t
λuu2k ´
t`T´1ÿ
k“t´L
λdd2k ´
tÿ
k“t´L
λnn2k, (7)
and subject to
xk`1 “ Axk `Buk `Ddk @k P Zt`T´1t´L (8a)
yk “ Cxk ` nk @k P Ztt´L (8b)
dk P D @k P Zt`T´1t´L (8c)
uk P U @k P Zt`M´1t (8d)
uk “ 0 @k P Zt`T´1t`M (8e)
where λu, λd, and λn are positive scalar weights on the control input u, disturbance d, andmeasurement noise n, respectively. In this work, we choose these weights to be λu “ 2, λd “ 2,and λn “ 300. The running cost cp¨q is given in (4) and shown in Figure 1(b).
Equations (8a)-(8b) enforce the dynamics of the model (2). Equations (8c) and (8d) enforce thatthe input disturbance and control input belong to the constraint sets D and U (as defined in (5)),respectively. In this work, we define the constraint set D – td P R|0 ď d ď 0.5u. A disturbance ofd “ 0.5 would counteract the effects of delivering 0.05 [U] insulin (which turns out to be slightlymore than the standard deviation from the mean insulin delivered using the MPC/MHE approachshown later in Figure 3). Lastly, equation (8e) ensures that, beyond the control horizon M , the basalrate uBASAL is delivered.
The criterion defined in (7) depends on the unknown initial state xt´L, the unknown disturbanceinput sequence dt´L:t`T´1, the measured output sequence yt´L:t via the cost on nt´L:t, andthe control input sequence ut´L:t`M´1. The control input sequence is composed of two distinctsequences: the (known) past inputs ut´L:t´1 that have already been applied, and the futureinputs ut:t`M´1 that need to be characterized. To select the future inputs ut:t`M´1, we optimize(minimize) the criterion (7) with respect to these variables, akin to standard MPC. At a given timet P Zě0, we do not know the values of xt´L and dt´L:t`T´1 (and nt´L:t, which depend on these),so we optimize the criterion under worst-case assumptions on these variables (i.e., maximize (7)).The optimization (6) is repeated at each time step, i.e., every Ts “ 5 minutes.
The last two terms in (7) involving dk and nk penalize large or unlikely values for the disturbancesand noise in the same way that the second term involving uk penalizes large control inputs. Thescalar weights λu, λd, and λn can be tuned to provide the most effective penalties as well as to ensurethat there exists a saddle-point solution to the min-max optimization problem (6). For more detailson the formulation and stability of this MPC/MHE approach, we refer the reader to [22, 23, 33].
As is common in MPC, at each time t, we use as the control input the first element of the sequence
u˚t:t`M´1 “ tu˚t , u
˚t`1, u
˚t`2, . . . , u
˚t`M´1u
that minimizes (6), leading to the following control law:
ut “ u˚t , @t P Zě0. (9)
Copyright c© 2016 John Wiley & Sons, Ltd. Optim. Control Appl. Meth. (2016)Prepared using ocaauth.cls DOI: 10.1002/oca

SIMULTANEOUS MPC AND MHE FOR BLOOD GLUCOSE REGULATION IN TYPE 1 DIABETES 7
At each time t, after the solution to (6) is computed, the control input commanded to the pump is thevalue of u˚t rounded down to the nearest integer multiple of the CSII pump-discretization of 0.05[U] [17]. The portion that is removed when rounding down is then added to the control commandgiven at time t` 1 in a so-called carry-over scheme, which is precisely described in [17].
More details and theoretical results regarding this approach to combine MPC with MHE can befound in [22, 23]. A particular primal-dual-like interior-point method was developed by the authorsto numerically solve these optimization problems, and details about this method can be found in[23]. In addition, this MPC/MHE approach allows for the estimation of unknown or uncertain modelparameters [34]. Therefore, future work could involve the learning of unknown parameters in themodel (2) for, e.g., patient specific (personalized) treatment.
3.2. State-feedback MPC and Luenberger Observer
For completeness, we now give a brief overview of the simplified asymmetric MPC/LO approachthat we use for comparison. The full MPC/LO approach used in clinical trials is described in detail in[17]. The purpose of this work is to investigate the benefits of the proposed MPC/MHE method withthe simplest possible comparison to an existing AP control method; therefore, the version of thisMPC/LO approach with which we compare does not include several important safety features thatare included in [17] for deployment in clinical trials. These additional features are diurnal BG targetranges and constraints, feed-forward control action following user-initiated meal-announcement,and insulin-on-board constraints. For more details on these additional features of the MPC/LOapproach and its performance in trials, we refer the interested reader to [17, 6].
The main conceptual difference between this MPC/LO approach and the MPC/MHE approachdescribed above is that the MPC/MHE approach employs output-feedback, whereas the MPC/LOapproach is based on state-feedback. State-feedback control is dependent upon the state estimatorwhose function is independent of, and unrelated to, the control design. In the MPC/MHE approach,the state estimate and control are computed simultaneously, so they directly affect each other andyield an input that is designed for a worst-case cost outcome. Another difference is that withMPC/LO the asymmetric cost is on the control input rather than the predicted output as withMPC/MHE. This is meant to facilitate decoupled design of the control response to hypoglycemiaand hyperglycemia, whereas the asymmetry on the output in the MPC/MHE approach allows boththe minimizer and the maximizer to affect the result asymmetrically because the predicted outputdepends on both u and d. Finally, neither disturbances nor noise are explicitly considered in thisMPC/LO approach.
The state estimate xt that is used for control in the MPC/LO approach is found using a linearrecursive state estimator known as a Luenberger observer (see, e.g., [35]). This state estimator isgiven by
xt`1 “ Axt `Kpyt ´ ytq `But, yt “ Cxt, (10)
where the gain K is designed as in [17].We formulate the asymmetric MPC/LO problem as a finite-horizon optimization problem, to be
solved at each time t, of the form
minut:t`M´1
Jtpxt, ut:t`M´1q (11)
with cost function
Jtp¨q –
t`Tÿ
k“t`1
z2k `t`M´1ÿ
k“t
´
Ru2k ` Ru2k
¯
, (12)
and subject to
xt “ xt (13a)
xk`1 “ Axk `Buk @k P Zt`T´1t (13b)
Copyright c© 2016 John Wiley & Sons, Ltd. Optim. Control Appl. Meth. (2016)Prepared using ocaauth.cls DOI: 10.1002/oca

8 D. A. COPP, R. GONDHALEKAR, J. P. HESPANHA
yk “ Cxk @k P Zt`Tt (13c)
uk P U @k P Zt`M´1t (13d)
uk “ 0 @k P Zt`T´1t`M (13e)
uk “ maxpuk, 0q @k P Zt`M´1t (13f)
uk “ minpuk, 0q @k P Zt`M´1t (13g)
zk “ Zpykq @k P ZTt`1 (13h)
where R and R are positive scalar weights on the non-negative and non-positive control inputs,respectively. As in [17], we choose the weights to be R “ 7000 and R “ 100 in order toconservatively respond to hyperglycemia while encouraging pump attenuation in response topredicted hypoglycemia. As before, only the first element u˚t of the predicted optimal insulintrajectory is commanded to the pump, and the optimization (11) is repeated at each time step, i.e.,every Ts “ 5 minutes.
Equation (13a) enforces that the initial state is defined as the state estimate from the Luenbergerobserver (10). Equations (13b)-(13c) enforce the dynamics of the model (2) without consideringdisturbances or noise. Equation (13d) enforces that the control input belongs to the constraint setU (as defined in (5)). Equation (13e) ensures that, beyond the control horizon M , the basal rateuBASAL is delivered. Equations (13f)-(13g) facilitate an asymmetric input cost and provide positiveand negative deviations of the input uk from uBASAL. Finally, (13h) provides the cost for outputexcursions from the desired BG range, where Zpykq is defined in (3).
Figure 2 shows the input and output costs used in both the MPC/MHE approach and the MPC/LOapproach.
Blood glucose [mg/dL]50 100 150 200
OutputCost
0
1
2
3
4
5
70-180 [mg/dL]80-140 [mg/dL]MPC/MHEMPC/LO
(a) Output costs. The desired and admissible BG rangesare shown in green and yellow, respectively, for reference.
Insulin [U/5min]-0.15 -0.1 -0.05 0 0.05 0.1
InputCost
0
0.5
1
1.5
2
MPC/MHE×50MPC/LO
(b) Input costs. The MPC/MHE input cost is multiplied by50 for comparison because R{λu “ 50.
Figure 2. Output and input costs for MPC/MHE and MPC/LO as given in the first and second terms of (7)and (12), respectively.
In general, solving the optimization problems corresponding to MPC formulations can benontrivial. Fortunately, the optimization problem corresponding to the MPC/LO approach canbe formulated and solved as a quadratic program, and the clinical version of the controller hasbeen implemented and tested on a tablet computer during clinical trials; for details, see [17]. TheMPC/MHE approach can be solved very efficiently using a primal-dual-like interior-point methodpresented in [23]. In both cases, the sample-period Ts “ 5 minutes is sufficiently long (excessive bymultiple orders of magnitude) to compute a solution to the optimization problems.
Copyright c© 2016 John Wiley & Sons, Ltd. Optim. Control Appl. Meth. (2016)Prepared using ocaauth.cls DOI: 10.1002/oca
SIMULTANEOUS MPC AND MHE FOR BLOOD GLUCOSE REGULATION IN TYPE 1 DIABETES 9
4. SIMULATION STUDY
The efficacy of this combined MPC/MHE estimation and control approach is demonstrated via in-silico trials of 10 virtual subjects using the commercially available UVA/Padova USFDA acceptedmetabolic simulator [31]. While we do not present formal stability proofs for either approach inthis work, we note that in all simulations performed and presented using the UVA/Padova metabolicsimulator resulted in stable behavior. Simulations: start at 14:00 and are 28 hours in duration. Thesimulations begin with two hours of open-loop until 16:00 when the feedback controller is turnedon, and simulations run in closed-loop until 18:00 the next day. Every simulation includes three90 gram carbohydrate (gCHO) meals consumed at 18:30, 07:00, and 13:00, respectively. For mostpeople, 90 gCHO constitutes a large meal, and it happens to be the largest meal allowed in theclinical protocol of [6]. The parameters of both the simulator and controller are time-invariant, sothe time of day of meal consumption is irrelevant. We only consider the most challenging case ofunannounced meals, meaning the controller has no information about when a meal is consumed,or how large any consumed meal is, and therefore the meal-disturbance is rejected based on CGMfeedback only. To further stress the controller, the UVA/Padova simulator includes subjects withparameter values that may be considered beyond the spectrum of plausible values.
We consider a total of 110 simulations. All 10 subjects in the commercially available UVA/Padovametabolic simulator are simulated 11 times: 10 times with different seeds for random CGM additivesensor noise and once with no additive sensor noise. Even without additive sensor noise, the CGMmeasurements are subject to dynamics and delays that cause it to differ from the true (simulated)BG values. For more details, see [31]. We make no assumptions about the CGM measurement noise,which is, in general, neither zero-mean nor Gaussian. Therefore, we do not introduce constraints onthe measurement noise but simply penalize it according to the last term in (7).
4.1. Comparison of MPC/MHE and MPC/LO
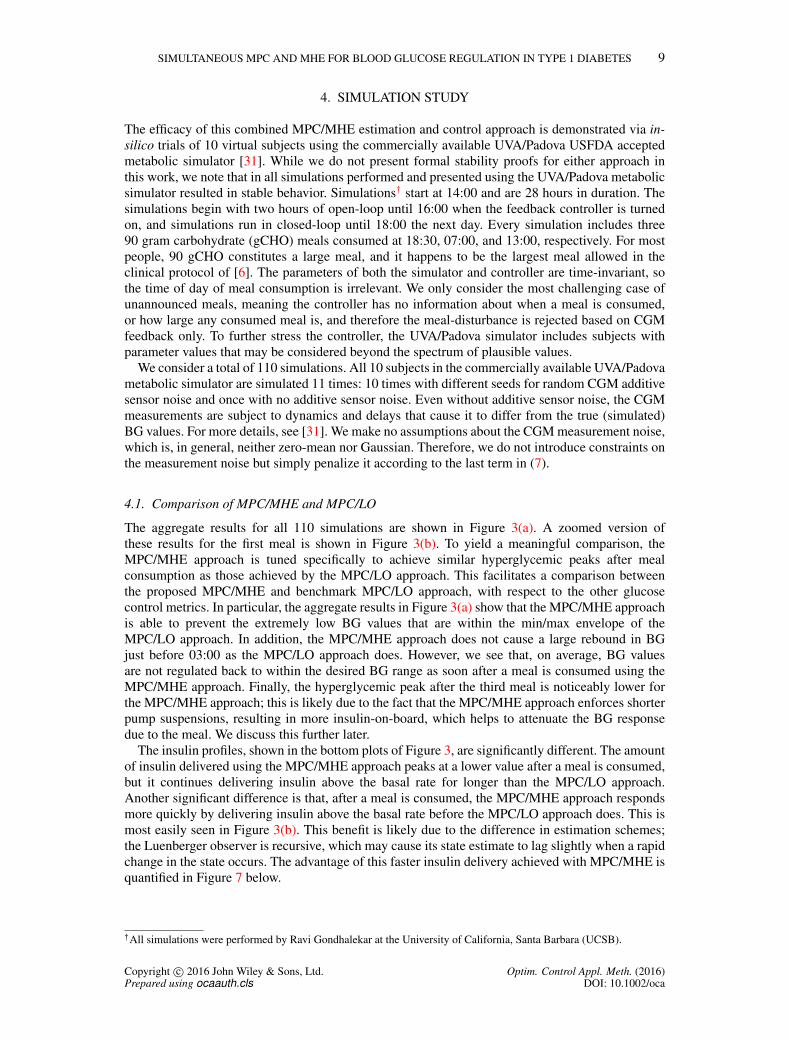
The aggregate results for all 110 simulations are shown in Figure 3(a). A zoomed version ofthese results for the first meal is shown in Figure 3(b). To yield a meaningful comparison, theMPC/MHE approach is tuned specifically to achieve similar hyperglycemic peaks after mealconsumption as those achieved by the MPC/LO approach. This facilitates a comparison betweenthe proposed MPC/MHE and benchmark MPC/LO approach, with respect to the other glucosecontrol metrics. In particular, the aggregate results in Figure 3(a) show that the MPC/MHE approachis able to prevent the extremely low BG values that are within the min/max envelope of theMPC/LO approach. In addition, the MPC/MHE approach does not cause a large rebound in BGjust before 03:00 as the MPC/LO approach does. However, we see that, on average, BG valuesare not regulated back to within the desired BG range as soon after a meal is consumed using theMPC/MHE approach. Finally, the hyperglycemic peak after the third meal is noticeably lower forthe MPC/MHE approach; this is likely due to the fact that the MPC/MHE approach enforces shorterpump suspensions, resulting in more insulin-on-board, which helps to attenuate the BG responsedue to the meal. We discuss this further later.
The insulin profiles, shown in the bottom plots of Figure 3, are significantly different. The amountof insulin delivered using the MPC/MHE approach peaks at a lower value after a meal is consumed,but it continues delivering insulin above the basal rate for longer than the MPC/LO approach.Another significant difference is that, after a meal is consumed, the MPC/MHE approach respondsmore quickly by delivering insulin above the basal rate before the MPC/LO approach does. This ismost easily seen in Figure 3(b). This benefit is likely due to the difference in estimation schemes;the Luenberger observer is recursive, which may cause its state estimate to lag slightly when a rapidchange in the state occurs. The advantage of this faster insulin delivery achieved with MPC/MHE isquantified in Figure 7 below.
:All simulations were performed by Ravi Gondhalekar at the University of California, Santa Barbara (UCSB).
Copyright c© 2016 John Wiley & Sons, Ltd. Optim. Control Appl. Meth. (2016)Prepared using ocaauth.cls DOI: 10.1002/oca

10 D. A. COPP, R. GONDHALEKAR, J. P. HESPANHA
Bloodgluco
se[m
g/dL]
80
160
240
320
400
Mean STD MinMax [80,140] mg/dL [70,180] mg/dL
Insu
lindelivery[U
/5min]
Time of day [h]18:00 21:00 00:00 03:00 06:00 09:00 12:00 15:00 18:00
0
0.1
0.2
0.3
0.4
0.5
(a) Entire simulation. The red vertical bars at 18:30, 07:00, and 13:00 indicate times a 90 gCHO meal is consumed.
Bloodgluco
se[m
g/dL]
80
160
240
320
400
Mean STD MinMax [80,140] mg/dL [70,180] mg/dL
Insu
lindelivery[U
/5min]
Time of day [h]19:00 20:00 21:00 22:00 23:00 00:00
0
0.1
0.2
0.3
0.4
0.5
(b) First meal response.
Figure 3. Aggregate results of all 110 simulations for the MPC/MHE approach (blue) and the MPC/LOapproach (red). The top sub-plots show the mean BG trajectory as well as its standard deviation andminimum/maximum envelope. The bottom sub-plots show the mean insulin delivered as well as its standard
deviation and minimum/maximum envelope.
These features can also be seen, perhaps more clearly, in Figure 4, which shows results for anindividual subject for both the MPC/MHE approach and the MPC/LO approach. This particularlychallenging virtual subject was chosen to highlight the differences between the approaches. Forboth the MPC/MHE and MPC/LO approaches, Figure 4 shows the actual BG trajectories in the topplot and the insulin delivered in the bottom plot. The MPC/MHE approach tends to keep BG levelsslightly higher but effectively mitigates the extreme hypoglycemia experienced using the MPC/LOapproach. The MPC/LO approach clearly suspends the pump (i.e., delivers 0 [U] of insulin) muchlonger than the MPC/MHE approach in the face of impending hypoglycemia. This results in a largerrebound in the BG for the MPC/LO approach after 00:00 as well as a higher peak after the third
Copyright c© 2016 John Wiley & Sons, Ltd. Optim. Control Appl. Meth. (2016)Prepared using ocaauth.cls DOI: 10.1002/oca

SIMULTANEOUS MPC AND MHE FOR BLOOD GLUCOSE REGULATION IN TYPE 1 DIABETES 11
Bloodglucose
[mg/dL]
80
160
240
320
400
[70,180] mg/dL [80,140] mg/dL Meal MPCMHE MPC/LO
Time of day [h]18:00 21:00 00:00 03:00 06:00 09:00 12:00 15:00
Insulindelivery[U
/5min]
0
0.1
0.2
0.3
0.4
0.5
Figure 4. Results for Subject #7 with random additive noise seed 2. The top plot shows the BG for both theMPC/MHE approach (blue solid) and the MPC/LO approach (red dashed). Similarly, the bottom plot shows
the insulin delivered for each approach as well as the basal insulin rate (green solid).
meal. Finally, the bottom plot shows that the MPC/MHE approach commands insulin to be deliveredabove the basal rate earlier than the MPC/LO approach after meal consumption.
Another way to present aggregate performance of a controller for the AP problem is to considerControl-Variability Grid Analysis (CVGA) plots as described in [36]. Figures 5(a) and 5(b) show theCVGA plots for our MPC/MHE approach as well as the MPC/LO approach, respectively, for all 110simulations. The black dots represent each simulation’s minimum (horizontal axis) and maximum(vertical axis) BG values with the highest and lowest 2.5% removed. The large blue dot denotesthe arithmetic mean of the individual black dots, and the blue circle has a radius of the standarddeviation of the distances of each individual dot.
The CVGA plots in Figure 5 show that our MPC/MHE approach has a mean value that is shiftedto the left and just slightly higher than the mean value of the MPC/LO approach. This means thatour MPC/MHE approach is effective at keeping subjects from experiencing dangerously low BGlevels with the caveat that they may experience slightly higher glucose levels on average. Thiscomparison is easy to see in Figure 4 for a single subject. In addition, the standard deviation for theMPC/MHE approach is significantly smaller than the standard deviation for the MPC/LO approach.A reduction in the CVGA standard deviation implies that the same controller is affected less byinter-subject variability. The resulting number of simulations in each of the CVGA zones, as wellas the mean and standard deviation values, are given in Table I for both approaches. These statisticsindicate that the MPC/LO approach has 11 black dots in the upper right-hand corner superimposed.
4.2. Quantifying these results
In this section we quantify the advantages of using the MPC/MHE approach over the MPC/LOapproach. Specifically, the MPC/MHE approach results in: 1) fewer hypoglycemic events with thesame number of hyperglycemic events, 2) fewer and shorter insulin pump suspensions, helpingto smooth BG trajectories, and 3) accelerated insulin delivery in response to meal consumption.The main drawback of using the MPC/MHE approach is that the BG values are slightly higher onaverage.
Table I contains the aggregate results for both approaches. The first set of rows shows the time-in-range percentages of two BG intervals and several thresholds. As we noted before, the MPC/LOapproach keeps the BG within the desired range a larger percentage of the time and also results
Copyright c© 2016 John Wiley & Sons, Ltd. Optim. Control Appl. Meth. (2016)Prepared using ocaauth.cls DOI: 10.1002/oca

12 D. A. COPP, R. GONDHALEKAR, J. P. HESPANHA
Upper C Upper D E
Upper B B Lower D
A Lower B Lower C
Lower 95% confidence bound [mg/dL]
Upper
95%
confiden
cebound[m
g/dL]
>110 90 70 <50 <110
180
300
>400
(a) MPC/MHE. Number of 110 simulations in each zone(A,B,C,D,E)=(0,64,33,7,6).
Upper C Upper D E
Upper B B Lower D
A Lower B Lower C
Lower 95% confidence bound [mg/dL]>110 90 70 <50
(b) MPC/LO. Number of 110 simulations in eachzone (A,B,C,D,E)=(0,64,32,2,12). Several points aresuperimposed, e.g., in zone E.
Figure 5. CVGA plots for 110 simulations. The circles are centered on the mean with radius equal to thestandard deviation. Related statistics are provided in Table I.
in less time above hyperglycemic values. The MPC/MHE approach, on the other hand, results insignificantly less time below hypoglycemic thresholds. Both approaches may be tuned to adjustthese values, but in this work, we tuned the MPC/MHE approach specifically to achieve comparablehyperglycemic peaks as the MPC/LO approach in order to contrast other features of the controllers.
The second set of rows in Table I list the number of simulations for which BG values are aboveor below several thresholds. The corresponding number of subjects (out of the 10 subjects in thesimulator) that experience those BG values are given in parentheses. The third set of rows liststhe number of events for which BG values are above or below those same thresholds. The twocontrol strategies were tuned to achieve close to equal BG peaks after meal consumption, andtherefore the two approaches’ control performance with respect to hyperglycemic statistics are verysimilar. However, using the MPC/MHE approach results in half as many simulations experiencinghypoglycemia of less than 60 [mg/dL] and far fewer hypoglycemic events. Histograms for thenumber of hyperglycemic and hypoglycemic events are given in Figure 6(a).
The fourth set of rows in Table I shows the number of pump suspensions that last longer thanparticular lengths of time. A histogram of these results is shown in Figure 6(b). The MPC/MHEapproach results in fewer suspensions of lengths greater than 15 and 30 minutes and results in nopump suspensions longer than 60 minutes. This is an advantage because, while suspending the pumpis important in order to attenuate predicted hypoglycemic BG values and safeguard from dangerousoutcomes, long pump suspensions can deteriorate overall performance as less insulin is present inthe body, causing BG values to rebound or peak higher after a meal is consumed. Both of theseissues can be seen in the aggregate results in Figure 3(a) and the individual results in Figure 4 wherea long pump suspension, as commanded by the MPC/LO approach, causes BG values to reboundafter the first meal and peak higher after the third meal.
The fifth set of rows in Table I gives the number of UCSB Health Monitoring System (HMS)alarms [37] and number of simulations that experience HMS alarms. The MPC/MHE approachcauses significantly fewer alarms than the MPC/LO approach. Minimizing the number of alarmsis important when implementing these controllers because if alarms go off too frequently, subjectsmay experience “alarm fatigue” and ignore the alarms. The sixth set of rows in Table I gives thenumerical results corresponding to the CVGA plots in Figure 5. The seventh set of rows gives themean, minimum, and maximum BG values for each approach, as well as the corresponding p-valuesfrom a paired t-test. The MPC/MHE approach results in a slightly higher mean BG but also a higherminimum BG. Interestingly, the MPC/MHE approach produces a very slightly lower maximumBG. The eighth set of rows gives the Low Blood Glucose Index (LBGI) and High Blood GlucoseIndex (HGBI), as computed according to [12], and the corresponding p-values. As expected, theMPC/MHE approach results in a lower LBGI but a higher HBGI. Finally, the last row gives thetotal amount of insulin delivered using each approach averaged over all 110 simulations as well as
Copyright c© 2016 John Wiley & Sons, Ltd. Optim. Control Appl. Meth. (2016)Prepared using ocaauth.cls DOI: 10.1002/oca

SIMULTANEOUS MPC AND MHE FOR BLOOD GLUCOSE REGULATION IN TYPE 1 DIABETES 13
>180 >250 >300 >350 >400
#of
events
0
200
400
MPC/MHEMPC/LO
blood-glucose [mg/dL]<40 <50 <60 <70 <80
#of
events
0
20
40
60
(a) Number of hyperglycemic and hypoglycemic events.
length of pump suspensions [min]>15 >30 >60 >90 >120
#of
pump-suspension
s
0
50
100
150
200
250
300
MPC/MHEMPC/LO
(b) Number of pump suspensions.
Figure 6. Histograms for the number of hyperglycemic and hypoglycemic events as well as the number ofpump suspensions for the MPC/MHE approach (blue) and the MPC/LO approach (red).
the standard deviation, minimums and maximums, and p-values. The MPC/MHE approach deliversless insulin than the MPC/LO approach; therefore, it is not surprising that the MPC/MHE results inslightly higher mean BG.
The last advantage, and one that is not quantified in Table I, is that the MPC/MHE approachdelivers insulin more quickly after a meal. This was mentioned when discussing the aggregateresponses after the first meal shown in Figure 3(b) and is precisely quantified in Figure 7. Forreference, the basal insulin rate is shown in Figure 7 and increases at a rate of 0.1026 [U/5min].On average, BG begins to rise about 10 minutes after a meal is consumed. After 20 minutes, theMPC/MHE approach begins to deliver insulin at a rate higher than the basal rate. The MPC/LOapproach, on the other hand, does not deliver insulin at a rate higher than the basal rate until 30minutes after a meal is consumed. Consequently, the MPC/MHE approach delivers more insulincompared to the MPC/LO approach for the first 55 minutes after a meal is consumed, after whichtime the MPC/LO approach continues delivering insulin at a higher rate. Moreover, the mean BG islower for the MPC/MHE approach until about 105 minutes after meal consumption even thoughit starts out slightly higher than the BG for the MPC/LO approach before a meal. This fasterresponse to increasing BG values may be due to using an MHE-like state estimator as opposedto a Luenberger observer because the Luenberger observer computes the estimates recursively and,therefore, may produce a lagging state estimate if the state is rapidly changing. This phenomenon isalso found in [21] when specifically comparing the results of a state-feedback MPC strategy usingboth a Luenberger observer and an MHE for estimating BG. The MPC/MHE approach does not,however, cumulatively deliver as much insulin as the MPC/LO approach, so BG values stay slightlyhigher for longer using the MPC/MHE approach.
5. CONCLUSIONS
We presented a new estimation and control approach for regulating BG in T1DM. This approachsimultaneously performs Model Predictive Control and Moving Horizon Estimation in a single min-max optimization problem to form a feedback controller that results in elevated cost-conservatismwith respect to disturbances. This combined MPC/MHE approach incorporates an asymmetricoutput cost penalizing “riskier” low BG values more severely than high BG values. We comparedthis approach to a state-feedback MPC approach that utilized a Luenberger observer for stateestimation and incorporated an asymmetric input cost in order to decouple the controller’s responseto low versus high BG values. This MPC/LO approach is a simplified version of an estimation andcontrol approach that has been successfully tested in clinical trials.
Both of these control and estimation approaches were evaluated with in-silico studies utilizing ametabolic simulator. In 110 simulations of 10 virtual subjects, we found that while the MPC/MHEapproach keeps BG values slightly higher on average, it successfully reduces the number of
Copyright c© 2016 John Wiley & Sons, Ltd. Optim. Control Appl. Meth. (2016)Prepared using ocaauth.cls DOI: 10.1002/oca

14 D. A. COPP, R. GONDHALEKAR, J. P. HESPANHA
Time since meal [min]0 10 20 30 40 50 60 70 80 90 100 110
Cumulative
insulindelivered
since
meal[U
]
0
1
2
3
Insulin, MPC/MHEInsulin, MPC/LOBG, MPC/MHEBG, MPC/LO
100
150
200
250
Meanbloodglucose
[mg/dL]
100
150
200
250
Cumulative basal insulin
Figure 7. Cumulative insulin delivered (blue) and mean BG (red) since a meal consumption for bothMPC/MHE and MPC/LO approaches averaged over all three meals and 110 simulations.
hypoglycemic events without increasing the number of hyperglycemic events, it delivers insulinsooner in response to meal consumption, and it commands shorter insulin pump suspensions, whichresults in smoother BG trajectories. Therefore, this MPC/MHE approach may be advantageous forthe feedback control of an AP for the treatment of T1DM.
6. ACKNOWLEDGMENTS
This material is based upon work partially supported by the National Science Foundation underGrant No. ECCS-1608880. The authors thank Dr. F. J. Doyle III and Dr. E. Dassau, both of HarvardUniversity, for their support, and for providing the environment that lead to this work. The authorsacknowledge that access to the UVA/Padova metabolic simulator was provided by an agreementwith Prof. C. Cobelli (University of Padova) and Prof. B. P. Kovatchev (UVA) for research purposes.All simulations using the metabolic simulator were performed by Ravi Gondhalekar at UCSB. RaviGondhalekar acknowledges funding provided by the National Institutes of Health: DP3DK094331,R01DK085628.
REFERENCES
1. Haidar A. The artificial pancreas: How closed-loop control is revolutionizing diabetes. IEEE Control SystemsOctober 2016; 36(5):28–47.
2. Cobelli C, Renard E, Kovatchev B. Artificial pancreas: Past, present, future. Diabetes November 2011; 60:2672–2682.
3. Doyle III FJ, Huyett LM, Lee JB, Zisser HC, Dassau E. Closed-loop artificial pancreas systems: Engineering thealgorithms. Diabetes Care May 2014; 37:1191–1197.
4. Grosman B, Dassau E, Zisser HC, Jovanovic L, Doyle III FJ. Zone model predictive control: A strategy to minimizehyper- and hypoglycemic events. Journal of Diabetes Science and Technology July 2010; 4(4):961–975.
5. Breton M, Farret A, Bruttomesso D, Anderson S, Magni L, Patek S, Dalla Man C, Place J, Demartini S, Del FaveroS, et al.. Fully integrated artificial pancreas in type 1 diabetes: Modular closed-loop glucose control maintains nearnormoglycemia. Diabetes September 2012; 61:2230–2237.
6. Dassau E, Brown SA, Basu A, Pinsker JE, Kudva YC, Gondhalekar R, Patek S, Lv D, Schiavon M, Lee JB, et al..Adjustment of open-loop settings to improve closed-loop results in type 1 diabetes: A multicenter randomized trial.J. Clinical Endocrinology & Metabolism October 2015; 100(10):3878–3886.
Copyright c© 2016 John Wiley & Sons, Ltd. Optim. Control Appl. Meth. (2016)Prepared using ocaauth.cls DOI: 10.1002/oca

SIMULTANEOUS MPC AND MHE FOR BLOOD GLUCOSE REGULATION IN TYPE 1 DIABETES 15
7. Huyett LM, Ly TT, Forlenza GP, Reuschel-DiVirgilio S, Messer LH, Wadwa RP, Gondhalekar R, Doyle III FJ,Pinsker JE, Maahs DM, et al.. Outpatient closed-loop control with unannounced moderate exercise in adolescentsusing zone model predictive control. Diabetes Technology & Therapeutics June 2017; 19(6):331–339.
8. Hovorka R. Continuous glucose monitoring and closed-loop systems. Diabetic Medicine January 2005; 23:1–12.9. Bequette BW. A critical assessment of algorithms and challenges in the development of a closed-loop artificial
pancreas. Diabetes Technology and Therapeutics 2005; 7(1):28–47.10. Parker RS, Doyle III FJ, Peppas NA. A model-based algorithm for blood glucose control in type I diabetic patients.
IEEE Transactions on Biomedical Engineering February 1999; 46(2):148–157.11. Hovorka R, Canonico V, Chassin LJ, Haueter U, Massi-Benedetti M, Federici MO, Pieber TR, Shaller HC, Schaupp
L, Vering T, et al.. Nonlinear model predictive control of glucose concentration in subjects with type 1 diabetes.Physiological Measurement 2004; 25:905–920.
12. Magni L, Raimondo D, Dalla Man C, Nicolao GD, Kovatchev B, Cobelli C. Model predictive control of glucoseconcentration in type I diabetic patients: An in silico trial. Biomedical Signal Processing and Control May 2009;4:338–346.
13. Morari M, Lee JH. Model predictive control: past, present and future. Computers & Chemical Engineering 1999;23(4):667–682.
14. Rawlings JB, Mayne DQ. Model Predictive Control: Theory and Design. Nob Hill Publishing: Madison, WI, USA,2009.
15. Qin SJ, Badgwell TA. A survey of industrial model predictive control technology. Control Engineering Practice2003; 11(7):733–764.
16. Rawlings JB, Bakshi BR. Particle filtering and moving horizon estimation. Computers & Chemical Engineering2006; 30(10):1529–1541.
17. Gondhalekar R, Dassau E, Doyle III FJ. Periodic zone-MPC with asymmetric costs for outpatient-ready safety ofan artificial pancreas to treat type 1 diabetes. Automatica September 2016; 71:237–246.
18. Gondhalekar R, Dassau E, Doyle III FJ. MPC design for rapid pump-attenuation and expedited hyperglycemiaresponse to treat T1DM with an artificial pancreas. American Control Conference (ACC), 2014; 4224–4230.
19. Gondhalekar R, Dassau E, Doyle III FJ. Velocity-weighting to prevent controller-induced hypoglycemia in MPC ofan artificial pancreas to treat T1DM. American Control Conference (ACC), 2015; 1635–1640.
20. Gondhalekar R, Dassau E, Zisser HC, Doyle III FJ. Periodic-zone model predictive control for diurnal closed-loopoperation of an artificial pancreas. Journal of Diabetes Science and Technology November 2013; 7:1446–1460.
21. Lee JJ, Gondhalekar R, Doyle III FJ. Design of an artificial pancreas using zone model predictive control with amoving horizon state estimator. 53rd IEEE Conference on Decision and Control (CDC), 2014; 6975–6980.
22. Copp DA, Hespanha JP. Nonlinear output-feedback model predictive control with moving horizon estimation. 53rdIEEE Conference on Decision and Control (CDC), 2014; 3511–3517.
23. Copp DA, Hespanha JP. Simultaneous nonlinear model predictive control and state estimation. Automatica March2017; 77:143–154.
24. Boiroux D. Model predictive control algorithms for pen and pump insulin administration. PhD Thesis, TechnicalUniversity of Denmark 2012.
25. Harvey RA, Dassau E, Bevier WC, Seborg DE, Jovanovic L, Doyle III FJ, Zisser HC. Clinical evaluation ofan automated artificial pancreas using zone-model predictive control and health monitoring system. DiabetesTechnology and Therapeutics 2014; 16(6):348–357.
26. Cobelli C, Dalla Man C, Sparacino G, Magni L, De Nicolao G, Kovatchev BP. Diabetes: Models, signals, andcontrol. IEEE Reviews in Biomedical Engineering 2009; 2:54–96.
27. van Heusden K, Dassau E, Zisser HC, Seborg DE, Doyle III FJ. Control-relevant models for glucose control usinga priori patient characteristics. IEEE Transactions on Biomedical Engineering July 2012; 59(7):1839–1849.
28. Colmegna P, Sanchez Pena RS. Analysis of three T1DM simulation models for evaluating robust closed-loopcontrollers. Computer Methods and Programs in Biomedicine 2014; 113:371–382.
29. Ellingsen C, Dassau E, Zisser HC, Grosman B, Percival MW, Jovanovic L, Doyle III FJ. Safety constraints inan artificial pancreatic β cell: An implementation of model predictive control with insulin on board. Journal ofDiabetes Science and Technology May 2009; 3:536–544.
30. Turksoy K, Samadi S, Feng J, Littlejohn E, Quinn L, Cinar A. Meal detection in patients with type 1 diabetes: anew module for the multivariable adaptive artificial pancreas control system. IEEE journal of biomedical and healthinformatics 2016; 20(1):47–54.
31. Kovatchev BP, Breton M, Dalla Man C, Cobelli C. In silico preclinical trials: A proof of concept in closed-loopcontrol of type 1 diabetes. Journal of Diabetes Science and Technology January 2009; 3:44–55.
32. Walsh J, Roberts R. Pumping Insulin. 4th edn., Torrey Pines Press: San Diego, CA, USA, 2006.33. Copp DA, Hespanha JP. Conditions for saddle-point equilibria in output-feedback MPC with MHE. American
Control Conference (ACC), 2016; 13–19.34. Copp DA, Hespanha JP. Addressing adaptation and learning in the context of model predictive control with moving
horizon estimation. Control of Complex Systems: Theory and Applications. chap. 6, Butterworth-Heinemann, 2016;187–209.
35. Levine WS ( (ed.)). The control handbook. 2nd edn., CRC Press.: Boca Raton, FL, USA, 2011.36. Magni L, Raimondo DM, Dalla Man C, Breton M, Patek S, Nicolao GD, Cobelli C, Kovatchev BP. Evaluating
the efficacy of closed-loop glucose regulation via control-variability grid analysis. Journal of Diabetes Science andTechnology July 2008; 2:630–635.
37. Harvey RA, Dassau E, Zisser HC, Seborg DE, Jovanovic L, Doyle III FJ. Design of the health monitoring systemfor the artificial pancreas: Low glucose prediction module. Journal of Diabetes Science and Technology November2012; 6:1345–1354.
Copyright c© 2016 John Wiley & Sons, Ltd. Optim. Control Appl. Meth. (2016)Prepared using ocaauth.cls DOI: 10.1002/oca

16 D. A. COPP, R. GONDHALEKAR, J. P. HESPANHA
Table I. Aggregate results for the two comparisons considered.
MPC/MHE MPC/LO
BG [mg/dL] % time
P r80, 140s 45.47 49.19P r70, 180s 56.62 61.24ă 80 1.05 1.85ă 70 0.39 1.30ă 60 0.13 0.99ă 50 0.03 0.68ă 40 0.00 0.34ą 180 42.99 37.46ą 250 20.84 17.53ą 300 7.70 5.98ą 350 1.93 1.43ą 400 0.58 0.45
# Simulations (# Subjects)with BG [mg/dL]
ă 80 21 (3) 20 (2)ă 70 10 (2) 14 (2)ă 60 6 (1) 12 (2)ă 50 1 (1) 12 (2)ă 40 0 (0) 12 (2)ą 180 110 (10) 110 (10)ą 250 109 (10) 108 (10)ą 300 53 (7) 53 (7)ą 350 11 (1) 11 (1)ą 400 11 (1) 11 (1)
# Events BG [mg/dL]
ă 80 34 45ă 70 15 36ă 60 8 34ă 50 2 30ă 40 0 22ą 180 330 332ą 250 285 285ą 300 131 128ą 350 33 33ą 400 21 14
# Pump Suspensions
ě 15 min 201 291ě 30 min 28 111ě 60 min 0 44ě 90 min 0 26ě 120 min 0 8ě 150 min 0 0
# HMS Alarms 37 95# Simulations with HMS Alarms 19 23
CVGA zone count: A 0 0CVGA zone count: B 64 64CVGA zone count: C 33 32CVGA zone count: D 7 2CVGA zone count: E 6 12CVGA circle radius 8.31 12.26
BG mean: mean˘std [min,max] (P ă 0.01) 180˘18.92 [152,219] 171˘14.90 [148,201]BG min: mean˘std [min,max] (P ă 0.01) 94˘16.72 [43,122] 89˘23.65 [22,121]BG max: mean˘std [min,max] (P “ 0.13) 307˘47.18 [247,427] 307˘53.62 [246,457]
LBGI: mean˘std [min,max] (P “ 0.14) 0.17˘0.29 [0.00,1.97] 0.47˘1.08 [0.00,4.51]HBGI: mean˘std [min,max] (P ă 0.01) 10.87˘3.74 [5.47,19.47] 9.36˘2.95 [4.84,14.28]
Total Daily Insulin [U]: mean˘std [min,max] (P “ 0.67) 41.4˘6.6 [32.7,57.3] 42.5˘7.1 [33.1,59.5]
Copyright c© 2016 John Wiley & Sons, Ltd. Optim. Control Appl. Meth. (2016)Prepared using ocaauth.cls DOI: 10.1002/oca