simultaneous factor analysis of organic particle and gas ... · j. g. slowik et al.: simultaneous...
TRANSCRIPT
Atmos. Chem. Phys., 10, 1969–1988, 2010www.atmos-chem-phys.net/10/1969/2010/© Author(s) 2010. This work is distributed underthe Creative Commons Attribution 3.0 License.
AtmosphericChemistry
and Physics
Simultaneous factor analysis of organic particle and gas massspectra: AMS and PTR-MS measurements at an urban site
J. G. Slowik1,3, A. Vlasenko1,3, M. McGuire 2,3, G. J. Evans2,3, and J. P. D. Abbatt1,3
1Department of Chemistry, University of Toronto, Toronto, Canada2Department of Chemical Engineering and Applied Chemistry, University of Toronto, Toronto, Canada3Southern Ontario Centre for Atmospheric Aerosol Research, University of Toronto, Toronto, Canada
Received: 19 February 2009 – Published in Atmos. Chem. Phys. Discuss.: 11 March 2009Revised: 7 January 2010 – Accepted: 11 January 2010 – Published: 19 February 2010
Abstract. During the winter component of the SPORT(Seasonal Particle Observations in the Region of Toronto)field campaign, particulate non-refractory chemical compo-sition and concentration of selected volatile organic com-pounds (VOCs) were measured by an Aerodyne time-of-flight aerosol mass spectrometer (AMS) and a proton transferreaction-mass spectrometer (PTR-MS), respectively. Sam-pling was performed in downtown Toronto∼15 m from amajor road. The mass spectra from the AMS and PTR-MSwere combined into a unified dataset, which was analysedusing positive matrix factorization (PMF). The two instru-ments were given balanced weight in the PMF analysis bythe application of a scaling factor to the uncertainties of eachinstrument. A residual based metric,1esc, was used to eval-uate the instrument relative weight within each solution. ThePMF analysis yielded a 6-factor solution that included fac-tors characteristic of regional transport, local traffic emis-sions, charbroiling and oxidative processing. The unifieddataset provides information on emission sources (particleand VOC) and atmospheric processing that cannot be ob-tained from the datasets of the individual instruments: (1)apportionment of oxygenated VOCs to either direct emissionsources or secondary reaction products; (2) improved corre-lation of oxygenated aerosol factors with photochemical age;and (3) increased detail regarding the composition of oxy-genated organic aerosol factors. This analysis represents thefirst application of PMF to a unified AMS/PTR-MS dataset.
Correspondence to:J. P. D. Abbatt([email protected])
1 Introduction
Air pollutants have important effects on ecosystems(Schindler, 1988; Driscoll et al., 2003), human health (Dock-ery and Pope, 1994; Pope and Dockery, 2006), atmosphericvisibility (Watson, 2002) and climate change (Jacobson,2001; Ramanathan et al., 2001). Organic pollutants exist inboth the gas and particle phases and vary in terms of theircomposition and source. Both particulate organic speciesand volatile organic compounds (VOCs) may enter the atmo-sphere either as a result of primary emissions such as fossilfuel combustion or through secondary processes such as gas-phase or heterogeneous chemical reactions. A quantitativeunderstanding of VOC and particulate organic sources andatmospheric processing is necessary to reduce uncertaintiesin global climate models and for the development of pollu-tion mitigation strategies to improve air quality (Kanakidouet al., 2005).
One approach to estimating the effects of source contri-butions and atmospheric processing to particle and VOCcomposition and concentration is through the use of recep-tor modelling techniques such as positive matrix factoriza-tion (PMF) (Paatero and Tapper, 1994; Paatero, 1997) andUNMIX (Lewis et al., 2003). Multivariate statistical tech-niques are used to deconvolve a time series of simultaneousmeasurements into a set of factors and their time-dependentconcentrations. These factors may then be related to emis-sion sources, chemical composition and/or atmospheric pro-cessing, depending on their specific chemical and temporalcharacteristics. Because receptor models require no a prioriknowledge of meteorological conditions or emission invento-ries, they are ideal for use in locations where emission inven-tories are poorly characterised or highly complicated (e.g. ur-ban areas), or where atmospheric processing plays a majorrole.
Published by Copernicus Publications on behalf of the European Geosciences Union.

1970 J. G. Slowik et al.: Simultaneous AMS and PTR-MS factor analysis
Factor analysis techniques have been previously appliedto a range of VOC measurements (Buzcu and Frazier, 2006;Holzinger et al., 2007; Lanz et al., 2008b), yielding fac-tors related to atmospheric processing and sources such astraffic and biogenic emissions. Although PMF has previ-ously been applied to particle measurements (Ramadan etal., 2000; Polissar et al., 2001; Lee et al., 2003; Owega etal., 2004), a detailed treatment of the organic componenthas only recently been attempted. Lanz et al. (2007) ap-plied PMF to organic aerosol mass spectra obtained from anaerosol mass spectrometer (AMS), obtaining six distinct fac-tors relating to aerosol composition, volatility range and spe-cific sources such as charbroiling and wood burning emis-sions. Zhang et al. (2005) developed a technique for decon-volving AMS mass spectra into oxygenated organic aerosol(OOA) and hydrocarbon-like organic aerosol (HOA) usingm/z 44 (CO+
2 ) andm/z 57 (C4H+
9 , C3H5O+) as OOA andHOA tracers. Other studies have typically included selectedAMS mass spectral fragments in receptor modelling (typi-cally restricted to inorganic species,m/z 44 andm/z 57)(Buset et al., 2006; Quinn et al., 2006), classified organicsbased on their thermal properties (Zhao and Hopke, 2006),or treated the organics as a single species for analysis.
Recent studies indicate that the traditional binary treat-ments of atmospheric organics as either gases or particlesmay be inadequate (Robinson et al., 2007). A proposed alter-native is the treatment of organic species through the use ofa volatility basis set (Donahue et al., 2006), in which the par-titioning behaviour of organics are considered over a rangeof volatilities. Such issues highlight the need for analyti-cal approaches capable of simultaneous, cohesive analysis ofgas and particle data. One such approach is presented here,through the application of the PMF receptor modelling tech-nique to coupled gas and particle data.
In this experiment, simultaneous measurements of themass spectra of particulate organics and VOCs were obtainedusing an Aerodyne aerosol mass spectrometer (AMS) and aproton transfer reaction mass spectrometer (PTR-MS). Themeasurements from these two instruments were combinedinto a single dataset and analysed using PMF. This analy-sis yielded factors related to emission sources and chemicalcomposition, specifically the degree of oxygenation. Thesefactors were compared to the results obtained from PMFanalysis conducted separately on the individual AMS andPTR-MS datasets. This is the first application of PMF anal-ysis to a unified AMS/PTR-MS dataset. In the present study,benefits of the unified analysis are evident in the apportion-ment of gas and particle constituents to primary emissionand secondary reaction processes, correlation of oxygenatedaerosol factors with photochemical age and detailed compo-sition of oxygenated organic aerosol factors.
2 Materials and methods
2.1 Sampling and instrumentation
During the winter component of the SPORT (Seasonal Par-ticle Observations in the Region of Toronto) field cam-paign (22 January 2007 to 5 February 2007), a time-of-flight aerosol mass spectrometer (C-ToF-AMS) (AerodyneResearch, Inc., Billerica, MA, USA) and a proton transferreaction-mass spectrometer (PTR-MS) (Ionicon Analytik,Innsbruck, Austria) were deployed in downtown Toronto(Wallberg Building, University of Toronto). The samplinginlet consisted of a 10 cm diameter circular duct located∼5 m above ground and∼15 m north of College Street. Col-lege Street has a weekday traffic volume of approximately33 000 vehicles per day, similar to other major roadways inToronto (Godri et al., 2009). The site is situated in a mixedcommercial/residential area. Known local particle emissionssources include automobile traffic, street food vendors andrestaurants. Ambient air was sampled continuously at a rateof 300 L/min through a 10.2 cm outer diameter duct. TheAMS sampling line was∼7 m long and constructed from∼6 m stainless steel and∼1 m conductive silicone tubing(TSI, inc., Shoreview, MN, USA). The PTR-MS utilized aTeflon sampling line with a length of∼2.5 m.
The literature provides detailed descriptions of the AMS(Drewnick et al., 2005; Canagaratna et al., 2007) and PTR-MS (Hansel et al., 1995; Lindinger et al., 1998). The AMSprovides the size-resolved, non-refractory composition ofsubmicron particles, while the PTR-MS provides the con-centrations of VOCs with a proton affinity greater than thatof water. The AMS and PTR-MS recorded data on 1 min and30 s time intervals, respectively; data from both instrumentswere re-averaged into 15 min time intervals. For the analysisof both individual and unified datasets, time periods contain-ing mass spectra from only one instrument were excluded,yielding a total of 1148 analysed mass spectra.
The longer 15 min interval was selected for analysis be-cause of (1) signal-to-noise considerations (e.g. for PTR-MSaromatics, the longer averaging periods increased signal-to-noise by approximately a factor of 5.5, from 1.0–1.5 to 6.0–9.0), and (2) an indication from preliminary PMF analy-sis of the unified AMS/PTR-MS dataset indicating that theshorter averaging times led to solutions in which the re-solved factors contained data from either the AMS or PTR-MS, but not both. It is speculated that this second issueis caused by the different residence times in the instrumentsampling lines, causing imperfect synchronization of the in-strument sampling intervals. The importance of this effectis reduced by a longer averaging interval (because the non-synchronized averaging time is a smaller fraction of the totalinterval). This is supported by the observation that longeraveraging intervals (not shown) provide consistent resultswith the 15 min dataset. Comparison of the effect of aver-aging time with other datasets (e.g. rural locations where the
Atmos. Chem. Phys., 10, 1969–1988, 2010 www.atmos-chem-phys.net/10/1969/2010/

J. G. Slowik et al.: Simultaneous AMS and PTR-MS factor analysis 1971
particle/gas composition is less affected by rapidly changingpoint sources) will provide further insight.
AMS data analysis was performed using the ToF-AMSAnalysis Toolkit v.1.44 (D. Sueper, University of Colorado-Boulder, Boulder, CO, USA) for the Igor Pro software pack-age (Wavemetrics, Inc., Portland, OR, USA). The organiccomponents ofm/z≤300 were included in the PMF analysis.Mass fragments containing no organic signal were excluded,resulting in 270 analysedm/z. At m/z that contain signalsfrom both inorganic and organic ions, the organic contribu-tion was determined through a fragmentation pattern-basedanalysis routine (Allan et al., 2004). The procedure for cal-culating AMS uncertainties is described in detail in the liter-ature (Allan et al., 2003) and summarized briefly as follows.The distribution of ion signals recorded for a given ensem-ble are represented as a Poisson distribution and convolvedwith a detector-dependent Gaussian distribution represent-ing the variation in signal obtained for a single ion. Duringoperation, the particle beam is alternately blocked (yieldinga background measurement) and unblocked. Uncertaintiesare calculated independently for each mode and summed in
quadrature, yielding the expression1Id = α√
Io+Ib√ts
. Here
Io andIb are the ion signals in the unblocked and blocked(background) positions,ts is the sampling time andα is afactor accounting for the width of the Gaussian ion signaldistribution.
Due to signal-to-noise constraints imposed by the 30 ssampling intervals, the PTR-MS was not used to scan theentire mass spectrum and instead was set to measure spe-cific masses. Ions atm/z 31 (formaldehyde), 43 (alkylfragments, propylene, acetic acid, acetone, peroxyacetyl ni-trate (PAN)), 45 (acetaldehyde), 59 (acetone, propanal, gly-oxal), 61 (acetic acid), 73 (methyl ethyl ketone (MEK),methylglyoxal, butanal), 79 (benzene), 93 (toluene), 107(xylenes, ethyl benzene, benzaldehyde), and 121 (trimethylbenzene, ethyl toluene, propyl benzene) were included in thePMF analysis (de Gouw and Warneke, 2007), whilem/z 33(methanol), 37 (water dimer), 42 (acetonitrile), 69 (isoprene)and 129 (naphthalene) were measured but excluded from thePMF due to poor signal-to-noise (m/z 42, 69, 129), signalexclusively due to the water dimer ion (m/z 37) or problemswith the measurement dynamic range due to persistent lo-cal sources (spikes ofm/z 33 (methanol) from windshieldwasher fluid). Uncertainties for the PTR-MS were calculatedfrom background levels and Poisson ion counting statistics asdescribed in the literature and summarized below (de Gouwet al., 2003). Typical uncertainty values were in the range of2 to 18% of signal, depending on them/z. Background lev-els were obtained by sampling through a charcoal cartridge(Supelco, Bellefonte, PA, USA). The overall uncertainty is
given by 1(I − Ic) =
√Iτ+
Ic
τc, whereI is the ion signal,
τ is the averaging time and the “c” subscript denotes back-ground measurements. PTR-MS calibration was performedusing a custom-made standard (Apel-Riemer Environmental
Inc., Broomfield, CO, USA), yielding species-dependent cal-ibration factors and detection limits as described elsewhere(Vlasenko et al., 2009). Because of the large number ofspecies fragmenting tom/z 43, the calibration factor at thism/z was estimated as bounded by those of the oxygenatedspecies and aromatics. For factors dominated by one or theother, this could yield uncertainties of up to∼ ±50% in themixing ratio at thism/z. However,m/z 43 signals are suffi-ciently low that even this worst case would not greatly influ-ence the reported factor mixing ratios.
2.2 Positive Matrix Factorization (PMF)
The AMS and PTR-MS mass spectral time series and uncer-tainties obtained, as described above, were analysed usingthe PMF2 software package version 4.2 (P. Paatero, U. ofHelsinki, Finland), together with a modified version of theCU AMS PMF Tool (Ulbrich et al., 2009a). Two methods ofanalysis were employed. In the first method, PMF was sepa-rately applied to the AMS and PTR-MS data. In the secondmethod, the data from the two instruments were combinedinto a single dataset and PMF was applied to this unifieddataset.
The PMF model is described in detail in the literature(Paatero and Tapper, 1994; Paatero, 1997). Here, we pro-vide a brief summary and discuss the special considerationsrequired to apply PMF to the unified dataset. PMF operateson the input data matrixX and the corresponding uncertaintymatrix S. In the present study,X is the time series of massspectra collected by the AMS and/or PTR-MS. The matrixS,therefore, contains the uncertainty in the measurement of thesignal of eachm/z at every point in time. The PMF model isdescribed by the matrix equation:
X = GF+E (1)
Here the columns of theG matrix contain the factor time se-ries and the rows of theF matrix contain the factor mass spec-tra. The number of factors in a solution is user-determinedthrough criteria discussed later. TheE matrix contains theresiduals and is defined by Eq. (1). The PMF model solvesEq. (1) by using a weighted least-squares algorithm to mini-mize the sum of squares,Q, defined as:
Q =
n∑i
m∑j
(eij
/sij)2
(2)
Here eij are the elements of the residual matrixE and sijare the elements of the uncertainty matrixS (i andj are thetime andm/z indices, respectively, whilen andm denote thenumber of time points and number ofm/z). The theoreticalvalue ofQ, denotedQexpected, can be estimated as:
Qexpected= NumElements(X)
−(NumElements(G)+NumElements(F)) (3)
www.atmos-chem-phys.net/10/1969/2010/ Atmos. Chem. Phys., 10, 1969–1988, 2010

1972 J. G. Slowik et al.: Simultaneous AMS and PTR-MS factor analysis
Fig. 1. Schematic of the unified AMS/PTR-MS data matrix (X).
Here, the NumElements operation denotes the number of el-ements in the indicated matrix. In practice,Q is expected tobe somewhat larger thanQexpectedfor ambient data becausethe data cannot be perfectly represented by a finite numberof factors.
The unified AMS/PTR-MS data matrix,XUN, is shownin Fig. 1. The associated uncertainty matrix,SUN, is con-structed similarly. In examining the solutions to the unifieddataset, an important consideration is the fit quality of thePMF model to the data from each instrument. When no in-strument weighting is applied to the unified dataset, the AMScomponent of the dataset is well-represented in the solution,while the PTR-MS component is poorly represented. Thisis due to (1) the large size of the AMS dataset (270 AMSm/z vs. 10 PTR-MSm/z), (2) co-variance betweenm/z
of a particular instrument (e.g. AMSm/z 43, 57, 71, 85,etc. are somewhat correlated because they all contain contri-butions from alkane fragments), and (3) the signal-to-noiseratio within the instrument datasets (m/z with higher signal-to-noise typically have fractionally more signal apportionedto factors (instead of the residuals) than do low signal-to-noisem/z. In the present case, them/z-to-m/z variations insignal-to-noise for a given instrument are larger than system-atic differences between the instruments; however, instru-ment differences may still exert some influence). Therefore,it is necessary to increase the weight of the PTR-MS compo-nent so that the PMF solution provides a balanced representa-tion of the data from both instruments. Here, the instrumentsare balanced by the application of a weighting factor to thePTR-MS uncertainties and the instrument’s relative weightis evaluated utilizing a scaled residual-based metric, as dis-cussed in Sect. 2.2.2. While other weighting methods andevaluation metrics could potentially be devised (e.g. an alter-nate weighting method is briefly discussed in Sect. 3.3.3), theevaluation of the instrument weight is essential to ensure that
Table 1. Input parameters for PMF analysis.
Dataset
AMS PTR-MS Unified
Matrix rows 1148 1148 1148Matrix columns 270 10 280Range ofp analysed 1 to 10 1 to 8 1 to 10Range of fPeak analysed −1.5 to 1.5 −1.5 to 1.5 −1.5 to 1.5Number of random starts 100 100 100Outlier limit (α) 4 4 4C3 error coefficient 0 0 0
the PMF algorithm does not discard data from an included in-strument. A consequence of the selected uncertainty weight-ing method is that the PMF2 robust operating mode (in whichoutlying data points are iteratively downweighted) cannot beused. Therefore, an alternate method of outlier downweight-ing is developed (pseudo-robust method) and discussed inSect. 2.2.1. For consistency, the pseudo-robust method wasutilized for both the individual and unified datasets.
Input parameters for the three datasets are summarized inTable 1; theα parameter in this table is defined below inEq. (4). Note that matrix rotations were explored through thefPeak parameter and the identification of a global minimumsolution was supported by initiating PMF from 100 randomstarting points (seed parameter). For the individual AMS andPTR-MS datasets, both robust and pseudo-robust methodswere used, yielding nearly identicalF and G matrices. Inmost cases, convergence was obtained when 5 solution stepsyielded1Q <0.1. The exceptions are solutions to the AMSdataset at fPeak< −0.75, where1Q values from 0.2 to 5were required.
The uncertainty matrixS was in all cases calculated frominstrument operating principles and an error coefficient C3=0value was selected. This choice sometimes resulted inQ-values being significantly higher than expected. The selec-tion of C3=0 and its implications are discussed further inSect. 3.3.4.
2.2.1 Pseudo-robust outlier treatment
An outlier is defined as a data point which satisfies:∣∣eij
/sij∣∣> α (4)
In the robust mode, PMF2 iteratively downweights outliers,preventing them from dominating the model fit. As discussedin the next section, the uncertainty weighting method usesa modified set of uncertainties, denotedsinst,ij , where thesinst,ij of one instrument are scaled in relation to those of theother. Therefore, the robust mode cannot be used becauseEq. (1) outliers cannot be correctly identified and Eq. (2) forstrongly weightedsinst,ij , the robust mode counteracts the
Atmos. Chem. Phys., 10, 1969–1988, 2010 www.atmos-chem-phys.net/10/1969/2010/

J. G. Slowik et al.: Simultaneous AMS and PTR-MS factor analysis 1973
uncertainty weighting, thereby preventing a balanced solu-tion from being reached.
In the present dataset, outliers mostly occur during peri-ods of high particle and/or gas concentrations and atm/z
with consistently high signal-to-noise. Under such condi-tions,eij/sij may become large whileeij/xij remains small.This is a result of issues such as (1) minor variations in sourceprofiles with time and (2) the general approximation inher-ent in PMF that ambient data may be represented through afinite number of static factors. As a result, it is desirable toretain information from these periods, but to prevent themfrom unduly pulling the model fit. Therefore, we treat out-liers with a downweighting procedure, rather than excludingdata altogether. It is desirable to obtain a solution in whichthe relationship between scaled residuals is preserved, but theoutliers do not dominate the fit.
The pseudo-robust method introduced here is modelled onthe robust PMF analysis (Paatero, 1997). We describe themethod in terms of a generic uncertainty matrixS (whichwould beSinst in the pseudo-robust analysis of the unifieddataset, see Sect. 2.2.2). In robust PMF, the PMF task isdefined as:
argminG,F
=
m∑j=1
n∑i=1
(X −Y)2
h2ij s
2ij
(5)
HereY is the data matrix reconstructed from the PMF solu-tion (i.e.Y=GF), andhij are downweighting factors appliedto the outliers according to the criteria:
h2ij = 1 if
∣∣eij
/sij∣∣≤ α (6a)
h2ij =
∣∣∣∣(eij
sij
)/α
∣∣∣∣ otherwise (6b)
In robust PMF, thehij are calculated for each iteration of thesolution process. For pseudo-robust analysis, only a singlecalculation of thehij is performed. For each unique combi-nation ofp, instrument weight, fPeak and seed, PMF is ap-plied twice. The first application is to theX andS matrices,and no downweighting of outliers is performed. From theseresults and Eq. (6), a new uncertainty matrixS′ (containingmatrix elementss′
ij ) is calculated as:
s′
ij = sij if∣∣eij
/sij∣∣≤ α (7a)
s′
ij = hij sij =
√∣∣∣eij sij
α
∣∣∣ otherwise (7b)
A second PMF calculation is then performed onX andS′inst,
yieldingF, G, andE for analysis.
2.2.2 Instrument weighting
Balanced weighting of the AMS and PTR-MS is imple-mented as follows. Unless otherwise noted,S and S′ are
treated identically; for brevity we refer only toS here. Theconstraint applied to the fit of eachm/z in PMF is deter-mined byS. Instrument weight can, therefore, be controlledby the application of a scaling factor to selected componentsof S. Here, the instrument relative weight is controlled by theapplication of the factorCPTR to PTR-MS components ofS,yielding a new uncertainty matrixSinst (containing matrix el-ementssinst,ij ) as follows:
sinst,ij = sinst,ij for j = AMSm/z (8a)
sinst,ij = sij/CPTR for j = PTR−MSm/z (8b)
As CPTR increases, the PTR-MS contribution toQ increasesrelative to the AMS contribution. This causes the PMF2 al-gorithm to find a solution that better represents the PTR-MScomponent of the dataset.
Solutions in which the AMS and PTR-MS datasets arebalanced are determined by analysis of the scaled residualsfor each instrument. For a balanced solution, the magnitudeof the scaled residuals are required to be independent of themeasuring instrument. This requirement is evaluated throughthe quantity1esc, defined as:
1esc =
(∣∣eij
∣∣s′
ij
)AMS
−
(∣∣eij
∣∣s′
ij
)PTR
(9)
If 1esc=0, the AMS and PTR-MS data are balanced in thePMF solution. Values of1esc <0 indicate that the AMS isoverweighted (because the scaled residuals for the PTR-MSare larger than for the AMS), while1esc >0 indicates thatthe PTR-MS is overweighted. Note thats′
ij is used in Eq. (9)rather thansij to prevent outlier domination of1esc. Further,s′
ij is used instead ofs′
inst,ij , i.e.CPTR is removed. This is be-cause the inclusion ofCPTR potentially affects1esc withoutproducing changes in theF andG matrices. For example, forvery low or very high values ofCPTR, only one instrument issignificantly considered by the PMF algorithm. In this sce-nario, a small change inCPTR does not affect the solutionbecauseQ remains dominated by a single instrument. How-ever, the change inCPTR would affect1esc. To prevent suchan artifact, the (unweighted)sij are used in Eq. (3).
3 Results and discussion
We first present results obtained from PMF analysis of theindividual AMS and PTR-MS datasets. We then discuss thePMF analysis of the unified AMS/PTR-MS dataset in termsof (1) selection and evaluation of solutions, (2) physical in-terpretation of the extracted factors, and (3) comparison ofthe information yielded by the individual and unified analy-ses.
www.atmos-chem-phys.net/10/1969/2010/ Atmos. Chem. Phys., 10, 1969–1988, 2010

1974 J. G. Slowik et al.: Simultaneous AMS and PTR-MS factor analysis
Table 2. Parameters describing the selected solution for each dataset.
Dataset
AMS PTR-MS Unified
CPTR N/A N/A 10Number of factors (p) 5 5 6fPeak 0 0 0Qpseudo/Qexpected 0.96 2.55 3.15Qrobust/Qexpected 1.04 2.42 N/AQtrue/Qexpected(pseudo-robust method) 2.82 3.41 15.89Qtrue/Qexpected(PMF2 robust mode) 7.19 3.51 N/APercent of data points classified as outliers (pseudo-robust method,α=4) 1.71 1.82 4.791esc N/A N/A 0.052
4000
3000
2000
1000
0
Tim
e-de
pend
ent c
ontri
butio
n to
Qps
eudo
1/25/2007 1/27/2007 1/29/2007 1/31/2007 2/2/2007 2/4/2007 2/6/2007Date and Time
(a)
20
15
10
5
0
Q /
Qex
pect
ed
10987654321
Factors in solution ( p)
Pseudo-Robust Method Qpseudo Qtrue
PMF2 Robust Mode
Qrobust Qtrue
y = 1
(b)
Fig. 2. (a) Time-dependent contribution toQpseudofor the AMSdataset atp=5. Ticks denote 00:00 of the specified day; this con-vention holds throughout the manuscript.(b) Ratio ofQ/Qexpectedas a functionp for pseudo-robust method and robust mode.
3.1 AMS dataset
PMF analysis of an AMS organic mass spectral dataset hasbeen previously described in detail (Lanz et al., 2007; Ul-brich et al., 2009a), and a similar approach was used in the
present study. A crucial consideration is the number of fac-tors used in the PMF model (p). This number is somewhatsubjective because the PMF model can be run with an ar-bitrary number of factors and no unambiguous method fordetermining the “correct”p exists. As discussed below, a so-lution atp=5 was selected based on the effects of the numberof factors on the time-dependent contribution toQ (denotedQcont), correlations between the factor time series and ex-ternal tracers and physical interpretation of the factor massspectra. Summary statistics for this solution are presentedin Table 2. Thep=5 solution contains the following factors:oxygenated organic aerosol (OOA-1), hydrocarbon-like or-ganic aerosol (HOA), charbroiling, biomass burning organicaerosol (BBOA) and an unidentified point source to the northof the measurement site.
As discussed in Sect. 2.2.1, the AMS dataset was analysedutilizing both the pseudo-robust method and the PMF2 robustmode. Figure 2a shows the pseudo-robustQcont time serieswhereQcont is the summation over allm/z of the squares ofthe scaled residuals, that is:
Qcont=
m∑j
(eij/s
′
ij
)2(10)
Figure 2b showsQ/Qexpectedas a function ofp. In this fig-ure,QpseudoandQrobustare calculated from Eq. (2) using theoutlier-downweighted uncertainties, while theQtrue valuesutilize the originalsij . Despite the difference inQ-valuesbetween the pseudo-robust and robust modes, theG andFmatrices are nearly identical. The discussion below focuseson the pseudo-robust analysis at fPeak=0 and seed=1. Re-sults at other fPeak and seed are summarized in the Sup-plement (see Figs. S1 and S2http://www.atmos-chem-phys.net/10/1969/2010/acp-10-1969-2010-supplement.pdf). Thenon-zero fPeak values yielded qualitatively similar solutionsto those at fPeak=0, and did not lead to significant improve-ments in correlations of the factor time series with exter-nal tracers. In the absence of conflicting evidence, we fo-cus our discussion on the solution with the lowestQ-values
Atmos. Chem. Phys., 10, 1969–1988, 2010 www.atmos-chem-phys.net/10/1969/2010/

J. G. Slowik et al.: Simultaneous AMS and PTR-MS factor analysis 1975
3000
2000
1000
0
∆Qps
eudo
1/27/2007 2/1/2007 2/6/2007
Date and Time
3000
2000
1000
03000
2000
1000
03000
2000
1000
0
3000
2000
1000
0
p = 3 → p = 4
p = 4 → p = 5
p = 5 → p = 6
p = 6 → p = 7
p = 2 → p = 3
Fig. 3. Effect of the number of factors contained in a solution onthe time-dependent contribution toQpseudofor the AMS dataset.
(fPeak=0). The set of solutions, encompassed by the fPeakrange, provide one measure of the solution uncertainty.
Although the AMS data was averaged to 15 min time in-tervals for the PMF analysis, inspection of the original 1 mintime series indicates that the spikes evident in theQcont timeseries correlate mostly with intense concentration spikes of<1 min duration. These spikes are due to emissions fromnearby point sources, particularly a roadside hot dog standand passing vehicles. Their presence is likely due to fluctu-ations in the emission profiles of these sources that cannotbe fully represented by a single factor. During these periods,the scaled residuals are dominated bym/z corresponding tohydrocarbons.
Figure 3 shows the effect of thep on theQcont time se-ries. Here, we plot1Qcont between thep− and (p+1)-factorsolution, that is:
1Qcont=
(m∑j
(eij/sij
)2)p
−
(m∑j
(eij/sij
)2)p+1
(11)
The structure in Fig. 3 indicates an improvement in the modelfit (by transferring the signal from the residuals to the re-solved factors) caused by increasedp. The figure indicatesthat the solution is significantly improved asp increases to 5.Further increases yield significantly less improvement. Ad-ditionally, solutions atp >5 include factors that cannot bevalidated through correlations with external tracers or refer-ence spectra, unreliable low-mass factors and/or elements offactor mixing/splitting behaviour all of which suggest an ex-cessive number of factors (Ulbrich et al., 2009a), particularlyin the OOA-1 and charbroiling factors.
The factor mass spectra and time series of the AMS solu-tion at p=5 are shown in Fig. 4a and b, respectively. Fig-ure 4b also contains the time series for correlated tracer
0.200.150.100.050.00
Frac
tion
of M
ass
Spe
ctru
m
1501401301201101009080706050403020m / z
0.200.150.100.050.00
1501401301201101009080706050403020
0.200.150.100.050.00
1501401301201101009080706050403020
0.200.150.100.050.00
1501401301201101009080706050403020
0.200.150.100.050.00
1501401301201101009080706050403020
F1AMS: Oxygenated Organic Aerosol-1 (OOA-1)
F2AMS: Hydrocarbon-like Organic Aerosol (HOA)
F3AMS: Charbroiling
F4AMS: Biomass Burning Organic Aerosol (BBOA)
F5AMS: Point Source (North)
(a)
2.52.01.51.00.50.0
1/25/2007 1/27/2007 1/29/2007 1/31/2007 2/2/2007 2/4/2007 2/6/2007Date and Time
2.01.51.00.50.0
PM
F Fa
ctor
Mas
s C
once
ntra
tion
(µg/
m3 )
1.20.80.40.0
0.150.100.050.00
Potassium (µg/m
3)
0.80.60.40.2
Acetonitrile (ppbv)
210
SO
4 (µg/m3)
80604020
NO
x (ppbv)
86420
NO
3 (µg/m3)
86420
2.01.51.00.50.0
F1AMS (OOA-1) SO4, NO3
F2AMS (HOA), NOx
F3AMS (Charbroiling)
F4AMS (BBOA), Potassium, Acetonitrile
F5AMS (Point Source)
(b)
Fig. 4. Mass spectra(a) and time series(b) for the PMF solutionto the AMS dataset. Figure 4b includes the time series both forthe PMF factors (black traces, left axis) and selected tracer species(coloured traces, right axes).
species. The mass spectra are normalized so that the sumof each spectrum across allm/z’s is equal to 1. The time se-ries are reported in terms of mass concentration (µg/m3). AllAMS reference spectra described below and in Sect. 3.3.2were obtained from the AMS Spectral Database (Ulbrich etal., 2009b). Table 3 shows the fraction of the total massapportioned to each factor, ratio ofm/z 44/total organics(m/z 44 is the CO+2 ion, a marker for oxygenation) and theestimated O/C ratio (Aiken et al., 2008). Average mass frac-tions are calculated as the mean of the mass fraction timeseries for the designated factor
(gihfhj
/xij
), calculated as:
(gihfhj/xij
)=
(n∑i
gihfij/xij
)/n for a singlem/z (12a)
(gihfhj/xij
)=
(n∑i
(j=AMS∑
j
gihfij/
j=AMS∑j
gihfijxij
))/n
for all AMS m/z (12b)
Here thei subscript is the matrix index and the calculationis performed for thehth factor andj th m/z (specified in the
www.atmos-chem-phys.net/10/1969/2010/ Atmos. Chem. Phys., 10, 1969–1988, 2010

1976 J. G. Slowik et al.: Simultaneous AMS and PTR-MS factor analysis
Table 3. Factor properties for the AMS dataset: percent of total mass apportioned to each factor, ratio ofm/z 44 (CO+
2 ) to total organics,
and estimated O/C ratio (Aiken et al., 2008). The reported mass fraction is the mean of the mass fraction time series,(gihfhj
/xij
)(see
Eq. 12), converted to a percentage. Values greater than 25% are bolded.
OOA-1 HOA Charbroiling Biomass Burning Point Source (North)
% Mass 0.36 0.15 0.32 0.14 0.07m/z 44/org 0.16 < 0.01 0.02 < 0.01 0.08Estimated O/C 0.69 < 0.08 0.16 < 0.08 0.39
table). For AMS data, the calculation is performed over allAMS m/z.
Factor F1AMS (oxygenated organic aerosol, OOA-1) issimilar to OOA-1 factors obtained from AMS data in pre-vious field studies (Zhang et al., 2007) using either the two-component deconvolution technique (Zhang et al., 2005) orPMF analysis (R2=0.96 vs. Zurich winter OOA (Lanz et al.,2008a) andR2=0.90 vs. both Zurich summer OOA-1; Lanzet al., 2007; and Pittsburgh OOA; Zhang et al., 2005). Asshown in Table 3, it is the most oxygenated factor and a ma-jor component of the total mass (∼33%). The OOA-1 fac-tor correlates with particulate sulfate (Fig. 4b,R2=0.71) andwith back trajectories passing over industrial regions to thewest/southwest of Toronto (trajectories were calculated us-ing the NOAA HYSPLIT model; Draxler and Hess, 1998;Draxler and Rolph, 2003; Rolph, 2003).
Factor F2AMS (hydrocarbon-like organic aerosol, HOA)is similar to HOA factors previously observed in the field(Zhang et al., 2007) (R2=0.97 vs. Zurich winter HOA(Lanz et al., 2008a),R2=0.95 vs. Pittsburgh HOA; Zhanget al., 2005, andR2=0.91 vs. Zurich summer HOA; Lanzet al., 2007). The organic functionality can be inves-tigated by analyzing the delta (1) patterns (McLafferty,1980), where1 = m/z–14n+1 (n is an integer). HOAis dominated by the1=0 (i.e., m/z 27, 41, 55, 69, . . . )and 1=2 (m/z 29, 43, 57, 71, . . . ) series, character-istic of alkenes and alkanes, respectively, although somecontribution from oxygenated species such as C2H3O+ islikely. The HOA time series correlates with NOx (Fig. 4b)and is elevated overnight and during the morning rushhour (see Fig. S3http://www.atmos-chem-phys.net/10/1969/2010/acp-10-1969-2010-supplement.pdf).
Factor F3AMS (charbroiling) is a major contributor to thetotal organic mass (∼33%) with strong1=0 and1=2 se-ries. As stated above, these series are characteristic ofalkanes and alkenes. However, for charbroiling emissions,contributions from fatty acids and carbonyls are also likely(e.g. Schauer et al, 1999). The charbroiling factor massspectrum is correlated with reference spectra for charbroil-ing emissions (R2=0.90) and HOA (R2=0.90 vs. Zurich win-ter HOA (Lanz et al., 2008a) and Pittsburgh HOA; Zhanget al., 2005). The difference between the HOA and char-
broiling factors is the relative strength of1=0 and 1=2series (26% each for HOA, 37% and 16%, respectively,for charbroiling). The diurnal profiles of the two fac-tors are distinct, with charbroiling exhibiting strong signalsaround noon (see Fig. S3http://www.atmos-chem-phys.net/10/1969/2010/acp-10-1969-2010-supplement.pdf). During15 min intervals where the total organic mass is dominatedby charbroiling, analysis of the original 1 min data shows theorganic signal concentrated in intense spikes of<1 min dura-tion, which occur exclusively during the operation of a road-side hot dog stand∼25 m from the sampling inlet. Day-to-day variation in the charbroiling signal is determined by thenumber of detected particles as measured by a fast mobil-ity particle sizer (FMPS) (FMPS 3091, TSI, inc., Shoreview,MN, USA) and a condensation particle counter (CPC 3010,TSI, inc., Shoreview, MN, USA), rather than particle size,suggesting that the variation is driven by street-level mixingdynamics.
Factors F4AMS (biomass burning) and F5AMS (pointsource-north) are more difficult to validate due to their lowerconcentrations (see Table 3) and the absence of satisfactorytracer species. Identification of the biomass burning factoris tentative and this factor disappears in the unified dataset.Some features of the biomass burning time series are cor-related with the AMS estimate of potassium (see Fig. 4b).However, AMS potassium measurements are not quantita-tive because of multiple ionization processes, high instru-ment background signal and interference from the C3H+
3 ion.The potassium event on 30 January correlates with high chlo-ride concentrations due to road salt and may be partially in-fluenced by this source. The biomass burning mass spectrumcorrelates only moderately well with previously extractedwood-burning factors (Lanz et al., 2007, 2008a) (R2
∼0.5).However, burning signatures vary significantly with fuel typeand burn conditions (Weimer et al., 2008). This is the onlyfactor with a significant contribution fromm/z 60, which isfrequently used as a tracer for levoglucosan and an indicatorof biomass burning (1.8% of the factor spectrum vs. 0.7% forOOA-1, for whichm/z 60 has the next largest contribution).For the Lanz et al. wood-burning factors,m/z 60 comprisesbetween 1.4% (winter) and 3.2% (summer) of the spectrum(Lanz et al., 2007, 2008a).
Atmos. Chem. Phys., 10, 1969–1988, 2010 www.atmos-chem-phys.net/10/1969/2010/

J. G. Slowik et al.: Simultaneous AMS and PTR-MS factor analysis 1977
200
150
100
50
0
Tim
e-de
pend
ent C
ontri
butio
n to
Qps
eudo
1/25/2007 1/27/2007 1/29/2007 1/31/2007 2/2/2007 2/4/2007 2/6/2007
Date and Time
(a)
20
18
16
14
12
10
8
6
4
2
0
Q /
Qex
pect
ed
87654321
Factors in Solution (p)
Pseudo-Robust Method Qpseudo Qtrue
PMF2 Robust Mode
Qrobust Qtrue
y = 1
(b)
Fig. 5. (a)Time-dependent contribution toQpseudofor the PTR-MSdataset atp=5. (b) RatioQ/Qexpectedas a function ofp.
A unique feature of the F5AMS (point source-north) massspectrum is the prominent signal atm/z 56 (16% of to-tal). The presence ofm/z 44 indicates oxygenation, sug-gesting thatm/z 56 may be influenced by C3H4O+ frag-ment, obtained from alkylcycloalkanones. However, con-tributions from C4H+
8 (cycloalkanes and branched alkenes),or C3H6N+ (cyclic amines) cannot be ruled out. The pointsource-north time series does not correlate with any avail-able tracer species or with the total organic mass (dominatedby the charbroiling and OOA-1 factors), but is observedonly during north/northeast winds suggesting a specific pointsource of primary emissions.
3.2 PTR-MS dataset
For the PTR-MS dataset, a solution atp=5 was selected us-ing similar criteria to the AMS dataset. Summary statis-tics for this solution are presented in Table 2. Thep=5solution contains the following factors: (1) traffic, (2) longrange transport (LRT)+local source, (3) LRT+painting, (4)local oxidation, and (5) oxygenates. Solutions were anal-ysed using both the pseudo-robust method and robust mode,yielding similar Q-values and near-identicalF and G ma-trices. The discussion below pertains to solutions obtained
300
200
100
0
∆Qpseudo
1/25/2007 1/27/2007 1/29/2007 1/31/2007 2/2/2007 2/4/2007 2/6/2007
Date and Time
300
200
100
0
300
200
100
0
300
200
100
0
p = 2 → p = 3
p = 3 → p = 4
p = 4 → p = 5
p = 5 → p = 6
Fig. 6. Effect of the number of factors contained in a solution(p) on the time-dependent contribution toQpseudofor the PTR-MSdataset.
at fPeak=0 and seed=1; solutions at other values are shownin Figs. S4 and S5 (http://www.atmos-chem-phys.net/10/1969/2010/acp-10-1969-2010-supplement.pdf). Similar tothe AMS dataset, solutions at non-zero fPeak did not signif-icantly improve correlations with external tracer species andthe solution with the lowestQ-value (fPeak=0) is discussedbelow.
Figure 5a and b show the pseudo-robustQcont time seriesandQ/Qexpectedas a function ofp. As was the case for theAMS dataset, the time series contains significant temporalstructure, denoting periods where the model description isimperfect. In Fig. 6, the1Qcont time series (see Eq. 11) as afunction ofp is plotted. The most improvement is obtainedasp increases to 5. Note also that the (smaller) improve-ments obtained atp=6 occur in periods that are describedby preexisting factors (e.g. the structure on 1 February atp=2→3 vs. p=5→6), suggesting minor source variationsand/or factor splitting. Similar results are obtained atp >6.
The PTR-MS factor mass spectra and time series atp=5are presented in Fig. 7a and 7b, respectively. Mass spectraare normalized so that the sum of each spectrum is equal to 1and time series are reported in ppbv. Table 4 shows the frac-tion of signal apportioned to each factor on anm/z-by-m/z
basis and the toluene/benzene ratio (see Eq. 12 for the meanmass fraction calculation). The toluene/benzene ratio can beused as a photochemical clock, because these two aromat-ics are typically emitted by similar sources, but toluene hasa shorter lifetime (Roberts et al., 1984). In the present study,source emissions were estimated to have a toluene/benzeneratio of∼4.0 and the ratio decreases below 1 with increasingphotochemical age. The source emission ratio is consistentwith previous measurements of fresh traffic emissions (Kris-tensson et al., 2004; de Gouw et al., 2005).
www.atmos-chem-phys.net/10/1969/2010/ Atmos. Chem. Phys., 10, 1969–1988, 2010

1978 J. G. Slowik et al.: Simultaneous AMS and PTR-MS factor analysis
Table 4. Factor properties for the PTR-MS dataset: toluene/benzene ratio and percent of signal at eachm/z apportioned to the designated
factor. The reported mass fractions are the mean of the mass fraction time series,(gihfhj
/xij
)(see Eq. 12), converted to percentage. Values
greater than 25% are bolded.
Traffic LRT+Local Source LRT+Painting Local Oxidation Oxygenates
Tol/Benz 2.99 3.23 2.27 0.47 0.74% m/z 31 8.5 7.6 9.4 22.3 52.2% m/z 43 25.0 33.4 8.0 10.8 22.5% m/z 45 7.8 6.0 9.0 60.8 16.4% m/z 59 15.0 8.5 50.4 18.5 7.8% m/z 61 5.6 52.4 6.0 20.2 16.3% m/z 73 4.6 35.8 48.3 3.5 10.1% m/z 79 37.0 9.3 11.4 25.2 16.5% m/z 93 57.1 16.1 13.8 7.2 6.9% m/z 107 63.6 13.8 9.6 4.7 8.8% m/z 121 60.1 8.6 9.7 11.8 10.6
0.20.10.0
Frac
tion
of M
ass
Spe
ctru
m
31 43 45 59 61 73 79 93 107 121m / z
0.20.10.0
31 43 45 59 61 73 79 93 107 121
0.40.30.20.10.0
31 43 45 59 61 73 79 93 107 121
0.60.40.20.0
31 43 45 59 61 73 79 93 107 121
0.40.20.0
31 43 45 59 61 73 79 93 107 121
F1PTR: Traffic
F2PTR: LRT + Local Source
F3PTR: LRT + Painting
F4PTR: LRT + Local Oxidation
F5PTR: Oxygenates (Source Unknown)
(a)
80604020
NO
x (ppbv)
1/25/2007 1/27/2007 1/29/2007 1/31/2007 2/2/2007 2/4/2007 2/6/2007Date and Time
86420
Mix
ing
Rat
io (p
pbv)
10
5
0
5.0
2.5
0.04.03.02.01.00.03.02.01.00.0
-20-15-10-50
Temperature (°C
)
86420
AM
S O
OA
-1 (µg/m3)
86420
F1PTR (Traffic), NOx
F2PTR (LRT+Local Source) AMS-OOA-1
F3PTR (LRT+Painting) AMS-OOA-1
F4PTR (Local Oxidation), Temperature
F5PTR (Oxygenates)
(b)
Fig. 7. Mass spectra(a) and time series(b) for the PMF solu-tion to the PTR-MS dataset. Figure 7b includes the time seriesboth for the PMF factors (black traces, left axis) and selected tracerspecies (coloured traces, right axes). Note that the temperature axis(vs. F4PTR) is reversed.
Factor F1PTR (traffic) dominates the aromatic sig-nal (∼40–70% depending onm/z, see Table 4). Thetoluene/benzene ratio (2.99) indicates fresh emis-sions. The F1PTR factor peaks during the morning andevening rush hours (4–5 times nighttime values, seeFig. S6 http://www.atmos-chem-phys.net/10/1969/2010/acp-10-1969-2010-supplement.pdf) and is slightly elevatedduring the rest of the day. As shown in Fig. 7b, the factorcorrelates strongly with NOx (R2=0.64).
The F2PTR (LRT+local source) is dominated by signal atm/z 61 (acetic acid). The factor time series (Fig. 6b) corre-lates well with AMS-OOA-1 (F1AMS) for most of the study,suggesting a contribution from transported, well-processedair. However, this correlation breaks down during the periodof 29–31 January, where strong spikes in the factor time se-ries are not reflected in the OOA-1 data. Such short-lived andintense features in the F2PTR time series likely indicate a lo-cal source. Further, the factor toluene/benzene ratio (3.23) isconsistent with fresh emissions, although the aromatics are aminor component. Acetic acid is a product of ambient photo-chemical reactions, but has also been observed in emissionsfrom spark-ignition engines (Zervas et al., 2001). The abovedata suggests that F2PTR is influenced by both LRT and localemissions and that these contributions cannot be decoupledthrough PMF using only the PTR-MS dataset. As discussedlater, the effects of these sources can be largely decoupled inthe unified AMS/PTR-MS dataset.
Factor F3PTR (LRT+painting) likewise results from in-separable sources. Similar to the LRT+local source fac-tor, LRT+painting correlates with AMS-OOA-1, exceptingspikes in F3PTR that correlate with local painting activity.Additionally, the toluene/benzene ratio (2.27) suggests somecontributions from local emissions sources. The factor massspectrum is dominated by acetone and constitutes more thanhalf of the total acetone signal. Other major components
Atmos. Chem. Phys., 10, 1969–1988, 2010 www.atmos-chem-phys.net/10/1969/2010/
J. G. Slowik et al.: Simultaneous AMS and PTR-MS factor analysis 1979
includem/z 45 (acetaldehyde) andm/z 73 (methyl ethyl ke-tone, methylglyoxal, butanal), though this is a small fractionof the total acetaldehyde (see Table 4). However, most of thenon-residualm/z 73 is assigned to F3PTR. Both acetone andmethyl ethyl ketone have primary emission sources (includ-ing paint solvents), but are also generated as photochemi-cal reaction products. Similar to F2PTR, F3PTR is affectedby both local emissions and transported air and decouplingof the two effects is improved in the unified AMS/PTR-MSdataset.
F4PTR (local oxidation) is dominated by acetaldehyde, aVOC oxidation product with a lifetime of less than a day. Thesignals atm/z 31, 59 and 61 are attributed to formaldehyde,acetone (with potential minor contributions from propanaland glyoxal) and acetic acid, respectively, which are all pro-duced from VOC oxidation. In contrast to the factors de-scribed above, this factor has a low toluene/benzene ratio(0.47, see Table 4), indicating a greater extent of photochem-ical processing. However, the relatively short lifetimes offormaldehyde and acetaldehyde suggest local oxidation (asopposed to LRT). Although there are no correlated tracerspecies available, this is not surprising because all availabletracers are expected to correlate with either direct emissionsor transported, aged air. F4PTR is anticorrelated with temper-ature (R2=0.50), as shown in Fig. 7b.
Factor F5PTR (oxygenates) consists of long- and short-lived oxygenated compounds, notably formaldehyde and ac-etaldehyde (though the factor contains only∼15% of the to-tal acetaldehyde). Given the oxygenated nature of this fac-tor, the signal atm/z 43 is probably from the CH3CO+ ion,which results from a variety of oxygenated compounds, in-cluding peroxyacetyl nitrate (PAN), acetone and acetic acid(de Gouw and Warneke, 2007). This factor does not corre-late with any available tracers and exhibits no temperaturedependence. The absence of distinct events in the time seriesand the low toluene/benzene ratio (see Table 4) suggest thatthe factor is not derived from a local point source.
3.3 Unified AMS/PTR-MS dataset
3.3.1 Selection and evaluation of solution
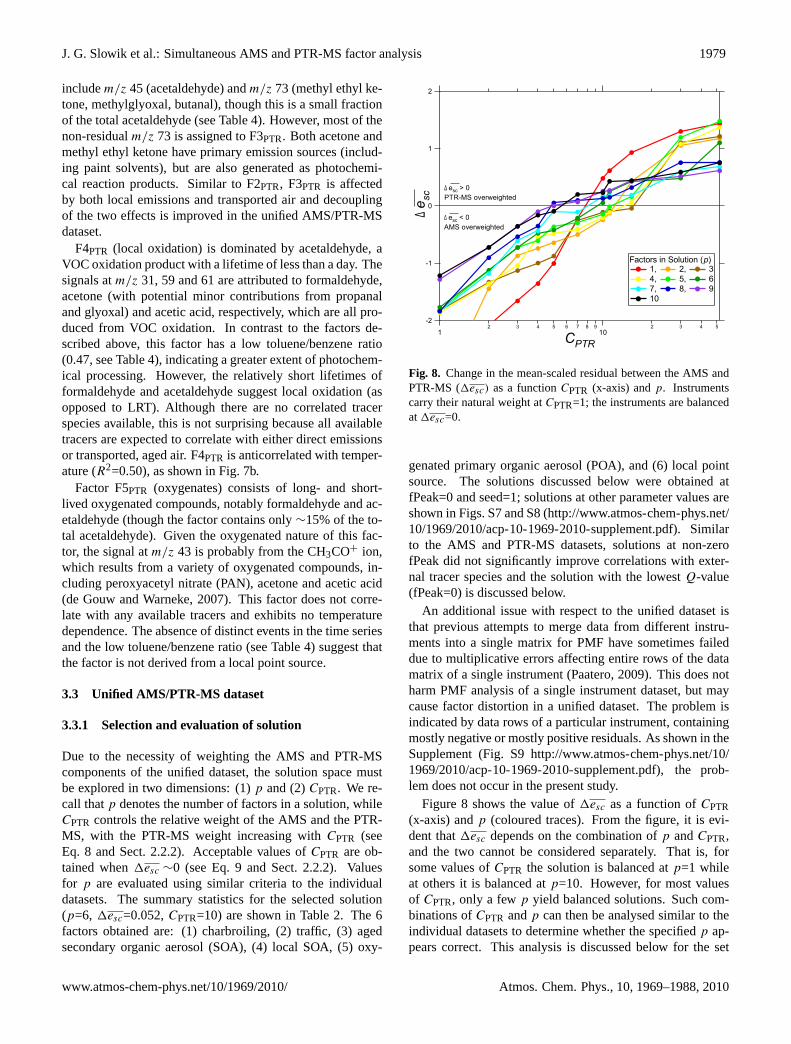
Due to the necessity of weighting the AMS and PTR-MScomponents of the unified dataset, the solution space mustbe explored in two dimensions: (1)p and (2)CPTR. We re-call thatp denotes the number of factors in a solution, whileCPTR controls the relative weight of the AMS and the PTR-MS, with the PTR-MS weight increasing withCPTR (seeEq. 8 and Sect. 2.2.2). Acceptable values ofCPTR are ob-tained when1esc ∼0 (see Eq. 9 and Sect. 2.2.2). Valuesfor p are evaluated using similar criteria to the individualdatasets. The summary statistics for the selected solution(p=6, 1esc=0.052,CPTR=10) are shown in Table 2. The 6factors obtained are: (1) charbroiling, (2) traffic, (3) agedsecondary organic aerosol (SOA), (4) local SOA, (5) oxy-
-2
-1
0
1
2
∆esc
12 3 4 5 6 7 8 9
102 3 4 5
CPTR
Factors in Solution (p) 1, 2, 3 4, 5, 6 7, 8, 9 10
∆ esc > 0PTR-MS overweighted
∆ esc < 0AMS overweighted
Fig. 8. Change in the mean-scaled residual between the AMS andPTR-MS (1esc) as a functionCPTR (x-axis) andp. Instrumentscarry their natural weight atCPTR=1; the instruments are balancedat1esc=0.
genated primary organic aerosol (POA), and (6) local pointsource. The solutions discussed below were obtained atfPeak=0 and seed=1; solutions at other parameter values areshown in Figs. S7 and S8 (http://www.atmos-chem-phys.net/10/1969/2010/acp-10-1969-2010-supplement.pdf). Similarto the AMS and PTR-MS datasets, solutions at non-zerofPeak did not significantly improve correlations with exter-nal tracer species and the solution with the lowestQ-value(fPeak=0) is discussed below.
An additional issue with respect to the unified dataset isthat previous attempts to merge data from different instru-ments into a single matrix for PMF have sometimes faileddue to multiplicative errors affecting entire rows of the datamatrix of a single instrument (Paatero, 2009). This does notharm PMF analysis of a single instrument dataset, but maycause factor distortion in a unified dataset. The problem isindicated by data rows of a particular instrument, containingmostly negative or mostly positive residuals. As shown in theSupplement (Fig. S9http://www.atmos-chem-phys.net/10/1969/2010/acp-10-1969-2010-supplement.pdf), the prob-lem does not occur in the present study.
Figure 8 shows the value of1esc as a function ofCPTR(x-axis) andp (coloured traces). From the figure, it is evi-dent that1esc depends on the combination ofp andCPTR,and the two cannot be considered separately. That is, forsome values ofCPTR the solution is balanced atp=1 whileat others it is balanced atp=10. However, for most valuesof CPTR, only a fewp yield balanced solutions. Such com-binations ofCPTR andp can then be analysed similar to theindividual datasets to determine whether the specifiedp ap-pears correct. This analysis is discussed below for the set
www.atmos-chem-phys.net/10/1969/2010/ Atmos. Chem. Phys., 10, 1969–1988, 2010

1980 J. G. Slowik et al.: Simultaneous AMS and PTR-MS factor analysis
Table 5. Factor properties for the unified dataset: factor-by-factor ratio ofm/z 44 (CO+
2 ) to total organics, estimated O/C ratio (Aiken et al.,2008), toluene/benzene ratio, and apportionment of total AMS mass and PTR-MS signal bym/z. The reported mass fractions are the mean
of the mass fraction time series,(gihfhj
/xij
)(see Eq. 12), converted to percentage. Values greater than 25% are bolded.
Charbroil. Traffic Aged SOA Local SOA Ox. POA Local Point Source
AMS % Mass 44.5 7.6 31.8 11.3 4.1 4.0AMS m/z 44/org 0.02 < 0.01 0.14 0.10 0.095 < 0.01AMS est. O/C 0.16 < 0.08 0.61 0.46 0.44 < 0.08PTR-MS Tol/Benz 2.27 3.42 0.54 0.16 1.46 4.62PTR-MS %m/z 31 6.4 2.1 18.7 25.8 44.7 2.4PTR-MS %m/z 43 12.3 6.3 17.6 12.8 26.4 24.3PTR-MS %m/z 45 < 0.1 13.5 < 0.1 64.0 18.0 4.4PTR-MS %m/z 59 3.8 40.8 41.8 3.7 10.0 < 0.1PTR-MS %m/z 61 0.1 < 0.1 23.9 22.5 21.0 33.0PTR-MS %m/z 73 < 0.1 27.5 42.6 < 0.1 13.4 18.5PTR-MS %m/z 79 19.3 15.8 9.4 23.1 23.1 10.9PTR-MS %m/z 93 23.7 28.3 2.8 2.2 18.6 25.7PTR-MS %m/z 107 27.7 27.6 < 0.1 < 0.1 20.1 26.5PTR-MS %m/z 121 29.2 25.0 < 0.1 5.2 22.7 19.9
of solutions atCPTR=10. The issue of what values of1esc
indicate a balanced solution is explored in Sect. 3.3.3.Summary statistics for the solution atCPTR=10, p=6 are
shown in Table 2. Figure 9a shows theQcont time seriesin terms of the totalQ and theQ derived from the indi-vidual instruments. Figure 9b showsQ/Qexpectedas a func-tion of p. For theQ calculations in Table 2 and Fig. 9b,CPTR has been removed from the uncertainty matrix to fa-cilitate comparison with the individual datasets. In Fig. 9a,CPTR is left in place so that theQcont,AMS and Qcont,PTRtime series can be compared. The unifiedQcont time se-ries (withCPTR removed) are overlaid with those of the in-dividual datasets in Fig. S10 (http://www.atmos-chem-phys.net/10/1969/2010/acp-10-1969-2010-supplement.pdf). TheQ-value atp=6 is somewhat higher than those of the indi-vidual datasets. The time series indicate that this is mostlyattributable to the AMS components. Similar to the individ-ual dataset, theQcont,AMS contains local source-derived con-centration spikes. However,Qcont,AMS also resembles theAMS-biomass burning and AMS-point source-north factors(Fig. 4b), which, as shown below, are not resolved in the uni-fied dataset. TheQcont,PTR time series is qualitatively similarto that obtained from the individual PTR-MS dataset (Fig. 5).
Figure 10 shows the1Qcont,AMS and1Qcont,PTR time se-ries (see Eq. 11) as a function ofp. The AMS solution signif-icantly improves up top=4, but not beyond. While the PTR-MS does not show a clear point beyond which1Qcont,PTRdecreases, beyondp=6 the structure in1Qcont,PTR occursmostly in periods that are described by pre-existing factorsand splitting of the aged SOA factor occurs. However, thepossibility of meaningful factors at higherp cannot be com-pletely ruled out due to the higher-than-expectedQ-valuesand absence of factors resolved in the individual datasets.
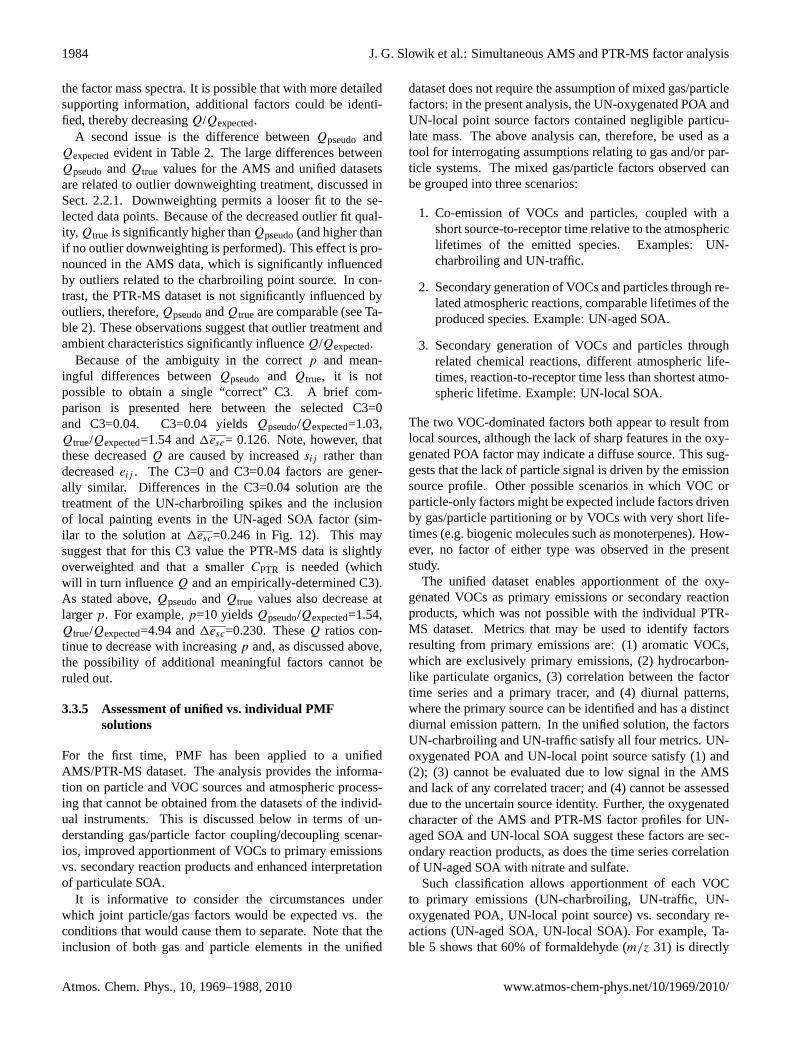
3.3.2 Physical interpretation of factors
Factor mass spectra and time series are shown in Fig. 11aand b, respectively. For presentation and intercomparisonpurposes, we do not directly report thefhj andgih(here i
and j are the matrix indices for time points andm/z, re-spectively; the calculation is performed for thehth factor).Instead, the mass spectra are re-normalized so that the sumof each spectrum for each instrument equals one, that is:
fhj
/j=AMS∑
j
fhj andfhj
/j=PTR∑
j
fhj for the AMS and PTR-
MS, respectively. The time series are scaled such that themean concentration of each factor is one, that is:gih
/gih.
We reportgih,AMS andgih,PTR for each factor, calculated as:
gih,AMS = gih
(j=AMS∑
j
fhj
/∑j
fhj
)(13a)
gih,PTR= gih
(j=PTR∑
j
fhj
/∑j
fhj
)(13b)
In these figures, the AMS and PTR-MS time series (in µg/m3
and ppbv) for the unified dataset are obtained as the prod-uct of eithergih,AMS or gih,PTR with the displayed time se-ries. Parameters tabulated for the individual datasets are re-ported for the unified datasets in Table 5 (see Eq. 12 forthe mean-mass fraction calculation). Related factors in theindividual and unified datasets are overlaid in the Supple-ment (Figs. S11 and S12http://www.atmos-chem-phys.net/10/1969/2010/acp-10-1969-2010-supplement.pdf). Diurnalprofiles are shown in Fig. S13. As previously stated, all
Atmos. Chem. Phys., 10, 1969–1988, 2010 www.atmos-chem-phys.net/10/1969/2010/

J. G. Slowik et al.: Simultaneous AMS and PTR-MS factor analysis 1981
16x103
14
12
10
8
6
4
2
0
Tim
e-de
pend
ent C
ontri
butio
n to
Qpseudo
1/25/2007 1/27/2007 1/29/2007 1/31/2007 2/2/2007 2/4/2007 2/6/2007Date and Time
12x103
8
4
012x103
8
4
0
Unified Dataset: Total
Unified Dataset: AMS
Unified Dataset: PTR-MS
(a)
Fig. 9. (a) Time-dependent contribution toQpseudofor the uni-fied dataset atp=6. Separate traces are shown for the totalQpseudoand the contributions from the AMS and PTR-MS components.(b)Q/Qexpectedas a function ofp.
AMS reference spectra described below were obtained fromthe AMS Spectral Database (Ulbrich et al., 2009b).
Factor F1UN (charbroiling) is very similar to that of theAMS-charbroiling factor. The time trend of UN-charbroilingalso correlates with PTR-MSm/z 69 (R2=0.53), excludedfrom the PMF analysis due to low signal-to-noise. Severalcompounds contribute tom/z 69, including furan, whichis produced during meat cooking (Lee, 1999) and othercombustion-related processes (Beychok, 1987; Andreae andMerlet, 2001). Aromatic VOCs are enhanced (see Table 5),consistent with combustion processes. Previous discussionsof the AMS-charbroiling factor hold for UN-charbroiling,notably that the particle mass spectrum is characteristic ofaliphatic hydrocarbons and that the time series is dominatedby short-duration concentration spikes clustered in the earlyafternoon (see Fig. S13). The UN-charbroiling factor ac-counts for a significantly larger fraction of the particulatemass than AMS-charbroiling (∼50% vs.∼33%).
Factor F2UN (traffic) is correlated with NOx (Fig. 11b),similar to AMS-HOA and PTR-traffic. The notable differ-
1.0x10⁴
0.80.60.40.20.0
1/25/2007 1/27/2007 1/29/2007 1/31/2007 2/2/2007 2/4/2007 2/6/2007Date and Time
1.0x10⁴
0.80.60.40.20.0
∆Qps
eudo
1.0x10⁴
0.80.60.40.20.0
1.0x10⁴
0.80.60.40.20.0
1.0x10⁴
0.80.60.40.20.0
p = 2 → p = 3
p = 3 → p = 4
AMS, PTR-MS
p = 4 → p = 5
p = 5 → p = 6
p = 6 → p = 7
Fig. 10. Effect of the number of factors contained in a solutionon Qpsuedofor the unified dataset. AMS (red) and PTR-MS (blue)contributions are plotted separately.
ences in the time series are lower particle mass (vs. AMS-HOA) and inclusion of some painting emissions (vs. PTR-traffic). The painting emissions cause an increase in theacetone and MEK contribution to the UN-traffic VOCmass spectrum. The UN-traffic and AMS-HOA particlemass spectra are similar (hydrocarbon-dominated). Thetoluene/benzene ratio (3.42) and contributions from aromaticVOCs indicate fresh emissions (see Table 5).
Factor F3UN (aged SOA) is similar to AMS-OOA-1(R2=0.995, see Fig. S11http://www.atmos-chem-phys.net/10/1969/2010/acp-10-1969-2010-supplement.pdf) and pre-viously reported OOA-1 spectra (Lanz et al., 2007; Ulbrichet al., 2009a). Table 5 shows this to be the most oxy-genated factor. Figure 11b shows correlation with AMSnitrate and sulfate. Back trajectory analysis indicates thatthe factor correlates with airflow over the industrialized re-gions west/southwest of Toronto. The PTR-MS mass spec-trum is unique to the unified dataset and dominated by sig-nals attributable to oxygenated species, particularly acetone(m/z 59). These species are consistent with secondaryoxidation, though they also have direct emission sources.Strong correlation between acetone and aged particulateSOA is consistent with previous observations (Vlasenko etal., 2009). The factor mass spectra and correlations indicateregional transport of secondary organic aerosol. The appor-tionment of oxygenated VOCs such as acetone to secondaryvs. primary factors is an important feature of the unifieddataset solution and is discussed further in Sect. 3.3.5.
Factor F4UN (local SOA) is dominated by acetaldehyde.Both the factor time series and VOC mass spectrum are sim-ilar to PTR-local oxidation (see Fig. S12). The dominantspecies in the UN-local SOA factor (acetaldehyde and to alesser extent formaldehyde) have lifetimes of less than a day,while those in the UN-aged SOA factor (acetone, to a lesserextent acetic acid and MEK) have lifetimes in the order ofweeks (Atkinson et al., 2006). Both the toluene/benzene
www.atmos-chem-phys.net/10/1969/2010/ Atmos. Chem. Phys., 10, 1969–1988, 2010

1982 J. G. Slowik et al.: Simultaneous AMS and PTR-MS factor analysis
0.20.10.0
31 43 45 59 61 73 79 93 107 121PTR-MS m / z
0.40.30.20.10.0
0.60.40.20.0
0.2
0.0
0.30.20.10.0
0.20.10.0
Fraction of PTR
-MS
Spectrum
0.150.100.050.00
Frac
tion
of A
MS
Spe
ctru
m
1501401301201101009080706050403020AMS m / z
0.150.100.050.00
1501401301201101009080706050403020
0.150.100.050.00
1501401301201101009080706050403020
0.150.100.050.00
1501401301201101009080706050403020
0.150.100.050.00
1501401301201101009080706050403020
0.150.100.050.00
1501401301201101009080706050403020
(a) F1UN: Charbroiling
F2UN: Traffic
F3UN: Aged SOA
F4UN: Local SOA
F5UN: Oxygenated POA
F6UN: Local Point Source
0.80.60.40.2
PTR
m/z 69 (A
U)
1/25/2007 1/27/2007 1/29/2007 1/31/2007 2/2/2007 2/4/2007 2/6/2007Date and Time
10
5
0
Inte
nsity
Rel
ativ
e to
Mea
n: g ih
/ gih
80604020
NO
x (ppbv)
86420
NO
3 (µg/m3)
210
SO
4 (µg/m3)
-20-15-10-50
Temperature (C
)
43210
4
2
0
2.01.51.00.50.0
3210
10
5
0
F1UN (Charbroiling) PTR m/z 69
F2UN (Traffic) NOx
F3UN (Aged SOA) NO3, SO4
F4UN (Local SOA) Temperature
F5UN (Oxygenated POA)
F6UN (Local Point Source)
gih,AMS = 1.14 µ g/m3
gih,PTR = 0.63 ppbv
gih,AMS = 0.16 µ g/m3
gih,PTR = 1.59 ppbv
gih,AMS = 0.05 µ g/m3
gih,PTR = 0.86 ppbv
gih,AMS = 0.08 µ g/m3
gih,PTR = 1.72 ppbv
gih,AMS = 0.72 µ g/m3
gih,PTR = 0.93 ppbv
gih,AMS = 0.12 µ g/m3
gih,PTR = 1.08 ppbv
Fig. 11. Mass spectra(a) and time series(b) for the PMF solutionto the unified dataset. Figure 11b includes the time series both forthe PMF factors (black traces, left axis) and selected tracer species(coloured traces, right axis). Note the temperature axis (vs. F4UN)
is reversed. PTR-MSm/z 69 is plotted in arbitrary units.
ratio and the total aromatic VOC concentration are very low,suggesting secondary production. The AMS mass spectrumresembles AMS-OOA-1 and UN-aged SOA, but has propor-tionally less signal atm/z 44 (m/z 44/total organics=0.10,vs. 0.16 for AMS-OOA-1 and 0.14 for UN-aged SOA), in-dicating less oxygenation (Aiken et al., 2009). Similarly,the total spectral intensity atm/z >44 relative tom/z 44 ishigher for UN-local SOA (4.5 for UN-local SOA vs. 2.4 forUN-aged SOA). These trends are suggestive of the OOA-2factors observed in Zurich (Lanz et al., 2007) and Pittsburgh(Ulbrich et al., 2009a), which were attributed to more volatileand/or fresher oxygenated organics, though the trends in thecurrent study are less pronounced. However, the ratio ofm/z 43 tom/z 44 is similar between the UN-aged SOA andUN-local SOA (∼0.45), contrasting with previous measure-ments that show a higher 43/44 ratio for OOA-2 than OOA-1.The correlations of UN-local SOA with shorter-lived oxy-genated VOCs and anticorrelation with temperature suggestthat both the oxidation timescale and volatility contributehere to the factor time series. In the present study, the AMScomponent of this OOA-2-like factor can only be resolvedthrough the unified dataset.
Factor F5UN (oxygenated POA) includes a VOC spectrumwith large contributions from both oxygenated and aromaticVOCs. The particle mass spectrum is nearly as oxygenated asthat of the UN-local SOA factor, however the fraction of ap-portioned particle mass is below the∼5% threshold requiredfor AMS factor resolution (Ulbrich et al., 2009a). The higharomatic VOC content and toluene/benzene ratio suggest pri-mary emissions.
Factor F6UN (local point source) occurs almost exclusivelyin a few discrete events and has a very high toluene/benzeneratio (4.62), suggesting a local primary emissions source.These events match those in the PTR-LRT+local source fac-tor (see Fig. S12http://www.atmos-chem-phys.net/10/1969/2010/acp-10-1969-2010-supplement.pdf) and are not con-nected with those of the AMS-point source-north factor.Compared to the PTR-LRT+local source factor, UN-localpoint source has a larger contribution from aromatic VOCs, ahigher toluene/benzene ratio and a smaller contribution fromoxygenates, suggesting that the unified dataset has an im-proved resolution between primary and secondary species.The particle spectrum is hydrocarbon-like, but falls belowthe∼5% reliability threshold.
3.3.3 Unified dataset solutions as a function of1esc
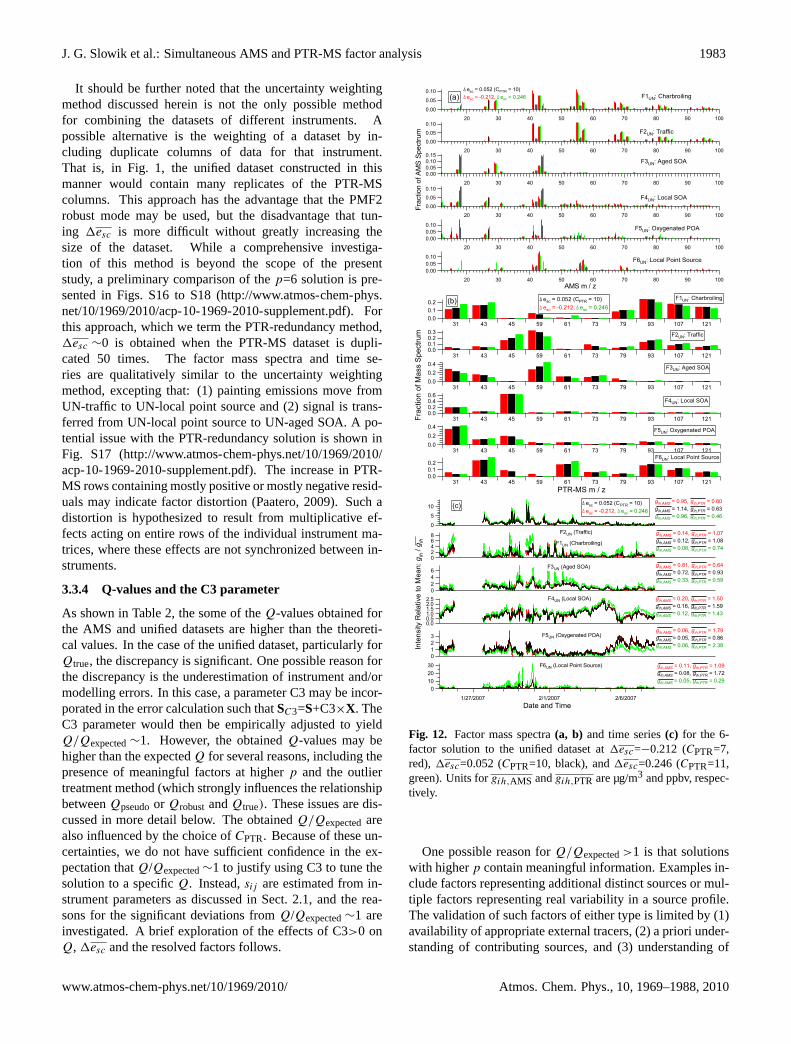
An important issue in the evaluation of the unified dataset isthe extent to which the solution changes with1esc, i.e. howclose to1esc=0 a solution must be to be balanced. This isanalysed in the present dataset through the comparison of thesolution discussed above (1esc=0.052,p=6) with p=6 solu-tions obtained at1esc ∼ ±0.25,∼ ±0.5, and∼ ±1. Thesecomparisons are shown in Figs. 12, S14, and S15, respec-tively.
The 1esc ∼ ±0.25 (Fig. 12) solutions are mostly similarto 1esc=0.052, however, already some differences are ap-parent. At1esc=0.246, the painting emissions are trans-ferred from UN-traffic to UN-aged SOA (see Fig. 12b andc). However, this does not occur at1esc=−0.212. (Note thatthe magnitude of the UN-local point source events (productof gih,PTR and the time series) is similar between these twosolutions.) Additional differences are apparent as1esc di-verges farther from 0. For example, at1esc=−0.481, theAMS is sufficiently overweighted that the UN-oxygenatedPOA factor is replaced by a factor resembling AMS-pointsource-north (see Fig. S14). The solutions begin to ap-proach those of the individual datasets beyond1esc = ±1(see Fig. S15).
From this analysis,1esc = ±0.25 approximately corre-sponds to the point where significant deviations from the1esc=0 solution are observed. However, as this analysis hasbeen conducted on only one dataset, it is not certain whetherthis is a general property or if it varies with the dataset anal-ysed.
Atmos. Chem. Phys., 10, 1969–1988, 2010 www.atmos-chem-phys.net/10/1969/2010/
J. G. Slowik et al.: Simultaneous AMS and PTR-MS factor analysis 1983
It should be further noted that the uncertainty weightingmethod discussed herein is not the only possible methodfor combining the datasets of different instruments. Apossible alternative is the weighting of a dataset by in-cluding duplicate columns of data for that instrument.That is, in Fig. 1, the unified dataset constructed in thismanner would contain many replicates of the PTR-MScolumns. This approach has the advantage that the PMF2robust mode may be used, but the disadvantage that tun-ing 1esc is more difficult without greatly increasing thesize of the dataset. While a comprehensive investiga-tion of this method is beyond the scope of the presentstudy, a preliminary comparison of thep=6 solution is pre-sented in Figs. S16 to S18 (http://www.atmos-chem-phys.net/10/1969/2010/acp-10-1969-2010-supplement.pdf). Forthis approach, which we term the PTR-redundancy method,1esc ∼0 is obtained when the PTR-MS dataset is dupli-cated 50 times. The factor mass spectra and time se-ries are qualitatively similar to the uncertainty weightingmethod, excepting that: (1) painting emissions move fromUN-traffic to UN-local point source and (2) signal is trans-ferred from UN-local point source to UN-aged SOA. A po-tential issue with the PTR-redundancy solution is shown inFig. S17 (http://www.atmos-chem-phys.net/10/1969/2010/acp-10-1969-2010-supplement.pdf). The increase in PTR-MS rows containing mostly positive or mostly negative resid-uals may indicate factor distortion (Paatero, 2009). Such adistortion is hypothesized to result from multiplicative ef-fects acting on entire rows of the individual instrument ma-trices, where these effects are not synchronized between in-struments.
3.3.4 Q-values and the C3 parameter
As shown in Table 2, the some of theQ-values obtained forthe AMS and unified datasets are higher than the theoreti-cal values. In the case of the unified dataset, particularly forQtrue, the discrepancy is significant. One possible reason forthe discrepancy is the underestimation of instrument and/ormodelling errors. In this case, a parameter C3 may be incor-porated in the error calculation such thatSC3=S+C3×X. TheC3 parameter would then be empirically adjusted to yieldQ/Qexpected∼1. However, the obtainedQ-values may behigher than the expectedQ for several reasons, including thepresence of meaningful factors at higherp and the outliertreatment method (which strongly influences the relationshipbetweenQpseudoor QrobustandQtrue). These issues are dis-cussed in more detail below. The obtainedQ/Qexpectedarealso influenced by the choice ofCPTR. Because of these un-certainties, we do not have sufficient confidence in the ex-pectation thatQ/Qexpected∼1 to justify using C3 to tune thesolution to a specificQ. Instead,sij are estimated from in-strument parameters as discussed in Sect. 2.1, and the rea-sons for the significant deviations fromQ/Qexpected∼1 areinvestigated. A brief exploration of the effects of C3>0 onQ, 1esc and the resolved factors follows.
0.10
0.05
0.00
Frac
tion
of A
MS
Spe
ctru
m
1009080706050403020AMS m / z
0.10
0.05
0.00
1009080706050403020
0.150.100.050.00
1009080706050403020
0.10
0.050.00
1009080706050403020
0.100.050.00
1009080706050403020
0.100.050.00
1009080706050403020
(a) F1UN: Charbroiling
F2UN: Traffic
F3UN: Aged SOA
F4UN: Local SOA
F5UN: Oxygenated POA
F6UN: Local Point Source
∆ esc = 0.052 (CPTR = 10)∆ esc = -0.212, ∆ esc = 0.246
0.20.10.0
Frac
tion
of M
ass
Spe
ctru
m
31 43 45 59 61 73 79 93 107 121PTR-MS m / z
0.30.20.10.0
31 43 45 59 61 73 79 93 107 121
0.40.20.0
31 43 45 59 61 73 79 93 107 121
0.60.40.20.0
31 43 45 59 61 73 79 93 107 121
0.40.20.0
31 43 45 59 61 73 79 93 107 121
0.20.10.0
31 43 45 59 61 73 79 93 107 121
F1UN: Charbroiling
F2UN: Traffic
F3UN: Aged SOA
F4UN: Local SOA
F5UN: Oxygenated POA
F6UN: Local Point Source
(b) ∆ esc = 0.052 (CPTR = 10)∆ esc = -0.212, ∆ esc = 0.246
10
5
0
Inte
nsity
Rel
ativ
e to
Mea
n: gih / g ih
1/27/2007 2/1/2007 2/6/2007Date and Time
86420
6420
2.52.01.51.00.50.0
3210
302010
0
F1UN (Charbroiling)
F2UN (Traffic)
F3UN (Aged SOA)
F4UN (Local SOA)
F5UN (Oxygenated POA)
F6UN (Local Point Source)
gih,AMS = 0.95, gih,PTR = 0.60gih,AMS = 1.14, gih,PTR = 0.63gih,AMS = 0.96, gih,PTR = 0.46
gih,AMS = 0.14, gih,PTR = 1.07gih,AMS = 0.12, gih,PTR = 1.08gih,AMS = 0.08, gih,PTR = 0.74
gih,AMS = 0.81, gih,PTR = 0.64gih,AMS = 0.72, gih,PTR = 0.93gih,AMS = 0.33, gih,PTR = 0.59
gih,AMS = 0.20, gih,PTR = 1.50gih,AMS = 0.16, gih,PTR = 1.59gih,AMS = 0.12, gih,PTR = 1.43
gih,AMS = 0.06, gih,PTR = 1.79gih,AMS = 0.05, gih,PTR = 0.86gih,AMS = 0.06, gih,PTR = 2.38
gih,AMS = 0.11, gih,PTR = 1.09gih,AMS = 0.08, gih,PTR = 1.72gih,AMS = 0.05, gih,PTR = 0.29
∆ esc = 0.052 (CPTR = 10)∆ esc = -0.212, ∆ esc = 0.246
(c)
Fig. 12. Factor mass spectra(a, b) and time series(c) for the 6-factor solution to the unified dataset at1esc=−0.212 (CPTR=7,red), 1esc=0.052 (CPTR=10, black), and1esc=0.246 (CPTR=11,green). Units forgih,AMS andgih,PTR are µg/m3 and ppbv, respec-tively.
One possible reason forQ/Qexpected>1 is that solutionswith higherp contain meaningful information. Examples in-clude factors representing additional distinct sources or mul-tiple factors representing real variability in a source profile.The validation of such factors of either type is limited by (1)availability of appropriate external tracers, (2) a priori under-standing of contributing sources, and (3) understanding of
www.atmos-chem-phys.net/10/1969/2010/ Atmos. Chem. Phys., 10, 1969–1988, 2010
1984 J. G. Slowik et al.: Simultaneous AMS and PTR-MS factor analysis
the factor mass spectra. It is possible that with more detailedsupporting information, additional factors could be identi-fied, thereby decreasingQ/Qexpected.
A second issue is the difference betweenQpseudo andQexpectedevident in Table 2. The large differences betweenQpseudoandQtrue values for the AMS and unified datasetsare related to outlier downweighting treatment, discussed inSect. 2.2.1. Downweighting permits a looser fit to the se-lected data points. Because of the decreased outlier fit qual-ity, Qtrue is significantly higher thanQpseudo(and higher thanif no outlier downweighting is performed). This effect is pro-nounced in the AMS data, which is significantly influencedby outliers related to the charbroiling point source. In con-trast, the PTR-MS dataset is not significantly influenced byoutliers, therefore,QpseudoandQtrue are comparable (see Ta-ble 2). These observations suggest that outlier treatment andambient characteristics significantly influenceQ/Qexpected.
Because of the ambiguity in the correctp and mean-ingful differences betweenQpseudo and Qtrue, it is notpossible to obtain a single “correct” C3. A brief com-parison is presented here between the selected C3=0and C3=0.04. C3=0.04 yieldsQpseudo/Qexpected=1.03,Qtrue/Qexpected=1.54 and1esc= 0.126. Note, however, thatthese decreasedQ are caused by increasedsij rather thandecreasedeij . The C3=0 and C3=0.04 factors are gener-ally similar. Differences in the C3=0.04 solution are thetreatment of the UN-charbroiling spikes and the inclusionof local painting events in the UN-aged SOA factor (sim-ilar to the solution at1esc=0.246 in Fig. 12). This maysuggest that for this C3 value the PTR-MS data is slightlyoverweighted and that a smallerCPTR is needed (whichwill in turn influenceQ and an empirically-determined C3).As stated above,QpseudoandQtrue values also decrease atlargerp. For example,p=10 yieldsQpseudo/Qexpected=1.54,Qtrue/Qexpected=4.94 and1esc=0.230. TheseQ ratios con-tinue to decrease with increasingp and, as discussed above,the possibility of additional meaningful factors cannot beruled out.
3.3.5 Assessment of unified vs. individual PMFsolutions
For the first time, PMF has been applied to a unifiedAMS/PTR-MS dataset. The analysis provides the informa-tion on particle and VOC sources and atmospheric process-ing that cannot be obtained from the datasets of the individ-ual instruments. This is discussed below in terms of un-derstanding gas/particle factor coupling/decoupling scenar-ios, improved apportionment of VOCs to primary emissionsvs. secondary reaction products and enhanced interpretationof particulate SOA.
It is informative to consider the circumstances underwhich joint particle/gas factors would be expected vs. theconditions that would cause them to separate. Note that theinclusion of both gas and particle elements in the unified
dataset does not require the assumption of mixed gas/particlefactors: in the present analysis, the UN-oxygenated POA andUN-local point source factors contained negligible particu-late mass. The above analysis can, therefore, be used as atool for interrogating assumptions relating to gas and/or par-ticle systems. The mixed gas/particle factors observed canbe grouped into three scenarios:
1. Co-emission of VOCs and particles, coupled with ashort source-to-receptor time relative to the atmosphericlifetimes of the emitted species. Examples: UN-charbroiling and UN-traffic.
2. Secondary generation of VOCs and particles through re-lated atmospheric reactions, comparable lifetimes of theproduced species. Example: UN-aged SOA.
3. Secondary generation of VOCs and particles throughrelated chemical reactions, different atmospheric life-times, reaction-to-receptor time less than shortest atmo-spheric lifetime. Example: UN-local SOA.
The two VOC-dominated factors both appear to result fromlocal sources, although the lack of sharp features in the oxy-genated POA factor may indicate a diffuse source. This sug-gests that the lack of particle signal is driven by the emissionsource profile. Other possible scenarios in which VOC orparticle-only factors might be expected include factors drivenby gas/particle partitioning or by VOCs with very short life-times (e.g. biogenic molecules such as monoterpenes). How-ever, no factor of either type was observed in the presentstudy.
The unified dataset enables apportionment of the oxy-genated VOCs as primary emissions or secondary reactionproducts, which was not possible with the individual PTR-MS dataset. Metrics that may be used to identify factorsresulting from primary emissions are: (1) aromatic VOCs,which are exclusively primary emissions, (2) hydrocarbon-like particulate organics, (3) correlation between the factortime series and a primary tracer, and (4) diurnal patterns,where the primary source can be identified and has a distinctdiurnal emission pattern. In the unified solution, the factorsUN-charbroiling and UN-traffic satisfy all four metrics. UN-oxygenated POA and UN-local point source satisfy (1) and(2); (3) cannot be evaluated due to low signal in the AMSand lack of any correlated tracer; and (4) cannot be assesseddue to the uncertain source identity. Further, the oxygenatedcharacter of the AMS and PTR-MS factor profiles for UN-aged SOA and UN-local SOA suggest these factors are sec-ondary reaction products, as does the time series correlationof UN-aged SOA with nitrate and sulfate.
Such classification allows apportionment of each VOCto primary emissions (UN-charbroiling, UN-traffic, UN-oxygenated POA, UN-local point source) vs. secondary re-actions (UN-aged SOA, UN-local SOA). For example, Ta-ble 5 shows that 60% of formaldehyde (m/z 31) is directly
Atmos. Chem. Phys., 10, 1969–1988, 2010 www.atmos-chem-phys.net/10/1969/2010/

J. G. Slowik et al.: Simultaneous AMS and PTR-MS factor analysis 1985
emitted, compared to only 27% of acetaldehyde (m/z 45).The primary formaldehyde contribution is consistent withvalues reported for other urban locations. The best agree-ment is found with a winter study in Rome (Possanzini etal., 2002) (65–70%) and an April 2003 study in Mexico City(Garcia et al., 2006) (42 to 63%). Photochemical productionmakes a larger contribution during summer, as evidenced bylower primary contributions during campaigns in Rome (10–20%) (Possanzini et al., 2002), Houston (22%) (Friedfeld etal., 2002) and rural sites at rural sites outside of Toronto(17%) (Vlasenko et al., 2009) and Vancouver (33%) (Li etal., 1997).
Approximately 55% of both acetone and acetic acid areattributed to primary emissions, which is comparable to the52% reported for acetone at a site outside Vancouver dur-ing summer (Li et al., 1997). All of them/z’s correspond-ing to non-benzene aromatics have>95% attributed to pri-mary sources. Benzene is more complex, with only∼70%attributed to direct emission factors. This may be because ofinterferences atm/z 79, or because the benzene lifetime issufficiently long to be coupled into the time scale of the sec-ondary factors. This consideration also holds for the longer-lived oxygenated species (i.e. acetone and acetic acid), mean-ing that the values presented above should be considered aslower limits for the direct emission contribution.
The primary/secondary VOC analysis presented above isonly possible through the unified dataset. In the individ-ual PTR-MS dataset, several factors were identified as hav-ing contributions from both primary and secondary sources,i.e. PTR-LRT+painting, PTR-LRT+local source. Inclusionof the AMS data, where the classification of factors is moreclosely related to primary vs. secondary sources, directs thePMF deconvolution of the unified dataset along these lines.Similarly, the AMS primary/secondary classification is en-hanced by the inclusion of PTR-MS data. This is shown inFig. 13, where the aerosol mass fraction attributed to OOAfactors is plotted as a function of the toluene-to-benzene ratiofor the AMS and unified datasets. Correlation between thesetwo quantities is expected because (1) the toluene/benzeneratio is inversely related to photochemical age (Roberts et al.,1984), (2) the oxygen content of organic aerosol is knownto increase with photochemical age, (3) at an urban sitein winter, SOA precursors are dominated by anthropogenicemissions, notably VOCs. The figure shows a significantlytighter correlation between the SOA mass fraction and thetoluene/benzene ratio for the unified dataset. Note that theenhanced correlation is not a function of a change in the UN-aged SOA factor (R2=0.05, Fig. 13b) relative to AMS-OOA-1 (R2=0.03, Fig. 13a) (which could conceivably result fromthe pulling of the AMS factor time series towards those ofthe PTR-MS), but rather the resolution of an additional SOAfactor, UN-local SOA (R2=0.15 Fig. 15c).
Through inclusion of the PTR-MS data in the unifieddataset, the AMS SOA (i.e. AMS-OOA-1) is resolved into“OOA-1-like” aged SOA and “OOA-2-like” local SOA fac-
1.0
0.8
0.6
0.4
0.2
0.0
AM
S-O
OA
-1 /
Org
anic
s
543210Toluene / Benzene
(a) AMS DatasetR2 = 0.05
1.0
0.8
0.6
0.4
0.2
0.0
UN
-Age
d S
OA
/ O
rgan
ics
543210Toluene / Benzene
(b) Unified DatasetR2 = 0.03
1.0
0.8
0.6
0.4
0.2
0.0
(UN
-Age
d S
OA
+ U
N-L
ocal
SO
A) /
Org
anic
s
543210Toluene / Benzene
(c) Unified DatasetR2 = 0.15
Fig. 13. Mass fraction of oxygenated aerosol as a function of thetoluene/benzene ratio. The toluene/benzene ratio is inversely re-lated to photochemical age.
tors. As noted in the previous section, both OOA-1 andOOA-2 factors have been extracted in several AMS datasets(Lanz et al., 2007; Ulbrich et al., 2009a). However, no OOA-2-like factor could be identified in the present dataset us-ing only AMS data. The key factor, in resolving the OOA-2-like aged SOA factor in the unified dataset, is the dis-tinction between short-lived photochemical reaction prod-ucts (formaldehyde, acetaldehyde) vs. long-lived products(acetone, acetic acid). Similarly, an important feature of theOOA-1/OOA-2 distinction in other datasets has been to pro-vide information about the relative age of the particulate or-ganics: time periods with a higher ratio of OOA-1 to OOA-2are generally more processed. Another example of a non-resolvable factor in PMF of AMS-only data was observed inZurich (Lanz et al., 2008a). In the Zurich example, a wood-burning factor was extracted by forcing the mass spectrum ofone factor towards the desired profile. The present study indi-cates that the inclusion of tracer species in the PMF analysisis useful in extracting hard-to-resolve factors in such cases.
Another important feature of the unified solution is the re-mixing or disappearance of several factors resolved in theindividual datasets. For the PTR-MS factors, the promi-nent features in the time series are generally redistributedamong factors in ways that enhance interpretation of thedataset, as described above in terms of primary vs. secondaryspecies. However, different behaviour is observed withrespect to the distribution of mass between F1AMS (char-broiling) vs. F2AMS (HOA) into F1UN and F2UN, and thedisappearance from the unified dataset solutions of F4AMS(biomass burning) and F5AMS (northeast point source). Asthese were minor factors in the AMS dataset, their disap-pearance is not surprising.
www.atmos-chem-phys.net/10/1969/2010/ Atmos. Chem. Phys., 10, 1969–1988, 2010

1986 J. G. Slowik et al.: Simultaneous AMS and PTR-MS factor analysis
4 Conclusions
We present the first application of positive matrix factoriza-tion (PMF) to a unified AMS/PTR-MS dataset. The relativeweights of the AMS and PTR-MS components in the PMFsolution are balanced through the use of a residual based met-ric, 1esc. This method can be directly applied to any datasetcontaining two mass spectrometers, and is readily general-ized to account for three or more instruments. Analysis ofthe unified dataset complements that of the individual instru-ment datasets. In this study, the previously identified oxy-genated aerosol factors OOA-1 and OOA-2 could be onlydistinguished within the unified dataset. Further, the unifieddataset greatly enhanced interpretation of oxygenated VOCsources, apportioning them into primary sources vs. sec-ondary reaction products. Minor factors in the individualdataset of one instrument lacking corresponding tracers inthe other may not be resolvable in the unified dataset.
Acknowledgements.The authors gratefully acknowledge theNOAA Air Resources Laboratory (ARL) for the provision of theHYSPLIT transport and dispersion model. Partial operationalfunding was provided by the Canadian Foundation for Climateand Atmospheric Sciences (CFCAS) and the Natural Sciencesand Engineering Council of Canada (NSERC). This project hasalso received funding support from the Ontario Ministry of theEnvironment. Such support does not indicate endorsement by theMinistry of the contents of this material. Funding for SOCAARwas provided by the Canadian Foundation for Innovation, theOntario Innovation Trust, and the Ontario Research Fund.
Edited by: G. McFiggans
References
Aiken, A. C., DeCarlo, P. F., Kroll, J. H., Worsnop, D. R., Huff-man, J. A., Docherty, K. S., Ulbrich, I. M., Mohr, C., Kimmel,J. R., Sueper, D., Sun, Y., Zhang, Q., Trimborn, A., Northway,M., Ziemann, P. J., Canagaratna, M. R., Onasch, T. B., Alfarra,M. R., Prevot, A. S. H., Dommen, J., Duplissy, J., Metzger, A.,Baltensperger, U., and Jimenez, J. L.: O/C and OM/OC Ratios ofPrimary, Secondary, and Ambient Organic Aerosols with High-Resolution Time-of-Flight Aerosol Mass Spectrometry, Environ.Sci. Technol., 42, 4478–4485, doi:10.1021/es703009q, 2008.
Aiken, A. C., Salcedo, D., Cubison, M. J., Huffman, J. A., DeCarlo,P. F., Ulbrich, I. M., Docherty, K. S., Sueper, D., Kimmel, J.R., Worsnop, D. R., Trimborn, A., Northway, M., Stone, E. A.,Schauer, J. J., Volkamer, R. M., Fortner, E., de Foy, B., Wang, J.,Laskin, A., Shutthanandan, V., Zheng, J., Zhang, R., Gaffney, J.,Marley, N. A., Paredes-Miranda, G., Arnott, W. P., Molina, L. T.,Sosa, G., and Jimenez, J. L.: Mexico City aerosol analysis duringMILAGRO using high resolution aerosol mass spectrometry atthe urban supersite (T0) –Part 1: Fine particle composition andorganic source apportionment, Atmos. Chem. Phys., 9, 6633–6653, 2009,http://www.atmos-chem-phys.net/9/6633/2009/.
Allan, J. D., Coe, H., Bower, K. N., Alfarra, M. R., Delia, A. E.,Jimenez, J. L., Middlebrook, A. M., Drewnick, F., Onasch, T. B.,
Canagaratna, M. R., Jayne, J. T., and Worsnop, D. R. : Techni-cal note: A generalized method for the extraction of chemicallyresolved mass spectra from Aerodyne aerosol mass spectrometerdata, J. Aerosol Sci., 35, 909–922, 2004.
Allan, J. D., Jimenez, J. L., Williams, P. I., Alfarra, M. R., Bower,K. N., Jayne, J. T., Coe, H., and Worsnop, D. R.: Quantitativesampling using an Aerodyne aerosol mass spectrometer 1: Tech-niques of data interpretation and error analysis, J. Geophys. Res.,108, 4090: doi:10.1029/2002JD002358, 2003.
Andreae, M. O. and Merlet, P. : Emission of trace gases and aerosolsfrom biomass burning, Global Biogeochem. Cy., 15, 955–966,2001.
Atkinson, R., Baulch, D. L., Cox, R. A., Crowley, J. N., Hampson,R. F., Hynes, R. G., Jenkin, M. E., Rossi, M. J., Troe, J., and IU-PAC Subcommittee: Evaluated kinetic and photochemical datafor atmospheric chemistry: Volume II – gas phase reactions oforganic species, Atmos. Chem. Phys., 6, 3625–4055, 2006,http://www.atmos-chem-phys.net/6/3625/2006/.
Beychok, M. R.: A Data Base for Dioxin and Furan Emissionsfrom Municipal Refuse Incinerators, Atmos. Environ., 21, 29–36, 1987.
Buset, K. C., Evans, G. J., Leaitch, W. R., Brook, J. R., and Toom-Sauntry, D. : Use of advanced receptor modelling for analysisof an intensive 5-week aerosol sampling campaign, Atmos. Env-iron., 40, 482–499, 2006.
Buzcu, B. and Frazier, M. P.: Source Identification and Apportion-ment of Volatile Organic Compounds in Houston, TX, Atmos.Environ., 40, 2385–2400, 2006.
Canagaratna, M. R., Jayne, J. T., Jimenez, J. L., Allan, J. D., Al-farra, M. R., Zhang, Q., Onasch, T. B., Drewnick, F., Coe, H.,Middlebrook, A. M., Delia, A., Williams, L. R., Trimborn, A.M., Northway, M. J., DeCarlo, P. F., Kolb, C. E., Davidovits, P.,and Worsnop, D. R.: Chemical and microphysical characteriza-tion of ambient aerosols with the Aerodyne aerosol mass spec-trometer, Mass Spec. Rev., 26, 185–222, 2007.
de Gouw, J. A., Goldan, P. D., Warneke, C., Kuster, W. C., Roberts,J. M., Marchewka, M., Bertman, S. B., Pszenny, A. A. P., andKeene, W. C.: Validation of proton transfer reaction-mass spec-trometry (PTR-MS) measurements of gas-phase organic com-pounds in the atmosphere during the New England Air Qual-ity Study (NEAQS) in 2002, J. Geophys. Res., 108, 4682,doi:10.1029/2003JD003863, 2003.
de Gouw, J. A., Middlebrook, A. M., Warneke, C., Goldan, P.D., Kuster, W. C., Roberts, J. M., Fehsenfeld, F. C., Worsnop,D. R., Canagaratna, M. R., Pszenny, A. A. P., Keene, W. C.,Marchewka, M., Bertman, S. B., and Bates, T. S.: Budget of or-ganic carbon in a polluted atmosphere: Results from the NewEngland Air Quality Study in 2002, J. Geophys. Res., 110,D16305, doi:10.1029/2004JD005623, 2005.
de Gouw, J. A. and Warneke, C. : Measurements of volatileorganic compounds in the Earth’s atmosphere using proton-transfer-reaction mass spectrometry, Mass Spec. Rev., 26, 223–257, 2007.
Dockery, D. W. and Pope, C. A.: Acute respiratory effects of par-ticulate air pollution, Annual Review of Public Health, 15, 107–132, 1994.
Donahue, N. M., Robinson, A. L., Stanier, C. O., and Pandis,S. N.: Coupled Partitioning, Dilution, and Chemical Aging ofSemivolatile Organics, Environ. Sci. Technol., 40, 2635–2643,
Atmos. Chem. Phys., 10, 1969–1988, 2010 www.atmos-chem-phys.net/10/1969/2010/

J. G. Slowik et al.: Simultaneous AMS and PTR-MS factor analysis 1987
2006.Draxler, R. R. and Hess, G. D. : An overview of the Hysplit4 mod-
elling system for trajectories, dispersion, and deposition, Aust.Met. Mag., 47, 295–308, 1998.
Draxler, R. R. and Rolph, G. D.: HYSPLIT (HYbrid Single-ParticleLagrangian Integrated Trajectory) Model access via NOAA ARLREADY Website (http://www.arl.noaa.gov/ready/hysplit4.html),NOAA Air Resources Laboratory, Silver Spring, MD, 2003.
Drewnick, F., Hings, S. S., DeCarlo, P. F., Jayne, J. T., Gonin, M.,Fuhrer, K., Weimer, S., Jimenez, J. L., Demerjian, K. L., Bor-rmann, S., and Worsnop, D. R. : A new Time-of-Flight AerosolMass Spectrometer (ToF-AMS) – Instrument description andfirst field deployment, Aerosol Sci. Technol., 39, 637–658, 2005.
Driscoll, C. T., Driscoll, K. M., Roy, K. M., and Mitchell, M. J.:Chemical responses of lakes in the Adirondack region of NewYork to declines in acidic deposition, Environ. Sci. Technol., 37,2036–2042, 2003.
Friedfeld, S., Fraser, M., Ensor, K., Tribble, S., Rehle, D., Leleux,D., and Tittle, F.: Statistical analysis of primary and secondaryatmospheric formaldehyde, Atmos. Environ., 36, 4767–4775,2002.
Garcia, A. R., Volkamer, R., Molina, L. T., Molina, M. J., Samuel-son, J., Mellqvist, J., Galle, B., Herndon, S. C., and Kolb, C. E.:Separation of emitted and photochemical formaldehyde in Mex-ico City using a statistical analysis and a new pair of gas-phasetracers, Atmos. Chem. Phys., 6, 4545–4557, 2006,http://www.atmos-chem-phys.net/6/4545/2006/.
Godri, K. J., Evans, G. J., Slowik, J., Knox, A., Abbatt, J., Brook, J.,Dann, T., and Dabek-Zlotorzynska, E.: Evaluation and applica-tion of a semi-continuous chemical characterization system forwater soluble inorganic PM2.5 and associated precursor gases,Atmos. Meas. Tech., 2, 65–80, 2009,http://www.atmos-meas-tech.net/2/65/2009/.
Hansel, A., Jordan, A., Holzinger, R., Prazeller, P., Vogel, W., andLindinger, W.: Proton transfer reaction mass spectrometry: on-line trace gas analysis at ppb level, Int. J. Mass Spectrom. IonProcesses, 149/150, 609–619, 1995.
Holzinger, R., Millet, D. B., Williams, B., Lee, A., Kreisberg, N.,Hering, S. V., Jimenez, J. L., Allan, J. D., Worsnop, D. R., andGoldstein, A. H.: Emission, oxidation, and secondary organicaerosol formation of volatile organic compounds as observed atChebogue Point, Nova Scotia, J. Geophys. Res., 112, D10S24,doi:10.1029/2006JD007599, 2007.
Jacobson, M. Z.: Strong radiative heating due to the mixing stateof black carbon in atmospheric aerosols, Nature, 409, 695–697,2001.
Kanakidou, M., Seinfeld, J. H., Pandis, S. N., Barnes, I., Dentener,F. J., Facchini, M. C., Van Dingenen, R., Ervens, B., Nenes, A.,Nielsen, C. J., Swietlicki, E., Putaud, J. P., Balkanski, Y., Fuzzi,S., Horth, J., Moortgat, G. K., Winterhalter, R., Myhre, C. E.L., Tsigaridis, K., Vignati, E., Stephanou, E. G., and Wilson, J.:Organic aerosol and global climate modelling: a review, Atmos.Chem. Phys., 5, 1053–1123, 2005,http://www.atmos-chem-phys.net/5/1053/2005/.
Kristensson, K., Johansson, C., Westerholm, R., Swietlicki, E., Gid-hagen, L., Wideqvist, U., and Vesely, V.: Real-world traffic emis-sion factors of gases and particles measured in a road tunnel inStockholm, Sweden, Atmos. Environ., 38, 657–673, 2004.
Lanz, V. A., Alfarra, M. R., Baltensperger, U., Buchmann, B.,
Hueglin, C., and Prvt, A. S. H.: Source apportionment of submi-cron organic aerosols at an urban site by factor analytical mod-elling of aerosol mass spectra, Atmos. Chem. Phys., 7, 1503–1522, 2007,http://www.atmos-chem-phys.net/7/1503/2007/.
Lanz, V. A., Alfarra, M. R., Baltensperger, U., Buchmann, B.,Hueglin, C., Szidat, S., Wehrli, M. N., Wacker, L., Weimer, S.,Caseiro, A., Puxbaum, H., and Prevot, A. S. H.: Source Attri-bution of Submicron Organic Aerosols during Wintertime Inver-sions by Advanced Factor Analysis of Aerosol Mass Spectra, En-viron. Sci. Technol., 42, 214–220, 2008a.
Lanz, V. A., Hueglin, C., Buchmann, B., Hill, M., Locher, R.,Staehelin, J., and Reimann, S.: Receptor modelling of C2–C7 hydrocarbon sources at an urban background site in Zurich,Switzerland: changes between 1993–1994 and 2005–2006, At-mos. Chem. Phys., 8, 2313–2332, 2008b,http://www.atmos-chem-phys.net/8/2313/2008/.
Lee, P. K., Brook, J. R., Dabek-Zlotorzynska, E., and Mabury, S.A.: Identification of the major sources contribution to PM2.5 ob-served in Toronto, Environ. Sci. Technol., 37, 4831–4840, 2003.
Lee, S. H.: Emissions from Street Vendor Cooking Devices (Char-coal Grilling), US EPA, Washington, DC, 1999.
Lewis, C. W., Norris, G. A., Conner, T. L., and Henry, R. C.: Sourceapportionment of Phoenix PM2.5 aerosol with the UNMIX re-ceptor model, J. Air Waste Man. Assoc., 53, 325–338, 2003.
Li, S.-M., Anlauf, K. G., Wiebe, H. A., Bottenheim, J. W., Shepson,P. B., and Biesenthal, T. A.: Emission ratios and photochemicalproduction efficiencies of nitrogen oxides, ketones, and aldehy-des in the Lower Fraser Valley during the Summer Pacific 1993oxidant study, Atmos. Environ., 31, 2037–2048, 1997.
Lindinger, W., Hansel, A., and Jordan, A.: Proton-transfer reactionmass spectrometry (PTR-MS): on-line monitoring of volatile or-ganic compounds at pptv levels, Chem. Soc. Rev., 27, 347–354,1998.
McLafferty, F. W.: Interpretation of Mass Spectra, University Sci-ence Books, Mill Valley, CA, 1980.
Owega, S., Khan, B. U. Z., D’Souza, R., Evans, G. J., Fila, M., andJervis, R. E. : Receptor Modelling of Toronto PM2. 5 Charac-terised by Aerosol Laser Ablation Mass Spectrometry, Environ.Sci. Technol., 38, 5712–5720, 2004.
Paatero, P.: Least squares formulation of robust non-negative factoranalysis, Chemom. Intell. Lab. Syst., 37, 23–35, 1997.
Paatero, P.: Interactive Comment on “Simultaneous factor analy-sis of organic particle and gas mass spectra: AMS and PTR-MSmeasurements at an urban site” by J. G. Slowik et al., Atmos.Chem. Phys. Discuss., 9, C114-C123, 2009.
Paatero, P. and Tapper, U.: Positive Matrix Factorization: A non-negative factor model with optimal utilization of error estimatesof data values, Environmetrics, 5, 111–126, 1994.
Polissar, A. V., Hopke, P. K., and Poirot, R. L.: Atmospheric aerosolover Vermont: chemical composition and sources, Environ. Sci.Technol., 35, 4604–4621, 2001.
Pope, C. A. and Dockery, D. W.: Health effects of fine particulateair pollution: lines that connect, J. Air Waste Man. Assoc., 56,709–742, 2006.
Possanzini, M., Palo, V. D., and Cecinato, A.: Sources and photode-composition of formaldehyde and acetaldehyde in Rome ambientair, Atmos. Environ., 36, 3195–3201, 2002.
Quinn, P. K., Bates, T. S., Coffman, D., Onasch, T. B., Worsnop,
www.atmos-chem-phys.net/10/1969/2010/ Atmos. Chem. Phys., 10, 1969–1988, 2010

1988 J. G. Slowik et al.: Simultaneous AMS and PTR-MS factor analysis
D. R., Baynard, T., de Gouw, J. A., Goldan, P. D., Kuster, W.C., Williams, E., Roberts, J. M., Lerner, B., Stohl, A., Pet-tersson, A., and Lovejoy, E. R.: Impacts of sources and ag-ing on submicrometer aerosol properties in the marine boundarylayer across the Gulf of Maine, J. Geophys. Res., 111, D23S36,doi:10.1029/2006JD007582, 2006.
Ramadan, Z., Song, X.-H., and Hopke, P. K.: Identification ofsources of Phoenix aerosol by positive matrix factorization, J.Air Waste Manag. Assoc., 50, 1308–1320, 2000.
Ramanathan, V., Crutzen, P. J., Kiehl, J. T., and Rosenfeld, D.:Aerosols, climate, and the hydrologic cycle, Science, 294, 2119–2124, 2001.
Roberts, J. M., Fehsenfeld, F. C., Liu, S. C., Bollinger, M. J., Hahn,C., Albritton, D. L., and Sievers, R. E. : Measurements of aro-matic hydrocarbon ratios and NOx concentrations in the ruraltroposphere: Estimates of air mass photochemical age and NOxremoval rate, Atmos. Environ., 18, 2421–2432, 1984.
Robinson, A. L., Donahue, N. M., Shrivastava, M. K., Weitkamp,E. A., Sage, A. M., Grieshop, A. P., Lane, T. E., Pierce, J. R.,and Pandis, S. N.: Rethinking Organic Aerosol: SemivolatileEmissions and Photochemical Aging, Science, 315, 1259–1262,2007.
Rolph, G. D., Real-time Environmental Applications and Dis-play sYstem (READY) Website (http://www.arl.noaa.gov/ready/hysplit4.html), NOAA Air Resources Laboratory, Silver Spring,MD, 2003.
Schauer, J. J., Kleeman, M. J., Cass, G. R., and Simoneit, B. R. T.:Measurement of Emissions from Air Pollution Sources, 1. C1through C29 Organic Compounds from Meat Charbroiling, Env-iron. Sci. Technol., 33, 1566–1577, 1999.
Schindler, D. W.: Effects of acid-rain on fresh-water ecosystems,Science, 239, 149–157, 1988.
Ulbrich, I. M., Canagaratna, M. R., Zhang, Q., Worsnop, D. R.,and Jimenez, J. L.: Interpretation of organic components fromPositive Matrix Factorization of aerosol mass spectrometric data,Atmos. Chem. Phys., 9, 2891–2918, 2009,http://www.atmos-chem-phys.net/9/2891/2009/.
Ulbrich, I. M., Lechner, M., and Jimenez, J. L.: AMSSpectral Database, online available:http://cires.colorado.edu/jimenez-group/AMSsd/, 2009b.
Vlasenko, A., Slowik, J. G., Bottenheim, J. W., Brickell, P. C.,Chang, R. Y.-W., Macdonald, A. M., Shantz, N. C., Sjostedt, S.J., Wiebe, H. A., Leaitch, W. R., and Abbatt, J. P. D.: Measure-ments of VOCs by proton transfer reaction mass spectrometry ata rural Ontario site: Sources and correlation to aerosol composi-tion, J. Geophys. Res., 114, D21305, doi:10.1029/2009JD12025,2009.
Watson, J. G.: Visibility: Science and Regulation, J. Air WasteManag., 52, 628–713, 2002.
Weimer, S., Alfarra, M. R., Schreiber, D., Mohr, M., Prevot, A.S. H., and Baltensperger, U. : Organic aerosol mass spectralsignatures from wood-burning emissions: Influence of burn-ing conditions and wood type, J. Geophys. Res., 113, D10304,doi:10.1029/2007JD009309, 2008.
Zervas, E., Montagne, X., and Lahaye, J.: C-C organic acid emis-sions from an SI engine: influence of fuel and air/fuel equiva-lence ratio, Environ. Sci. Technol., 35, 2746–2751, 2001.
Zhang, Q., Alfarra, M. R., Worsnop, D. R., Allan, J. D., Coe,H., Canagaratna, M. R., and Jimenez, J. L.: Deconvolutionand Quantification of Hydrocarbon-like and Oxygenated OrganicAerosols Based on Aerosol Mass Spectrometry, Environ. Sci.Technol., 39, 4938–4952, 2005.
Zhang, Q., Jimenez, J. L., Canagaratna, M. R., Allan, J. D., Coe,H., Ulbrich, I., Alfarra, M. R., Takami, A., Middlebrook, A.M., Sun, Y. L., Dzepina, K., Dunlea, E., Docherty, K., De-Carlo, P. F., Salcedo, D., Onasch, T. B., Jayne, J. T., Miyoshi,T., Shimono, A., Hatakeyama, S., Takegawa, N., Kondo, Y.,Schneider, J., Drewnick, F., Borrmann, S., Weimer, S., Demer-jian, K. L., Williams, P., Bower, K., Bahreini, R., Cottrell, L.,Griffin, R. J., Rautiainen, J., Sun, J. Y., Zhang, Y. M., andWorsnop, D. R.: Ubiquity and dominance of oxygenated speciesin organic aerosols in anthropogenically-influenced NorthernHemisphere midlatitudes, Geophys. Res. Let., 34, L13801,doi:10.1029/2007GL029979, 2007.
Zhao, W. X. and Hopke, P. K.: Source identification for fineaerosols in Mammoth Cave National Park, Atmos. Res., 80, 309–322, 2006.
Atmos. Chem. Phys., 10, 1969–1988, 2010 www.atmos-chem-phys.net/10/1969/2010/