simultaneous determination of valsartan and hydrochlorothiazide in tablets by first-derivative...
TRANSCRIPT

Journal of Pharmaceutical and Biomedical Analysis25 (2001) 1009–1013
Simultaneous determination of valsartan andhydrochlorothiazide in tablets by first-derivative ultraviolet
spectrophotometry and LC�
Eda Satana a, Sadi Altınay a, Nilgun Gunden Goger a, Sibel A. O� zkan b,Zuhre Senturk a,*
a Department of Analytical Chemistry, Faculty of Pharmacy, Gazi Uni�ersity, 06330 Ankara, Turkeyb Department of Analytical Chemistry, Faculty of Pharmacy, Ankara Uni�ersity, 06100 Ankara, Turkey
Received 26 September 2000; received in revised form 27 December 2000; accepted 9 January 2001
Abstract
First-derivative ultraviolet spectrophotometry and high-performance liquid chromatography (HPLC) were used todetermine valsartan and hydrochlorothiazide simultaneously in combined pharmaceutical dosage forms. The deriva-tive procedure was based on the linear relationship between the drug concentration and the first derivative amplitudesat 270.6 and 335 nm for valsartan and hydrochlorothiazide, respectively. The calibration graphs were linear in therange of 12.0–36.1 �g ml−1 for valsartan and 4.0–12.1 �g ml−1 for hydrochlorothiazide. Furthermore, a high-performance liquid chromatographic procedure with ultraviolet detection at 225 nm was developed for a comparisonmethod. For the HPLC procedure, a reversed phase column with a mobile phase of 0.02 M phosphate buffer (pH3.2)-acetonitrile (55: 45; v/v), was used to separate for valsartan and hydrochlorothiazide. The plot of peak area ratioof each drug to the internal standard versus the respective concentrations of valsartan and hydrochlorothiazide werefound to be linear in the range of 0.06–1.8 and 0.07–0.5 �g ml−1, respectively. The proposed methods weresuccessfully applied to the determination of these drugs in laboratory-prepared mixtures and commercial tablets.© 2001 Elsevier Science B.V. All rights reserved.
Keywords: Simultaneous determination; Valsartan; Hydrochlorothiazide; First derivative ultraviolet spectrosphotometry; HPLC
www.elsevier.com/locate/jpba
1. Introduction
Valsartan (VAL) is a new antihypertensive drugbelonging to the family of angiotensin II receptorantagonists. Hydrochlorothiazide (HCT) is one ofthe oldest thiazide diuretics. More recently, VALhas been marketed in combination with HCT intablets. The oral administration of VAL with
� Presented at the ‘Colloquium Spectroscopicum Interna-tionale XXXI’, September 1999, Ankara, Turkey
* Corresponding author. Tel: +90-312-2227337; fax: +90-312-2235018.
E-mail address: [email protected] (Z. Senturk).
0731-7085/01/$ - see front matter © 2001 Elsevier Science B.V. All rights reserved.
PII: S0731-7085(01)00394-6

E. Satana et al. / J. Pharm. Biomed. Anal. 25 (2001) 1009–10131010
HCT has been found to be more effective thaneither drug alone in the treatment of hypertensionin patients whose blood pressure is not adequatelycontroled by monotherapy. This fixed-dose com-bination should be used as second-line therapy[1,2].
Very few methods appeared in the literature forthe determination of VAL individually based onhigh-performance liquid chromatography (HPLC)[3,4] and gas chromatography–mass spectrometry[5].
There have been several reports on the determi-nation of HCT individually or in its combinationwith other drugs, including the use of liquid chro-matography [6–9], capillary zone electrophoresis[10], spectrophotometry [11–14].
The VAL is not yet offical in any pharmaco-poeia either alone or in combinatios with otherdrugs. To the best of our knowledge, no study hasbeen described for the simultaneous determina-tion of VAL and HCT in pharmaceutical formu-lations or in biological fluids. Therefore, it wasdesirable to devolop a simple and fast procedurethat could be applied in quality control laborato-ries for the determination of both drugs in thepresence of each other. In this work, two methodsbased on UV-derivative spectrophotometry andreversed-phase HPLC are reported for the quan-tification of both drugs. The utility of thedevoloped methods to determine the content ofboth drugs in commerical tablets is alsodemonstrated.
2. Experimental
2.1. Apparatus and conditions
Shimadzu UV-160A double beam UV-visiblespectrophotometer and its recorder were used.The first derivative spectra of the reference andthe sample solution were recorded in 1 cm quartzcells against solvent blank over the range 200–400nm. The optimal conditions for recording thespectra to achieve good reproducibility includedscan speed at 40 nm s−1, slit width at 3 nm. Theordinate maximum and minimum settings were+0.45 and −0.30, respectively.
The chromatographic apparatus (Hewlett Pack-ard) consisted of a model 1050 solvent deliverysystem, and a UV-visible spectrophotometric de-tector. The separation was performed on a Supel-cosil LC 18 column (150×4.6 mm; 5 �m particlesize). The mobile phase consisted of a mixture of0.02 M phosphate buffer (pH 3.2)–acetonitrile(55:45; v/v). The mobile phase was prepared daily,filtered, sonicated before use and delivered at aflow rate of 0.9 ml min−1. The detector wave-length was set at 225 nm. Trimethoprime (IS) wasused as an internal standard. The injection vol-ume was 20 �l.
2.2. Chemicals and reagents
VAL and HCT and its dosage forms (Co-Dio-van) were kindly supplied by Novartis Pharm.Ind. (Istanbul, Turkey). Internal standardtrimethoprime was procured from Sanofi-DoguPharm. Ind. (Istanbul, Turkey). Acetonitrile andmethanol (Merck) were of chromatographicgrade; water was doubly distilled. All the otherchemicals were of analytical-reagent grade. Allsolutions were protected from light and wereanalysed on the day of preparation.
2.3. Standard solutions and calibration cur�es
Stock solutions for derivative spectrophotome-try were prepared by dissolving VAL and HCT inmethanol to obtain a concentration of 1 mg ml−1
for each compound. Standard solutions of VALand HCT containing concentration ranges of12.0–36.1 and 4.0–12.1 �g ml−1 were prepared inmethanol, respectively.
For HPLC, stock solutions of 1 mg ml−1 ofdrugs were prepared in methanol. Standard solu-tions were prepared with mobile phase by varyingthe concentration of the drugs (0.06–1.8 �g ml−1
for VAL; 0.07–0.5 �g ml−1 for HCT) and main-taining the concentration of IS at a constant levelof 0.29 �g ml−1.
The calibration curves for derivative spec-trophotometry were constructed by plotting drugconcentration versus the peak trough amplitude inthe first derivative ultraviolet spectrum at 270.6nm for VAL and 335 nm for HCT. Calibration

E. Satana et al. / J. Pharm. Biomed. Anal. 25 (2001) 1009–1013 1011
curves for HPLC analysis were obtained by plot-ting the peak area ratio of the drug to internalstandard against the drug concentration.
2.4. Analysis of tablets
Ten tablets containing VAL and HCT as activeingredients were weighed and finely powdered.Appropriate amount of material was accuratelyweighed, transferred in a volumetric flask, dilutedwith methanol, sonicated for 5 min and thencompleted to volume with the same solvent. Aftercentrifugation, further dilution was made usingmethanol for derivative procedure or mobilephase with the addition of the internal standardfor HPLC procedure.
3. Results and discussion
3.1. Deri�ati�e spectrophotometry
In Fig. 1 the zero order spectra of VAL andHCT in the wavelength range 200–400 nm areshown. It can be seen that the absorption spec-trum of VAL is overlapped with the HCT spec-trum. The determination of HCT directly couldbe easy at the start, but the small content of thissample and the high content of VAL in commer-cial tablets (the HCT:VAL ratio is at about 1:6)presumes a large contribution of the spectrum ofVAL to the maxima in the spectrum of HCT.When the derivative UV-spectra are recorded,sharp bands of large amplitudes are produced[15–17], which may permit more selective identifi-cation and determination of two drugs.
Fig. 2. The first derivative spectra of VAL (36 �g ml−1) andHCT (6 �g ml−1) in methanol.
Fig. 2 shows an example of first derivativeUV-spectra of the examined compounds. Simulta-neous determination of VAL and HCT was per-formed simply by reading the dA/d� values (firstderivative absorbances) at 270.6 and 335 nm,respectively. At these wavelengths the analyticalsignals of the mixture and the compounds to bedetermined do coincide. Having established theexperimental conditions, the calibration graphswere tested between 12.0 and 36.1 �g ml−1 forVAL in the absence of HCT at 270.6 nm for thefirst-derivative spectra. The calibration graphswere also tested between 4.0 and 12.1 �g ml−1 ofHCT in the absence of VAL at 335 nm for thefirst-derivative spectra. Good linearity was ob-served in all the cases (Table 1). The detection anddetermination limits were also shown in Table 1.The linearity of the calibration graphs and theadherence of the systems to Beer’s law are vali-dated by the high value of the correlation coeffi-cient of the regression equations and by the valueof the intercepts on the ordinate, which is zero orclose to zero.
The repeatability of the method was tested byanalysing three replicate samples of 18.06 �gml−1 of VAL and 8.05 �g ml−1 of HCT; therelative standard deviations were 0.86 and 0.18%,respectively. The reproducibility of same concen-trations of VAL and HCT were evaluated over 3days by performing three measurements on eachday. The relative standard deviations were foundto be 1.47 and 1.37% for VAL and HCT,respectively.
In order to assess the validity of the proposedmethod for assaying each drug in the presence of
Fig. 1. The zero order spectra of VAL (36 �g ml−1) and HCT(6 �g ml−1) in methanol.
E. Satana et al. / J. Pharm. Biomed. Anal. 25 (2001) 1009–10131012
each other, synthetic mixtures with different por-tions of the two drugs were prepared and thenassayed using proposed derivative method. Satis-factory results were obtained for the recovery ofboth drugs (Table 2).
3.2. Chromatography
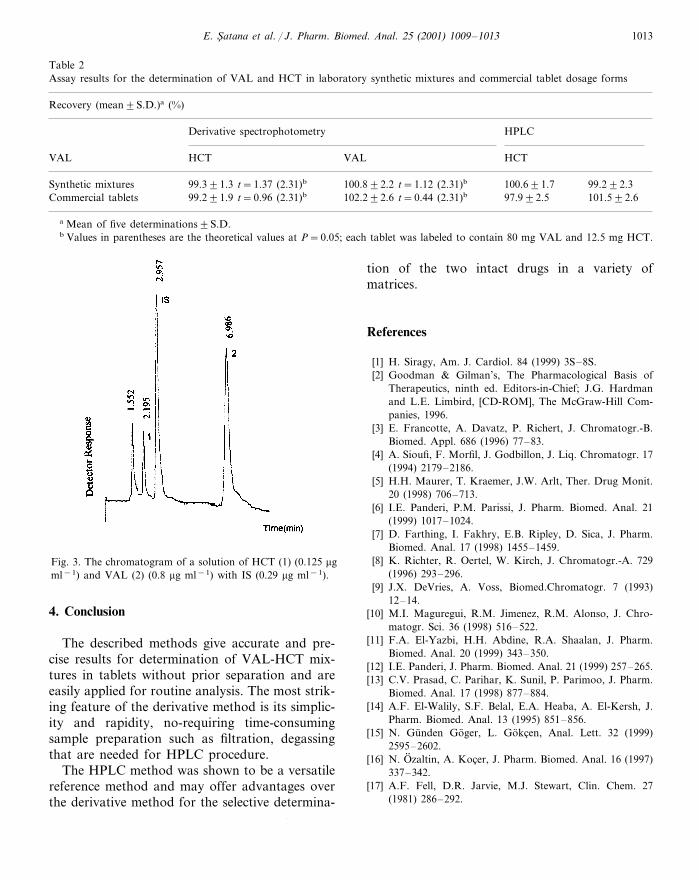
The reversed-phase HPLC method was devel-oped to provide a specific procedure suitable forthe rapid quality control analysis of VAL andHCT as referee method for the developed deriva-tive method. The mobile phase was chosen afterseveral trials with 0.02 M phosphate buffer–ace-tonitrile and at different pH values with differentinternal standards. Flow rate was used as 0.9 mlmin−1. Using described chromatographic condi-tions, HCT, IS and VAL were well separated andtheir retention times 2.20, 2.96 and 6.99 min,respectively. As shown in Fig. 3, the substanceswere eluted, forming well shaped, symmetricalsingle peaks, well separated from the solventfront. Capacity factors (k �) were obtained as 3.51for VAL and 0.91 for HCT.
The linearity of the detector response for bothdrugs was determined by plotting peak area ratiosto the internal standard versus concentration. Thelinearity ranges and analytical data for the cali-bration graphs are listed in Table 1.
The precision of the method was evaluated byrepeating three experiments on the same day
(within-day precision) and over 3 days (day-to-day precision). The variability in the peak arearatios on the concentration of 1.5 �g ml−1 ofVAL and 0.5 �g ml−1 of HCT was determined asthe precision of the assay. The relative standarddeviation values from intra-day and inter-dayanalysis were found to be 1.21 and 1.76% forVAL, and 0.52 and 1.04% for HCT, respectively.
Results for HPLC analysis of laboratory-pre-pared mixtures with different proportions of thetwo drugs are given in Table 2.
3.3. Analysis of tablets
The validity of the proposed methods for phar-maceutical preparations and the effect of possibleinterferences from common excipients (magne-sium stearat, talc, silicon dioxide, polyethyleneglycol, crospovidone, hydroxypropylmethylcellu-lose) were studied by assaying Co-Diovan tablets(labelled to contain 80 mg of VAL and 12.5 mg ofHCT per tablet). For the formulation examinedthe assay results were good agreement with thedeclared content (Table 2). The results obtainedfrom both proposed methods were statisticallycompared using Student’s t-test. As shown fromTable 2, the calculated t-values were less thantheoretical value, indicating no significant differ-ence between the mean contents of VAL andHCT obtained by two proposed methods.
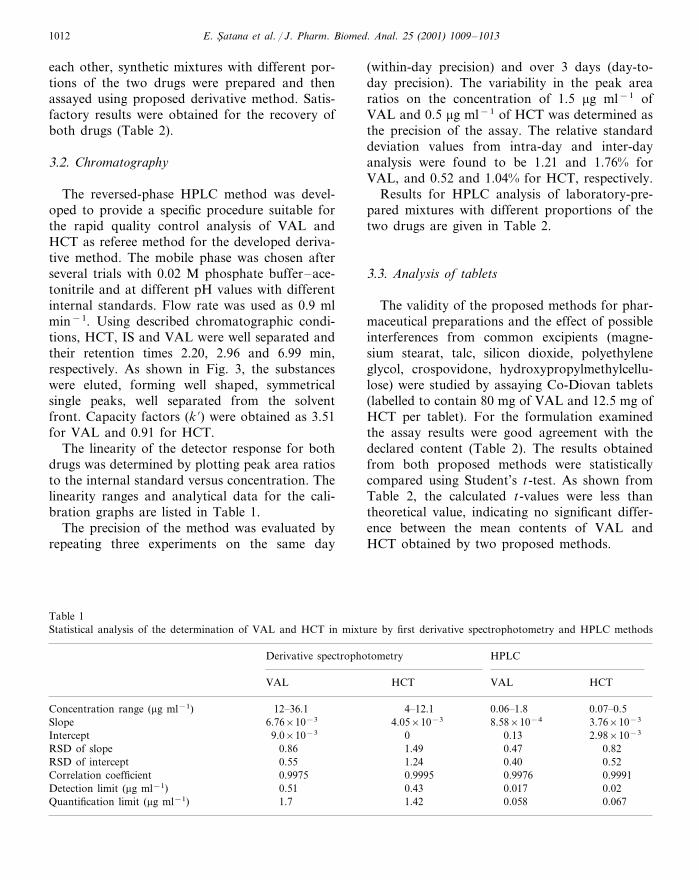
Table 1Statistical analysis of the determination of VAL and HCT in mixture by first derivative spectrophotometry and HPLC methods
Derivative spectrophotometry HPLC
VAL HCT VAL HCT
Concentration range (�g ml−1) 0.07–0.50.06–1.84–12.112–36.14.05×10−36.76×10⁻³ 8.58×10⁻⁴Slope 3.76×10⁻³
Intercept 9.0×10⁻³ 0 0.13 2.98×10⁻³
RSD of slope 0.86 1.49 0.47 0.820.55 1.24RSD of intercept 0.40 0.520.9975 0.9995 0.9976Correlation coefficient 0.9991
0.020.51Detection limit (�g ml−1) 0.43 0.0170.0671.7Quantification limit (�g ml−1) 1.42 0.058
E. Satana et al. / J. Pharm. Biomed. Anal. 25 (2001) 1009–1013 1013
Table 2Assay results for the determination of VAL and HCT in laboratory synthetic mixtures and commercial tablet dosage forms
Recovery (mean�S.D.)a (%)
HPLCDerivative spectrophotometry
VAL HCTVAL HCT
100.8�2.2 t=1.12 (2.31)bSynthetic mixtures 100.6�1.799.3�1.3 t=1.37 (2.31)b 99.2�2.3102.2�2.6 t=0.44 (2.31)b 97.9�2.5 101.5�2.6Commercial tablets 99.2�1.9 t=0.96 (2.31)b
a Mean of five determinations�S.D.b Values in parentheses are the theoretical values at P=0.05; each tablet was labeled to contain 80 mg VAL and 12.5 mg HCT.
tion of the two intact drugs in a variety ofmatrices.
References
[1] H. Siragy, Am. J. Cardiol. 84 (1999) 3S–8S.[2] Goodman & Gilman’s, The Pharmacological Basis of
Therapeutics, ninth ed. Editors-in-Chief; J.G. Hardmanand L.E. Limbird, [CD-ROM], The McGraw-Hill Com-panies, 1996.
[3] E. Francotte, A. Davatz, P. Richert, J. Chromatogr.-B.Biomed. Appl. 686 (1996) 77–83.
[4] A. Sioufi, F. Morfil, J. Godbillon, J. Liq. Chromatogr. 17(1994) 2179–2186.
[5] H.H. Maurer, T. Kraemer, J.W. Arlt, Ther. Drug Monit.20 (1998) 706–713.
[6] I.E. Panderi, P.M. Parissi, J. Pharm. Biomed. Anal. 21(1999) 1017–1024.
[7] D. Farthing, I. Fakhry, E.B. Ripley, D. Sica, J. Pharm.Biomed. Anal. 17 (1998) 1455–1459.
[8] K. Richter, R. Oertel, W. Kirch, J. Chromatogr.-A. 729(1996) 293–296.
[9] J.X. DeVries, A. Voss, Biomed.Chromatogr. 7 (1993)12–14.
[10] M.I. Maguregui, R.M. Jimenez, R.M. Alonso, J. Chro-matogr. Sci. 36 (1998) 516–522.
[11] F.A. El-Yazbi, H.H. Abdine, R.A. Shaalan, J. Pharm.Biomed. Anal. 20 (1999) 343–350.
[12] I.E. Panderi, J. Pharm. Biomed. Anal. 21 (1999) 257–265.[13] C.V. Prasad, C. Parihar, K. Sunil, P. Parimoo, J. Pharm.
Biomed. Anal. 17 (1998) 877–884.[14] A.F. El-Walily, S.F. Belal, E.A. Heaba, A. El-Kersh, J.
Pharm. Biomed. Anal. 13 (1995) 851–856.[15] N. Gunden Goger, L. Gokcen, Anal. Lett. 32 (1999)
2595–2602.[16] N. O� zaltin, A. Kocer, J. Pharm. Biomed. Anal. 16 (1997)
337–342.[17] A.F. Fell, D.R. Jarvie, M.J. Stewart, Clin. Chem. 27
(1981) 286–292.
Fig. 3. The chromatogram of a solution of HCT (1) (0.125 �gml−1) and VAL (2) (0.8 �g ml−1) with IS (0.29 �g ml−1).
4. Conclusion
The described methods give accurate and pre-cise results for determination of VAL-HCT mix-tures in tablets without prior separation and areeasily applied for routine analysis. The most strik-ing feature of the derivative method is its simplic-ity and rapidity, no-requiring time-consumingsample preparation such as filtration, degassingthat are needed for HPLC procedure.
The HPLC method was shown to be a versatilereference method and may offer advantages overthe derivative method for the selective determina-
.