simultaneous determination of interfacial friction and ... · pdf filesimultaneous...
TRANSCRIPT

Simultaneous Determination of Interfacial Friction and Flow Curves of Temperatureand Rate Dependent Materials for Bulk Metal Forming Processes
Faramarz Fereshteh-Saniee+ and S. Mahmoud Pezeshki
Mechanical Engineering Department, Faculty of Engineering, Bu-Ali Sina University, Hamedan, Iran
This paper is concerned with application of the ring test to temperature and rate dependent materials. With this regard, the stressstrainresponse of AZ80 magnesium alloy was obtained for various temperatures, strains and strain rates by means of this experiment. Using finiteelement (FE) simulations, numerical sigmoid curves and calibration curves of the ring compression test were also determined. Moreover,the effects of temperature and deformation rate on the geometry of the numerical sigmoid curves were evaluated. By comparing the load-displacement curves obtained from the FE analyses with those of the experiments, it was found that the numerical sigmoid curves, comparedwith analytical ones, provided more accurate flow curves. Furthermore, the influences of the temperature and strain rate on the shape of thesigmoid curves were more perceptible at higher levels of friction. [doi:10.2320/matertrans.M2011246]
(Received August 11, 2011; Accepted October 24, 2011; Published December 14, 2011)
Keywords: ring compression test, flow curve, friction, sigmoid curve, bulk metal forming, magnesium alloy
1. Introduction
Knowing accurate stressstrain curves of various materialsis essential for almost all of the solid mechanics and metalforming studies. There are different test methods forevaluation of the flow behavior of the materials such as thetensile test, the compression test and the torsion test. Manyengineering structures and metal forming operations aresubjected to compressive state of stress. Therefore, analysisof these structures or processes requires knowledge ofcompressive stressstrain response of the materials. Thecylindrical compression test is a common method fordetermination of compressive flow curves. However, thisexperiment has inevitable drawback of contributing frictionto the test results. On the other hand, in a ring compressiontest, there is a relatively exact estimation of the frictionalcondition. Therefore, this experiment is not only suitable forevaluation of the interfacial friction, but also is an appropriatetest for derivation of the flow curve of the material, speciallyfor bulk metal forming operations and various processconditions.1)
The ring compression test is performed using a short ring-shaped sample forged axially between two flat and parallelplatens. The inner diameter of the ring may decrease, increaseor remain constant, depending on the interfacial frictioncondition. For low levels of friction, as the height decreases,both the inside and outside diameters of the ring increase.2)
The internal diameter will decrease if the friction is large(Fig. 1). Buchner et al. claimed that the flow stress obtainedfrom the ring test was suitable for studying the forging andsimilar processes because there was a similar deformationregion in this experiment.3) The ring test, which has beenclassified as an indirect test for evaluation of friction, is easyto perform and represents the conditions of a real processvery well.
In a ring test, the friction coefficient is derived fromcalibration curves, which are plots of percentage reduction
in internal diameter against that in height. These curvescould be obtained analytically or numerically. The flow stressof the material could also be extracted from sigmoid curvesof the ring compression test. Normal pressure and geo-metrical changes of the deformed sample are included insuch plots.2) These graphs were analytically obtained earlierand are used in this research work for comparison withnumerical ones.
Some assumptions such as no strain hardening or soften-ing, no barreling effects, and homogeneous deformation ofthe ring sample were made for obtaining analytical sigmoidand calibration curves of the ring compression test.1) Later,these assumptions were doubted by some researchers. Inorder to examine the validity of the analytical calibrationcurves of the ring test, Sofuoglu and Rasty carried out severalring tests with white and black Plasticine.4) They found thatusing the same analytical calibration curves for both types ofPlasticine could result in significant errors. Fereshteh-Sanieeet al. conducted ring compression tests with Plasticine andlead for various frictional conditions.5) They claimed that thematerial properties of the sample might affect the shape of thecalibration curves of the ring compression test. The numericalcalibration curves, determined based on the FE simulations,were employed by Shahriari et al. for hot ring compressiontests of a superalloy.6) They specified the friction coefficientfor four various frictional conditions (lubricants) at twodifferent temperatures. Some researchers used results ofring compression tests together with the calibration curves
Fig. 1 Flow of material during a ring test with different levels of friction,where the broken lines exhibit the initial shape of the specimen.2)
+Corresponding author, E-mail: [email protected] or [email protected]
Materials Transactions, Vol. 53, No. 1 (2012) pp. 201 to 208©2011 The Japan Institute of Metals

proposed by Male et al.7) for obtaining friction factor ofextruded AZ31 magnesium alloy at elevated temperatures.8)
They also investigated the effect of tool material interface onfrictional characteristics of this alloy. In a similar researchwork, the friction factor of the oil and MoS2 lubricants werecompared for this alloy.9)
It is important to know whether the flow curve of thematerial affects the geometries of the calibration curves of thering test. With this regard, it is obvious that the compressiveflow curve of the material should be concerned, becausesome alloys (such as magnesium alloys) represent differentbehaviors in compression and tension. Fereshteh-Saniee andFatehi-Sichani conducted the ring and cylindrical compres-sion tests in conjunction with each other.10) They employedthe flow curves obtained by means of the compression testsfor determination of the calibration curves of the ring test.The flow curves and the friction coefficient gained via thisprocedure, resulted in a much more accurate prediction of theload-displacement curve.
For determination of the flow curve of the material,Hwu et al. employed the ring test for estimation of the flowstress of steels at both the room and elevated temperatures.11)
They utilized the upper-bound technique for obtaining thecalibration curves. It was concluded that the ring compres-sion test was a suitable test for estimation of the flow curve.Cho and Altan used an inverse method with the ringcompression test in order to predict the flow stress andfriction factor at elevated temperatures.12) They obtained thevalues of three parameters involved in the function of theinterfacial friction and flow stress by minimizing thedifferences between the experimental and FE findings.
In the present study, ring compression tests of AZ80magnesium alloy were conducted for flow stress estimationas well as friction evaluation for this alloy. This high strengthalloy has been categorized as a wrought magnesium alloy andis usually used in various forms such as extruded or forgedparts.13) The forged AZ80 magnesium alloy has also beenutilized for manufacturing different parts in automotiveindustries.14) To obtain the flow curve of any alloy by usingthe ring compression test, it is necessary to employ precisesigmoid curves. For this reason, the numerical sigmoidcurves were determined based of the FE simulations of thetest. These curves were employed to evaluate the flow curveof AZ80 magnesium alloy. Using the flow curves obtained bythis means, the FE simulations were conducted and theresulted force-displacement curves were in good agreementwith the experimental ones, specially in comparison withthose gained using the analytical sigmoid curves. Moreover,the influences of temperature and strain rate on the geometryof the sigmoid curves were studied and the results and thecorresponding discussions and conclusions are reported inthis paper.
2. Flow Stress Determination Using the Ring Test
For obtaining the stressstrain curve from the ringcompression test, the sigmoid curves should be used. A setof analytical type of these curves is illustrated in Fig. 2. Inthis figure, pa/· is plotted against percentage reduction ininternal diameter, where pa is the average normal pressure
at the mid-plane of the ring sample and · is the flow stressof the material. By dividing the experimental load (F ) bythe mid-plane area of the deformed sample (Amid), one cancalculate pa as below:
pa ¼ F=Amid ð1ÞTherefore, the dimensions of the sample should be measuredafter the deformation. Having pa and pa/·, the flow stresscould be calculated.2)
The friction coefficient of interfacial surfaces can alsobe determined from the ring compression test. Calibrationcurves are used for this purpose. Typical calibration curvesare shown in Fig. 3. The initially proposed sigmoid andcalibration curves for the ring test have been general andthe same for different materials. Hence, the results obtainedfrom these curves could be inappropriate for friction andflow stress evaluation of all the materials. However, thesecurves could separately be gained for each specific materialby using FE simulations, in order to obtain more accurateresults.
-40 -20 0 20 40 601
1.2
1.4
1.6
1.8
2
2.2
2.4
5
1015
20
2530
35
40 45 5055
60
65
70
Reduction in internal diameter (%)
p a/σ
Reduction in height (%)
Fig. 2 Analytical sigmoid curves for evaluation of flow stress.2)
0 20 40 60-40
-20
0
20
40
60
80
0
0.03
0.07
0.1
0.15
0.2
0.3
0.40.577
Reduction in height (%)
Red
uctio
n in
inte
rnal
dia
met
er (
%)
Fig. 3 Typical calibration curves obtained experimentally for determina-tion of the friction coefficient.7)
F. Fereshteh-Saniee and S. M. Pezeshki202

3. Numerical Sigmoid and Calibration Curves
In the present research work, numerical sigmoid andcalibration curves are obtained from FE analyses. Theflowchart of the employed procedure is shown in Fig. 4.As the first step, initial flow curves of the material wereobtained from the experiments by using the analyticalsigmoid curves mentioned in the previous section. By usingthese flow curves, the FE simulations of the ring test wereperformed for 11 different frictional conditions. Thereafter,the first set of numerical sigmoid and calibration curves wereobtained. Deformed geometry of the ring samples should beused to find the corrected flow curve based on the averagepressure at the mid-plane of the sample. The simulationsshould be repeated with this new set of flow curves. Thisprocedure must be continued until the results are not changedgreater than a certain small value, namely 3%. The finallyobtained flow curves, sigmoid curves and calibration curvesare assumed to be the best ones. For evaluating the accuracyof the obtained results, the force-displacement curves ofthe FE simulations could be compared with experimentalones.
4. Experimental Procedure
Using casting and machining processes, AZ80 samples forconducting the ring tests were manufactured. The composi-tion of the material is shown in Table 1. The standard ringspecimen ratio of 6 : 3 : 2 and the ring samples with outerdiameter, inner diameter and height of 9, 4.5 and 3mm,respectively, were used.
Hot ring compression tests were conducted employing a150 KN servo-electric testing machine, equipped with anelectrical furnace. The samples were compressed under dry(no lubricant) frictional conditions with various percentagesof height reduction. The maximum height reduction of thering samples was about 50% and the tests were performed atstrain rates of 0.001, 0.01 and 0.1 s¹1 and temperatures of200, 225 and 250°C. The ring samples deformed at 250°Cand various strain rates are shown in Fig. 5.
5. Finite Element Simulations
5.1 Finite element modelAll the finiteelement simulations were conducted using
ABAQUS software. Based on the experimental results,the flow stress of the material was introduced into the FEcode for various temperatures, strains and strain rates. Thetype of analysis was selected to be coupled temperaturedisplacement. Moreover, the element type employed fornumerical modeling of the process was CAX4T. Becauseof axisymmetric nature of the model, a quarter of diametralsection of a ring sample was modeled. The ram was alsomodeled by means of an axisymmetric analytical rigidsurface.
5.2 The friction law used for FE simulationsCoulomb friction law was used for FE simulations. This
friction law is expressed as follow:
¸ ¼ ®p ð2Þwhere ¸ is the frictional stress, ® is the friction coefficient andp is the interfacial normal pressure. In the ring compressiontest, the normal stress distribution is almost uniform over thecontact area. Therefore, this friction law has acceptableresults in this case.15) At high interfacial contact pressures,employing Coulomb friction model results in a critical shearstress at the toolworkpiece interface which is greater thanthe shear flow stress of the material. Such a situation isactually unacceptable and for this reason, in the presentresearch work, a shear stress limit is also considered for theCoulomb friction law.
Determination of initial flow curve based on experimental results and analytical sigmoid curves
Obtaining the force and geometry of the deformed sample from FE simulations
Performing FE simulations of the ring test for different frictional conditions
Calculation of mid-plane area, height and internal diameter variation at each time increment
Determination of flow stress for each time increment based on the initial flow curve
Calculation of pa/σ ratio from the FE results
Plotting numerical sigmoid and calibration curves
Friction coefficient and new flow curve evaluation based on the new numerical plots
Are the difference between the new and earlier flow curves less
than 3%?
End
Yes
No
Fig. 4 Flowchart of the proposed procedure for obtaining numericalsigmoid and calibration curves and correction of the flow stress.
Table 1 Composition of AZ80 magnesium alloy employed.
MaterialComposition, mass%
Mg Al Zn Mn Si Cu Fe Ni Other
AZ80 Mgalloy
Bal. 7.9 0.5 0.24 0.05 0.001 0.002 0.001 0.1
Fig. 5 Deformed ring samples at 250°C and the strain rates of (a) 0.001,(b) 0.01 and (c) 0.1 s¹1.
Simultaneous Determination of Interfacial Friction and Flow Curves of Temperature and Rate Dependent Materials 203

The material softening of the magnesium alloy underconsideration can be represented very well in Fig. 6. Thisfigure illustrates the FE mesh of the original ring beforedeformation [Fig. 6(a)] together with the deformed meshafter different reductions in height [Figs. 6(b)6(e)]. For thissimulation the friction coefficient, the temperature and theaxial strain rate were, respectively, 0.2, 225°C and 0.1 s¹1.Observing Fig. 6, one can find out that compared with 60%reduction in height, in which the Mises stress is quitehomogeneous and between 120 to 140MPa, the effectivestress for 15% reduction is significantly greater, namelyaround 180MPa. This is mainly due to strain softeningbehavior of the material.
6. Results and Discussions
6.1 Flow curvesThe finally obtained flow curves for AZ80 magnesium
alloy under consideration are illustrated in Fig. 7. This figureshows that for each level of temperature, with any increase inthe strain rate, the flow stress is also increased. For a specificdeformation rate, the flow stress decreases with any increasein the temperature.
The flow curves explain that the work hardening hasoccurred during the initial stage of the ring test. At this stageof the experiment, the hardening rate is higher than thesoftening rate. Afterwards, a short stable stage was exhibited,and then the softening rate dominated the hardening rate.Finally, a balance between hardening and softening wasmaintained and the flow stress became steady. Thesephenomena are in agreement with observations reportedearlier for AZ91 magnesium alloys.16)
The strain corresponding to the peak stress has also variedfrom 0.2 to 0.3. When the strain rate is increased, in thevicinity of this strain the differences between various flowcurves are greater in most the cases. Another important pointis that the higher the temperature, the greater is the effectof the axial strain rate. For the magnesium alloy underconsideration, at a test temperature of 250°C, there is anincrease of about 70% in the flow stress, when the strain rateis changed from 0.001 to 0.1 s¹1. However, at 200°C, thisincrease in value of flow stress is nearly 37%. After the peakstress and with increase in the induced strain, the distancesbetween various flow curves gradually decrease in most thecases. At the steady parts of the curves, the differences arenormally the least. Considering the above points, it can beconcluded that similar to the hardening stage, the greatervalues of the strain rate, intensify the softening behavior ofAZ80 magnesium alloy.
Figure 8 shows the microstructures of the magnesiumalloy before and after deformation at 225°C, a strain rate of0.01 s¹1 and about 30% reduction in height. To find that how
axis of symmetry
Fig. 6 The finiteelement model of the ring test with a friction coefficientof ® = 0.2, a strain rate of 0.1 s¹1 and a temperature of 225°C for differentpercentages reduction in height.
0 0.1 0.2 0.3 0.4 0.5 0.6 0.7 0.8 0.9 10
25
50
75
100
125
150
175
200
225
True strain, ε
Flow
str
ess,
σ
/MPa
0.1/s0.01/s0.001/s
(a)
0 0.1 0.2 0.3 0.4 0.5 0.6 0.7 0.8 0.9 10
25
50
75
100
125
150
175
200
True strain, ε
Flow
str
ess,
σ
/MPa
0.1/s0.01/s0.001/s
(b)
0 0.1 0.2 0.3 0.4 0.5 0.6 0.7 0.8 0.9 10
25
50
75
100
125
150
175
True strain, ε
Flow
str
ess,
σ
/MPa
0.1/s0.01/s0.001/s
(c)
Fig. 7 Flow curves of AZ80 magnesium alloy for (a) T = 200°C, (b) T = 225°C and (c) T = 250°C.
F. Fereshteh-Saniee and S. M. Pezeshki204
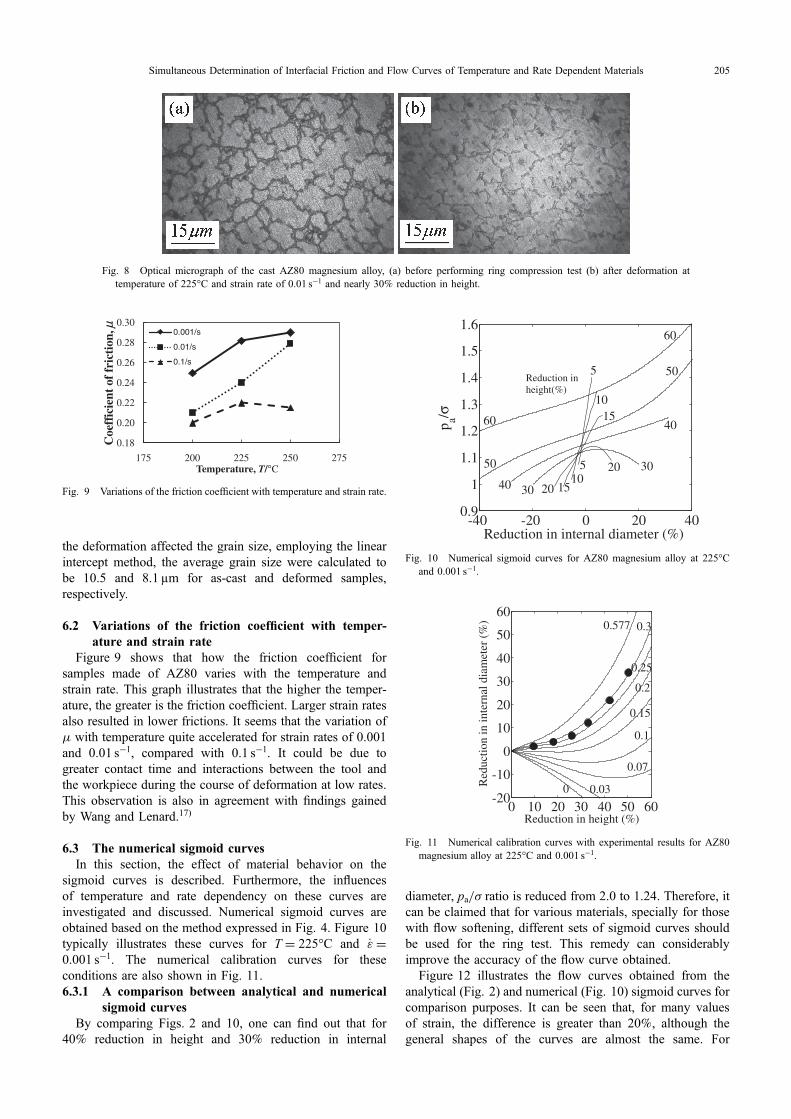
the deformation affected the grain size, employing the linearintercept method, the average grain size were calculated tobe 10.5 and 8.1 µm for as-cast and deformed samples,respectively.
6.2 Variations of the friction coefficient with temper-ature and strain rate
Figure 9 shows that how the friction coefficient forsamples made of AZ80 varies with the temperature andstrain rate. This graph illustrates that the higher the temper-ature, the greater is the friction coefficient. Larger strain ratesalso resulted in lower frictions. It seems that the variation of® with temperature quite accelerated for strain rates of 0.001and 0.01 s¹1, compared with 0.1 s¹1. It could be due togreater contact time and interactions between the tool andthe workpiece during the course of deformation at low rates.This observation is also in agreement with findings gainedby Wang and Lenard.17)
6.3 The numerical sigmoid curvesIn this section, the effect of material behavior on the
sigmoid curves is described. Furthermore, the influencesof temperature and rate dependency on these curves areinvestigated and discussed. Numerical sigmoid curves areobtained based on the method expressed in Fig. 4. Figure 10typically illustrates these curves for T = 225°C and _¾ =0.001 s¹1. The numerical calibration curves for theseconditions are also shown in Fig. 11.6.3.1 A comparison between analytical and numerical
sigmoid curvesBy comparing Figs. 2 and 10, one can find out that for
40% reduction in height and 30% reduction in internal
diameter, pa/· ratio is reduced from 2.0 to 1.24. Therefore, itcan be claimed that for various materials, specially for thosewith flow softening, different sets of sigmoid curves shouldbe used for the ring test. This remedy can considerablyimprove the accuracy of the flow curve obtained.
Figure 12 illustrates the flow curves obtained from theanalytical (Fig. 2) and numerical (Fig. 10) sigmoid curves forcomparison purposes. It can be seen that, for many valuesof strain, the difference is greater than 20%, although thegeneral shapes of the curves are almost the same. For
Fig. 8 Optical micrograph of the cast AZ80 magnesium alloy, (a) before performing ring compression test (b) after deformation attemperature of 225°C and strain rate of 0.01 s¹1 and nearly 30% reduction in height.
0.18
0.20
0.22
0.24
0.26
0.28
0.30
175 200 225 250 275
Coe
ffic
ient
of
fric
tion
, μ
Temperature, T/°C
0.001/s
0.01/s
0.1/s
Fig. 9 Variations of the friction coefficient with temperature and strain rate.
-40 -20 0 20 400.9
1
1.1
1.2
1.3
1.4
1.5
1.6
Reduction in internal diameter (%)
p a/σ5
5
10
10
15
15
20
20
30
30
40
40
50
50
60
60
Reduction inheight(%)
Fig. 10 Numerical sigmoid curves for AZ80 magnesium alloy at 225°Cand 0.001 s¹1.
0 10 20 30 40 50 60-20
-10
0
10
20
30
40
50
60
Reduction in height (%)
Red
uctio
n in
inte
rnal
dia
met
er (
%)
0 0.03
0.07
0.1
0.15
0.2
0.25
0.30.577
Fig. 11 Numerical calibration curves with experimental results for AZ80magnesium alloy at 225°C and 0.001 s¹1.
Simultaneous Determination of Interfacial Friction and Flow Curves of Temperature and Rate Dependent Materials 205

evaluation of the accuracy of these curves, they wereincorporated in two separate FE simulations. It is notablethat each flow curve was used with the corresponding frictioncoefficient specified from the relevant calibration curves(Fig. 3 for the analytical coefficient and Fig. 11 for thenumerical one).
The load-displacement curves obtained from these FEsimulations together with the experimental results are shownin Fig. 13. It is clear from this figure that the flow curvesobtained from the numerical sigmoid curves, comparedwith the analytical one, resulted in a more accurate load-displacement curve.
The numerical and analytical sigmoid curves are comparedwith each other in Fig. 14. This comparison is made forT = 250°C, _¾ = 0.001 s¹1 and various reductions in height.It is obvious that for lower frictions (negative reduction ininternal diameter), the numerical and analytical curves arequite closer to each other, whereas at high frictions, there aremore clear dissimilarities between them. The significantdifference between the numerical and analytical curves atearly stages of the deformation could be due to strainsoftening behavior of the AZ80 alloy. With this regard it canbe claimed that for 60% reduction in height, where the flowstress reaches a quite steady value, the general shapes ofboth the analytical and numerical sigmoid curves are almostthe same.
6.3.2 The effects of temperature on the numericalsigmoid curves
Both the temperature and the rate of deformation affect theflow stress of the material. Therefore the geometry of sigmoidcurves could be influenced by these process variables. Forthree levels of temperatures, namely 200, 225 and 250°C, andthree different reductions in height, namely 15, 30 and 60%,the sigmoid curves are plotted in Fig. 15. The average strainrate for all these curves is 0.1 s¹1.
By comparing the ranges of variation of the internaldiameter for different graphs of Fig. 15, it can be found thatfor a higher reduction in height, the influence of friction onthe geometry of the ring sample is much more perceptible.Figure 15 also indicates that the higher the temperature, thelower is the contribution of flow stress in the average pressure(pa). Furthermore, this graph implies that around the peakstress of the flow curve, there is a peak in the relevantsigmoid curve [Fig. 15(a)]. However, sigmoid curves for60% reduction in height [Fig. 15(b)] are monotonicallyincreasing. This means that when the deformed sample is thinenough, the effect of friction is predominant and with anyincrease in interfacial friction, pa/· ratio increases consid-erably. For this situation, as well as other reductions inheight, any growth in temperature reduces the contribution offlow stress in pa.
0 0.1 0.2 0.3 0.4 0.5 0.6 0.7 0.8 0.9 10
20
40
60
80
100
120
True strain, ε
Flow
str
ess,
σ /M
Pa
Numerically based flow curveAnalytically based flow curve
Fig. 12 Comparison of the flow curves obtained based on the analyticaland numerical sigmoid curves for a temperature of 225°C and a strain rateof 0.001 s¹1.
0 0.2 0.4 0.6 0.8 1 1.2 1.4 1.6 1.8 202468
10121416182022
Displacement, Δh /mm
Forc
e, F
/KN
With numerical flow curveWith analytical flow curveExperiment
Fig. 13 Force-displacement curves gained from FE simulations withnumerical and analytical flow curves together with the experimentalfindings for T = 225°C and _¾ = 0.001 s¹1.
-20 -10 0 10 201
1.1
1.2
1.3
1.4
1.5
1.6
1.7
1.8
Reduction in internal diameter (%)
p a/σ
Analytical, 15%Numerical, 15%
Numerical, 30%Analytical, 30%
(a)
-60 -40 -20 0 20 40 60 801
1.2
1.4
1.6
1.8
2
2.2
2.4
Reduction in internal diameter (%)
p a/σAnalytical, 45%Numerical, 45%Analytical, 60%Numerical, 60%
(b)
Fig. 14 Comparison of analytical and numerical sigmoid curves for T = 250°C, _¾ = 0.001 s¹1 and different percentages reduction inheight; (a) 15 and 30%, (b) 45 and 60%.
F. Fereshteh-Saniee and S. M. Pezeshki206

6.3.3 The effects of strain rate on the numerical sigmoidcurves
In order to examine the influence of the rate ofdeformation, the sigmoid curves for three reductions inheight, three levels of strain rate and a temperature of 225°Care illustrated in Fig. 16. It can be seen that for low frictions(negative values on the horizontal axis) the strain rate did nothave a significant influence on pa/· ratio. However moreapparent effect of the rate dependency can be observed athigher frictions (right part of each curve). Considering aspecific reduction in height, at higher frictions, the averagepressure and flow stress increase when the strain rate rises butthe ratio pa/· decreases, i.e. the contribution of flow stress inpa increases.
7. Concluding Remarks
Based on the observations made in the previous sections,following conclusions can be drawn:(1) The experimental technique proposed can be used for
simultaneous evaluation of the interfacial friction andthe flow stress of the material under various conditionsof the bulk metal forming processes with considerabletime and cost savings.
(2) It is feasible to employ the ring compression test forevaluation of the flow stress of rate and temperature
dependent materials provided that the relevant sigmoidand calibration curves are employed.
(3) The FE simulations showed that the geometry of thesigmoid curves is significantly influenced by the mate-rial behavior, specially for metals with strain softening.
(4) The numerical sigmoid and calibration curves gainedfrom the FE simulations were used for flow stressevaluation of AZ80 magnesium alloy. The flow curvesobtained by this method, compared with the analyticalones, resulted in a good agreement with experimentalfindings.
(5) The sigmoid curves showed that the effect of thefriction on the sample geometry was more apparent athigher reductions in height.
(6) Any increase in the test temperature shifted the sigmoidcurves upwards, specially at higher levels of friction.
(7) The effect of the strain rate on the geometry of thenumerical sigmoid curves was minor for low levels offriction. However, this effect was significant at highfrictions, where pa/· reduced considerably by certainincrease in the rate of deformation.
REFERENCES
1) K. P. Rao and K. Sivaram: J. Mater. Process. Technol. 37 (1993) 295318.
-20 -10 0 10 200.95
1
1.05
1.1
1.15
1.2
1.25
Reduction in internal diameter (%)
p a/σ
200°C
225°C
250°C
(a) 15% Reductionin height
30% Reduction in height
-40 -20 0 20 40 60 80 1001
1.3
1.6
1.9
2.2
2.5
2.8
Reduction in internal diameter (%)
p a/σ
200°C
225°C
250°C
(b)
Fig. 15 Effects of the temperature on the numerical sigmoid curves for 0.1 s¹1 axial strain rate and, (a) 15 and 30% reduction in height,(b) 60% reduction in height.
Reductionin height
-20 -10 0 10 20
1
1.1
1.2
1.3
Reduction in internal diameter (%)
p a/σ
0.001/s0.01/s0.1/s
(a) 15% Reductionin height
30%
-40 -20 0 20 40 60 80 1001
1.25
1.5
1.75
2
2.25
2.5
2.75
3
Reduction in internal diameter (%)
p a/σ0.001/s0.01/s0.1/s
(b)
Fig. 16 Effects of deformation rate on the geometry of the numerical sigmoid curves at 225°C, (a) 15 and 30% reduction in height,(b) 60% reduction in height.
Simultaneous Determination of Interfacial Friction and Flow Curves of Temperature and Rate Dependent Materials 207

2) M. E. Mielnik: Metalworking Science and Engineering, (McGraw-Hill,New York, 1991).
3) B. Buchner, G. Maderthoner and B. Buchmayr: J. Mater. Process.Technol. 198 (2008) 4147.
4) H. Sofuoglu and J. Rasty: Tribol. Int. 32 (1999) 327335.5) F. Fereshteh-Saniee, I. Pillinger and P. Hartley: J. Mater. Process.
Technol. 153154 (2004) 151156.6) D. Shahriari, A. Amiri and M. H. Sadeghi: J. Mater. Eng. Perform. 19
(2010) 633642.7) A. T. Male and M. G. Cockcroft: J. Inst. Metals 93 (1964) 3846.8) L. F. Chiang, N. Nishioka, J. Y. Wang, H. Hosokawa, T. Uesugi, Y.
Takigawa and K. Higashi: Mater. Trans. 51 (2010) 477481.9) L. F. Chiang, H. Hosokawa, J. Y. Wang, T. Uesugi, Y. Takigawa and K.
Higashi: Mater. Trans. 51 (2010) 12491254.10) F. Fereshteh-Saniee and F. Fatehi-Sichani: J. Mater. Process. Technol.
177 (2006) 478482.11) Y. J. Hwu, C. T. Hsu and F. Wang: J. Mater. Process. Technol. 37
(1993) 319335.12) H. Cho and T. Altan: J. Mater. Process. Technol. 170 (2005) 6470.13) ASM International Handbook Committee: ASM Handbook, Vol. 2,
(Properties and Selection: Nonferrous Alloys and Special-PurposeMaterials, ASM International, 1990) pp. 455460.
14) B. Viehweger, A. Karabet, M. Düring and L. Schaeffer: Materialwiss.Werkstofftech. 36 (2005) 211217.
15) M. S. Joun, H. G. Moon, I. S. Choi, M. C. Lee and B. Y. Jun: Tribol.Int. 42 (2009) 311319.
16) E. Cerri, P. Leo and P. P. De Marco: J. Mater. Process. Technol. 189(2007) 97106.
17) F. Wang and J. G. Lenard: J. Eng. Mater. Tech. 114 (1992) 1318.
F. Fereshteh-Saniee and S. M. Pezeshki208