simulations shock waves cavitation …/67531/metadc688844/m2/1/high... · los alam national...
TRANSCRIPT

BI LA-UR-
Author(s)
Submitted tc
Los Alamos N A T I O N A L L A B O R A T O R Y
SIMULATIONS OF SHOCK WAVES AND CAVITATION BUBBLES PRODUCED IN WATER BY PICOSECOND AND NANOSECOND LASER PULSES (U)
Richard J. Scammon, ESA-EA Edward J. Chapyak, X-NH Robert P. Godwin, X-NH
R@CFIVED MAY 2 8 l398
O S T I
Alfred Vogel, Medizinisches Laserzentrum Luebeck GmbH, D-23562 Luebeck, Germany
Laser Tissue Interaction IX Conference Chair: Steven L. Jacques
Proceedings Bios'98, An International Symposium on Biomedical Optics, 24-30 January 1998, San Jose Convention Center, San Jose, CA SPIE Code Number: 3254A-35
Los A l a m National Laboratory, an affirmative adionlequal opportunity employer, is operated by the Universlty of California for the U.S. Department of Energy under contract W-7405ENG-36. By acceptance of this article, the publisher recognizes that the U.S. Government retains a nonexclusive. royatty-free license to publish or reproduce the published form of this contribution, or to allow others to do so, for U.S. Government purpses. Lo6 Alarms National Laboratory requests that the publisher identify this article as work performed under the auspices of the U.S. Department of Energy. The Los Aams National Laboratory strongly supports academic freedom and a researchei's right to publish; as an institution, however, the Laboratory does not endorse the viewpoint of a publication or guarantee its technical correctness. Form 836 (IO/%)

This report was prepared as an account of work sponsored by an agency of the United States Government. Neither the United States Government nor a n y agency thereof, nor any of their employees, makes any warranty, express or implied. or assumes any legal liability or responsibility for the accuracy, completeness, or use- fulness of any infonnation, apparatus, product, or process disclosed, or represents that its use would not infringe privately owned rights. Reference herein to any spe- cific commercial product, proctss, or seMcc by trade name, trademark, manufac- turer. or otherwise docs not necessarily constitute or imply its endorsement, mom- mendation, or favoring by the United States Government or any agency thereof. The views and opinions of authors expressed herein do not necessarily state or reflect those of the United States Government or any agency thereof.

DISCLAIMER
Portions of this document may be illegible in electronic image products. Images are produced from the best available original document.

Simulations of shock waves and cavitation bubbles produced in water by picosecond and nanosecond laser pulses
Richard J. Scammon, Edward J. Chapyak, and Robert P. Godwin
Los Alamos National Laboratory Los Alamos, NM 87545
Alfred Vogel
Medizinisches Laserzentrum Luebeck GmbH D-23562 Luebeck, Germany
ABSTRACT
We compare numerical simulations of bubble dynamics in water with experiments performed at the Medizinisches Laserzentrum Liibeck. Spatial and temporal features of the laser beam were modeled. Plasma growth was predicted using a moving breakdown model. We compare the measured and calculated positions of the shock front and the bubble wall as a function of time after optical breakdown in water. Nd:YAG laser pulses of 30-ps 1-mJ and 6-ns 10-mJ were simulated. We have extended previous work in which picosecond deposition was modeled as temporally instantaneous and spatially uniform'.
Keywords: bubble dynamics, cavitation, experimental and numerical hydrodynamics, shocks, laser medical applications
1. INTRODUCTION
Bubble dynamics and its associated shock waves, acoustic waves, and jetting, are important mechanisms in laser medical applications. The dynamics produce both intended medical effects and undesirable collateral effects. Multidimensional Eulerian compressible hydrodynamics codes are capable of modeling the shock waves and highly distorted flows associated with these applications. Combined with appropriate laser absorption models, material equations of state (EOS), tissue dynamics and tissue failure models, such codes can aid in understanding and optimizing clinical protocols in which bubble dynamics are an important consideration.
Vogel et u1.2,3,4 used time-resolved photographic methods to investigate shock wave and cavitation bubble expansion after optical breakdown in water using Nd:YAG laser pulses of 30-ps and 6- ns duration (full width at half-maximum) with energies typical of medical applications. They measured the position of the shock front and bubble wall position as a function of time with temporal resolution -1 -ns and spatial resolution -4-pm. These high-resolution measurements provide excellent data for quantitative comparison with numerical simulations. Selected photos from the Medizinisches Laserzentrum Liibeck (MLL) experiments are reproduced in figures 1 and 2. The laser light is incident from the right.
In previous work by Chapyak et al.' the Los Alamos National Laboratory code MESA-2D was used to examine the MLL picosecond experiments assuming that the energy deposition was temporally instantaneous and spatially uniform. These assumptions worked well because there is little dynamic motion of the target material during energy delivery for the short pulse width. The excellent agreement of the calculations with the experimental data serves to validate both the numerical hydrodynamics of the MESA-2D code and the water equations of state used in the simulations.

Fig. 1. Photographic records of the shock wave and bubble wall after the optical breakdown in water by a 6-ns, 10-mJ laser pulse in the MLL experiments. (The photos are not reproduced to the same scale.)
Fig. 2. Photographic records of the shock wave and bubble wall after the optical breakdown in water by a 30-ps, 1-mJ laser pulse in the MLL experiments. (The photos are not reproduced to the same scale.)
The principal purpose of the present calculations is to extend the previous work to include the 6- ns MLL experiments. For these experiments there is significant dynamic response of the target material during the laser pulse and we could no longer make the assumption that the energy deposition is temporally instantaneous and spatially uniform. In order to accomplish the simulation we modeled the temporal and spatial features of the laser beam, plasma ignition, plasma growth, and the deposition of the laser energy in the plasma. Relatively straightforward models were employed which make them easy to implement and use but ignores the detailed plasma physics. Plasma ignition and growth is predicted

using a moving breakdown model while the laser energy deposition in the plasma is treated as an exponential function.
2. MESA-2D ENERGY DEPOSITION MODEL
In order to treat the temporal and spatial aspects of the laser energy deposition it was necessary to add a new model to the MESA-2D user-defined subroutines. The model accounts for the pertinent aspects of the laser experiments presented in reference 2; i.e., the beam focusing angle, Gaussian radial energy distribution and the experimentally determined energy rate.
The laser beam energy is tracked using constant-energy beam segments based on the Eulerian mesh at the beam focal plane and includes the Gaussian radial energy distribution. These “constant energy” segments are projected back toward the laser and used to follow the incoming energy. The model follows the beam out to 1.5 times the l/e2 radius and thus tracks 98.9 % of the beam energy.
Ionization is predicted using the moving breakdown model discussed in references 3 and 4. It assumes that breakdown occurs independently at each location as soon as the irradiance of the electrical field surpasses the threshold value. At each time step in the calculation the energy irradiance is calculated as a function of time, and spatial location in the beam, with the result checked against the ignition threshold.
Energy deposition in the plasma is treated as exponential, as a function of distance from the leading edge of the plasma. No energy is deposited in cells that are below the breakdown threshold and laser energy is either absorbed or lost via transmission. Only minimal energy reflection was measured in the experiments4 and thus none is included in the model. The model keeps track of the energy absorbed and lost.
References 3 and 4 report the ignition thresholds and absorption coefficients that were derived from experimental data. These were used as input parameters for the energy deposition model and are listed in Table I. Both values are treated as constants. The temporal evolution of the laser power PL is described as a sin2 function with duration T (full-width at half-maximum), and total duration 22:
Table I. Laser parameters derived from experiments 30-ps laser 6-11s laser
Breakdown irradiance threshold 6.3~10” W/cm2 5 . 1 ~ 1 0 ’ ~ W/cmz Exponential absorption coefficient 360 cm-’ 900 cm-’
Several alternative energy deposition options are included in the general model. All use the moving breakdown model to predict ionization but differ in the way in which the energy is distributed within the plasma. Options include uniform energy deposition in the plasma as a function of cell volume, or mass. Another option deposits energy as a function of volume in each beam segment but retains the Gaussian radial energy distribution across the beam segments. These options allow investigation, in a general sense, of the affects of energy redistribution within the plasma.
3. CONDITIONS FOR THE SIMULATIONS
The pertinent laser parameters for the experiments, as defined in reference 2, are listed in Table 11. We used the same LANL SESAME5p6 tabular water equation of state @OS) that was used in the previous work. Identified as SESAME #7150, it is an equilibrium, Maxwell construction EOS that

includes the effects of both phase changes and ionization. The simulations do not include the effects of viscosity or surface tension.
Table 11. Laser experiment definition’ 30-ps laser 6-ns laser
Laser frequency 1064 nm 1064 nm
Laser energy at working volume 0.66 mJ 8.2 mJ Laser energy I m J 10 mJ
Energy lost in transmission4 14% 3% Beam focusing angle a 14O 2 2 O ~ a d i u s of spot at focal plane (lie2> Radial energy distribution Gaussian Gaussian a The full angle defined by the l/e’ value of the intensity.
2.9 pm 3.8 pm
For the 6-11s case the computational zones (or cells) in the plasma region are uniform in size and square with Ar = Az = 0.5 pm. This provides reasonable resolution of the energy deposition details with a little over 7 cells inside the l/e2 radius at the focal plane. Outside of the plasma region the cell size is expanded geometrically by a multiplicative factor (or rezone ratio) of 1.03. The total number of computational cells is 1.23 x lo5. The problem takes several hours to run on a CRAY Y-MP. A slightly finer mesh in the plasma region resulted in little change in the results with the exception of slightly smoother contour plots and si@icantly longer run times. Sensitivity of the results to the rezone ratio will be discussed below.
For the 30-ps case the computational zones in the region of the plasma are uniform in size and square with Ar = Az = 0.375 gm. Again this provides a little over 7 cells inside the l/e2 radius at the focal plane with the cell size outside of the plasma region expanded geometrically by a multiplicative factor of 1.1. The total number of computational cells is 1.7 x lo5. The problem takes several hours to run on a CRAY Y-MP. 0
4. COMPUTATIONAL RESULTS AND COMPARISONS TO EXPERIMENT
As discussed above, the primary purpose of the present work was to simulate the 6-11s experiment where there is significant material motion during the laser pulse. In addition to the long pulse width simulation we reran the 30-ps case using the new model to include the time dependent plasma dynamics and energy deposition.
The computed and measured maximum radial shock wave and bubble wall locations for the 6-m, 10-mJ case are plotted as a function of time in Fig. 3. The shock wave location for the simulation was defined as the location of the 0.1 kbar pressure contour while the bubble wall was defined as coincident with the 0.98 g/cm2 density contour. Agreement is reasonably good with the velocity of both the shock and bubble wall being a little higher than the experiment at the end of the calculation. The discrepancy of the starting position could be caused by differences between what shows up in a photo versus what was selected as the value to edit.
Selecting the element size for the computational mesh is always a trade off, particularly for multidimensional simulations. Finer zones result in finer resolution at the cost of computer time that can result in run times that are cumbersome (long turn around) or prohibitive (cost or resources). The present calculation is a good demonstration of this and of how the velocity of the shock can be adversely affected by the mesh. As discussed previously, in order to minimize the total number of elements in the problem the cell size outside of the plasma volume is increase using a multiplicative factor. The original factor for this problem was 1.1. The resulting mesh tended to spread out the wave front resulting in apparent shock velocities that were unreal. Switching to a rezone ratio of 1.03 more than doubled the computational time a

but resulted in more realistic shock velocities. The logical next step of further refining the mesh has not been done.
- 350- Experiment
Shock Bubble
Shock - - v Bubble
3oo- MESA-2D . . A .
250 - 5 200- W
A
. A I
I
A I . A I .
'I n
0 20 40 60 80 100 120 140
Time (ns)
Fig. 3. Measured and computed locations of the shock wave and bubble wall as a function of time for the 6-11s case.
The energy distribution computed by MESA-2D is plotted in figure 4. The initial energy in the simulation is defined as zero for the purpose of the plot, it is not zero in the calculation. Figures 5 and 6 are the computed pressure and density as a function of the radius, at the plane of the maximum shock wave and bubble wall radius. The pressure profile at 90-ns shows considerable spreading of the shock front which is probably a function of the increqsing mesh size even with the revised rezone ratio. Hydrocodes normally must spread the shock front over several cells to maintain calculational stability. The calculations can not handle an infinitely steep shock front. The density plot shows a high density region following the shock wave with a sharp decrease in density at the bubble wall.
Figures 7 and 8 are contour plots of the bubble wall (density = 0.98 g/cm3) and the shock front (pressure = 0.1 kbar). These are roughly the computational equivalent of the experimental photos in figure 1. There are similarities but also a number of obvious differences in shape. The steps in the bubble contour in figure 7 are related to the beam segments used in the energy deposition calculation. The numerical instability or noise in the shock contour in figure 8 is essentially inherent in the computational process. It is not a function of the energy deposition model and does not &ect the results. It is possible that refining the mesh would eliminate it but since it does not affect the results the cost in additional run time would not be worth it.
A limited number of calculations were run to examine the sensitivity of the results to various input parameters and the optional energy deposition models. None of tests to date resulted in any significant improvement of the simulation however there are still a number of options to be investigated.

8 - AA- -A A - . A. . A
6 - F.-------,_ m-
v - i - A - Change in total energy (laser) -.- Internal energy (initial = 0) - - - 0--- Kinetic energy
0 I I I I I I
0.00 0.02 0.04 0.06 0.08 0.10
Time (ps)
Fig. 4. Computed energy distribution as a function of time for the 6-ns case.
R Fig. 5. Computed radial pressure profile, in the plane of the maximum shock wave and bubble wall radius, at 10,20,40 and 90-ns for the 6-11s case.

I I I I 300 0.001 0.002 0.003 0.004 0.005 0.006 0.007 0.008 0.009 0.010 0,011 C
R Fig. 6. Computed radial density profile, in the plane ofthe maximum shock wave and bubble wall radius, at 10,20,40 and 90-11s for the 6-11.3 case.
ul a
0 9.
T &
L" 9. a
I
Bubble contour 0.98g/cm3 \
0.1 kbar pressure contour
I . # I I 1 I I I I I I -0.03 -0.02 -0.01 0.00 0.01 0.02 0.03 0.04 0.05 0.06
(cml Fig. 7. Computed bubble and shock contour at 12-ns for the 6-11s case. Compare with the MLL photographs in Fig. 1.
Bubble contour 0.98 g/cm3
37
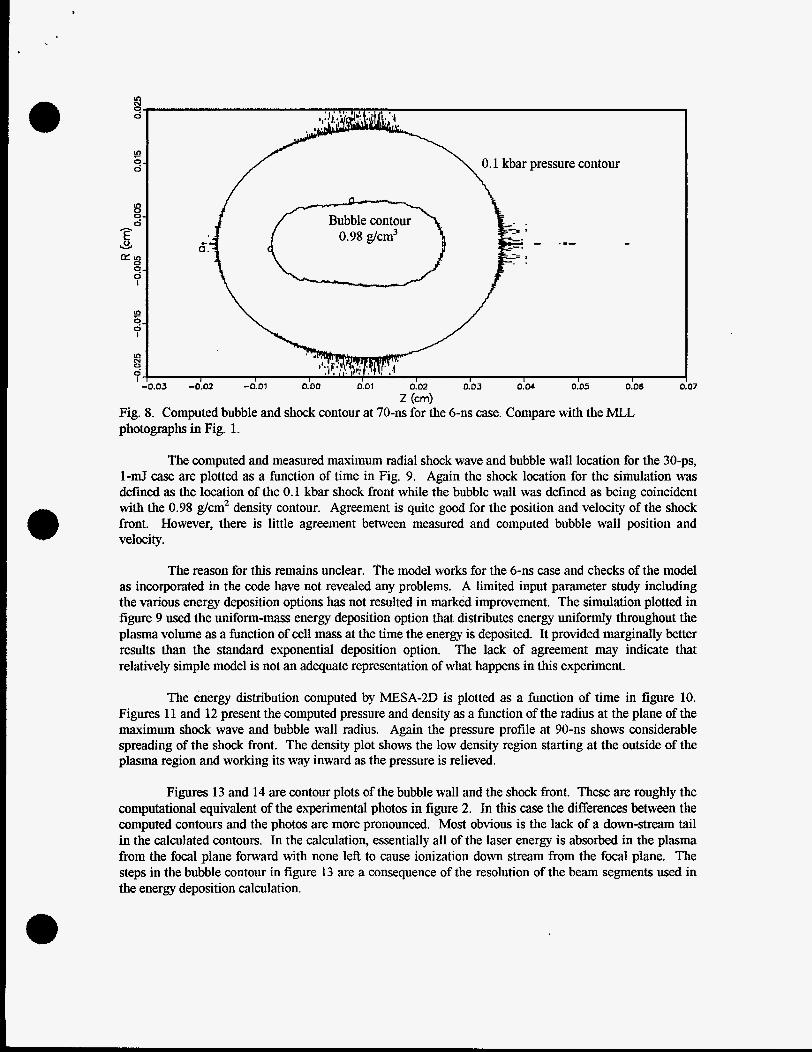
Z (cm) Fig. 8. Computed bubble and shock contour at 70-11s for the 6-11s case. Compare with the MLL photographs in Fig. 1.
The computed and measured maximum radial shock wave and bubble wall location for the 30-ps, 1-mJ case are plotted as a function of time in Fig. 9. Again the shock location for the simulation was defined as the location of the 0.1 kbar shock front while the bubble wall was defined as being coincident with the 0.98 g/cm2 density contour. Agreement is quite good for the position and velocity of the shock front. However, there is little agreement between measured and computed bubble wall position and velocity.
The reason for this remains unclear. The model works for the 6-11s case and checks of the model as incorporated in the code have not revealed any problems. A limited input parameter study including the various energy deposition options has not resulted in marked improvement. The simulation plotted in figure 9 used the uniform-mass energy deposition option that distributes energy uniformly throughout the plasma volume as a function of cell mass at the time the energy is deposited. It provided marginally better results than the standard exponential deposition option. The lack of agreement may indicate that relatively simple model is not an adequate representation of what happens in this experiment.
The energy distribution computed by MESA-2D is plotted as a function of time in figure 10. Figures 11 and 12 present the computed pressure and density as a function of the radius at the plane of the maximum shock wave and bubble wall radius. Again the pressure profile at 90-11s shows considerable spreading of the shock front. The density plot shows the low density region starting at the outside of the plasma region and working its way inward as the pressure is relieved.
Figures 13 and 14 are contour plots of the bubble wall and the shock front. These are roughly the computational equivalent of the experimental photos in figure 2. In this case the differences between the computed contours and the photos are more pronounced. Most obvious is the lack of a down-stream tail in the calculated contours. In the calculation, essentially all of the laser energy is absorbed in the plasma from the focal plane forward with none left to cause ionization down stream from the focal plane. The steps in the bubble contour in figure 13 are a consequence of the resolution of the beam segments used in the energy deposition calculation.

180 - Experiment
160 - Shock
140 - 120- Shock
Bubble . MESA-2D
- v 100-
- Bubble
0 10 20 30 40 50 60 70 80 90
Time (ns)
Fig. 9. Measured and computed locations of the shock wave and bubble wall as a function of time for the 30-PS C~S.
3 W
h e? 8 W
A Change in total energy (laser) -.- Internal energy (initial = 0) - - - 0- - - Kinetic energy
1 I I I I
0.000 0.005 0.010 0.015 0.020
Time (ps)
Fig. 10. Computed energy distribution as a function of time for the 30-ps case.

a
a
0
0 6
m 0
2
5?g n2 5
l b
0
5 g2
N 0 x
2 0 0
0.000 0.002 0.004 0.006 0.008 0.010 0.012 0.014 0.016 0
m 0
2
5?g n2 5
l b
0
5 g2
N 0 x
2 0 0
0.000 0.002 0.004 0.006 0.008 0.010 0.012 0.014 0.016 0 118 R
Fig. 1 1. Computed radial pressure profile, in the plane of the maximum shock wave and bubble wall radius, at 2,6, 10,22,42 and 90-ns For the 30-ps case.
91 0
1 t 1 1 1 0.0 5.0 10.0 15.0 20.0 25.0 30.0 35.0 40.0 45.0 ! O
R +io-' Fig. 12. Computed radial density profile, in the plane of the maximum shock wave an and bubble wall radius, at 2,6, 10,22,42 and 90-11s for the 30-ps case.

Bubble contour
0.1 kbar pressure contour
In
0 4-
In c
8-
In 0 x- T E g &
2- I
;- 9
w x I I I I I I I I I I -0.02 -0.01 0.00 0.01 0.02 0.03 0.04 0.05 0.06 0.07 <
Z (cd Fig. 13. Computed bubble and shock contour at 8-ns for the 3Op-s case. Compare with the MLL photographs in Fig. 2.
In N
8 0.1 kbar pressure contour
LD 9- 0
In 0
8- T E 8
8-
- -
I
9 9- 0
a x I I I I I I I I I I -0.02 -0.01 0.00 0.01 0.02 0.03 0.04 0.05 0.06 0.07
Z (cml Fig. 14. Computed bubble and shock contour at 80-ns for the 3Op-s case. Compare with the MLL photographs in Fig. 2.
5. CONCLUSIONS
18
We have simulated the dynamics produced by both 6-11s 10-mJ and 30-ps 1-mJ laser pulse plasma breakdown in water. The computed shock wave and bubble wall locations for the 6-11s case are in reasonable agreement with the measurements made at MLL. For the 30-ps case the shock wave predictions agree quite well with the measurement but there is a problem with the bubble size and bubble wall velocity. It is not clear if the discrepancy can be corrected by further work on the existing model or if

the relatively simple model is not adequate to describe the physics associated with the 30-ps experiment. Both simulations would benefit from additional effort.
6. ACKNOWLEDGMENTS
A DOE Cooperative Research and Development Agreement (CRADA) between Los Alamos National Laboratory, Oregon Medical Laser Center, and Palomar Medical Technologies supported R. J. Scammon, E. J. Chapyak and R. P. Godwin.
7. REFERENCES
1.
2.
3.
4.
5.
6.
E. J. Chapyak, R. P. Godwin and A. Vogel, “A Comparison of Numerical Simulations and Laboratory Studies of Shock Waves and Cavitation Bubble Growth Produced by Optical Breakdown in Water,” Laser Tissue Interaction VIII. Proc. SPIE 2975, 335-342, 1997. A. Vogel, S. Busch, and U. Parlitz, “Shock wave emission and cavitation bubble generation by picosecond and nanosecond optical breakdown in water,” J. Acoust. SOC. Am. 100(1), 148-165, July 1996. A. Vogel, K. Nahen, Dirk Theisen and J. Noack, “Plasma Formation in Water by Picosecond and Nanosecond Nd:YAG Laser Pulses - Part I: Optical Breakdown at Threshold and Superthreshold Irradiance,” IEEE Journal of Selected Topics in Quantum Electronics, Vol. 2, No. 4, December 1996. K. Nahen and A. Vogel, “ Plasma Formation in Water by Picosecond and Nanosecond Nd:YAG Laser pulses - Part 11: Transmission, Scattering and Reflection,” IEEE Journal of Selected Topics in Quantum Electronics, Vol. 2, No. 4, December 1996. K. S. Holian, “T-4 Handbook of Material Properties Data Bases,” Los Alamos National Laboratory
“SESAME: The Los Alamos National Laboratory EOS Data Base,” S. P. Lyon and J. D. Johnson, Editors, LA-UR-92-3407, 1992.
report LA-10160-MS, 1984,