simulations reveal the power and peril of artificial
TRANSCRIPT

Boise State UniversityScholarWorks
Biology Faculty Publications and Presentations Department of Biological Sciences
6-1-2017
Simulations Reveal the Power and Peril of ArtificialBreeding Sites for Monitoring and ManagingAnimalsChristopher J.W. McClurePeregrine Fund
Benjamin P. PauliBoise State University
Julie A. HeathBoise State University
This document was originally published in Ecological Applications by Wiley on behalf of the Ecological Society of America. Copyright restrictions mayapply. doi: 10.1002/eap.1509
1155
Simulations reveal the power and peril of artificial breeding sites for monitoring and managing animals
Christopher J. W. MCClure,1,4 BenJaMin p. pauli,2,3 and Julie a. heath2
1The Peregrine Fund, 5668 West Flying Hawk Lane, Boise, Idaho 83709 USA2Department of Biological Sciences and Raptor Research Center, Boise State University,
1910 University Drive, Boise, Idaho 83725 USA
Abstract. Despite common use, the efficacy of artificial breeding sites (e.g., nest boxes, bat houses, artificial burrows) as tools for monitoring and managing animals depends on the demography of target populations and availability of natural sites. Yet, the conditions ena-bling artificial breeding sites to be useful or informative have yet to be articulated. We use a stochastic simulation model to determine situations where artificial breeding sites are either useful or disadvantageous for monitoring and managing animals. Artificial breeding sites are a convenient tool for monitoring animals and therefore occupancy of artificial breeding sites is often used as an index of population levels. However, systematic changes in availability of sites that are not monitored might induce trends in occupancy of monitored sites, a situation rarely considered by monitoring programs. We therefore examine how systematic changes in unmon-itored sites could bias inference from trends in the occupancy of monitored sites. Our model also allows us to examine effects on population levels if artificial breeding sites either increase or decrease population vital rates (survival and fecundity). We demonstrate that trends in occupancy of monitored sites are misleading if the number of unmonitored sites changes over time. Further, breeding site fidelity can cause an initial lag in occupancy of newly installed sites that could be misinterpreted as an increasing population, even when the population has been continuously declining. Importantly, provisioning of artificial breeding sites only benefits pop-ulations if breeding sites are limiting or if artificial sites increase vital rates. There are many situations where installation of artificial breeding sites, and their use in monitoring, can have unintended consequences. Managers should therefore not assume that provision of artificial breeding sites will necessarily benefit populations. Further, trends in occupancy of artificial breeding sites should be interpreted in light of potential changes in the availability of unmoni-tored sites and the potential of lags in occupancy owing to site fidelity.
Key words: American Kestrel; artificial burrow; bat house; cavity nester; demography; nest box; nest site; population decline; population model; site fidelity.
introduCtion
The provision of artificial, or human- made, breeding sites is a management tool that has been used successfully across taxa spanning Animalia (e.g., Pomeroy 1981, Nelson et al. 2002, Catry et al. 2009, Bouckaert et al. 2014, D’Amico et al. 2014). Populations of animals can benefit from arti-ficial breeding sites when natural breeding sites are limiting, or when individuals that use artificial sites experience better reproductive success or survival than those using natural sites (e.g., Newton 1994, Cade and Temple 1995, Libois et al. 2012, McClure et al. 2016). Indeed, reproductive success is often better in artificial breeding sites (Møller 1989, Cade and Temple 1995) and can be improved, for example, by installing devices to exclude predators (e.g., Froke 1983, Brown and Collopy 2008). Also, artificial
breeding sites are often used to survey populations of animals (e.g., Gibbons and Lindenmayer 2002, Fokidis and Risch 2005, Katzner et al. 2005, Both et al. 2006) and are therefore commonly used tools for both monitoring and managing animal populations.
There are myriad monitoring programs that survey populations using artificial breeding sites (e.g., Jackson and Tate 1974, Saurola 2008, Smallwood et al. 2009a, b, Shutler et al. 2012, Selonen et al. 2014), yet the assumption of occupancy of artificial sites accurately tracking overall population levels is rarely assessed (but see Shutler et al. 2012). Hayward et al. (1992) noted that occupancy of artificial sites might actually increase with a decline in available natural sites, providing erroneous inference into population trends. Similarly, VanCamp and Henny (1975) suggested that their artificial sites should not be used for assessing population trends for Eastern Screech Owls (Megascops asio) because a population decline caused by loss of habitat would not lead to a decline in occupancy. Despite these statements by VanCamp and Henny (1975) and Hayward et al. (1992), the effects of losses of unmonitored natural sites on the occupancy of
Ecological Applications, 27(4), 2017, pp. 1155–1166© 2017 by the Ecological Society of America
Manuscript received 9 September 2016; revised 10 January 2017; accepted 11 January 2017. Corresponding Editor: Dianne Brunton.
3 Present address: Biology Department, Saint Mary’s University of Minnesota, 700 Terrace Heights, Winona, Minnesota 55987 USA.
4E-mail: [email protected]

1156 Ecological Applications Vol. 27, No. 4CHRISTOPHER J. W. MCCLURE ET AL.
sites used for monitoring are rarely mentioned by authors and have yet to be rigorously examined. Conversely, the rise in popularity of provisioning artificial breeding sites by the general public (e.g., Jackson and Tate 1974, Zeleny 1978, Cooper et al. 2006) might lead to apparent declines in the occupancy of already- established monitoring pro-grams if some animals switch to using the new sites. This declining occupancy in established monitoring programs might be misinterpreted as a decline in population levels, yet this possibility has yet to be articulated.
Further, when new breeding sites are installed, there is often a period where occupancy increases and then stabi-lizes or declines (Jackson and Tate 1974, Gauthier and Smith 1987, Newton 1998, Lindenmayer et al. 2009, Smallwood et al. 2009a, b, Brown et al. 2014), i.e., an “occupancy lag,” during which trends in occupancy of artificial sites will not be representative of overall popu-lation trends. The utility of artificial breeding sites as monitoring tools therefore cannot be taken for granted.
Despite well- known successes of some management efforts, breeding site limitation cannot always be assumed (Gauthier and Smith 1987, Waters et al. 1990, Wiebe 2011) and, there are cases in which the provision of arti-ficial breeding sites can have negative effects. For example, Burrowing Owls (Athene cunicularia) produce fewer fledglings in artificial burrows than natural breeding sites (Botelho and Arrowood 1998). Poor placement of artificial breeding sites can attract animals to lower quality habitat (Mänd et al. 2005, Klein et al. 2007, Strasser and Heath 2013). Artificial sites placed at a high density can lead to lower reproductive success (Pöysä and Pöysä 2002, Mänd et al. 2005). And, in some areas, arti-ficial sites might be vulnerable to poaching (Du Plessis 1995, Sanz et al. 2003). Artificial breeding sites can therefore act as ecological traps (Klein et al. 2007, Björklund et al. 2013) and cannot necessarily be con-sidered beneficial to populations.
The effectiveness of artificial breeding sites as both management and monitoring tools therefore rests on the demography of target populations. Yet, no study has explicitly examined demographic conditions where arti-ficial breeding sites are useful, or the consequences of their misuse under the wrong conditions. The American Kestrel (Falco sparverius) is a cavity- nesting falcon that is often managed and monitored using nest boxes and therefore provides a practical example of the demography under-lying the power and perils of artificial breeding sites. Indeed, artificial breeding sites are considered critical to the management of American Kestrels (Smallwood et al. 2009a) because of observed increases in kestrel popula-tions after the installation of artificial sites (Nagy 1963, Hamerstrom et al. 1973, Stahlecker and Griese 1979, Bloom and Hawks 1983, Wilmers 1983, Toland and Elder 1987, Smallwood and Collopy 2009). Further, several esti-mates of population trends have been based on long- term monitoring programs of occupancy of American Kestrels at artificial breeding sites (Smallwood et al. 2009a, Steenhof and Peterson 2009a).
Evidence from several data sets indicates that some populations of American Kestrels have been declining since at least the late 1960s (Farmer et al. 2008, Farmer and Smith 2009, Smallwood et al. 2009a, Paprocki et al. 2014, Sauer et al. 2014, Bolgiano et al. 2015). Because populations of American Kestrels may be limited by availability of nest sites (Cade 1982, Smallwood and Bird 2002), some authors have suggested that a loss of nest sites might be contributing to population declines (Sullivan and Wood 2005, Smallwood and Collopy 2009). Under the assumption that nest- site limitation constrains kestrel populations, professional (e.g., Smallwood et al. 2009b) and citizen science (C. J. W. McClure, personal observation) programs are installing artificial breeding sites, in part, to increase nest site availability and thereby slow or reverse population declines.
The example of the American Kestrel can therefore address an applied conservation problem while also eluci-dating general patterns of demography that make arti-ficial breeding sites either a help or hindrance to populations of animals. To examine utility of artificial sites for monitoring, we use a simulation model to examine whether occupancy of monitored sites mirrors trends in overall population levels when the number of unmoni-tored sites increases or declines over time. Regarding management, we examine effects of provisioning artificial breeding sites to populations that are declining, stable, or increasing. We also examine situations where artificial sites either improve survival and reproduction, or act as ecological traps. Our simulation model also allows us to systematically test our assumptions and explore potential biases. Although our example is of the American Kestrel, we demonstrate that results of our simulations are gener-alizable across a wide range of taxa.
Methods
The SITES model
Here, we describe our simulation model, called SITES (Data S1), using ODD (Overview, Design concepts, Details) protocol for describing individual- based models (Grimm et al. 2006, 2010). We constructed the model in NetLogo 5.2.0 (Wilensky 1999), a free software platform. The model can be run using NetLogo on all major oper-ating systems.
Purpose.—The purpose of the SITES model is to demon-strate the demographic conditions under which artificial breeding sites are useful for management or informative for monitoring.
Entities, state variable, and scales.—The virtual land-scape is a 50 × 50 pixel square. Within the landscape, there are a user- defined number of available breeding sites. Breeding sites can either be “natural” or “artificial.” The user can choose the average levels of survival and fe-cundity of females occupying either type of site. Breeding

POWER AND PERIL OF ARTIFICIAL SITESJune 2017 1157
sites are pixels with colors either red for artificial or green for natural. Black pixels indicate areas lacking breeding sites. There is no variation in the quality of the breeding sites, except the differences between natural and artificial sites defined by the user. Time moves in one- year incre-ments and the user can determine the time step in which the artificial sites are added to the environment. At ini-tialization, natural sites are randomly placed within the environment and artificial sites are randomly placed dur-ing the user- defined time step. Agents in this model are females that are in three classes determined by their age and breeding status: “adults” are more than one year old and currently occupying a breeding site, “floaters” are more than one year old and not currently occupying a breeding site, and “juveniles” are of age zero.
Process overview and scheduling.—During each time step, breeding sites are added or removed at rates defined by the user each time step, animals increment their age, breed, floaters attempt to settle, immigrants enter the system, adults die, adults disperse, floaters die, juveniles die and juveniles disperse according to stochastic pro-cesses. The model runs for a pre- specified length of time (e.g., 100 yr) or until there are no animals alive.
Design concepts.—1. Basic principles.—The basic princi-ple of breeding site limitation of animals (Moffat 1903, Hunt 1998, Newton 1998, Hunt and Law 2000) under-lies the use of artificial breeding sites as management tools and is the foundation of the SITES model. Pop-ulations of territorial animals, or animals that require certain breeding substrate, can be limited by availability of breeding sites without the regulatory effects of other density- dependent processes (Moffat 1903, Hunt 1998, Newton 1998, Hunt and Law 2000). Briefly, an upper limit on population level can be imposed by the amount of space or available breeding substrate, thereby limiting the number of individuals that can breed and, by exten-sion, the annual cohort of animals produced (Moffat 1903, Hunt 1998, Hunt and Law 2000). The model as-sumes availability of breeding sites limits the population to a level too low for regulation by other forms of densi-ty dependence. Once a population saturates all available breeding sites, animals that are of breeding age but una-ble to obtain breeding sites will become floaters (Moffat 1903, Hunt 1998). Although these floaters do not breed, they are still important for population dynamics (Pente-riani et al. 2005a, b, 2006, 2008, 2011), and represent the expansion potential of a population if new sites become available (Hunt 1998).
Our model can also be adapted to incorporate hetero-geneity in site quality, which can contribute to the regu-lation of population size (Rodenhouse et al. 1997, Hunt and Law 2000). The user can set the survival and repro-ductive rates of individuals occupying artificial or natural sites and therefore examine how differences between the two site types can regulate population size. Users also can use the “Affinity” setting along with differences in quality
between natural and artificial sites to examine situations where animals prefer lower quality sites (i.e., ecological traps; Schlaepfer et al. 2002) or high quality sites (Rodenhouse et al. 1997, Hunt and Law 2000). Our sim-ulation model therefore incorporates several other models of site limitation of, and selection by, animals (Moffat 1903, Rodenhouse et al. 1997, Hunt 1998, Hunt and Law 2000, Schlaepfer et al. 2002).
2. Emergence.—Annual population sizes and occupancy emerge from the availability of breeding sites as well as the levels of survival and fecundity experienced at natu-ral and artificial sites.
3. Interaction.—Only one animal can occupy a site at one time, and therefore can exclude other animals from occupying a site.
4. Stochasticity.—At each time step, individuals draw random numbers to determine whether they live or die, disperse, or choose natural sites over artificial sites. Immigration is also stochastically determined where a random number is drawn for each existing animal and to determine how many animals immigrate into the popu-lation in the next time step.
5. Observation.—The occupancy of natural and artificial sites as well as the overall population size and realized population growth rate are reported at each time step.
Initialization.—At the beginning of the simulation, breeding sites are created and assigned to random loca-tions within the simulated landscape. Five hundred fe-males are then randomly placed onto breeding sites with only one animal occupying a site. Time begins at time step zero.
Input data.—The SITES model does not use input data to represent time- varying processes.
Submodels.—1. Survival.—During each time step, each individual draws a random number. If that random number is greater than the value of survival set by the user, the animal dies. The user can set the value of sur-vival based on the animal’s age (e.g., lower for juveniles) and the type of breeding site being used.
2. Fecundity.—The number of animals born each time step is calculated by summing the fecundity of adults. Fecundity of adults is determined by the type- specific fe-cundity set by the user. Once animals are born they are classified as juveniles.
3. Dispersal.—Each time step, animals must try to obtain breeding sites. Simulated animals will only become float-ers if there are no breeding sites available. Floaters are the first to disperse and will try to occupy breeding sites; if none are available, they will remain floaters. Adults

1158 Ecological Applications Vol. 27, No. 4CHRISTOPHER J. W. MCCLURE ET AL.
disperse next and their propensity to switch breeding sites is set by the user with a value of one indicating a 100% probability that a bird will disperse, and a zero indicating that the animal will use the same site as the last time step. All sites are considered within the disper-sal distance of all individuals. The user also can set the affinity of the animals for the artificial sites such that a value of two makes the animals twice as likely to choose the artificial sites and values of 0.5 make the animals one- half as likely to choose artificial sites in proportion to their availability.
4. Immigration.—Immigration is an important factor in the dynamics of many animal populations (e.g., Schaub et al. 2006, Grøtan et al. 2009, Abadi et al. 2010), includ-ing American Kestrels (Brown and Collopy 2013). We therefore stochastically incorporate immigration into the population as a rate of immigrant animals per breed-ing animal in the previous time step (Abadi et al. 2010, Brown and Collopy 2013).
5. Site loss or addition.—The user can determine how many artificial sites are added and the year in which they appear. Loss or addition of natural sites can be set by the user by setting the rate of site change where positive values represent yearly increases and negative values rep-resent yearly losses.
Simulations
We focused our simulations on American Kestrels to demonstrate that our results have real- world conse-quences in applied ecology. We also simulated popula-tions of hypothetical r- (high fecundity, low survival) and K- selected (low fecundity, high survival) species to demonstrate that the patterns apparent in the example of the American Kestrel apply across a broad range of taxa (Appendix S1).
We examined the effectiveness of artificial breeding sites in monitoring and managing populations of animals by simulating populations with vital rates that produce a population growth rate (λ) with potential to expand (λ > 1), contract (λ < 1), or remain constant (λ = 1). For American Kestrels, we chose vital rates that produced a stable population (λ = 1) using a two- stage population matrix to calculate λ values (Caswell 2001, Brown and Collopy 2013). The values of these vital rates were adult survival = 0.4, juvenile survival = 0.1, fecundity = 1.6 female fledglings per nesting attempt, and immi-gration = 0.44. These values of vital rates are within ranges observed in wild populations (e.g., Bortolotti et al. 2002, Steenhof and Peterson 2009a, b, Brown and Collopy 2013). For the hypothetical r- and K- selected species, we chose values that gave a stable population when adult survival was either 0.90 (K- selected), or 0.10 (r- selected). To produce declining populations, we either subtracted 0.02 or 0.04 from adult survival to produce λ values of 0.98 and 0.96, respectively. We created a
growing population (λ = 1.02) by adding 0.02 to adult survival. We therefore examined the conditions under which artificial breeding sites are useful by repeating each set of simulations under conditions that ranged from λ = 0.96–1.02 in increments of 0.02. All sets of simula-tions were conducted 100 times with the number of natural sites set to 600 and artificial sites set to 100.
It is important to note that these λ values are deter-mined regardless of any potential changes in the number of breeding sites available. Our λ values therefore rep-resent the potential for population growth, not the realized rate of population change that is determined both by our λ values and by the availability of breeding sites. It is therefore possible to have a population that is declining because of a loss of breeding sites, but has λ > 1.
Monitoring.—We examined the conditions under which occupancy of artificial breeding sites is a useful index of population levels. First, we examined the effect of breed-ing dispersal on occupancy of artificial nest sites. For each λ value, we simulated dispersal at five levels: no dis-persal (0), obligate dispersal (1), and levels observed for American Kestrels in Missouri (0.38, Toland and Elder 1987), Idaho (0.58, Steenhof and Peterson 2009b), and Pennsylvania (0.84, Rohrbaugh and Yahner 1997). In these simulations, we added artificial sites at time step 20 and compared the occupancy of artificial sites to the true population trend. We predicted that if the probability of dispersal were low, it would take longer for artificial sites to become occupied and reflect “true” population trends. Second, we examined the effects of changes in the num-ber of unmonitored sites on occupancy of monitored breeding sites. For each value of λ, we changed the annu-al rate of change in the number of unmonitored breeding sites from −10 to 10 in increments of 5. In these experi-ments, we added unmonitored sites in time step zero and compared the occupancy of the monitored sites to the true population trend. We predicted that as the number of unmonitored sites changed, occupancy of monitored artificial sites would become an unreliable index for pop-ulation change. For all monitoring simulations affinity was set to one, indicating no preference in cavity type.
Management.—We performed simulations where the artificial sites have better, worse, or equal levels of adult survival and fecundity compared to the natural sites to examine the utility of using artificial breeding sites for mitigating population changes. For each value of λ, we changed the values at artificial sites of adult survival in in-crements of 0.03 and values of fecundity in increments of 0.15 in concert such that artificial sites affected both adult survival and fecundity in the same fashion, either posi-tively or negatively (Fig. 1). The increments by which we changed adult survival and fecundity were arbitrary and did not represent a particular threat or design of artificial breeding site. It is also possible that artificial breeding sites could affect survival and fecundity differently, positively affecting one while negatively affecting the other. Our

POWER AND PERIL OF ARTIFICIAL SITESJune 2017 1159
simulations are therefore meant to demonstrate generally the potential effects of artificial breeding sites on popu-lation trends when those artificial sites are either neutral, beneficial, or ecological traps. During all management simulations, we set dispersal to 0.58, the value observed for kestrels in Idaho (Steenhof and Peterson 2009b), and affinity to 1 (no preference between artificial and natural sites). Artificial sites were added in time step 20. We eval-uated the effectiveness of artificial sites in effecting popu-lation change by examining changes in population levels post- installation. We predicted that artificial breeding sites would be most beneficial when artificial sites resulted in higher vital rates compared to natural sites.
Affinity.—We also tested whether the affinity of animals towards artificial breeding sites would cause inference to differ from the example of the American Kestrel. To test the sensitivity of our conclusions to changes in affin-ity we ran simulations for monitoring and management while setting affinity either at 0.5, one, or two. For the management simulations we only ran simulations for the extreme effects of artificial sites, at the highest and lowest values in Fig. 1. To examine the effects of affinity on the occupancy lag we ran simulations with dispersal set to either one or zero. And, we ran simulations with the number of natural sites changing by either −10 or 10 sites per time step to determine the effects of affinity on monitoring of artificial sites.
results
Monitoring
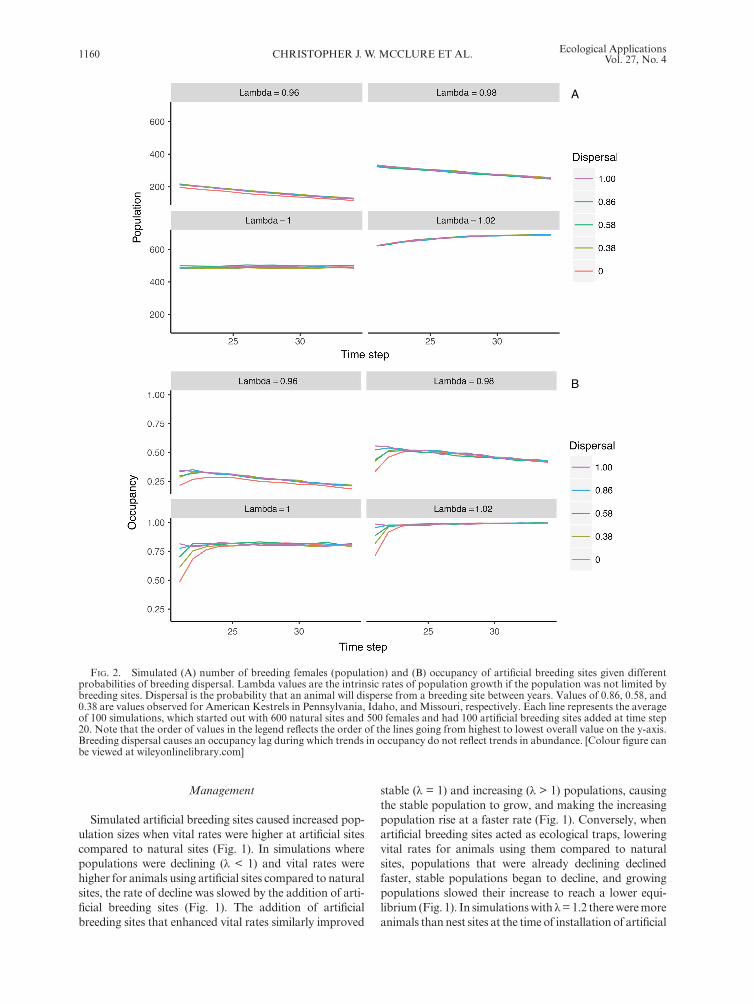
Regardless of whether a population was increasing, stable, or decreasing, occupancy of artificial breeding sites increased initially depending on the value of dispersal (Fig. 2). After this short increase (or lag) period, the occu-pancy of artificial sites began to track population levels. The duration of the lag period ranged from zero to five years when dispersal values were one and zero, respec-tively, with the values of dispersal observed for American Kestrels having intermediate lag durations (Fig. 2).
Simulations where unmonitored sites were systemati-cally added or removed revealed a striking contrast between the trends in population levels and occupancy of monitored sites (Fig. 3). For populations with λ < 1, the removal of natural sites generally lessened the slope of decline in occu-pancy of artificial sites. And, the removal of unmonitored sites for populations that would otherwise be stable or increasing if not for a loss of breeding sites (λ ≥ 1) resulted in increasing rates of occupancy of monitored sites as total size of the population declined. Conversely, addition of unmonitored sites resulted in a steepening decline in occu-pancy of monitored sites for populations with λ < 1 and decreasing occupancy of artificial sites for stable popula-tions. Populations with λ > 1 to which unmonitored sites were added grew the fastest, but showed the slowest rate of increase in occupancy of unmonitored sites.
Fig. 1. Simulated effects of the installation of artificial breeding sites with different rates of survival and fecundity for a virtual population of American Kestrels. The y- axis is the number of breeding females (population). Lambda values are the intrinsic rates of population growth if the population was not limited by breeding sites. Each line represents the average of 100 simulations, which started with 600 natural sites and 500 females and had 100 artificial breeding sites added at time step 20. Survival refers to adult survival. Values of survival and fecundity in the legend only represent values for females using artificial sites. Sn is the value of survival for females using natural sites. Fecundity at natural sites was set to 1.60 for each value of lambda. Dispersal probability was set to 0.58 for all simulations. Note that the order of values in the legend reflects the order of the lines going from highest to lowest overall value on the y-axis. Installation of artificial sites with high levels of survival and fecundity increase population size, whereas installation of sites with low levels of vital rates leads to declines in population size. [Colour figure can be viewed at wileyonlinelibrary.com]
Lambda = 1.00, Sn = 0.40 Lambda = 1.02, Sn = 0.42
Lambda = 0.96, Sn = 0.36 Lambda = 0.98, Sn = 0.38
0 10 20 30 40 50 0 10 20 30 40 50
200
400
600
200
400
600
Time step
Popu
latio
nSurvival,fecundity inartificial sites
0.46, 1.90
0.43, 1.15
0.40, 1.60
0.37, 1.45
0.34, 1.30
1160 Ecological Applications Vol. 27, No. 4CHRISTOPHER J. W. MCCLURE ET AL.
Management
Simulated artificial breeding sites caused increased pop-ulation sizes when vital rates were higher at artificial sites compared to natural sites (Fig. 1). In simulations where populations were declining (λ < 1) and vital rates were higher for animals using artificial sites compared to natural sites, the rate of decline was slowed by the addition of arti-ficial breeding sites (Fig. 1). The addition of artificial breeding sites that enhanced vital rates similarly improved
stable (λ = 1) and increasing (λ > 1) populations, causing the stable population to grow, and making the increasing population rise at a faster rate (Fig. 1). Conversely, when artificial breeding sites acted as ecological traps, lowering vital rates for animals using them compared to natural sites, populations that were already declining declined faster, stable populations began to decline, and growing populations slowed their increase to reach a lower equi-librium (Fig. 1). In simulations with λ = 1.2 there were more animals than nest sites at the time of installation of artificial
Fig. 2. Simulated (A) number of breeding females (population) and (B) occupancy of artificial breeding sites given different probabilities of breeding dispersal. Lambda values are the intrinsic rates of population growth if the population was not limited by breeding sites. Dispersal is the probability that an animal will disperse from a breeding site between years. Values of 0.86, 0.58, and 0.38 are values observed for American Kestrels in Pennsylvania, Idaho, and Missouri, respectively. Each line represents the average of 100 simulations, which started out with 600 natural sites and 500 females and had 100 artificial breeding sites added at time step 20. Note that the order of values in the legend reflects the order of the lines going from highest to lowest overall value on the y-axis. Breeding dispersal causes an occupancy lag during which trends in occupancy do not reflect trends in abundance. [Colour figure can be viewed at wileyonlinelibrary.com]

POWER AND PERIL OF ARTIFICIAL SITESJune 2017 1161
sites, thus additional breeding sites, even those with lower vital rates, increased population sizes (Figs. 1 and 2).
The general patterns apparent in the example of the American Kestrel also were apparent in hypothetical r- and K- selected species (Appendix S1) indicating that our results are robust across a range of life- histories. Further, the affinity of the animals towards artificial sites did not drastically affect the overall effects of man-agement but served to either lessen or enhance the effects of artificial sites, depending on the propensity of animals to use them (Appendix S2). Affinity also did not greatly
alter inference into monitoring populations using arti-ficial breeding sites, affecting the length of the occupancy lag while generating the same misleading patterns of occupancy of artificial sites that were apparent in the example of the American Kestrel (Appendix S2).
disCussion
Our simulations reveal that the utility of artificial breeding sites for monitoring and managing animals can vary greatly depending on the demography and behavior
Fig. 3. Simulated (A) number of breeding females (population) and (B) concurrent occupancy of monitored breeding sites given certain rates of change in unmonitored breeding sites per time step (SiteChangeRate). Lambda values are the intrinsic rates of population growth if the population was not limited by breeding sites. The number of monitored sites remained constant for all simulations (n = 100) and each simulation began with 600 unmonitored sites. Each line represents the average of 100 simulations that begin with 500 females. Note that the order of values in the legend reflects the order of the lines going from highest to lowest overall value on the y-axis. Dispersal probability was set to 0.58 for all simulations. Systematic changes in availability of unmonitored sites biases trends in occupancy of monitored sites. [Colour figure can be viewed at wileyonlinelibrary.com]

1162 Ecological Applications Vol. 27, No. 4CHRISTOPHER J. W. MCCLURE ET AL.
of the target population and changes in numbers of available unmonitored sites. We chose the example of the American Kestrel to demonstrate these broad ecological patterns because it is relatively well- studied, of conser-vation concern, and demonstrates many of the lessons learned from our simulations. For example, even though several populations of American Kestrels were demon-strated to be limited by nest sites (Nagy 1963, Hamerstrom et al. 1973, Stahlecker and Griese 1979, Bloom and Hawks 1983, Wilmers 1983, Toland and Elder 1987, Smallwood and Collopy 2009), observed population declines for American Kestrels are not likely owing to a loss of nest sites because many programs that monitor artificial sites are reporting declining occupancy for American Kestrels (Smallwood et al. 2009a). Our moni-toring simulations demonstrate that a decline in the occu-pancy of artificial sites indicates that a population is declining because vital rates are likely too low to maintain the population (λ < 1), not that nest sites are limiting. In this case, addition of artificial nest sites is unlikely to mit-igate the effect of threats that are decreasing survival or fecundity.
One of our most salient findings is that if a population is declining because of a loss of unmonitored breeding sites, occupancy of monitored sites should increase, i.e., as unmonitored sites are lost, demand for the monitored sites will increase (Fig. 3). Our conclusion assumes that the number of monitored sites remains relatively con-stant while the number of unmonitored sites systemati-cally changes. This phenomenon of increased occupancy of monitored sites because of a loss of unmonitored sites is supported by studies comparing occupancy of moni-tored sites in areas either lacking or containing abundant unmonitored sites. For example, Smith and Agnew (2002) speculated that artificial hollows in intact forest, compared to those in fragmented landscapes, had lower occupancy of bats and arboreal marsupials in Queensland, Australia because more unmonitored natural sites were available in intact forest. And, artificial site use by cavity- nesting birds in New Brunswick, Canada was higher in logged vs. unlogged forests because of a likely difference in available unmonitored natural sites (Woodley et al. 2006).
Our simulations also demonstrate the converse effect: addition of unmonitored breeding sites can induce declining trends in occupancy of sites being monitored. A potential scenario of an increase in available unmoni-tored sites is private citizens erecting artificial breeding sites within or near established study sites. Artificial breeding sites, nest boxes, in particular, are popular among the general public (e.g., Jackson and Tate 1974, Zeleny 1978, Cooper et al. 2006) and therefore might be erected without regard for established programs or on lands inaccessible for monitoring. Indeed, the decline of the American Kestrel has prompted many citizen scien-tists to install nest boxes, sometimes within established long- term kestrel study sites (C. J. W. McClure, personal observation). Professional biologists and managers of
citizen science programs should therefore work together to ensure that the creation of unmonitored breeding sites does not interfere with trends in occupancy of established monitoring programs.
Another potential pitfall when using artificial breeding sites to monitor animals is interpreting an occupancy lag as an increase in the breeding population. Our simulations show that breeding site fidelity can cause an initial increase in the occupancy of newly installed artificial breeding sites owing to the fact that animals must overcome their reluc-tance to leave their previous natural sites. Because occu-pancy of artificial sites starts at zero, occupancy of artificial sites will rise until it reaches equilibrium with the natural sites. Once this equilibrium is reached, occupancy of artificial sites will be a valid index of population levels, barring any systematic changes in availability of unmoni-tored sites (Fig. 2). The shape of the occupancy lag is determined by the probability of dispersal (Fig. 2), the rate of decline of the population (Fig. 2), the life- history of the species (Appendix S1), and affinity for artificial sites (Appendix S2). Yet, given any propensity to remain at the same breeding site, one can expect some lag in occupancy. Our simulated animals had perfect knowledge of the sites available to them. Incorporating dispersal distances or the time it takes for animals to find sites would likely extend the occupancy lag.
Several empirical studies present evidence for an lag in occupancy (e.g., Jackson and Tate 1974, Lindenmayer et al. 2009, Smallwood et al. 2009a, b). For example, Jackson and Tate (1974) speculated that site fidelity caused occupancy of artificial sites erected for Purple Martins (Progne subis) to be lower in the first year than in subsequent years. And Lindenmayer et al. (2009) noted that occupancy patterns of arboreal marsupials in Victoria, Australia in artificial sites reached typical occu-pancy levels 2–3 years after installation. Smallwood et al. (2009a) demonstrated that occupancy of programs mon-itoring artificial sites for American Kestrels across North America showed a pattern of an initial 2–8 years increase followed by a decline. Our simulations of American Kestrel populations suggest that these initial increases were likely an occupancy lag. Indeed, the pattern iden-tified by Smallwood et al. (2009a) of an initial increase in occupancy followed by a decline is typical for artificial nest sites provided to a population that is declining because vital rates are too low (λ < 1).
Another important pattern emerging from our simula-tions (Fig. 1) is that artificial breeding sites will only improve population levels if either breeding sites are lim-iting, or if the provision of artificial sites improves vital rates. The myriad studies indicating increases in popu-lation levels of birds after artificial breeding sites were installed (reviewed by Newton 1994, 1998) demonstrate that many populations are in such a demographic situ-ation as to be benefitted by artificial breeding sites. However, because loss of nest sites is probably not driving the declines of most populations of American Kestrels, the installation of artificial sites should only benefit those

POWER AND PERIL OF ARTIFICIAL SITESJune 2017 1163
populations if artificial sites improve either survival or reproduction. The few studies comparing reproductive success of American Kestrels in natural vs. artificial sites (Craig and Trost 1979, Toland and Elder 1987) indicate that the two substrates are similar regarding the nest success of the inhabitants. Studies should examine differ-ences in breeding success between natural and human- made substrates and investigate methods to improve success within artificial sites.
Managers also should consider the possibility that arti-ficial breeding sites might lower population levels. Our simulations show that even if animals prefer natural sites over artificial ones, installing artificial sites that lower the vital rates of occupants can decrease the population (Appendix S2). Poor placement of artificial sites can cause ecological traps. For example, Strasser and Heath (2013) found that nest failure of American Kestrels increased as artificial sites were exposed to higher levels of nearby traffic, presumably because of noise. Managers therefore should not assume that provisioning artificial breeding sites is beneficial without carefully considering whether they might decrease the reproductive rate of the population. Researchers might also consider further comparisons of vital rates of animals using artificial vs. natural sites (Lambrechts et al. 2010). And, educational and citizen science programs should endeavor to inform the general public about the proper placement and main-tenance of artificial sites, particularly nest boxes.
Although we simulated breeding sites that limit occu-pancy to one female or breeding pair, our results can also inform restoration efforts where entire patches of habitat are created. For example, the restoration of a sandbar would only serve to enhance a population if sandbar habitat was limiting or if restoration serves to increase vital rates, perhaps because the sandbar is excellent habitat or because restoration alleviates density dependence. Future studies should therefore examine the creation of areas that serve multiple individuals, which might require incorporation of density dependent effects in addition to site limitation.
We performed supplemental simulations to demon-strate that our conclusions are robust regarding the life history of focal species and affinity for artificial or natural sites (Appendices S1 and S2). Our results also are robust to other assumptions regarding the quality and spacing of breeding sites. It is well known that both artificial and natural breeding sites can vary in quality (e.g., Rodenhouse et al. 1997, Newton 1998, Katzner et al. 2005). Although, our model allows the user to define the difference in quality of artificial vs. natural sites, it is assumed that there is no difference between sites of the same type, an assumption unlikely to hold in the wild. We chose this simplification because adding variation between individual sites would complicate the model without helping to answer our focal questions. Creating a distribution of vital rates by sites would allow for dif-ferences in site quality. However, this added complexity would only increase the variance around our mean
results, but the general trends we present would be unchanged. We further assume that differences in quality between artificial and natural sites are manifested in dif-ferences in survival and reproduction because these are the mechanisms through which differences between types of sites would cause differences in the growth rates of populations.
The spatial arrangement of artificial breeding sites can affect their use because territorial individuals can prevent the occupancy of nearby sites (e.g., Muldal et al. 1985). Our model assumes that all unoccupied sites are available for use. Any territoriality involved in our model therefore only operates at the level of the breeding site. The spatial arrangement of sites thus does not affect inference because it is impossible for more than one site to fall within the “territory” of a given individual and all sites are con-sidered within the dispersal range of all individuals. A model could be built to examine the optimal spatial arrangement of artificial sites, given a certain territory size and dispersal distance: certainly a worthy endeavor, but beyond the scope of this study. We also simplified our management simulations by adding artificial sites in a single time step instead of implementing them over time. Adding artificial breeding sites progressively over time, as many programs do, would not change inference for our management scenarios, but would make the slopes of the lines in Fig. 1 gradually increase (or decrease) over time until they reach their presented values.
Our simulations show that the creation of human- made breeding sites is not a panacea for monitoring and man-aging animals, but can be a powerful tool given the right situation. Managers should consider the reasons for a population decline before deciding whether to install arti-ficial breeding sites. And, use of trends in the occupancy of artificial breeding sites as an index of population trends should be interpreted in light of the availability of other sites. The efficacy of any management option rests on the demography of the target population and the use of arti-ficial breeding sites is no exception.
aCknoWledgMents
This project was supported by the National Science Foundation (NSF, award DEB- 114552), the NSF Idaho EPSCoR Program (award number IIA- 1301792), the Raptor Research Center, and Department of Biological Sciences at Boise State University. We also thank Judith King and Lynn and Jack Loacker for funding. We thank the library staff at The Peregrine Fund for help in obtaining literature. We thank W. G. Hunt for help in developing ideas. We also thank two anony-mous reviewers for helpful comments on earlier versions of this manuscript.
literature Cited
Abadi, F., O. Gimenez, B. Ullrich, R. Arlettaz, and M. Schaub. 2010. Estimation of immigration rate using integrated popu-lation models. Journal of Applied Ecology 47:393–400.
Björklund, H., J. Valkama, P. Saurola, and T. Laaksonen. 2013. Evaluation of artificial nests as a conservation tool for three forest- dwelling raptors. Animal Conservation 16:546–555.

1164 Ecological Applications Vol. 27, No. 4CHRISTOPHER J. W. MCCLURE ET AL.
Bloom, P. H., and S. J. Hawks. 1983. Nest box use and repro-ductive biology of the American Kestrel in Lassen County, California. Journal of Raptor Research 17:9–14.
Bolgiano, N., J.-F. Therrien, and G. Grove. 2015. Pennsylvania’s importance to American Kestrels. Pennsylvania Birds 29:76–83.
Bortolotti, G. R., R. D. Dawson, and G. L. Murza. 2002. Stress during feather development predicts fitness potential. Journal of Animal Ecology 71:333–342.
Botelho, E. S., and P. C. Arrowood. 1998. The effect of burrow site use on the reproductive success of a partially migratory population of Western Burrowing Owls (Speotyto cunicularia hypugaea). Journal of Raptor Research 32:233–240.
Both, C., S. Bouwhuis, C. M. Lessells, and M. E. Visser. 2006. Climate change and population declines in a long- distance migratory bird. Nature 441:81–83.
Bouckaert, E. K., N. A. Auer, E. F. Roseman, and J. Boase. 2014. Verifying success of artificial spawning reefs in the St. Clair–Detroit River system for lake sturgeon (Acipenser fulvescens Rafinesque, 1817). Journal of Applied Ichthyology 30:1393–1401.
Brown, J. L., and M. W. Collopy. 2008. Nest- site character-istics affect daily nest- survival rates of Northern Aplomado Falcons (Falco femoralis septentrionalis). Auk 125: 105–112.
Brown, J. L., and M. W. Collopy. 2013. Immigration stabilizes a population of threatened cavity- nesting raptors despite pos-sibility of nest box imprinting. Journal of Avian Biology 44:141–148.
Brown, J. L., M. W. Collopy, and J. A. Smallwood. 2014. Habitat fragmentation reduces occupancy of nest boxes by an open- country raptor. Bird Conservation International 24:364–378.
Cade, T. J. 1982. The falcons of the world. Cornell University Press, Ithaca, New York, USA.
Cade, T. J., and S. A. Temple. 1995. Management of threatened bird species: Evaluation of the hands- on approach. Ibis 137:S161–S172.
Caswell, H. 2001. Matrix population models. Second edition. Sinauer Associates, Sunderland, Massachusetts, USA.
Catry, I., R. Alcazar, A. M. A. Franco, and W. J. Sutherland. 2009. Identifying the effectiveness and constraints of conser-vation interventions: A case study of the endangered lesser kestrel. Biological Conservation 142:2782–2791.
Cooper, C. B., W. M. Hochachka, T. B. Phillips, and A. A. Dhondt. 2006. Geographical and seasonal gradients in hatch-ing failure in Eastern Bluebirds Sialia sialis reinforce clutch size trends. Ibis 148:221–230.
Craig, T. H., and C. H. Trost. 1979. The biology and nesting density of breeding American Kestrels and Long- eared Owls on the Big Lost River, southeastern Idaho. Wilson Bulletin 91:50–61.
D’Amico, M., Z. Tablado, E. Revilla, and F. Palomares. 2014. Free housing for declining populations: Optimizing the provi-sion of artificial breeding structures. Journal for Nature Conservation 22:369–376.
Du Plessis, M. A. 1995. The effects of fuelwood removal on the diversity of some cavity- using birds and mammals in South Africa. Biological Conservation 74:77–82.
Farmer, C. J., and J. P. Smith. 2009. Migration monitoring indicates widespread declines of American Kestrels (Falco sparverius) in North America. Journal of Raptor Research 43:263–273.
Farmer, C. J., L. J. Goodrich, E. R. Inzunza, and J. P. Smith. 2008. Conservation status of North America’s birds of prey. State of North America’s birds of prey. Series in Ornithology 3:303–420.
Fokidis, H. B., and T. S. Risch. 2005. The use of nest boxes to sample arboreal vertebrates. Southeastern Naturalist 43: 447–458.
Froke, J. B. 1983. The role of nestboxes in bird research and management. Pages 10–13 in J. W. Davis, G. W. Goodwin, and R. A. Ockenfels, tech. coords. Snag habitat management: proceedings of the symposium. U.S. For. Serv. Gen. Tech. Rep. RM-99.
Gauthier, G., and J. N. M. Smith. 1987. Territorial behaviour, nest- site availability, and breeding density in Buffleheads. Journal of Animal Ecology 56:171–184.
Gibbons, P., and D. B. Lindenmayer. 2002. Tree hollows and wildlife conservation in Australia. CSIRO Publishing, Melbourne, Victoria, Australia.
Grimm, V., U. Berger, F. Bastiansen, S. Eliassen, V. Ginot, J. Giske, J. Goss-Custard, T. Grand, S. K. Heinz, and G. Huse. 2006. A standard protocol for describing individual- based and agent- based models. Ecological Modelling 198: 115–126.
Grimm, V., U. Berger, D. L. Deangelis, J. G. Polhill, J. Giske, and S. F. Railsback. 2010. The ODD protocol: A review and first update. Ecological Modelling 221:2760–2768.
Grøtan, V., B. E. Sæther, S. Engen, J. H. Van Balen, A. C. Perdeck, and M. E. Visser. 2009. Spatial and temporal varia-tion in the relative contribution of density dependence, climate variation and migration to fluctuations in the size of great tit populations. Journal of Animal Ecology 78:447–459.
Hamerstrom, F., F. N. Hamerstrom, and J. Hart. 1973. Nest boxes: an effective management tool for kestrels. Journal of Wildlife Management 37:400–403.
Hayward, G. D., R. K. Steinhorst, and P. H. Hayward. 1992. Monitoring boreal owl populations with nest boxes: sam-ple size and cost. Journal of Wildlife Management 56: 777–785.
Hunt, W. G. 1998. Raptor floaters at Moffat’s equilibrium. Oikos 82:191–197.
Hunt, W. G., and P. R. Law. 2000. Site- dependent regulation of population size: Comment. Ecology 81:1162–1165.
Jackson, J. A., and J. Tate. 1974. An analysis of nest box use by purple martins, house sparrows, and starlings in eastern North America. Wilson Bulletin 86:435–449.
Katzner, T., S. Robertson, B. Robertson, J. Klucsarits, K. McCarty, and K. L. Bildstein. 2005. Results from a long- term nest- box program for American Kestrels: implications for improved population monitoring and conservation. Journal of Field Ornithology 76:217–226.
Klein, A., T. Nagy, T. Csoergo, and R. Matics. 2007. Exterior nest- boxes may negatively affect Barn Owl Tyto alba survival: an ecological trap. Bird Conservation International 17: 273–281.
Lambrechts, M. M., et al. 2010. The design of artificial nest-boxes for the study of secondary hole- nesting birds: a review of methodological inconsistencies and potential biases. Acta Ornithologica 45:1–26.
Libois, E., O. Gimenez, D. Oro, E. Mínguez, R. Pradel, and A. Sanz-Aguilar. 2012. Nest boxes: A successful management tool for the conservation of an endangered seabird. Biological Conservation 155:39–43.
Lindenmayer, D. B., A. Welsh, C. Donnelly, M. Crane, D. Michael, C. Macgregor, L. McBurney, R. Montague-Drake, and P. Gibbons. 2009. Are nest boxes a viable alter-native source of cavities for hollow- dependent animals? Long- term monitoring of nest box occupancy, pest use and attrition. Biological Conservation 142:33–42.
Mänd, R., V. Tilgar, and A. Lõhmus. 2005. Providing nest boxes for hole- nesting birds—Does habitat matter? Biodiversity and Conservation 14:1823–1840.

POWER AND PERIL OF ARTIFICIAL SITESJune 2017 1165
McClure, C. J. W., B. P. Pauli, B. Mutch, and P. Juergens. 2016. Assessing the importance of artificial nest sites for the popu-lation dynamics of endangered Northern Aplomado Falcons Falco femoralis septentrionalis in South Texas using stochastic simulation models. Ibis 159:14–25.
Moffat, C. 1903. The spring rivalry of birds: some views on the limit to multiplication. Irish Naturalist 12:152–166.
Møller, A. P. 1989. Parasites, predators and nest boxes: facts and artefacts in nest box studies of birds? Oikos 56: 421–423.
Muldal, A., H. L. Gibbs, and R. J. Robertson. 1985. Preferred nest spacing of an obligate cavity- nesting bird, the tree swal-low. Condor 87:356–363.
Nagy, A. C. 1963. Population density of sparrow hawks in east-ern Pennsylvania. Wilson Bulletin 75:93.
Nelson, N. J., S. N. Keall, D. Brown, and C. H. Daugherty. 2002. Establishing a new wild population of tuatara (Sphenodon guntheri). Conservation Biology 16:887–894.
Newton, I. 1994. The role of nest sites in limiting the numbers of hole- nesting birds: A review. Biological Conservation 70: 265–276.
Newton, I. 1998. Population limitation in birds. Academic Press, San Diego, California, USA.
Paprocki, N., J. A. Heath, and S. J. Novak. 2014. Regional distribution shifts help explain local changes in wintering raptor abundance: implications for interpreting population trends. PLoS ONE 9:e86814.
Penteriani, V., F. Otalora, and M. Ferrer. 2005a. Floater survival affects population persistence. The role of prey avail-ability and environmental stochasticity. Oikos 108:523–534.
Penteriani, V., F. Otalora, F. Sergio, and M. Ferrer. 2005b. Environmental stochasticity in dispersal areas can explain the “mysterious” disappearance of breeding populations. Proceedings of the Royal Society B 272:1265–1269.
Penteriani, V., F. Otalora, and M. Ferrer. 2006. Floater dyna-mics can explain positive patterns of density- dependent fecundity in animal populations. American Naturalist 168: 697–703.
Penteriani, V., F. Otalora, and M. Ferrer. 2008. Floater mortal-ity within settlement areas can explain the Allee effect in breeding populations. Ecological Modelling 213:98–104.
Penteriani, V., M. Ferrer, and M. M. Delgado. 2011. Floater strategies and dynamics in birds, and their importance in conservation biology: Towards an understanding of non-breeders in avian populations. Animal Conservation 14: 233–241.
Pomeroy, N. 1981. Use of natural sites and field hives by a long- tongued bumble bee Bombus ruderatus (Bombus terrestris). New Zealand Journal of Agricultural Research 24:409–414.
Pöysä, H., and S. Pöysä. 2002. Nest- site limitation and density dependence of reproductive output in the common goldeneye Bucephala clangula: implications for the management of cavity- nesting birds. Journal of Applied Ecology 39:502–510.
Rodenhouse, N. L., T. W. Sherry, and R. T. Holmes. 1997. Site- dependent regulation of population size: A new synthesis. Ecology 78:2025–2042.
Rohrbaugh, R. W., and R. H. Yahner. 1997. Effects of macro-habitat and microhabitat on nest- box use and nesting success of American Kestrels. Wilson Bulletin 109:410–423.
Sanz, V., A. Rodríguez-Ferraro, M. Albornoz, and C. Bertsch. 2003. Use of artificial nests by the Yellow- shouldered Parrot (Amazona barbadensis). Ornitologia Neotropical 14:345–351.
Sauer, J. R., J. E. Hines, J. E. Fallon, K. L. Pardieck, D. J. Ziolkowski, and W. A. Link. 2014. The North American breeding bird survey, results and analysis 1966–2012. Version 02.19.2014. USGS Patuxent Wildlife Research Center, Laurel, Maryland, USA.
Saurola, P. 2008. Monitoring birds of prey in Finland: a sum-mary of methods, trends, and statistical power. Ambio 37: 413–419.
Schaub, M., B. Ullrich, G. Knötzsch, P. Albrecht, and C. Meisser. 2006. Local population dynamics and the impact of scale and isolation: A study on different little owl popula-tions. Oikos 115:389–400.
Schlaepfer, M. A., M. C. Runge, and P. W. Sherman. 2002. Ecological and evolutionary traps. Trends in Ecology and Evolution 17:474–480.
Selonen, V., R. Varjonen, and E. Korpimäki. 2014. Immediate or lagged responses of a red squirrel population to pulsed resources. Oecologia 177:401–411.
Shutler, D., et al. 2012. Spatiotemporal patterns in nest box occupancy by Tree Swallows across North America. Avian Conservation and Ecology 7:3.
Smallwood, J. A., and D. M. Bird. 2002. American Kestrel (Falco sparverius) in A. Poole, editor. The birds of North America online. CHAP, Cornell Lab of Ornithology, Ithaca, New York, USA. https://doi.org/10.2173/bna.602
Smallwood, J. A., and M. W. Collopy. 2009. Southeastern American Kestrels respond to an increase in the availability of nest cavities in north- central Florida. Journal of Raptor Research 43:291–300.
Smallwood, J. A., M. F. Causey, D. H. Mossop, J. R. Klucsarits, B. Robertson, S. Robertson, J. Mason, M. J. Maurer, R. J. Melvin, and R. D. Dawson. 2009a. Why are American Kestrel (Falco sparverius) populations declining in North America? Evidence from nest- box programs. Journal of Raptor Research 43:274–282.
Smallwood, J. A., P. Winkler, G. I. Fowles, and M. A. Craddock. 2009b. American Kestrel breeding habitat: the importance of patch size. Journal of Raptor Research 43:308–314.
Smith, G. C., and G. Agnew. 2002. The value of “bat boxes” for attracting hollow- dependent fauna to farm forestry planta-tions in southeast Queensland. Ecological Management and Restoration 3:37–46.
Stahlecker, D. W., and H. J. Griese. 1979. Raptor use of nest boxes and platforms on transmission towers. Wildlife Society Bulletin 7:59–62.
Steenhof, K., and B. E. Peterson. 2009a. American kestrel reproduction in southwestern Idaho: annual variation and long- term trends. Journal of Raptor Research 43: 283–290.
Steenhof, K., and B. E. Peterson. 2009b. Site fidelity, mate fidel-ity, and breeding dispersal in American Kestrels. Wilson Journal of Ornithology 121:12–21.
Strasser, E. H., and J. A. Heath. 2013. Reproductive failure of a human- tolerant species, the American kestrel, is associated with stress and human disturbance. Journal of Applied Ecology 50:912–919.
Sullivan, B. L., and C. L. Wood. 2005. The changing seasons: a plea for the common birds. North American Birds 59: 18–30.
Toland, B. R., and W. H. Elder. 1987. Influence of nest- box placement and density on abundance and productivity of American Kestrels in central Missouri. Wilson Bulletin 99:712–717.
VanCamp, L. F., and C. J. Henny. 1975. The screech owl: its life history and population ecology in Northern Ohio. North American Fauna 71:1–65.
Waters, J. R., B. R. Noon, and J. Verner. 1990. Lack of nest site limitation in a cavity- nesting bird community. Journal of Wildlife Management 54:239–245.
Wiebe, K. L. 2011. Nest sites as limiting resources for cavity- nesting birds in mature forest ecosystems: A review of the evidence. Journal of Field Ornithology 82:239–248.

1166 Ecological Applications Vol. 27, No. 4CHRISTOPHER J. W. MCCLURE ET AL.
Wilensky, U. 1999. NetLogo. Center for Connected Learning and Computer-Based Modeling, Northwestern University, Evanston, Illinois.
Wilmers, T. J. 1983. Kestrel use of nest boxes on reclaimed surface mines in West Virginia and Pennsylvania. Journal of Raptor Research 17:30–31.
Woodley, S. J., G. Johnson, B. Freedman, and D. A. Kirk. 2006. Effects of timber harvesting and plantation develop-ment on cavity- nesting birds in New Brunswick. Canadian Field Naturalist 120:298–306.
Zeleny, L. 1978. The bluebird. University of Indiana Press, Bloomington, Indiana, USA.
supporting inForMation
Additional supporting information may be found in the online version of this article at http://onlinelibrary.wiley.com/doi/10.1002/eap.1509/full
data aCCessiBility
The SITES model is uploaded as Data S1.