simulations of particulate flows … flow solution based on the code cfx was crucial for studying...
TRANSCRIPT
1
SIMULATIONS OF PARTICULATE FLOWS THROUGH A RADIAL GAS TURBINE
Adel Ghenaiet
Faculty of Mechanical Engineering, University of Sciences and Technology, USTHB, BP32 El-Alia, Bab Ezzouar, 16111, Algiers, Algeria, Email: [email protected]
ABSTRACT Radial gas turbines are often exposed to erosion damage by particulate laden gas flows.
This paper presents a numerical study of fly-ash particle trajectory and erosion through a
radial turbine, based on a Lagrangian tracking code which considers particle concentration
and size distribution, particle shape and fragmentation in addition to the turbulence and near
wall effects as well as the stator/rotor relative positions. The obtained results indicate that the
small size particles travel easily through the rotor, whereas the large ones only cross a small
part around the rotor inlet and are centrifuged back. As the locations of impacts are
predicted, erosion contours are evaluated and blade deterioration assessed. High erosion rates
are observed over blade suction side due to high number of particles consistently impacting
this small area, owing to high inward forces and direction of flow. The blade tip and exducer
exhibit erosion by small particles traversing from pressure side and due to high
centrifugation. The casing is eroded towards the exducer and the hub near the entry.
NOMENCLATURE Ae Area of a surface element ai , bi polynomial constants in rebound factors CD Drag coefficient CL Lift coefficient d Diameter en Normal restitution factor e Tangential restitution factor q Equivalent erosion rate (mg/g/mm2) FD Drag force g Gravity m Mass r Radius, radial co-ordinate Re Reynolds number t Time te Eddy lifetime tr Transit time tint Interaction time T Temperature Vf
Vp
Fluid velocity Particle velocity
z Axial co-ordinate
Greek letters Impact angle (degree) Erosion rate (mg/g) Dynamic viscosity (kg/m.s) Density (kg/m3) Speed of rotation (rd/s) Tangential co-ordinate
0BSubscript 1B
f i n p r z 1, 2
Fluid Impact Normal Particle Radial Tangential Axial At impact and rebound
Proceedings of
11th European Conference on Turbomachinery Fluid dynamics & Thermodynamics
ETC11, March 23-27, 2015, Madrid, Spain
OPEN ACCESS
Downloaded from www.euroturbo.eu Copyright © by the Authors
2
INTRODUCTION In auxiliary power units and turbochargers, the ingestion of sand particle or fly ash produced
during combustion provoke erosive action, resulting in a serious problem detrimental to the reliability, performance and structural integrity of radial gas turbines components. Erosion due to entrained particles had been experimentally investigated over the past decades since the report by Truscott [1]. Hussein and Tabakoff [2] were first to use particle trajectory simulations through axial machinery using experimental particle restitution factors. Later, Elfeki and Tabakoff [3] presented results for particle trajectories and erosion in a supercharger compressor impeller, which owing to flow nature and direction of centrifugal force were consistently different from those in axial machinery. Tabakoff et al. [4] have compared the computed particle trajectories through a two-stage turbine and the associated blade erosion by fly-ash, indicating non-uniform particle impacts spreading over most blade surfaces. Ghenaiet [5] showed that for a two-stage axial turbine the whole of vanes pressure surfaces were impacted with extreme erosion seen beyond the throat, and there were significant variations in particles paths towards the rotors blades. According to Tabakoff and Hamed [6], much higher erosion rates are observed in radial turbines by particles consistently impacting same area and indicated that the highest erosion rate was at the rotor pressure surface near the outer corner at exit. Ghenaiet [7] simulated trajectories of sand particle through a small radial turbine and showed that small particles travel easily through the rotor, whereas large ones are centrifuged back from rotor, and the maximum erosion is observed on the fore part of blade suction side and the pressure side towards exducer. The development of erosion prediction models used in turbomachinery began with the experiments carried out by Grant and Tabakoff [8]. Later, a hot erosion tunnel was developed by Wakeman and Tabakoff [9] for testing the turbine blade erosion taking place at elevated temperatures. Tabakoff and Hamed [6] performed a series of experiments in a high temperature erosion wind tunnel and found that under hot flow conditions the target surface was subjected to more than double the erosion encountered under cold condition. Further preoccupation into this old problem coincides with the diverse usage of turbomachinery and increased cost of maintenance, and therefore it is of great concern to use numerical tools, because experiments are generally very expensive and laborious. However, particle trajectories and erosion predictions are still a very complex task because of many factors involved. Indeed, the modelling of the various aspects associated with particle laden flows in turbomachinery still pose challenges, owing to the tracking of large number of particles, multiple impacts and rebound uncertainties, particle size, shape and fragmentation, and many other factors such as flow behaviour, geometry complexity and relative positions of blades.
The present study concerns the particle trajectories and induced erosion by fly-ash through a small radial gas turbine, focusing on the effect of relative circumferential position between the rotor blade and the vaneless nozzle. The flow solution based on the code CFX was crucial for studying the particle dynamics. The particle trajectory and erosion computations used our in-house Lagrangian finite element tracking code [5, 10-12], which has been improved to tackle multi-stages turbomachinery with different numbers of blades and the effect of rotor/stator initial positions when particles exit from one blade row to another. The number of seeded particles, sizes and initial positions were determined according to the ash particle size distribution (0-165 micron) and the specified concentration. As the locations of impacts were predicted, a semi empirical erosion correlation for steel alloy allowed estimating erosion rates. The results reveal that the direction of inward forces, flow nature and particle size strongly affect the particle dynamics through this kind of turbomachinery.
GAS PATH COMPUTATION This small radial gas turbine used on a test bench operates at a maximum speed of 90000 rpm
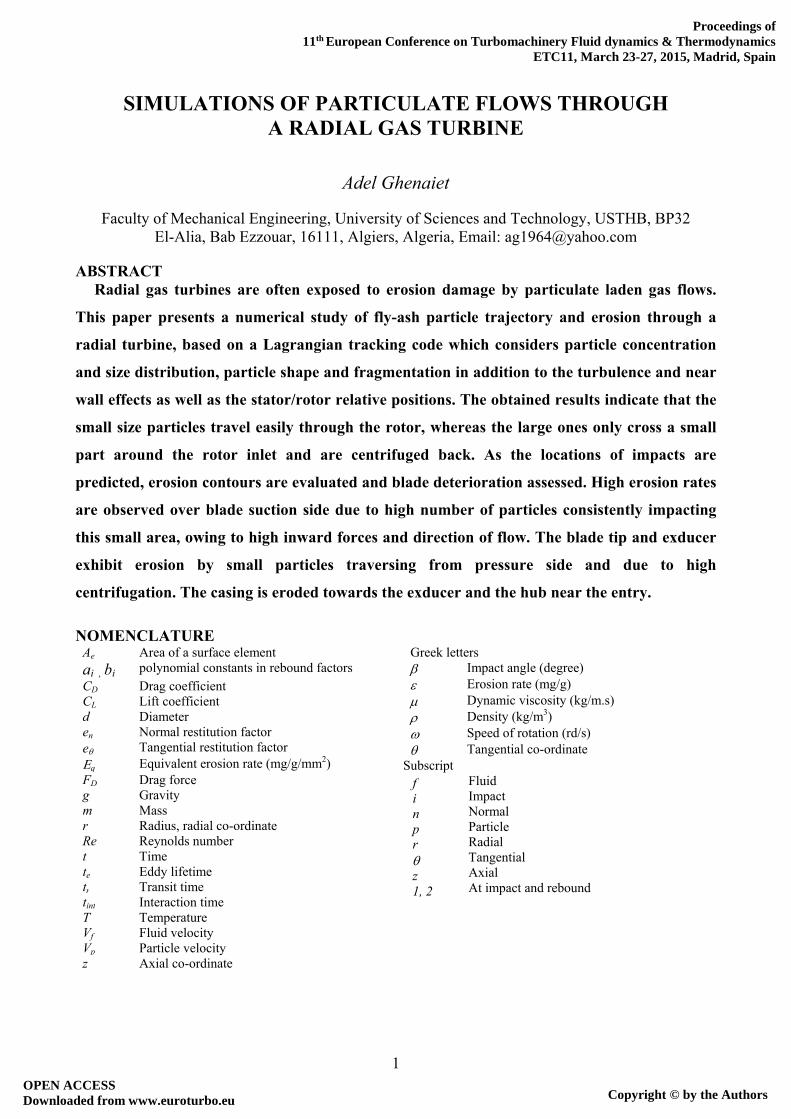
and a mass flow rate of 0.151 kg/s, and inlet total pressure and temperature of 2.13 bar and 750°C. This model of a radial turbine (Fig. 1) has 10 blades made from a resistant steel alloy (GMR 235) Nickel and 5% Cromium which is basically used in turbines of turbochargers of diesel engines. The
3
geometry of the rotor (Fig.1) was obtained by means of a trioptic machine. The main data are: external and internal diameter of rotor at inlet equal respectively to 54.6mm and 14.2 mm, and an outlet diameter of 72.3 mm and a blade thickness of 1 mm. The vaneless inlet diameter is 88 mm and its height is 7.1 mm.
Figure 1. Rotor and its CAD view
Figure 3: computational grids
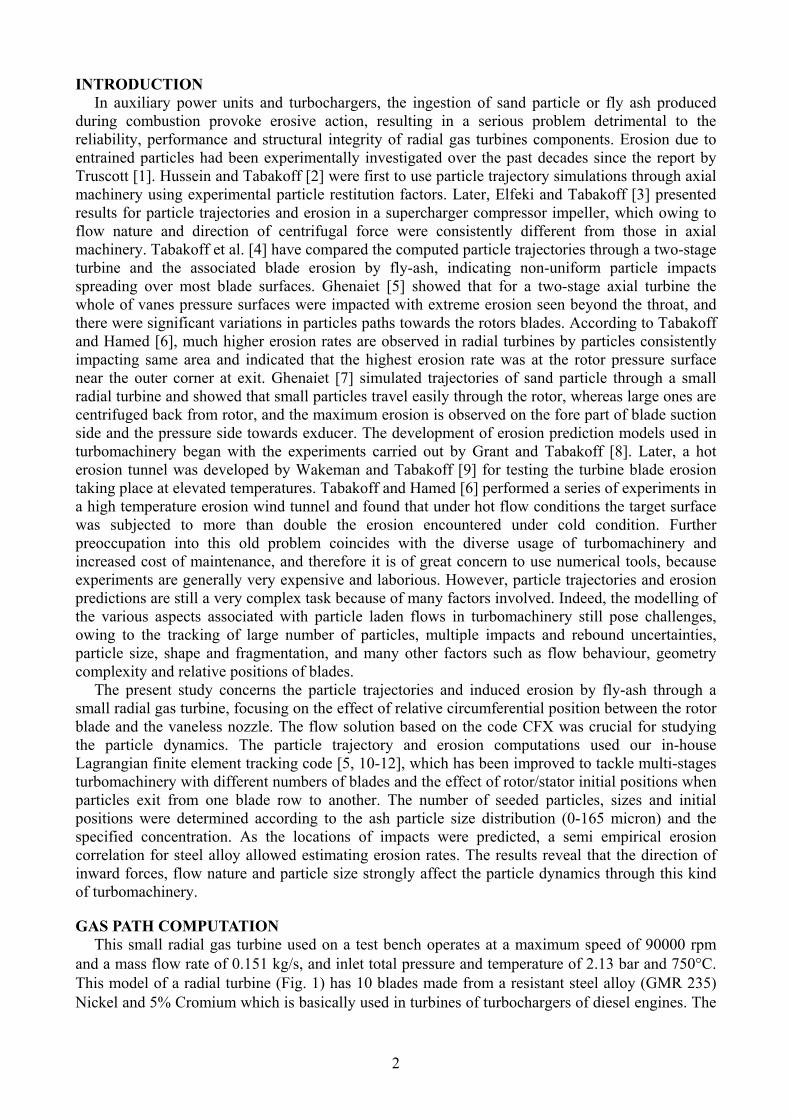
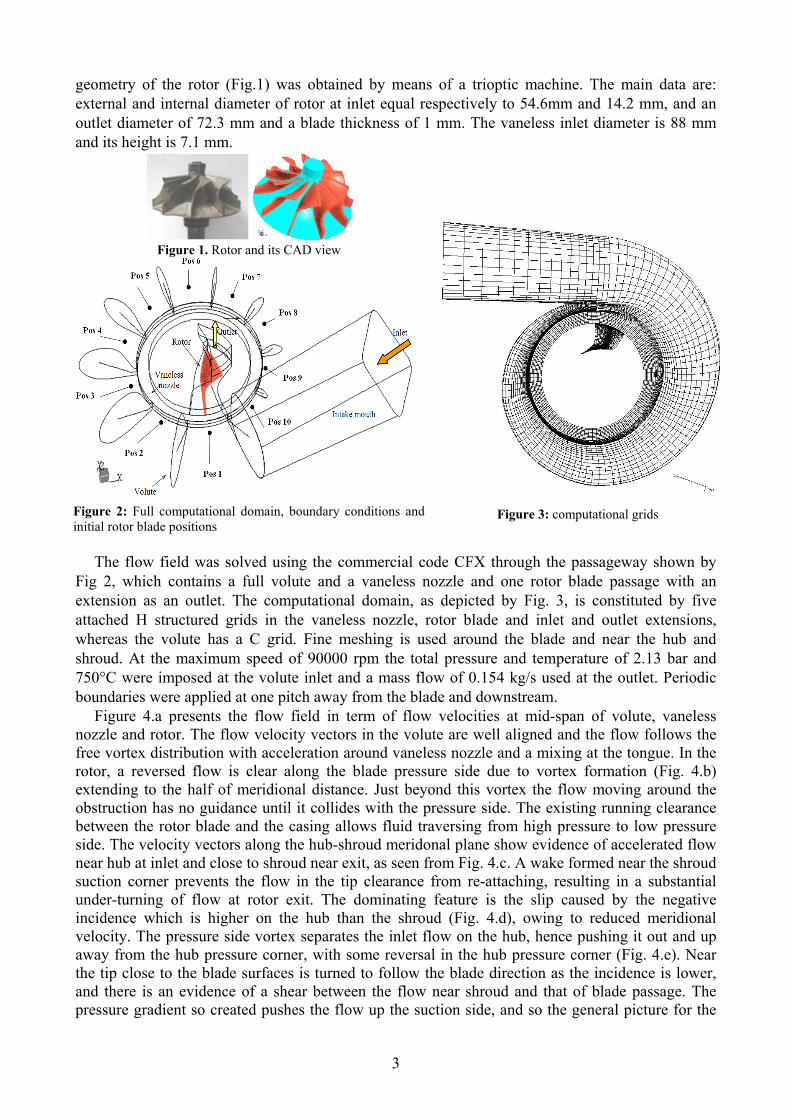
Figure 2: Full computational domain, boundary conditions and initial rotor blade positions
The flow field was solved using the commercial code CFX through the passageway shown by
Fig 2, which contains a full volute and a vaneless nozzle and one rotor blade passage with an extension as an outlet. The computational domain, as depicted by Fig. 3, is constituted by five attached H structured grids in the vaneless nozzle, rotor blade and inlet and outlet extensions, whereas the volute has a C grid. Fine meshing is used around the blade and near the hub and shroud. At the maximum speed of 90000 rpm the total pressure and temperature of 2.13 bar and 750°C were imposed at the volute inlet and a mass flow of 0.154 kg/s used at the outlet. Periodic boundaries were applied at one pitch away from the blade and downstream.
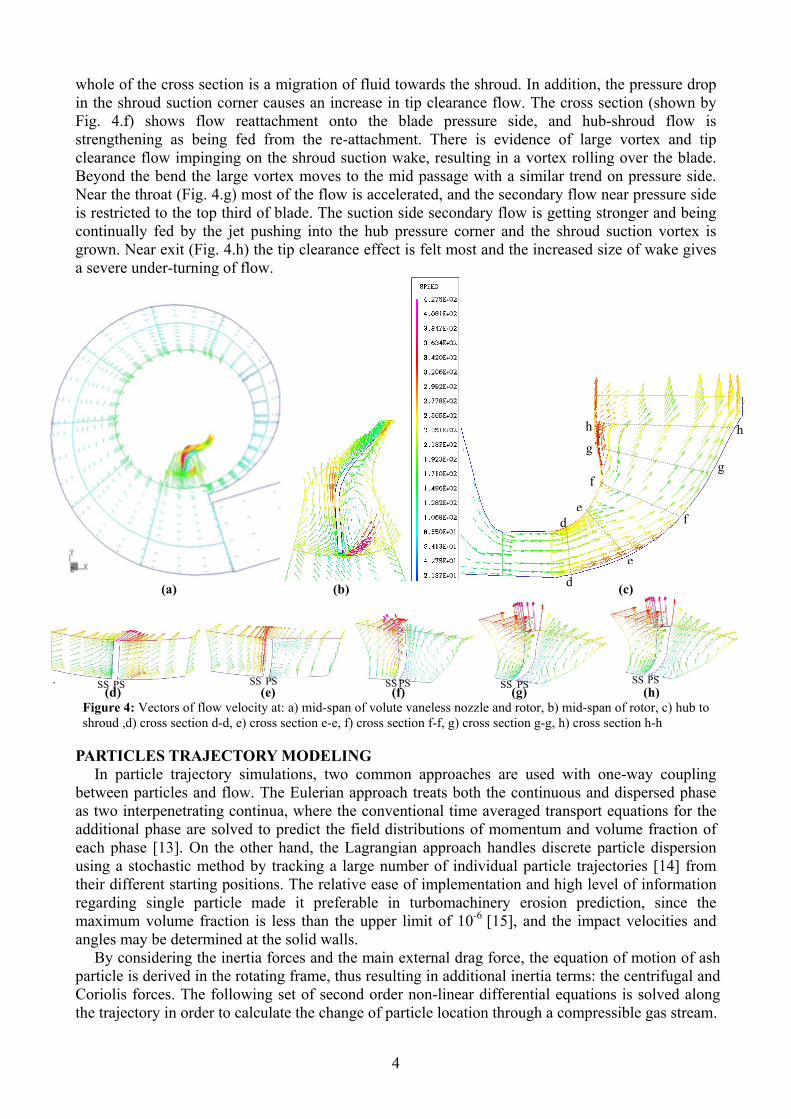
Figure 4.a presents the flow field in term of flow velocities at mid-span of volute, vaneless nozzle and rotor. The flow velocity vectors in the volute are well aligned and the flow follows the free vortex distribution with acceleration around vaneless nozzle and a mixing at the tongue. In the rotor, a reversed flow is clear along the blade pressure side due to vortex formation (Fig. 4.b) extending to the half of meridional distance. Just beyond this vortex the flow moving around the obstruction has no guidance until it collides with the pressure side. The existing running clearance between the rotor blade and the casing allows fluid traversing from high pressure to low pressure side. The velocity vectors along the hub-shroud meridonal plane show evidence of accelerated flow near hub at inlet and close to shroud near exit, as seen from Fig. 4.c. A wake formed near the shroud suction corner prevents the flow in the tip clearance from re-attaching, resulting in a substantial under-turning of flow at rotor exit. The dominating feature is the slip caused by the negative incidence which is higher on the hub than the shroud (Fig. 4.d), owing to reduced meridional velocity. The pressure side vortex separates the inlet flow on the hub, hence pushing it out and up away from the hub pressure corner, with some reversal in the hub pressure corner (Fig. 4.e). Near the tip close to the blade surfaces is turned to follow the blade direction as the incidence is lower, and there is an evidence of a shear between the flow near shroud and that of blade passage. The pressure gradient so created pushes the flow up the suction side, and so the general picture for the
4
whole of the cross section is a migration of fluid towards the shroud. In addition, the pressure drop in the shroud suction corner causes an increase in tip clearance flow. The cross section (shown by Fig. 4.f) shows flow reattachment onto the blade pressure side, and hub-shroud flow is strengthening as being fed from the re-attachment. There is evidence of large vortex and tip clearance flow impinging on the shroud suction wake, resulting in a vortex rolling over the blade. Beyond the bend the large vortex moves to the mid passage with a similar trend on pressure side. Near the throat (Fig. 4.g) most of the flow is accelerated, and the secondary flow near pressure side is restricted to the top third of blade. The suction side secondary flow is getting stronger and being continually fed by the jet pushing into the hub pressure corner and the shroud suction vortex is grown. Near exit (Fig. 4.h) the tip clearance effect is felt most and the increased size of wake gives a severe under-turning of flow.
(a) (b) (c)
(d) (e) (f) (g) (h) Figure 4: Vectors of flow velocity at: a) mid-span of volute vaneless nozzle and rotor, b) mid-span of rotor, c) hub to shroud ,d) cross section d-d, e) cross section e-e, f) cross section f-f, g) cross section g-g, h) cross section h-h
PARTICLES TRAJECTORY MODELING In particle trajectory simulations, two common approaches are used with one-way coupling
between particles and flow. The Eulerian approach treats both the continuous and dispersed phase as two interpenetrating continua, where the conventional time averaged transport equations for the additional phase are solved to predict the field distributions of momentum and volume fraction of each phase [13]. On the other hand, the Lagrangian approach handles discrete particle dispersion using a stochastic method by tracking a large number of individual particle trajectories [14] from their different starting positions. The relative ease of implementation and high level of information regarding single particle made it preferable in turbomachinery erosion prediction, since the maximum volume fraction is less than the upper limit of 10-6 [15], and the impact velocities and angles may be determined at the solid walls.
By considering the inertia forces and the main external drag force, the equation of motion of ash particle is derived in the rotating frame, thus resulting in additional inertia terms: the centrifugal and Coriolis forces. The following set of second order non-linear differential equations is solved along the trajectory in order to calculate the change of particle location through a compressible gas stream.
SS PS SS PS SS PS PS PS SS SS
d
e
f
g
h
d e
f
g
h
5
dt
dzVVVVVVV
d
C
dt
zd
dt
d
dt
dr
dt
rdVVVVVVV
d
C
dt
dr
dt
dr
dt
drVVVVVVV
d
C
dt
rd
pzfpzfzpfprfr
pp
DfP
ppppfpzfzpfprfr
pp
DfPp
pP
prfpzfzpfprfr
pp
DfP
222
2
2
222
2
2
2222
2
2
4
3
24
3
4
3
(1)
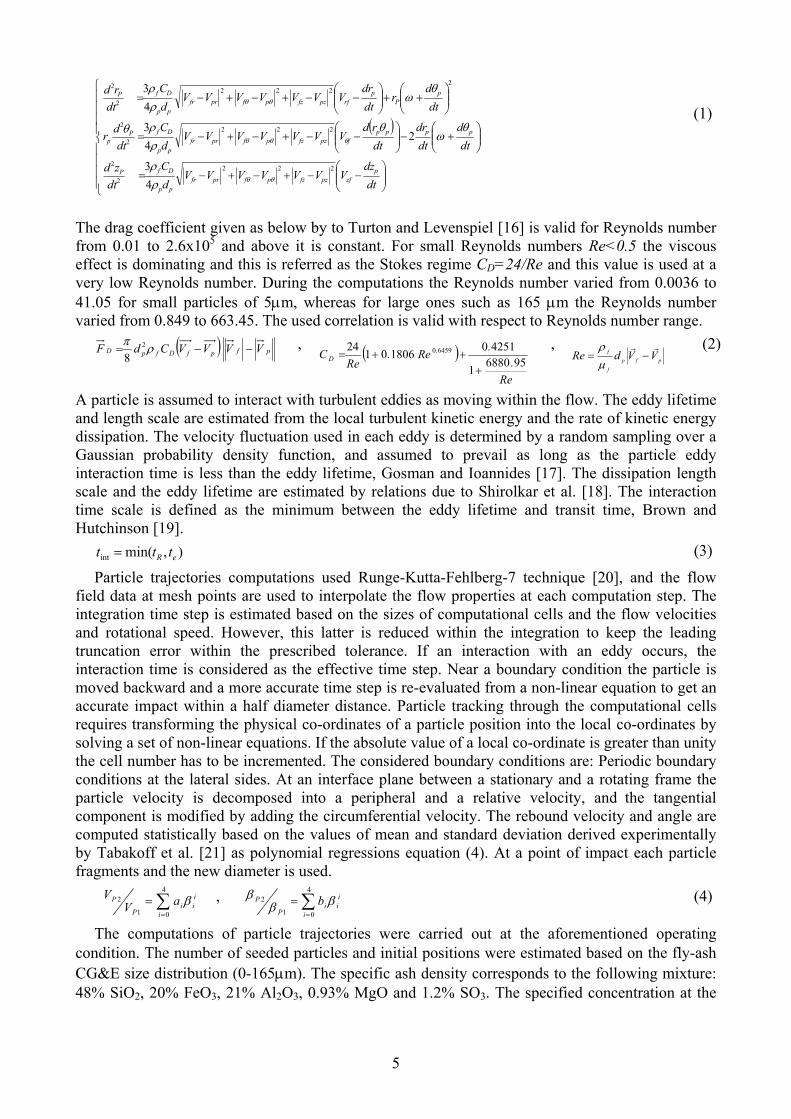
The drag coefficient given as below by to Turton and Levenspiel [16] is valid for Reynolds number from 0.01 to 2.6x10⁵ and above it is constant. For small Reynolds numbers Re<0.5 the viscous effect is dominating and this is referred as the Stokes regime CD=24/Re and this value is used at a very low Reynolds number. During the computations the Reynolds number varied from 0.0036 to 41.05 for small particles of 5m, whereas for large ones such as 165 m the Reynolds number varied from 0.849 to 663.45. The used correlation is valid with respect to Reynolds number range.
pfpfDfpD VVVVCdF 2
8 ,
Re
..
Re.Re
C .D 956880
1
42510180601
24 64590
, pfp
f
f VVdRe
(2)
A particle is assumed to interact with turbulent eddies as moving within the flow. The eddy lifetime and length scale are estimated from the local turbulent kinetic energy and the rate of kinetic energy dissipation. The velocity fluctuation used in each eddy is determined by a random sampling over a Gaussian probability density function, and assumed to prevail as long as the particle eddy interaction time is less than the eddy lifetime, Gosman and Ioannides [17]. The dissipation length scale and the eddy lifetime are estimated by relations due to Shirolkar et al. [18]. The interaction time scale is defined as the minimum between the eddy lifetime and transit time, Brown and Hutchinson [19].
),min(int eR ttt (3)
Particle trajectories computations used Runge-Kutta-Fehlberg-7 technique [20], and the flow field data at mesh points are used to interpolate the flow properties at each computation step. The integration time step is estimated based on the sizes of computational cells and the flow velocities and rotational speed. However, this latter is reduced within the integration to keep the leading truncation error within the prescribed tolerance. If an interaction with an eddy occurs, the interaction time is considered as the effective time step. Near a boundary condition the particle is moved backward and a more accurate time step is re-evaluated from a non-linear equation to get an accurate impact within a half diameter distance. Particle tracking through the computational cells requires transforming the physical co-ordinates of a particle position into the local co-ordinates by solving a set of non-linear equations. If the absolute value of a local co-ordinate is greater than unity the cell number has to be incremented. The considered boundary conditions are: Periodic boundary conditions at the lateral sides. At an interface plane between a stationary and a rotating frame the particle velocity is decomposed into a peripheral and a relative velocity, and the tangential component is modified by adding the circumferential velocity. The rebound velocity and angle are computed statistically based on the values of mean and standard deviation derived experimentally by Tabakoff et al. [21] as polynomial regressions equation (4). At a point of impact each particle fragments and the new diameter is used.
4
01
2
i
iii
P
P aVV ,
4
01
2
i
iii
P
P b (4)
The computations of particle trajectories were carried out at the aforementioned operating condition. The number of seeded particles and initial positions were estimated based on the fly-ash CG&E size distribution (0-165m). The specific ash density corresponds to the following mixture: 48% SiO2, 20% FeO3, 21% Al2O3, 0.93% MgO and 1.2% SO3. The specified concentration at the

6
inlet of volute took a typical value of 53 mg/m3, [22]. Iterations on ash particle number and size were repeated till reaching the convergence in the total mass of particles.
EROSION ASSESSMENT Erosion of turbomachinery depends on several factors such as the local flow conditions blades
geometry, material, particle size and concentration, velocity and angle of impingement. In the case of gas turbines, erosion takes place at elevated temperatures near the strength limiting temperatures of materials. For the high resistance steel alloy (Ni, Cr), Tabakoff and Hamed [6] have derived experimentally an erosion correlation given in milligrams of material by grams of impacting particles as follows.
)T(FecosVkecosVk n
n
p
n
p
2
1
2
12
2
1
2
11 11 21 (5)
Where en and e are the normal and tangential restitution factors k1, k2, n1, n2 are constants obtained by fitting the experimental curves and F(T) is a temperature correction factor. As the values of local mass erosion in mg are calculated from the local erosion rates and cumulated on mesh faces, they are used to compute the equivalent erosion levels given in mg/g/mm2.
N
iipN
ipe
q mmA
E1
1
1 (6)
RESULTS AND DISCUSSION The fly-ash particles of different sizes released at the inlet of volute intake tend to follow
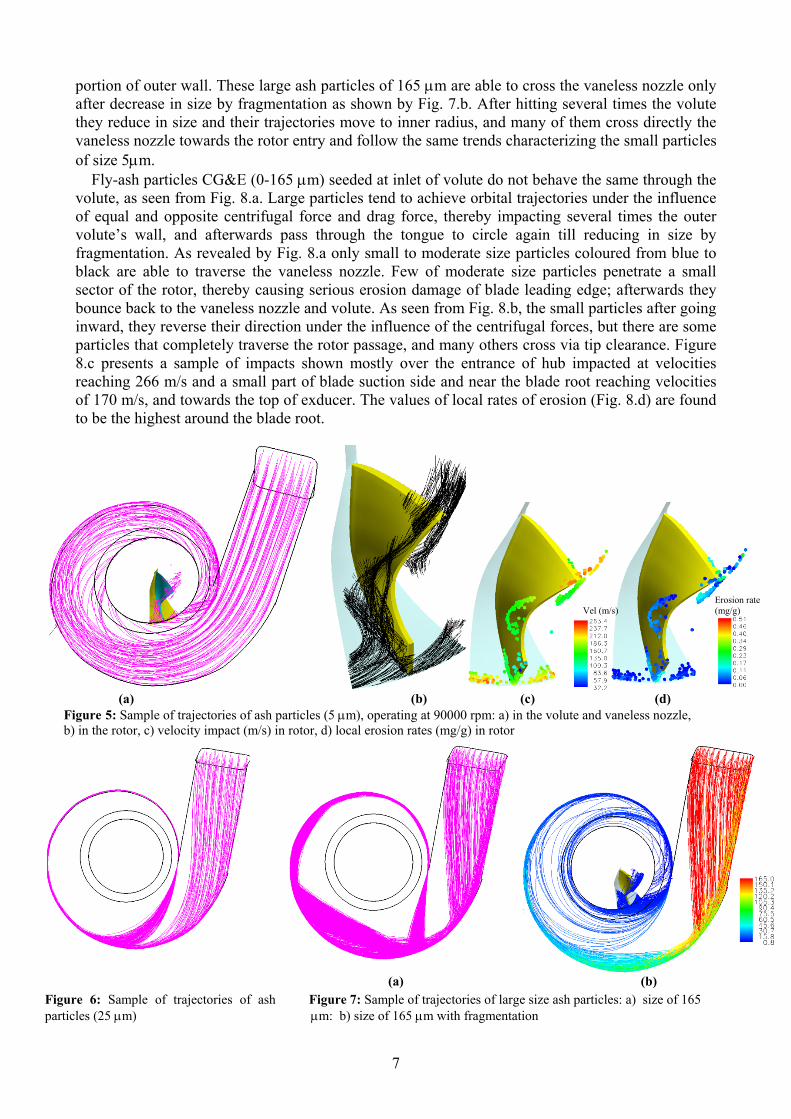
trajectories differently, depending on their sizes. As experienced with the computation, when trajectories are related to the particle momentum Stokes number (ratio of particle response time to a characteristic time scale), particles with a Stokes number below 0.03-0.3 tend to follow the streamlines and those with Stokes number 0.3-3 deviate and impact the rotor blade, whereas those typically with higher values 3-10 tend to have ballistic impactions. A large number of small fly-ash particles such as 5 m (Fig. 5.a) are seen to traverse directly from the volute to vaneless nozzle, but many others circle entirely the volute and cross the tongue once or more, and afterwards deviate towards the vaneless nozzle. As these small fly-ash particles of 5 m arrive at the rotor entry (Fig. 5.b), they change completely their paths’ directions due to rotating frame and are accelerated through the rotor passage. The centrifugal forces cause these small particles deviating upward and impacting near the shroud, in addition to many others seen to reverse their path. As particles enter the rotor, they hit the front part of hub and over the leading edge and fore part of blade from suction side (Fig.5 b-c) which are impacted several times, and continue further to impact the exducer from pressure side as well as the rear of shroud. According to the impacts sample, high velocities of impact reaching 263 m/s are seen (Fig. 5.c) over the hub at entry of rotor and around the blade root, as well as towards the exducer top corner and shroud. As consequence, the local rates of erosion (Fig. 5.d) are the highest around the leading edge in addition to the root of blade and towards the top of exducer and shroud, but the hub even impacted at high velocities the erosion levels are low because the angles of impingement are far away from optimal value.
Fly-ash particles of moderate size such as 25 m, shown by Fig. 6, achieve orbital trajectories under the influence of equal and opposite centrifugal force and drag force, thereby impacting several times the outer wall of volute. As revealed, all of them are forced to pass through the tongue and reach again the outer wall of volute from the first quarter, and once again continue their orbital trajectories and hitting practically the same regions with a dense flux of particles. No particles of this calibre are seen to cross the vaneless nozzle. Large fly-ash particles such as 165 m, as shown through the volute (Fig. 7.a), deviate considerably from the flow streamlines and follow ballistic trajectories after impacting different regions of the outer wall with a dense flux of particles. Beyond the second half of volute they tend to follow the outer wall. When crossing the tongue these large particles exit in a sort of a dense flux of particles to impinge the volute wall over the opposite
7
portion of outer wall. These large ash particles of 165 m are able to cross the vaneless nozzle only after decrease in size by fragmentation as shown by Fig. 7.b. After hitting several times the volute they reduce in size and their trajectories move to inner radius, and many of them cross directly the vaneless nozzle towards the rotor entry and follow the same trends characterizing the small particles of size 5m.
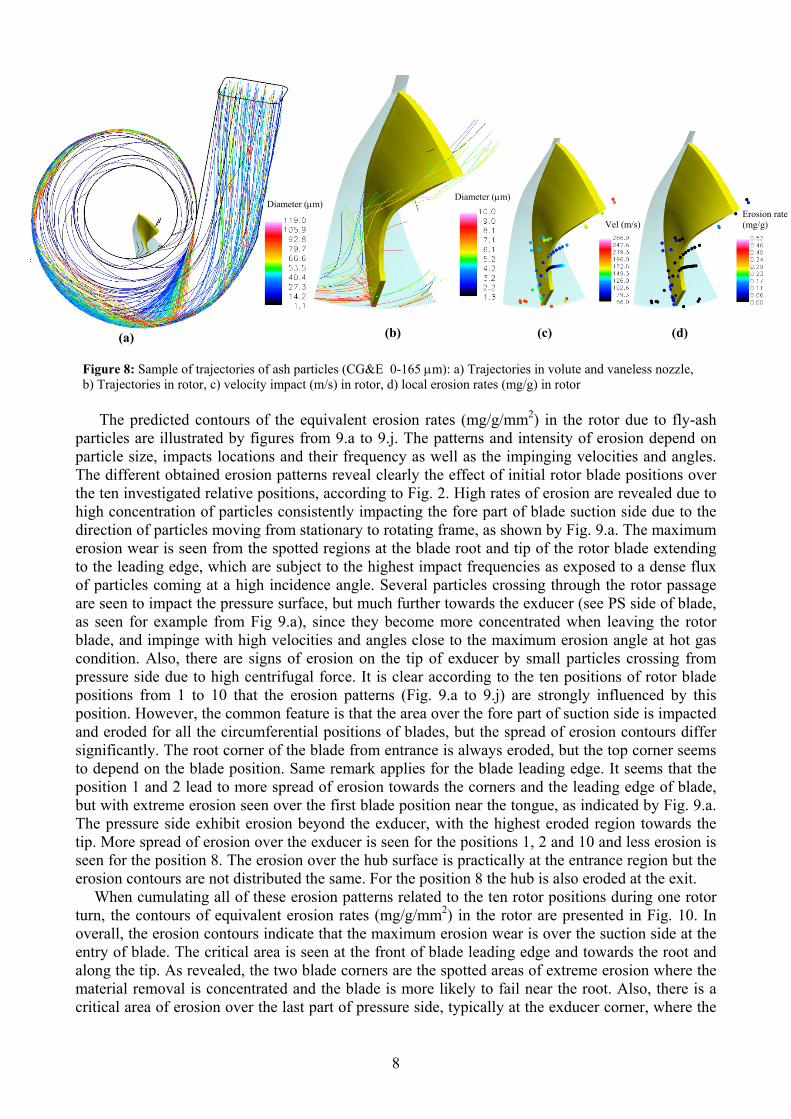
Fly-ash particles CG&E (0-165 m) seeded at inlet of volute do not behave the same through the volute, as seen from Fig. 8.a. Large particles tend to achieve orbital trajectories under the influence of equal and opposite centrifugal force and drag force, thereby impacting several times the outer volute’s wall, and afterwards pass through the tongue to circle again till reducing in size by fragmentation. As revealed by Fig. 8.a only small to moderate size particles coloured from blue to black are able to traverse the vaneless nozzle. Few of moderate size particles penetrate a small sector of the rotor, thereby causing serious erosion damage of blade leading edge; afterwards they bounce back to the vaneless nozzle and volute. As seen from Fig. 8.b, the small particles after going inward, they reverse their direction under the influence of the centrifugal forces, but there are some particles that completely traverse the rotor passage, and many others cross via tip clearance. Figure 8.c presents a sample of impacts shown mostly over the entrance of hub impacted at velocities reaching 266 m/s and a small part of blade suction side and near the blade root reaching velocities of 170 m/s, and towards the top of exducer. The values of local rates of erosion (Fig. 8.d) are found to be the highest around the blade root.
(a)
(b) (c) (d)
Figure 5: Sample of trajectories of ash particles (5 m), operating at 90000 rpm: a) in the volute and vaneless nozzle, b) in the rotor, c) velocity impact (m/s) in rotor, d) local erosion rates (mg/g) in rotor
(a) (b) Figure 6: Sample of trajectories of ash particles (25 m)
Figure 7: Sample of trajectories of large size ash particles: a) size of 165 m: b) size of 165 m with fragmentation
Vel (m/s) Erosion rate (mg/g)
8
(a)
(b) (c) (d)
Figure 8: Sample of trajectories of ash particles (CG&E 0-165 m): a) Trajectories in volute and vaneless nozzle, b) Trajectories in rotor, c) velocity impact (m/s) in rotor, d) local erosion rates (mg/g) in rotor
The predicted contours of the equivalent erosion rates (mg/g/mm2) in the rotor due to fly-ash
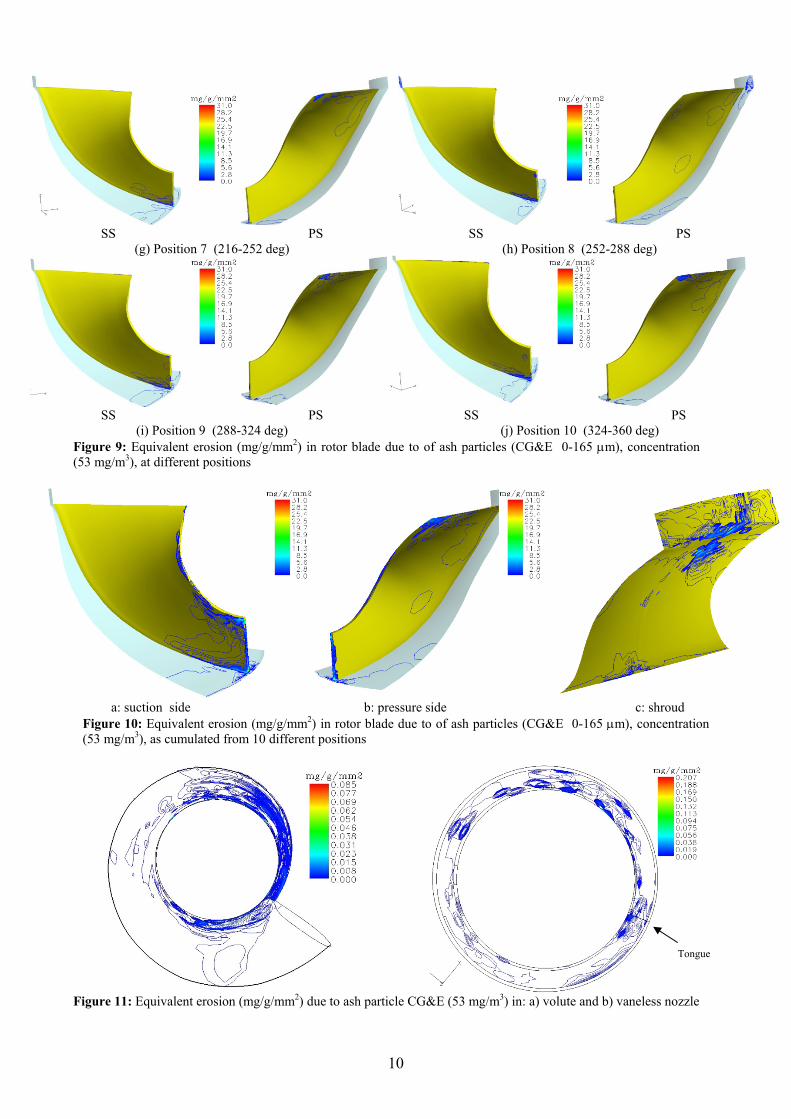
particles are illustrated by figures from 9.a to 9.j. The patterns and intensity of erosion depend on particle size, impacts locations and their frequency as well as the impinging velocities and angles. The different obtained erosion patterns reveal clearly the effect of initial rotor blade positions over the ten investigated relative positions, according to Fig. 2. High rates of erosion are revealed due to high concentration of particles consistently impacting the fore part of blade suction side due to the direction of particles moving from stationary to rotating frame, as shown by Fig. 9.a. The maximum erosion wear is seen from the spotted regions at the blade root and tip of the rotor blade extending to the leading edge, which are subject to the highest impact frequencies as exposed to a dense flux of particles coming at a high incidence angle. Several particles crossing through the rotor passage are seen to impact the pressure surface, but much further towards the exducer (see PS side of blade, as seen for example from Fig 9.a), since they become more concentrated when leaving the rotor blade, and impinge with high velocities and angles close to the maximum erosion angle at hot gas condition. Also, there are signs of erosion on the tip of exducer by small particles crossing from pressure side due to high centrifugal force. It is clear according to the ten positions of rotor blade positions from 1 to 10 that the erosion patterns (Fig. 9.a to 9.j) are strongly influenced by this position. However, the common feature is that the area over the fore part of suction side is impacted and eroded for all the circumferential positions of blades, but the spread of erosion contours differ significantly. The root corner of the blade from entrance is always eroded, but the top corner seems to depend on the blade position. Same remark applies for the blade leading edge. It seems that the position 1 and 2 lead to more spread of erosion towards the corners and the leading edge of blade, but with extreme erosion seen over the first blade position near the tongue, as indicated by Fig. 9.a. The pressure side exhibit erosion beyond the exducer, with the highest eroded region towards the tip. More spread of erosion over the exducer is seen for the positions 1, 2 and 10 and less erosion is seen for the position 8. The erosion over the hub surface is practically at the entrance region but the erosion contours are not distributed the same. For the position 8 the hub is also eroded at the exit.
When cumulating all of these erosion patterns related to the ten rotor positions during one rotor turn, the contours of equivalent erosion rates (mg/g/mm2) in the rotor are presented in Fig. 10. In overall, the erosion contours indicate that the maximum erosion wear is over the suction side at the entry of blade. The critical area is seen at the front of blade leading edge and towards the root and along the tip. As revealed, the two blade corners are the spotted areas of extreme erosion where the material removal is concentrated and the blade is more likely to fail near the root. Also, there is a critical area of erosion over the last part of pressure side, typically at the exducer corner, where the
Diameter (m) Diameter (m)
Vel (m/s) Erosion rate (mg/g)

9
most of material removal and blade rounding are expected. The hub is only eroded near the entrance, with erosion concentration around the blade root. The erosion of the casing is over only a narrow strip at entrance, but mainly beyond the rotor blade bend. Erosion as shown is more concentrated towards this region because of ash particles leave under high centrifugation and high efflux velocity and due to particles crossing over the blade tip.
The predicted erosion contours due to fly-ash particles in the volute are illustrated by Fig. 11.a, showing that erosion levels are less than 0.085 mg/g/mm2. As found the top part of volute is more eroded than the bottom. The distinguishable zones of erosion are over the last three sectors at the rear of tongue and about two sectors forward to it. The bottom of volute is noticeably eroded at forward of tongue. Higher erosion contours (Fig. 11.b) are predicted in the vaneless nozzle, spreading circumferentially only over the hub and reaching high values of 0.207 mg/g/mm2, which are mainly related to small size particles’ impacts. The concentrated islands of erosion are due to moderate and large size particles rebounding from the rotor blade at entrance.
SS PS SS PS
(a) Position 1 (0-36 deg) (b) Position 2 (36-72 deg)
SS PS SS PS
(c) Position 3 (72-108 deg) (d) Position 4 (108-144 deg)
SS PS SS PS (e) Position 5 (144-180 deg) (f) Position 6 (180-216 deg)
10
SS PS SS PS (g) Position 7 (216-252 deg) (h) Position 8 (252-288 deg)
SS PS SS PS
(i) Position 9 (288-324 deg) (j) Position 10 (324-360 deg) Figure 9: Equivalent erosion (mg/g/mm2) in rotor blade due to of ash particles (CG&E 0-165 m), concentration (53 mg/m3), at different positions
a: suction side b: pressure side c: shroud Figure 10: Equivalent erosion (mg/g/mm2) in rotor blade due to of ash particles (CG&E 0-165 m), concentration (53 mg/m3), as cumulated from 10 different positions
Figure 11: Equivalent erosion (mg/g/mm2) due to ash particle CG&E (53 mg/m3) in: a) volute and b) vaneless nozzle
Tongue
11
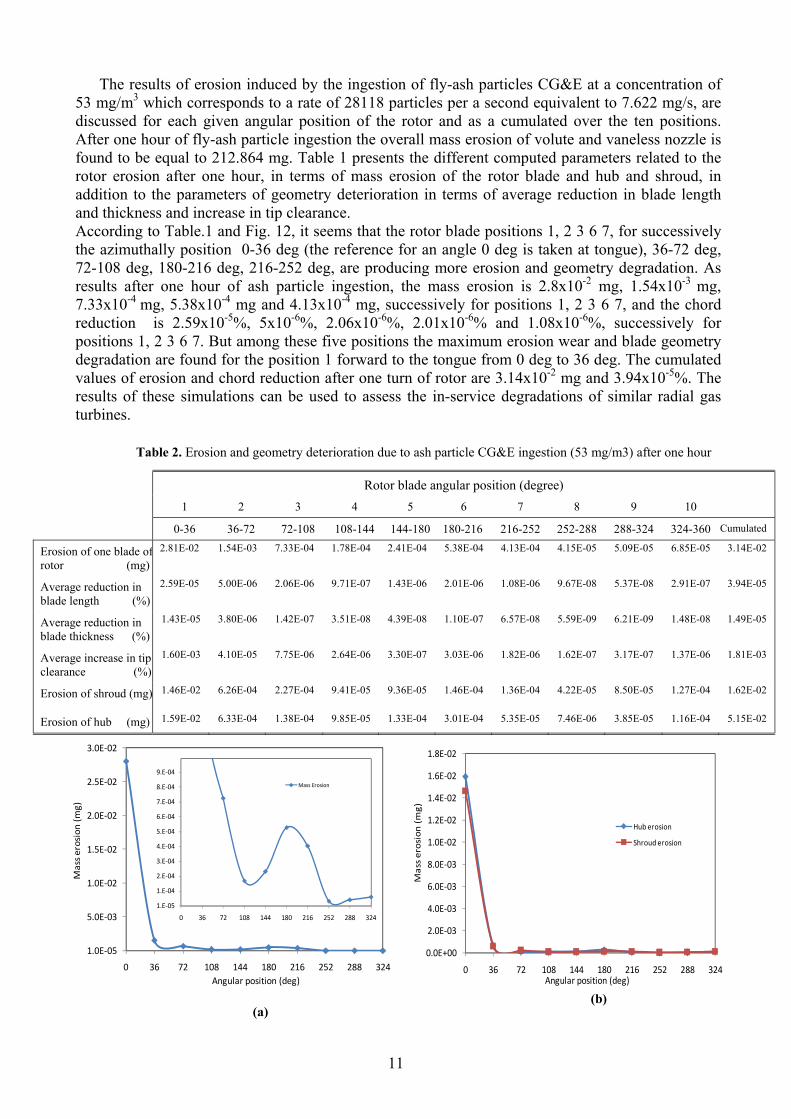
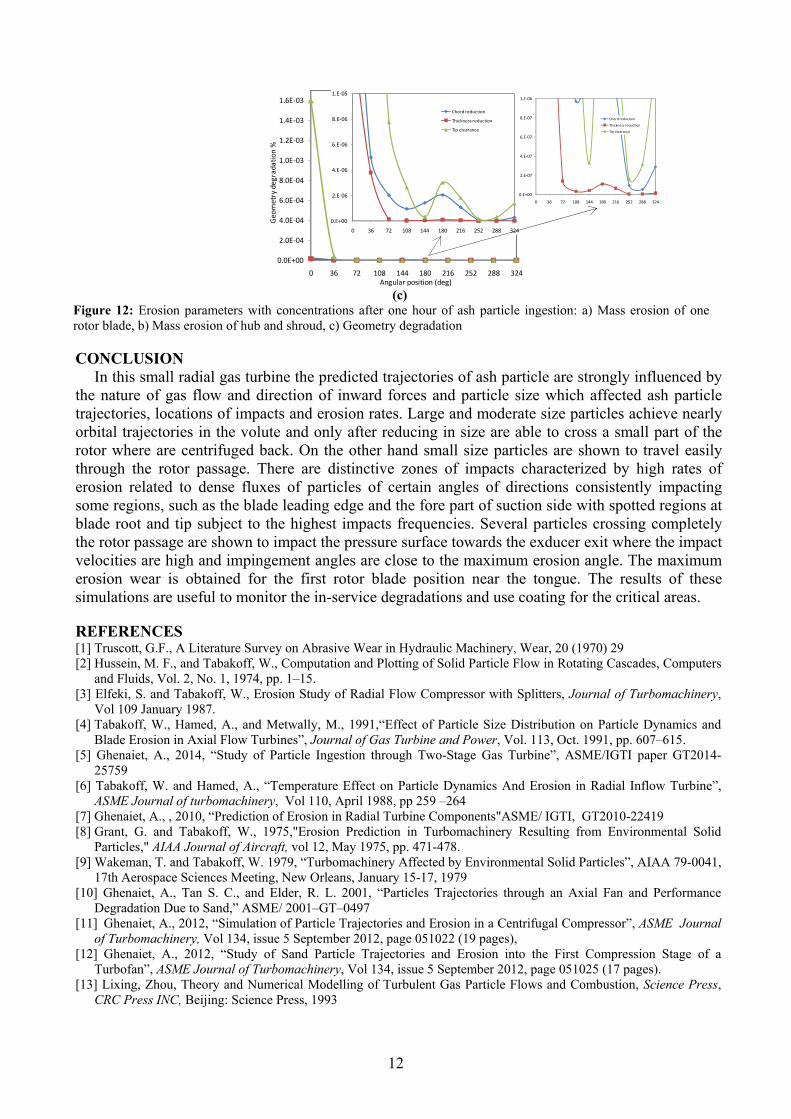
The results of erosion induced by the ingestion of fly-ash particles CG&E at a concentration of 53 mg/m3 which corresponds to a rate of 28118 particles per a second equivalent to 7.622 mg/s, are discussed for each given angular position of the rotor and as a cumulated over the ten positions. After one hour of fly-ash particle ingestion the overall mass erosion of volute and vaneless nozzle is found to be equal to 212.864 mg. Table 1 presents the different computed parameters related to the rotor erosion after one hour, in terms of mass erosion of the rotor blade and hub and shroud, in addition to the parameters of geometry deterioration in terms of average reduction in blade length and thickness and increase in tip clearance. According to Table.1 and Fig. 12, it seems that the rotor blade positions 1, 2 3 6 7, for successively the azimuthally position 0-36 deg (the reference for an angle 0 deg is taken at tongue), 36-72 deg, 72-108 deg, 180-216 deg, 216-252 deg, are producing more erosion and geometry degradation. As results after one hour of ash particle ingestion, the mass erosion is 2.8x10⁻² mg, 1.54x10⁻³ mg, 7.33x10⁻⁴ mg, 5.38x10⁻⁴ mg and 4.13x10⁻⁴ mg, successively for positions 1, 2 3 6 7, and the chord reduction is 2.59x10⁻⁵%, 5x10⁻⁶%, 2.06x10⁻⁶%, 2.01x10⁻⁶% and 1.08x10⁻⁶%, successively for positions 1, 2 3 6 7. But among these five positions the maximum erosion wear and blade geometry degradation are found for the position 1 forward to the tongue from 0 deg to 36 deg. The cumulated values of erosion and chord reduction after one turn of rotor are 3.14x10⁻² mg and 3.94x10⁻⁵%. The results of these simulations can be used to assess the in-service degradations of similar radial gas turbines.
Table 2. Erosion and geometry deterioration due to ash particle CG&E ingestion (53 mg/m3) after one hour
(a)
(b)
Rotor blade angular position (degree)
1 2 3 4 5 6 7 8 9 10
0-36 36-72 72-108 108-144 144-180 180-216 216-252 252-288 288-324 324-360 Cumulated
Erosion of one blade ofrotor (mg)
2.81E-02 1.54E-03 7.33E-04 1.78E-04 2.41E-04 5.38E-04 4.13E-04 4.15E-05 5.09E-05 6.85E-05 3.14E-02
Average reduction in blade length (%)
2.59E-05 5.00E-06 2.06E-06 9.71E-07 1.43E-06 2.01E-06 1.08E-06 9.67E-08 5.37E-08 2.91E-07 3.94E-05
Average reduction in blade thickness (%)
1.43E-05
3.80E-06
1.42E-07
3.51E-08
4.39E-08
1.10E-07
6.57E-08
5.59E-09
6.21E-09
1.48E-08
1.49E-05
Average increase in tip clearance (%)
1.60E-03
4.10E-05
7.75E-06
2.64E-06
3.30E-07
3.03E-06
1.82E-06
1.62E-07
3.17E-07
1.37E-06
1.81E-03
Erosion of shroud (mg) 1.46E-02
6.26E-04
2.27E-04
9.41E-05
9.36E-05
1.46E-04
1.36E-04
4.22E-05
8.50E-05
1.27E-04
1.62E-02
Erosion of hub (mg) 1.59E-02 6.33E-04 1.38E-04 9.85E-05 1.33E-04 3.01E-04 5.35E-05 7.46E-06 3.85E-05 1.16E-04 5.15E-02
1.0E‐05
5.0E‐03
1.0E‐02
1.5E‐02
2.0E‐02
2.5E‐02
3.0E‐02
0 36 72 108 144 180 216 252 288 324
Mass Erosion
Angular position (deg)
Mass erosion (mg)
1.E‐05
1.E‐04
2.E‐04
3.E‐04
4.E‐04
5.E‐04
6.E‐04
7.E‐04
8.E‐04
9.E‐04
0 36 72 108 144 180 216 252 288 324
Mass Erosion
0.0E+00
2.0E‐03
4.0E‐03
6.0E‐03
8.0E‐03
1.0E‐02
1.2E‐02
1.4E‐02
1.6E‐02
1.8E‐02
0 36 72 108 144 180 216 252 288 324
Hub erosion
Shroud erosion
Angular position (deg)
Mass erosion (mg)
12
(c) Figure 12: Erosion parameters with concentrations after one hour of ash particle ingestion: a) Mass erosion of one rotor blade, b) Mass erosion of hub and shroud, c) Geometry degradation
CONCLUSION In this small radial gas turbine the predicted trajectories of ash particle are strongly influenced by
the nature of gas flow and direction of inward forces and particle size which affected ash particle trajectories, locations of impacts and erosion rates. Large and moderate size particles achieve nearly orbital trajectories in the volute and only after reducing in size are able to cross a small part of the rotor where are centrifuged back. On the other hand small size particles are shown to travel easily through the rotor passage. There are distinctive zones of impacts characterized by high rates of erosion related to dense fluxes of particles of certain angles of directions consistently impacting some regions, such as the blade leading edge and the fore part of suction side with spotted regions at blade root and tip subject to the highest impacts frequencies. Several particles crossing completely the rotor passage are shown to impact the pressure surface towards the exducer exit where the impact velocities are high and impingement angles are close to the maximum erosion angle. The maximum erosion wear is obtained for the first rotor blade position near the tongue. The results of these simulations are useful to monitor the in-service degradations and use coating for the critical areas.
REFERENCES [1] Truscott, G.F., A Literature Survey on Abrasive Wear in Hydraulic Machinery, Wear, 20 (1970) 29 [2] Hussein, M. F., and Tabakoff, W., Computation and Plotting of Solid Particle Flow in Rotating Cascades, Computers
and Fluids, Vol. 2, No. 1, 1974, pp. 1–15. [3] Elfeki, S. and Tabakoff, W., Erosion Study of Radial Flow Compressor with Splitters, Journal of Turbomachinery,
Vol 109 January 1987. [4] Tabakoff, W., Hamed, A., and Metwally, M., 1991,“Effect of Particle Size Distribution on Particle Dynamics and
Blade Erosion in Axial Flow Turbines”, Journal of Gas Turbine and Power, Vol. 113, Oct. 1991, pp. 607–615. [5] Ghenaiet, A., 2014, “Study of Particle Ingestion through Two-Stage Gas Turbine”, ASME/IGTI paper GT2014-
25759 [6] Tabakoff, W. and Hamed, A., “Temperature Effect on Particle Dynamics And Erosion in Radial Inflow Turbine”,
ASME Journal of turbomachinery, Vol 110, April 1988, pp 259 –264 [7] Ghenaiet, A., , 2010, “Prediction of Erosion in Radial Turbine Components"ASME/ IGTI, GT2010-22419 [8] Grant, G. and Tabakoff, W., 1975,"Erosion Prediction in Turbomachinery Resulting from Environmental Solid
Particles," AIAA Journal of Aircraft, vol 12, May 1975, pp. 471-478. [9] Wakeman, T. and Tabakoff, W. 1979, “Turbomachinery Affected by Environmental Solid Particles”, AIAA 79-0041,
17th Aerospace Sciences Meeting, New Orleans, January 15-17, 1979 [10] Ghenaiet, A., Tan S. C., and Elder, R. L. 2001, “Particles Trajectories through an Axial Fan and Performance
Degradation Due to Sand,” ASME/ 2001–GT–0497 [11] Ghenaiet, A., 2012, “Simulation of Particle Trajectories and Erosion in a Centrifugal Compressor”, ASME Journal
of Turbomachinery, Vol 134, issue 5 September 2012, page 051022 (19 pages), [12] Ghenaiet, A., 2012, “Study of Sand Particle Trajectories and Erosion into the First Compression Stage of a
Turbofan”, ASME Journal of Turbomachinery, Vol 134, issue 5 September 2012, page 051025 (17 pages). [13] Lixing, Zhou, Theory and Numerical Modelling of Turbulent Gas Particle Flows and Combustion, Science Press,
CRC Press INC, Beijing: Science Press, 1993
0.0E+00
2.0E‐04
4.0E‐04
6.0E‐04
8.0E‐04
1.0E‐03
1.2E‐03
1.4E‐03
1.6E‐03
0 36 72 108 144 180 216 252 288 324
Chord reduction
Thickness reduction
Tip clearance
Geometry degradation %
Angular position (deg)
0.E+00
2.E‐06
4.E‐06
6.E‐06
8.E‐06
1.E‐05
0 36 72 108 144 180 216 252 288 324
Chord reduction
Thickness reduction
Tip clearance
0.E+00
2.E‐07
4.E‐07
6.E‐07
8.E‐07
1.E‐06
0 36 72 108 144 180 216 252 288 324
Chord reduction
Thickness reduction
Tip clearance
13
[14] Chen, X. and Pereira J. C. F., Efficient Computation of Particle Dispersion in Turbulent Flows with a Stochastic Probabilistic Model, Numerical Heat Transfer A27, 143 (1995)
[15] Sommerfeld, M. "Theoretical and Experimental Modeling of Particulate Flow - Overview and Fundamentals", VKI Lecture series 2000–06, April 3-7 2000, Von Karman Institute, Belgium
[16] Turton R. and Levenspiel, O., "A Short Note on the Drag Correlation for Spheres", J. Powder Technology, 4(1986) 83.
[17] Gosman, A. D. and Ionnides, E., Aspects of Computer Simulation of Liquid Fuelled Combustors, AIAA 19th Aerospace Science Meeting St Louis Missouri, AIAA 81-0323
[18] Shirolkar, J. S, Coimbra, C. F. M. and Queiroz, Mc Quay, Fundamental Aspects of Modeling Turbulent Particle Dispersion in Dilute Flows, Energy Combustion Sci. Vol. 22, pp 363 -399, 1996, Elsevier Science
[19] Brown, D. J. and Hutchinson, P., The Interaction of Solid or Liquid and Turbulent Fluid Flow Fields – A Numerical Simulation, Journal of Fluids Engineering, Vol. 101, pp265-269, 1979
[20] Erwin Fehlberg, "Classical Fifth, Sixth, Seventh and Eighth Order RK Formulas with Step Size Control", NASA TR-287 October 1968
[21] Tabakoff, W., Hamed, A., and Murugan, D. M., "Effect of Target Materials on the Particle Restitution Characteristics for Turbomachinery Application", Journal of propulsion and power Vol. 12 No 2, March-April 1996
[22] Edwards, R.V, and Rouse, P. L, " US Army Rotorcraft Turboshaft Engines Sand & Dust Erosion Considerations ", AGARD-CP-558, 83 rd Symposium, Propulsion and Energetic Panels on Erosion, Corrosion and Foreign Object Damage Effect in Gas Turbine 25-8 April 1994.