simulation of sliding failure occurred at highway ... · at highway embankment in 2011 great east...
TRANSCRIPT

SIMULATION OF SLIDING FAILURE OCCURRED
AT HIGHWAY EMBANKMENT IN 2011 GREAT EAST JAPAN EARTHQUAKE
Kouki MURAKAMI1, Ken-ichi TOKIDA2 and Aino TACHIBANA3
1 Graduate Student, Department of Civil Engineering, Osaka University,
Osaka, Japan, [email protected] 2 Professor, Department of Civil Engineering, Osaka University,
Osaka, Japan, [email protected] 3 Undergraduate, Department of Civil Engineering, Osaka University,
Osaka, Japan, [email protected]
ABSTRACT: However almost highway embankments weren’t damaged severely in the 2011 Great East Japan Earthquake, only one damaged embankment can be shown as the typical case where the toe sliding failure was observed at the shallow soft base ground and one side slope of the embankment with the symmetric cross section form was slid. In this study, the reasons why the toe sliding failure occurred at the one side slope of the embankment are investigated and discussed through the circular sliding method and dynamic response analysis.
Key Words: Highway embankment, toe sliding failure, circular sliding method,
dynamic response analysis
INTRODUCTION
In the 2011 Off the Pacific Coast of Tohoku Earthquake, the road embankments at the expressways are almost less damaged comparing with the ones occurred in the past earthquakes in Japan. The only one embankment close to the Naka Interchange at the Joban Expressway was damaged a little severely and remarkable with the following two interesting phenomena from the engineering view points. One point can be indicated that however the embankment constructed on the base ground with the soft layer of 3.6m thick, the sliding failure form of the embankment was the toe sliding one. Second one can be indicated that however the whole form of the embankment is almost symmetrical, one-sided slope of the embankment was slid and the opposite side slope was not slid.
In order to simulate the toe sliding failure of the embankment on the soft ground in this earthquake, the circular sliding method with the design seismic coefficient of 0.0, 0.1, 0.2 and 0.3 is applied to the embankment and base ground model estimated using the limited data obtained just after the earthquake. Furthermore, to verify the reasons why the slope was slid or not at the same cross section, both the circular sliding method and the finite element method using the earthquake ground motion estimated from the observed ground motion in this earthquake are applied.
Proceedings of the International Symposium on Engineering Lessons Learned from the 2011 Great East Japan Earthquake, March 1-4, 2012, Tokyo, Japan
949

Through this study, the possibility of the toe sliding failure on the soft base ground can be clarified firstly, comparing the soil properties of the embankment body with that of the base ground. Secondly, however the reason why the embankment slope was slid or not can’t be clarified with use of the circular sliding method in case of the symmetrical cross section of the embankment, the possibility and importance to consider the reduction of the soil strength of the unsaturated embankment body induced by the increase of the degree of saturation is discussed and indicated to investigate the sliding occurrence of the embankment slope. Furthermore, the direction of the seismic ground motion can be indicated to be very important to estimate the sliding failure with use of the dynamic response analysis. As the results of this study, very important lessons on the sliding failure of the embankment can be obtained for the future.
OUTLINE ON DAMAGED EXPRESSWAY EMBANKMENT Location of Objective Site However the 2011 Great East Japan Earthquake was the plate boundary type with the magnitude of 9.0, the expressway embankments were almost less damaged comparing with the ones in the past earthquakes in Japan. Because the seismic source area expanded widely from Tohoku Region to Kanto Region, very huge ground motion observed widely in Japan.
Fig. 1 (a) shows the location of the embankment at Joban Expressway to investigate in this study which is about 100km far from Tokyo. Fig. 1 (b) shows the satellite photograph by Google (2011) where the damaged embankment is covered with blue sheets and about 1km away from Naka Interchange which locates in the right direction of the figure. It’s necessary to note that the highway lanes from the right side to the left one in Fig.1(b) is named “Up Lane” to Tokyo where the embankment was slid and the reverse direction is named “Down Lane” from Tokyo in this paper.
Outline of Damaged Embankment Photo 1(a) reported by the East Nippon Expressway Co. Ltd. just after the earthquake shows the sliding failure at the embankment crest with the maximum displacement of 1.5m along the distance of about 150m together with a slight sliding occurred along the boundary of the two traffic lanes. Because the one lane of the Up Lane and two lanes of the Down Lane were not damaged, they could be used for the recovery works after the earthquake. So the damage level at this site can be indicated to be medium considering the performance-based design. Photo 1(b) shows the toe sliding failure of the embankment on March 13 because the side road and the base ground neighboring the embankment aren’t deformed. Furthermore, the sand boils induced by soil liquefaction can’t be observed at the base ground surface.
Joban Expressway 92.4kpMito IC ~ Naka IC
(a) Location of investigate site (b) Bird’s eye view around damaged embankment
Fig. 1 Objective site and embankment investigated
Tokyo
バードライン
国道118号
常磐自動車道下り
上り
Box水戸26
崩壊地点橋梁
那珂IC
類似変状地点
類似変状地点
400m
Box (Mito 26)
Slid Embankment
Bridge
Joban Expressway Naka IC
Up Lane
Down Lane
Route118
Similar Deformed Site
Bird Line
Similar Deformed Site
950

topsoil 0.45 0.45 86 0.64
cohesive soil 2.05 2.50 86 0.64
cohesive soil 1.15 3.65 123 1.88
sand gravel 5.80 9.45 246 29.0
rock surface 330
Feture Thickness(m) Depth(m) S-wave vel.(m/s) N-value
1
2 3
4 5 6
7
Conditions of Base Ground and Embankment The modeling the cross section of the damaged embankment and the base ground is conducted based on the data by the East Nippon Expressway Co. Ltd. (2011) as shown in Fig. 2. The conditions of the base ground are assumed based on the soil classification and N-value estimated by the boring data which were measured before the earthquake about 60m away from the slid embankment referring to the Guideline of Retaining Wall (1977) as shown in Fig. 3. Based on Fig. 3, the depth of the stiff diluvium ground can be estimated to be 9.45m deep and the above alluvium ground are divided into three layers such as layer 1 of 5.8m thick, layer 2 of 1.15m thick and layer 3 of 2.5m thick as shown in Fig. 2. Especially, the soft ground at this site is assumed to be 3.6m deep from the ground surface.
The embankment body is modeled with four layers such as layer 4, layer 5, layer 6 and layer 7 shown in Fig.2 where layers 5, 6 and 7 are the pavements except for the asphalt and modeled as the sandy gravel in this study. The thickness of layer 7 of 0.6m is measured from Photo 2 and that of layers 5 and 6 is assumed to be half of the layer 7. The soil properties of the embankment body are assumed based on the results of the unconfined compression tests of the slid soils which conducted on March 13 by the East Nippon Expressway Co. Ltd. (2011).
Based on the mentioned above, the saturated unit weight, wet unit weight, internal friction angle and cohesion of each layer is summarized in Table 1, and Fig. 2 and Table 1 is assumed to be the fundamental model for the circular sliding method in this study.
(a) Sliding failure around crest
Fig. 3 Soil profile of base ground applied to damaged embankment
Up Lane Down Lane
(b) Toe sliding failure under urgent repairing work on March 13
Photo 1 Sliding failure of embankment at Up Lane
Fig. 2 Fundamental model on cross section of embankment and base ground
951

NumberSaturated unit
weight(kN/m3)
Wet unit
weight(kN/m3)
Internal frictionangle(°)
Cohesion (kN/m2)
1 20.00 20.00 35.86 0.00
2 20.00 16.00 0.00 18.753 20.00 16.00 0.00 6.404 20.00 19.00 33.70 0.005 20.00 20.00 30.00 0.006 20.00 20.00 35.00 0.007 20.00 20.00 40.00 0.00
0.56
1
23
4 56
7
SIMULATION OF TOE SLIDING FAILURE WITH USE OF CIRCULAR SLIDING METHOD
How to conduct simulation In order to clarify the reason why the sliding failure form takes on the toe sliding failure, the simulation with use of the circular sliding method is conducted on the fundamental model and then the fundamental one is modified by trial and error to simulate the toe sliding failure by changing the soil conditions of each layer at the embankment body and the soft ground. Simulating in case of fundamental model The minimum safety factor (Fs) with the circular sliding method in case of the fundamental model shown in Fig. 2 is 0.56 which is smaller than 1.0 in the general condition as shown in Fig. 4. The minimum safety factor of 0.56 should be more than 1.0 in general condition. Furthermore, the sliding failure form takes on the base sliding failure which means that the sliding plane goes through the soft alluvium layer 3.
The above two results indicates that the fundamental model estimated firstly is necessary to be reviewed. As for these results, it can be considered that because the fundamental model assumed in Fig. 2 and Table 3 is based on the data obtained at the site of about 60m away from the slid embankment, the conditions of the soil properties at the slid embankment are different with the fundamental model.
Photo 2 View of pavement and gravelly fine sand layer
Table 1 Contents of embankment, pavement and base ground in Fig.2
Fig. 4 Minimum safety factor and sliding failure form in general condition
952
NumberSaturated unit
weight(kN/m3)
Wet unit
weight(kN/m3)
Internal frictionangle(°)
Cohesion (kN/m2)
1 20.00 20.00 35.86 0.00
2 20.00 16.00 20.00 18.753 20.00 16.00 15.00 13.004 20.00 14.00 20.00 5.005 20.00 20.00 30.00 0.006 20.00 20.00 35.00 0.007 20.00 20.00 40.00 0.008 20.00 19.00 20.00 10.00
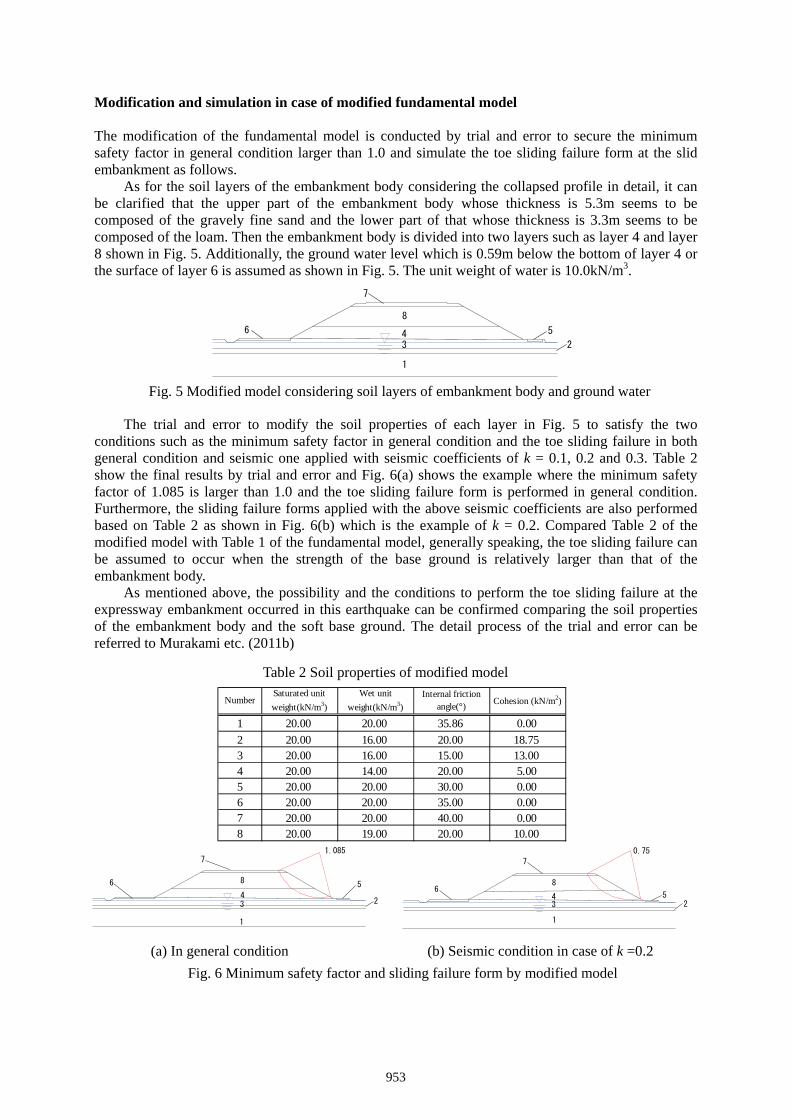
Modification and simulation in case of modified fundamental model The modification of the fundamental model is conducted by trial and error to secure the minimum safety factor in general condition larger than 1.0 and simulate the toe sliding failure form at the slid embankment as follows. As for the soil layers of the embankment body considering the collapsed profile in detail, it can be clarified that the upper part of the embankment body whose thickness is 5.3m seems to be composed of the gravely fine sand and the lower part of that whose thickness is 3.3m seems to be composed of the loam. Then the embankment body is divided into two layers such as layer 4 and layer 8 shown in Fig. 5. Additionally, the ground water level which is 0.59m below the bottom of layer 4 or the surface of layer 6 is assumed as shown in Fig. 5. The unit weight of water is 10.0kN/m3.
The trial and error to modify the soil properties of each layer in Fig. 5 to satisfy the two conditions such as the minimum safety factor in general condition and the toe sliding failure in both general condition and seismic one applied with seismic coefficients of k = 0.1, 0.2 and 0.3. Table 2 show the final results by trial and error and Fig. 6(a) shows the example where the minimum safety factor of 1.085 is larger than 1.0 and the toe sliding failure form is performed in general condition. Furthermore, the sliding failure forms applied with the above seismic coefficients are also performed based on Table 2 as shown in Fig. 6(b) which is the example of k = 0.2. Compared Table 2 of the modified model with Table 1 of the fundamental model, generally speaking, the toe sliding failure can be assumed to occur when the strength of the base ground is relatively larger than that of the embankment body.
As mentioned above, the possibility and the conditions to perform the toe sliding failure at the expressway embankment occurred in this earthquake can be confirmed comparing the soil properties of the embankment body and the soft base ground. The detail process of the trial and error can be referred to Murakami etc. (2011b)
(a) In general condition (b) Seismic condition in case of k =0.2
1
234 56
7
8
Fig. 5 Modified model considering soil layers of embankment body and ground water
1.085
1
234
56
7
8
Fig. 6 Minimum safety factor and sliding failure form by modified model
Table 2 Soil properties of modified model
0.75
1
234 5
6
7
8
953

0.90
1
234 56
7
8
INVESTIGATION ON DIFFERENCE BETWEEN DAMADE SLOPE AND NON-DAMADED SLOPE
Investigation on Symmetrical Cross Section with Use of Circular Sliding Method Because the slid embankment is almost symmetry, the sliding failure can be estimated to occur at both side slopes during earthquakes in general. However only one side slope at the Up Lane to Tokyo was slid, the opposite side slope at the Down Lane was not slid. The reason why the difference between the slid embankment and non-slid one occurred is very interesting from the engineering view point and can be applied for the future design of the expressway and/or other embankments. The above reason is investigated and discussed with use of the circular sliding method by the seismic coefficient method firstly. The embankment model identified as the modified model shown in Fig. 5 and Table 2 is applied to investigate the difference of minimum safety factors and sliding plane positions calculated at both side slopes applying the seismic coefficients of k = 0.1, 0.2 and 0.3. The example of results on the slope at the Down Lane in case of k = 0.1 can be shown in Fig. 7(a). As shown in Fig. 7(a), the sliding failure form takes on the toe sliding failure one. Furthermore the summaries of results in all cases of k = 0.1,0.2 and 0.3 are shown in Table 7(b) and the siding failure forms in all cases take on the toe sliding failure ones. As shown in Fig. 7(a), although the minimum safety factors at the slid slope at the Up Lane are a little larger than those at the non-slid slope, the differences between them seem to be very small from the engineering view point. As mentioned above, the reason why only one-side slope was slid at the same cross section can’t be clarified in this study. The result is clear and expected because the both slopes at the almost symmetrical embankment with the same soil materials are estimated to be same as far as the circular sliding method is applied, in other words, it indicates the limitation to apply the circular sliding one.
Investigation with Use of Seismic Response Analysis In order to investigate the reason why only one-side slope at the symmetrical embankment slid, the seismic response analysis with the Finite Element Method (FEM) have been conducted on the modified model establish in Fig. 5 and Table 2 to know the difference between the slid slope and non-slid one in detail. Model of base ground and embankment Fig. 8(a) shows the analytical FEM model of the objective embankment and base foundation. The left- side slope didn’t slide and the right-side one slid in this earthquake. The static soil properties are same with Table 2 applied for the circular sliding method. The dynamic soil properties of both shear modulus ratio G/G0 and damping content h according the shear strain γ shown in Fig. 8(b) which are estimated referring to Yasuda & Yamaguchi (1985) for the layer 1 to layer 4 of the base ground and Seismic Design Code of Railway Structure (1999) for the layer 5 to layer 9 of the embankment body, respectively are applied for the equivalent linear method. The layers 7, 8 and 9 are the pavements and modeled as the gravel, and the layer 10 is assumed to be the engineering base ground.
Fig.7 Stability at Down Lane and safety factors between Down Lane and Up Lane
(a) Critical slip circle at down lane tin case of k = 0.1 (b) Safety factor at both lanes
In General
k =0.1k =0.2k =0.3
ConditionFs
Down Lane Up Lane
1.0940.9020.7580.645 0.642
0.7540.8961.085
954

Analytical case and input seismic ground motion Two analytical cases shown in Table 3 are considered to investigate the effects by the input earthquake ground motion in this study. The earthquake ground motion inputted at the lower plane of the layer 10 of 10m deep in Fig.5 is estimated by Hata etc. (2011) from the earthquake ground motion recorded at Naka City Office which is about 4.5 km far away from the slid embankment. The time history of the acceleration estimated in the direction of the cross section of the slid embankment is shown in Fig. 9 where the applied time history is 100 seconds including the main large ground motion. It can be known that the maximum acceleration amplitude is +651gal and -533gal.
The plus (+) direction of the acceleration in Fig. 9 means to be the right side direction in Fig. 8(a) and then the seismic force induced by the plus acceleration tried to drive the body at right side slope to slide toward the right side in Fig. 8(a). So the direction of the inputted acceleration becomes important. In this study, two cases on the inputted direction of the base ground motion are considered, i.e. the direction of the plus acceleration is set to the right-side which is named “Real Direction” and the left-side which is named “Reversal Direction” to investigate the effects of the direction of the irregular ground motion on the dynamic behavior of the embankment.
Case Input Direction Max. Acc. to right Direction (gal) Max. Acc. to left Direction (gal)
1 Real 651 -533
2 Reversal -533 651 Effect of direction of seismic ground motion Fig.10 shows the distribution of the maximum acceleration at both embankment body and base ground for all duration time comparing the Real Direction with the Reversal one, and the maximum values only at the embankment body are picked up in Table 4. It can be known that both the distribution of
(a) Analytical FEM model (b) Dynamic properties of each layer
Table 3 Analytical cases
-800
-400
0
400
800
0 10 20 30 40 50 60 70 80 90 100 110 120 130 140 150
Acc
. (ga
l)
Time (s)
Applied Time History: 100 sec
0
0.1
0.2
0.3
0.4
0.5
0
0.2
0.4
0.6
0.8
1
1.0E-06 1.0E-05 1.0E-04 1.0E-03 1.0E-02 1.0E-01
dam
ping
con
stan
th
She
ar M
odul
us R
atio
G/G
0
shear strain γ
1
2
3
4
5
6
7
89
12
3
4
5
6
7
8
9
Fig. 9 Inputted earthquake ground motion at engineering base ground of 10m deep
Fig.8 FEM model and dynamic deformation properties
955

the maximum acceleration and the maximum values are almost same at the right-side body and the left-side one in the Real Direction and the Reversal Direction. Therefore, the difference induced by the direction of the inputted earthquake ground motion acting on the maximum acceleration at the embankment body can’t be clarified from the view of the maximum acceleration occurred.
Fig. 11 shows the distribution of the maximum shear strain at both embankment body and base ground for all duration time comparing the Real Direction with the Reversal one, and the maximum values only at the embankment body are picked up in Table 4. It can be known that both the distribution of the maximum acceleration and the maximum values are almost same between the right-side body in the Real Direction and the left-side body in the Reversal Direction. This indicates that referring the maximum shear strain, the slope at the Down Lane has the possibility to be slid when the earthquake ground motion in Fig. 9 was inputted in the Reversal Direction.
Table 5 is another discussion based on the averages of absolute maximum acceleration, shear strain and horizontal displacement occurred in the embankment body. From this Table 5, the influence by the direction of the earthquake ground motion can be assumed.
+17m/s2
0
-17m/s2
+
+17m/s2
0
-17m/s2
+
0.021
0.011
0
0.021
0.011
0
Left-sidedBody
Right-sidedBody
Left-sidedBody
Right-sidedBody
Left-sidedBody
Right-sidedBody
1 -1649 1674 1.31E-02 -1.58E-02 -0.077 0.100
2 -1649 1674 1.53E-02 -1.28E-02 -0.097 0.081
Max. Acc. (gal) Max. Shear Strain Max. Disp. (m)Case
Table 4 Maximum of acceleration, shear strain and horizontal displacement at embankment body above base ground
Fig. 10 Distribution of maximum acceleration
(a) Real Direction in case 1
(b) Reversal Direction in case 2
Fig. 11 Distribution of maximum shear strain
(a) Real Direction in case 1
(b) Reversal Direction in case 2
956
Left-sidedBody
Right-sidedBody
Left-sidedBody
Right-sidedBody
Left-sidedBody
Right-sidedBody
1 542 510 5.34E-03 5.76E-03 0.051 0.069
2 501 553 5.71E-03 5.39E-03 0.066 0.053
CaseAve. of Max. Acc. (gal) Ave. of Max. Shear Strain Ave. of Max. Disp. (m)
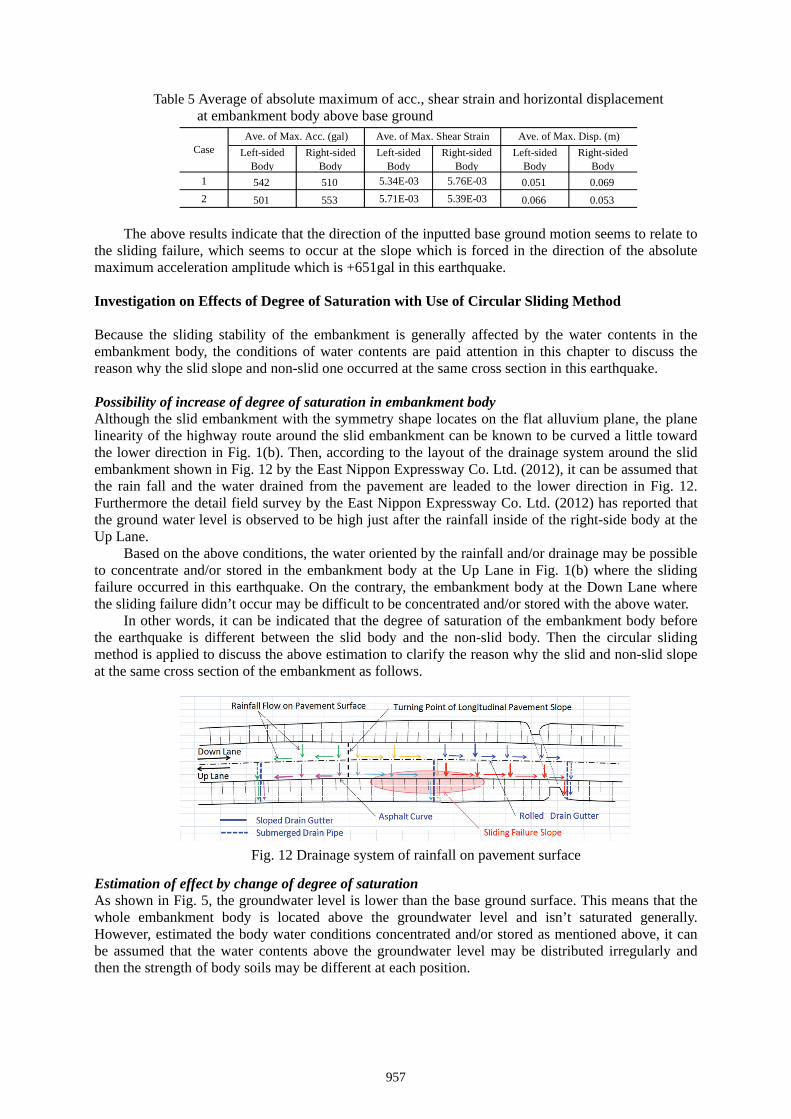
The above results indicate that the direction of the inputted base ground motion seems to relate to the sliding failure, which seems to occur at the slope which is forced in the direction of the absolute maximum acceleration amplitude which is +651gal in this earthquake. Investigation on Effects of Degree of Saturation with Use of Circular Sliding Method Because the sliding stability of the embankment is generally affected by the water contents in the embankment body, the conditions of water contents are paid attention in this chapter to discuss the reason why the slid slope and non-slid one occurred at the same cross section in this earthquake. Possibility of increase of degree of saturation in embankment body Although the slid embankment with the symmetry shape locates on the flat alluvium plane, the plane linearity of the highway route around the slid embankment can be known to be curved a little toward the lower direction in Fig. 1(b). Then, according to the layout of the drainage system around the slid embankment shown in Fig. 12 by the East Nippon Expressway Co. Ltd. (2012), it can be assumed that the rain fall and the water drained from the pavement are leaded to the lower direction in Fig. 12. Furthermore the detail field survey by the East Nippon Expressway Co. Ltd. (2012) has reported that the ground water level is observed to be high just after the rainfall inside of the right-side body at the Up Lane. Based on the above conditions, the water oriented by the rainfall and/or drainage may be possible to concentrate and/or stored in the embankment body at the Up Lane in Fig. 1(b) where the sliding failure occurred in this earthquake. On the contrary, the embankment body at the Down Lane where the sliding failure didn’t occur may be difficult to be concentrated and/or stored with the above water.
In other words, it can be indicated that the degree of saturation of the embankment body before the earthquake is different between the slid body and the non-slid body. Then the circular sliding method is applied to discuss the above estimation to clarify the reason why the slid and non-slid slope at the same cross section of the embankment as follows.
Estimation of effect by change of degree of saturation As shown in Fig. 5, the groundwater level is lower than the base ground surface. This means that the whole embankment body is located above the groundwater level and isn’t saturated generally. However, estimated the body water conditions concentrated and/or stored as mentioned above, it can be assumed that the water contents above the groundwater level may be distributed irregularly and then the strength of body soils may be different at each position.
Table 5 Average of absolute maximum of acc., shear strain and horizontal displacement at embankment body above base ground
Fig. 12 Drainage system of rainfall on pavement surface
957

For investigating the above estimation, it is necessary to know the factors affected by the change of degree of saturation Sr which are considered to be the shear strength and the wet density in this study. As for the above shear strength, Athapaththu etc. (2007) indicate that the internal friction angle isn’t related to the Sr and on the contrary, the apparent cohesion is related to that as shown in Fig. 13(a) through the consolidated drain tests. Based on Fig. 13(a), the cohesion of soils can be assumed to decrease according to the increase of the void ratio e of 0.7 to 1.0 depending on the Sr of 40% to 80%. Modifying Fig. 13(a), Fig. 13(b) can be obtained as the relation between the Sr and cohesion in case of the e of 0.95.
As shown in Table 2 which shows the soil properties on the layers 4 and 8 measured by the East Nippon Expressway Co. Ltd. (2011) just after the earthquake, the layer 4 is the loam with the void ratio e of 1.81 and then the cohesion is assumed not to be affected by the Sr in this study. On the other hand, because the layer 8 is the gravelly fine sand with the e of 0.95, the change of the cohesion is assumed according to Eq. (1) shown in Fig. 13(b).
c = -0.112Sr (%) + 12.93 (kPa) (1)
Based on the Eq. (1), it can be known that the cohesion of 0.112kPa is decreased according to the increase of Sr of 1 %. Although the Sr of the layer 8 measured just after the earthquake is 44.2 %, the Sr
of the layer 8 before the earthquake can’t be known shown in Table 6. In order to investigate the difference of the slid slope and non-slid one, the layer 8 in the original cross section of Fig. 14(a) is divided into two layers: the half layer at the right side where the sliding failure occurred and the that at the left one where the sliding one didn’t occur shown in Fig. 14(b). Then, the degree of saturation of the layer 9 in Fig. 14(b) is estimated to be Sr0 before the earthquake and the sliding safety factor is calculated applying the increase of Sr from 10% to 30% with the step of 10% from the Sr0 .
On the other hand, the relation between the wet density and Sr is estimated based on that estimated by two soil samples shown in Fig. 15(a), and then the wet density of 0.0494kN/m3 is assumed to be increased according to the increase of Sr of 1% in this study. The analytical conditions of 3 cases where the decrease of cohesion is considered in Case-1, the increase of wet density is considered in Case-2 and both cohesion and wet density are considered in Case-3 according to the increase of Sr are summarized in Fig. 15(b).
Layer No. Soil Classification Water Content (%) Wet Density (kN/m
3) Void Ratio Degree of Saturation (%)
4 loam 58.4 16.36 1.81 89.9
8 and 9 gravely fine sand 15.7 16.58 0.95 44.2
(a) cd, e and Sr : Athapaththu etc. (2007) (b) c and Sr in case of e = 0.95
C = -0.112Sr + 12.93
0
2
4
6
8
10
12
14
20 30 40 50 60 70 80 90
Coh
esio
n [k
Pa]
Degree of Saturation [%]
Table 6 Soil properties of layer 4, layer 8 and layer 9
Fig. 13 Relation between cohesion cd, degree of saturation Sr and void ratio e
958

Case-1 Case-2
Cohesion
(kN/m2)
WetDensity
(kN/m3)
0 10 19
10 8.88 19.49
20 7.76 19.99
30 6.64 20.48
Increase of Sr atLayer 9 (%)
Case-3
The calculated minimum safety factors with the circular sliding method in case of the seismic
coefficient of k = 0.1 can be obtained in Table 7. Table 7 is indicated that according to the increase of the Sr, the minimum sliding safety factor of the layer 9 at the right-side slope decreases compared with that of the layer 8 at the left-side slope, and the decrease of the cohesion affects a little more largely than the increase of the wet density on the decrease of the sliding safety factor of the embankment. As mentioned above, the possibility to explain the difference between the slid slope and the non-slid one can be indicated when the strength, i.e. the cohesion and the wet density of the body layer is possible to decrease according to the increase of the degree of saturation induced by the water concentrated and/or stored in the embankment body.
Case-1 Case-2 Case-3
0 1.089 1.089 1.08910 1.068 1.078 1.05720 1.046 1.067 1.02530 1.023 1.056 0.994
1.102
Increase of Sr atright side of Layer 9
(%)
Right-side SlopeLeft-sided
Slope
CONCLUSIONS The typical sliding failure of the highway embankment interested in the 2011 Great East Japan Earthquake are investigated to simulate the toe sliding failure on the soft base ground and to clarify the reason why only one side slope at the symmetry formed embankment during the earthquake. The following lessons can be obtained in this study. 1. The toe sliding failure at the soft base ground with the thickness of 3.6m which was observed in this
earthquake can be simulated with use of the circular sliding method considering the seismic coefficient of 0.0, 0.1, 0.2 and 0.3, compared the soil strength of the embankment body and that of
1
234 56
7
8
1
234
56
7
8 9
(a) Original cross section (b) Modified cross section to consider Sr
15.2
15.4
15.6
15.8
16
16.2
16.4
16.6
16.8
20 30 40 50 60
Wet
Den
sity
(kN
/m3 )
Degree of Saturation Sr (%)
(a) Relation Sr and wet density
Table 7 Minimum sliding safety factors affected by Sr in case of k = 0.1
(b) Conditions of analytical cases
Fig. 15 Relation between cohesion and wet density considering Sr
Fig. 14 Modification layer 8 at original model to consider effects of Sr
959

the soft base ground. 2. The reasons why the slid slope and non-slid one at the same cross section with the symmetry shaped
embankment can’t be clarified with use of the circular sliding method considering the seismic coefficient. This indicates the limitation to investigate the detail reasons of the sliding failure with the circular sliding method.
3. One of the above reasons can be indicated to be the direction of the maximum acceleration amplitude of the earthquake motion inputted at the base ground with use of the dynamic response analysis with use of FEM. This indicates that the direction of the earthquake ground motion should be paid attention when the dynamic response analyses are applied.
4. Another reason mentioned above can be explained by the different conditions of the degree of saturation in the embankment body before the earthquake. In other words, when the degree of saturation in the embankment body is distributed un-uniformly even if the shape of the embankment body is symmetry, the occurrence of the sliding failure can be indicated to be influenced by both the decrease of the cohesion and the increase of the wet density in the body soils induced by the increase of the degree of saturation before the earthquake. This indicates that the change of both cohesion and wet density of soils above the ground water level should be considered to estimate the sliding failure of the embankments.
Further study on the decrease of the strength of the embankment body induced by the water seepage should be investigated in the future.
ACKNOWLEDGMENTS The authors would like to express sincere gratitude to Dr. S. Yokota of the Nippon Expressway Research Institute Co. Ltd. and the East Nippon Expressway Co. Ltd. on the data at the slid embankment of the Joban Expressway, and to Dr. Y. Hata of the Nippon Koei Co. Ltd. on the earthquake ground motion estimated at the slid embankment.
REFERENCES Athapaththu, A., Tsuchida, T., Suga, K. and Kano, S. (2007). “A lightweight dynamic cone penetration
for evaluation of shear strength of natural masado slopes.” Journal of JSCE, C-Vol.63, No.2, 403-416.
East Nippon Expressway Co. Ltd. (2011). Data at the slid embankment at the time of May 2011. East Nippon Expressway Co. Ltd. (2012). Data at the slid embankment at the time of January 2012. Google (2011). Map Data Ⓒ2011 ZENRIN. Japan Road Association (1977). Guideline of Retaining Wall. Hata, Y., Ichii, K., Tokida, K., Nozu, A., Yokota S. and Kaneta, K.(2011). “Strong motion estimation at
the embankment of the Joban Expressway damaged by the 2011 Off the Pacific Coast of Tohoku Earthquake and its largest aftershock based on site effects substitution method.” Proc. 31th JSCE Earthquake Engineering Symposium, No.2-18, 1-12.(in Japanese)
Murakami, K., Tokida, K. and Tachibana, A. (2011a). “Simulation study with seismic coefficient method on toe sliding failure of highway embankment in the 2011 Off the Pacific Ocean of Tohoku Earthquake.” Proc. 10th Korea & Japan Joint Seminar on Geotechnical Engineering, 129-136.
Murakami, K., Tokida, K. and Tachibana, A. (2011b). “Simulation study with seismic coefficient method on toe sliding failure of highway embankment in the 2011 Off the Pacific Ocean of Tohoku Earthquake.” Proc. 31th JSCE Earthquake Engineering Symposium, No.5-14, 1-7.(in Japanese)
Railway Technical Research Institute (1999). Seismic Design Code of Railway Structure, 458-461. Yasuda, S. and Yamaguchi, I. (1985). ”Dynamic deformation characteristics of several undisturbed
soils.“ Proc. 20th JGS Soil Mechanics Engineering Conference, 539-542.
960