simulation of nitrogen and oxygen spectra emitted … of nitrogen and oxygen spectra emitted from...
TRANSCRIPT

ORIGINAL RESEARCH
Simulation of Nitrogen and Oxygen Spectra Emitted from HighDensity Hot Plasma
S. Alsheikh Salo • M. Akel • C. S. Wong
Published online: 19 June 2014
� Springer Science+Business Media New York 2014
Abstract The expected emission spectra of nitrogen and
oxygen high density plasma have been studied for different
conditions. Expected nitrogen and oxygen plasma spectra
at certain electron temperature range have been plotted.
Suitable electron temperature ranges for nitrogen and
oxygen plasma soft X-ray emission and extreme ultraviolet
emission have been investigated. Numerical experiments
confirm the possibility of developing nitrogen and oxygen
plasma focus as a powerful X-ray radiation source for
water-window X-ray microscopy, by selecting the working
gas pressure, choosing corresponding design and operating
parameters of the device. We have illustrated that the
results obtained from XRAYFIL simulation could be used
to provide spectroscopic information of the plasma focus
simulated by Lee model.
Keywords Nitrogen and oxygen plasma � Soft X-ray �EUV emission � X-rays ratio method
Introduction
High density plasma focus (1020 cm-3) of nitrogen [1–5]
and oxygen [6] gases has been used as an emitter of soft
X-rays suitable for water-window X-ray microscopy [7–9].
The emission spectra of the plasma depend on the operat-
ing parameters [10, 11], therefore the plasma focus could
also be considered as a possible light source for extreme
ultraviolet lithography (EUVL) at certain operating con-
ditions [11]. This is of interest to the semiconductor
manufacturing industry due to the expectation that the next
generation lithography (NGL) will be using the wavelength
of 135 A [12, 13]. Various types of EUV radiation sources,
including the laser produced plasma and pulsed discharge
sources, such as the capillary discharge [14, 15], vacuum
spark [16, 17] and plasma focus [18, 19], are being con-
sidered. These radiation sources, especially the pulsed
discharge sources are favorable as X-ray and EUV radia-
tion sources because of their lower cost and simplicity in
operation, when compared to other radiation sources.
Generally, it is hardly possible to get the detailed
accurate knowledge of the states of the plasma. Approxi-
mate estimations, by calculations based on simplified
plasma models, may be carried out. The methods of fuzzy
scaling and genetic algorithms for obtaining the possibility
of description of X-ray emission, scattering and applica-
tions on fusion energy have been used [20–22]. On the
other hand, the most tractable plasma models are the local
thermodynamic equilibrium (LTE), the non-local thermo-
dynamic equilibrium (NLTE) or the corona equilibrium
(CE), and the collisional-radiative equilibrium (CRE) [23–
26]. One of the best known of these is the suite of three
codes (POPULATE, SPECTRA, and RATIO) called
RATION [27–30]. The POPULATE code uses the princi-
ple of detailed balance to calculate the rate of inverse
processes. The SPECTRA code computes the expected
emission spectrum of the plasma, while the RATIO code
allows the user to view the results of POPULATE in
graphical forms. The graphical outputs include the popu-
lation, ratio of the intensities of selected transitions and the
optical depths of transitions, as a function of temperature or
density. Since the code provides details of the populations
S. Alsheikh Salo (&) � M. Akel
Department of Physics, Atomic Energy Commission,
6091 Damascus, Syria
e-mail: [email protected]
C. S. Wong
Physics Department, Plasma Technology Research Center,
University of Malaya, 50603 Kuala Lumpur, Malaysia
123
J Fusion Energ (2014) 33:677–683
DOI 10.1007/s10894-014-9725-2

in Lithium-like through fully stripped ions, an X-ray filter
analysis code, XRAYFIL, [31] has been developed to allow
more accurate non-dispersive X-ray plasma diagnosis with
absorption filters by using a series of trial spectra of the
emitting species. The code calculates a set of emission
spectra for a given plasma using RATION, and convolves
it with the transmission characteristics of the filter set used,
as well as the response function of the detector chosen.
Comparison of the ratio of the signal through the different
filters from these calculated values to that recorded in the
experiment allows us to obtain a measurement of the
plasma temperature and density. The code incorporates a
number of options for various emission scenarios and
detectors. The main purpose of XRAYFIL code is to cal-
culate the emission spectra of nitrogen and oxygen plasma
and then to work out the number of photons passing
through the chosen composite filter (BPX65 PIN diode
detector, in our case). So, the emission spectra (full,
Bremsstrahlung, recombination, and line) are computed
using XRAYFIL code (in unit of number of photons/cm3/
Angstrom/Sec./Sterad.) [31].
In this work, the XRAYFIL code coupled with the
POPULATE code is used to study the EUV and X-ray
emissions of nitrogen and oxygen plasma focus. The
spectra of radiation emissions (full, Bremsstrahlung,
recombination, and line) from the nitrogen and oxygen
plasma focus have been simulated for different plasma
conditions. The calibrated X-ray ratio curves for electron
temperature measurements of nitrogen and oxygen plasma
focus have been deduced.
Results and Discussion of Numerical Experiments
Spectrum of the Nitrogen and Oxygen Plasma
in the Extreme Ultraviolet Range
Many numerical experiments have been carried out using
POPULATE and XRAYFIL codes for calculations of
nitrogen and oxygen plasma spectra in the extreme ultra-
violet range at different temperatures for NLTE (for
nitrogen 10–100 eV and for oxygen 10–200 eV). Figure 1a
presents the expected radiative emissions (full, Brems-
strahlung, recombination, and line) of nitrogen plasma
at Te = 100 eV for NLTE model, Ne = 1019 cm-3,
Ni = 1018 cm-3 for a wide range of the wavelength
(10–180 A). From this figure it can be seen that the rect-
angle and its sharp edge obtained in the full spectra are
related to the variation of the recombination emission
versus wavelength. The obtained results in the extreme
a
b
Fig. 1 a Calculated full, Brem. and Recomb. spectra for nitrogen
plasma with Te = 100 eV. b Computed full EUV nitrogen plasma
focus spectra at Te = 100 eV for NLTE model
Fig. 2 Computed EUV oxygen plasma focus spectra at different
temperatures for NLTE model
678 J Fusion Energ (2014) 33:677–683
123

ultraviolet range showed that Te = 100 eV is the optimum
value for the strong emission at or near wavelength of
135 A (see Fig. 1b).
While for oxygen plasma Te = 125 eV is the suitable
temperature for higher EUV emission (see Figs. 2, 3).
Nitrogen and Oxygen Plasma as Soft X-ray Source
The ion distribution in the plasma has been investigated for
various conditions assuming the NLTE model. Then the
plasma radiations in the X-ray range have been simulated
using POPULATE and XRAYFIL codes. The computed
spectral lines emitted from a plasma are broadened by
Doppler broadening [27, 32].
The nitrogen plasma spectrum has been computed at dif-
ferent temperatures (Te in the range of 50–500 eV), electron
density (Ne in the range of 1018–1020 cm-3) and ion density
(Ni in the range of 1017–1019 cm-3). Figure 4 presents the
expected radiative X-ray emissions of nitrogen plasma focus
at Te = 100 eV for NLTE model, Ne = 1019 cm-3, Ni =
1018 cm-3. The effects of electron temperature and density on
the plasma emissions have been studied. The electron plasma
temperature influence on the radiative emission has been found
to be more dominant than electron density. Figure 5 shows the
variations of the expected full emission spectra of plasma focus
at various temperatures. As expected from theoretical con-
sideration of plasma emission [32], the continuum of the X-ray
emission spectrum is observed to shift towards shorter wave-
length (higher photon energy) with increasing electron tem-
perature. The relative population of the ionic species present is
also affected by the temperature.
Based on the corona model [33–35] the prominent spe-
cies present in nitrogen plasma at electron temperature
of 90 eV are N?5 and N?6, while at 150 eV, N?5, N?6 are
present with small fraction of N?7. Finally at electron
temperature higher than 200 eV, N?7 become prominent,
together with N?6. This will affect the recombination and
line radiations. At electron temperature much higher than
300 keV, when the plasma becomes fully ionized, Brems-
strahlung is expected to dominate. Numerical experiments
have also shown that the shapes of spectra for different
electron densities (1018–1020 cm-3) are similar, but differ-
ent in amplitude, due to the Ne2-dependence.
Figure 6 shows variation of the soft X-ray intensity (H-
like ions) versus electron temperature. From Fig. 6 it can
be seen that the most suitable temperatures for H-like is
found to be about 100–150 eV.
Fig. 3 Computed EUV oxygen plasma focus spectra at Te = 125 eV
for NLTE model, Ne = 1019 cm-3
23.0 23.5 24.0 24.5 25.0 25.5 26.0
1E20
1E21
1E22
1E23
1E24
1E25
1E26
1E27
1E28
1E29
λ = 24.9 Ao
λ = 24.781 Ao
Num
ber
of p
hoto
ns/c
m3 /s
ec./S
tera
d./A
o
Wavelength, Ao
Soft X-ray nitrogen spectrum at Te = 100 eV
Fig. 4 Computed spectrum for nitrogen plasma with Te = 100 eV
Fig. 5 Computed spectra of nitrogen plasma at three different
temperatures for Ne = 1019 cm-3
J Fusion Energ (2014) 33:677–683 679
123

Numerical experiments have also been performed on the
oxygen plasma to find the emission spectra at different
conditions. Figure 7 presents the expected radiative X-ray
emissions of oxygen plasma focus at Te = 200 eV for
NLTE model, Ne = 1019 cm-3, Ni = 1018 cm-3. The
electron temperature and density effects on the plasma
emissions have also been studied. Based on the corona
model [34–36] the prominent species present in oxygen
plasma at electron temperature of 150–200 eV are O?6 and
O?7, while at electron temperature higher than 300 eV,
O?8 become prominent, together with O?7. Figures 8 and 9
show variations of the soft X-ray intensity (He-like and
H-like ions) versus electron temperature. From Fig. 8 it can
be seen that the most suitable temperature for He-like is
found to be about 125 eV. While the most suitable tem-
perature for H-like ions is found to be about 200 eV (see
Fig. 9).
The plasma focus device is the simplest low-cost high
density hot plasma, and so many numerical experiments
simulating X-ray radiations emitted from plasma focus
devices and optimizing the plasma focus devices operating
with nitrogen and oxygen gases using Lee model for gen-
erating a maximum soft X-ray yield have been conducted
[33–39]. Numerical experiments using Lee model on
plasma focus operated with nitrogen and oxygen gases
showed that the suitable temperature windows for gener-
ating soft X-ray from nitrogen and oxygen are 74–173 and
119–260 eV for nitrogen and oxygen, respectively. And it
Fig. 6 Variation of H-like ion emission line intensity of nitrogen
plasma with Te for NLTE model
Fig. 7 Computed spectrum for oxygen plasma with Te = 200 eV
Fig. 8 Variation of He-like ion emission line intensity of oxygen
plasma with Te for NLTE model
Fig. 9 Variation of H-like ion emission line intensity of oxygen
plasma with Te for NLTE model
680 J Fusion Energ (2014) 33:677–683
123
has been shown that optimized operational and geometrical
conditions are required for improvement of the X-ray yield.
As an example, numerical experiments for optimizing the
UNU/ICTP PFF plasma focus device using Lee model
showed that the peak axial speeds suitable for maximum
nitrogen and oxygen soft X-ray yields are about 2.5 cm/ls
[37] and 4 cm/ls [39], respectively. Practically, these
needed axial speeds, with other optimized parameters to
reach ranges of temperatures suitable for generating soft
X-ray from low atomic number gases (nitrogen and oxy-
gen), could be achieved in the plasma focus devices. While
for plasma focus operated with high atomic number gases
like krypton and xenon, the required axial speeds suitable
for soft X-ray generation are higher than 11 cm/ls [40],
and it is not clear whether plasma focus devices will
operate in such high speed regimes for Kr and Xe. How-
ever, based on our obtained X-ray spectroscopic results
using the POPULATE and XRAYFIL codes, it can be said
that the suitable Te ranges for soft X-ray from nitrogen and
oxygen plasma correspond to the Te windows used in the
numerical experiments performed using Lee model.
Electron Temperature Measurements of Nitrogen
and Oxygen Plasma Based on Ratio Method
The electron temperature of the plasma can be determined
from the analysis of radiation in the X-ray region [41–43]
using the five channels BPX65 PIN diodes with foils of
different thicknesses [44–48]. The attenuated radiative
emissions of plasma through different channels of BPX65
PIN diodes with varying absorption filters have been cal-
culated using the Ratio-BPX65 code [49, 50]. Briefly, the
code has been written in FORTRAN 77 for studying the
effect of the response of BPX65 photodiode, with Mylar
and aluminium foils. The attenuated plasma spectrum
through aluminized mylar foils and detected by the BPX65
photodiode can be determined by using the following for-
mula [31]:
I0 ¼Z
allk
Pðk;TeÞ � SðkÞ � exp � lmylarðkÞxmylar dk ð1Þ
Similarly, the X-ray emission detected by diodes with
additional aluminium foils of various thicknesses can be
expressed as:
I¼Z
allk
Pðk;TeÞ�SðkÞ�exp� lmylarðkÞxmylarþlAlðkÞxAl
� �dk
ð2Þ
Finally, the ratio of the X-ray signals obtained by diodes
with additional aluminium foils against that with alumi-
nized mylar only can then be calculated as R = I/I0:
R¼ I
I0
¼
Rallk
Pðk;TeÞ �SðkÞ �exp� lmylarðkÞxmylarþlAlðkÞxAl
� �dk
Rallk
Pðk;TeÞ �SðkÞ �exp�lmylarðkÞxmylar dk
ð3Þ
In Eqs. (1), (2) and (3) S (k) is the BPX65 sensitivity, l is
mass absorption coefficient of material, and x is the
absorption foil thickness.
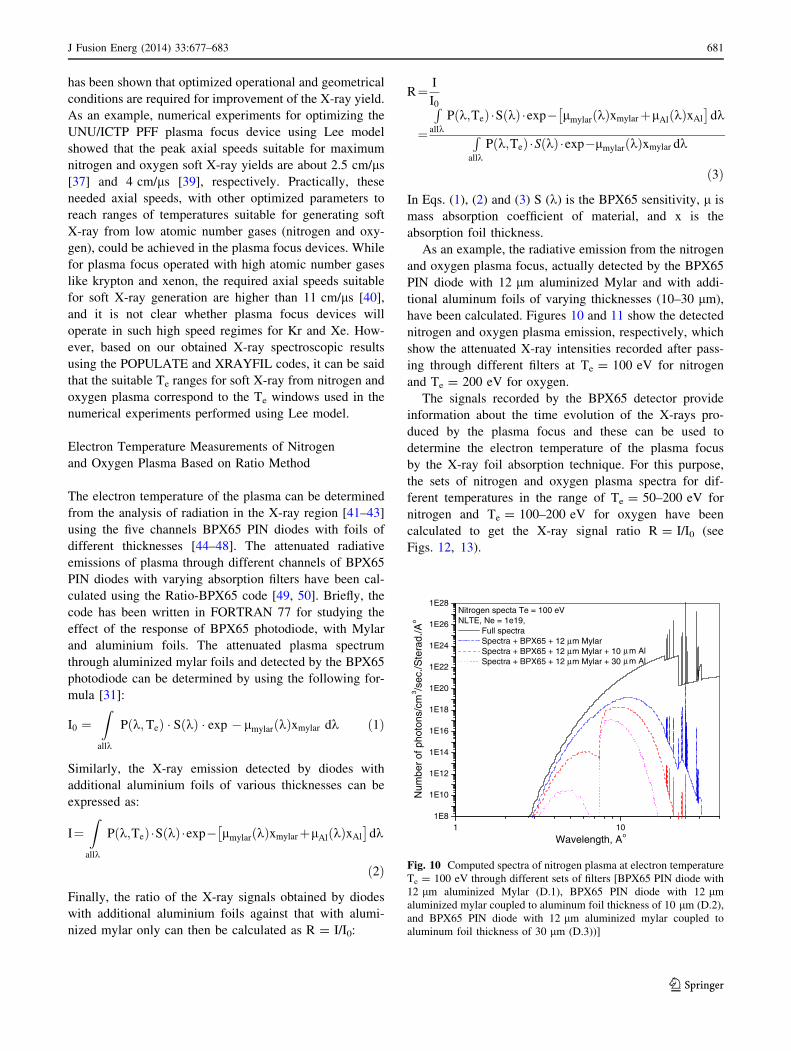
As an example, the radiative emission from the nitrogen
and oxygen plasma focus, actually detected by the BPX65
PIN diode with 12 lm aluminized Mylar and with addi-
tional aluminum foils of varying thicknesses (10–30 lm),
have been calculated. Figures 10 and 11 show the detected
nitrogen and oxygen plasma emission, respectively, which
show the attenuated X-ray intensities recorded after pass-
ing through different filters at Te = 100 eV for nitrogen
and Te = 200 eV for oxygen.
The signals recorded by the BPX65 detector provide
information about the time evolution of the X-rays pro-
duced by the plasma focus and these can be used to
determine the electron temperature of the plasma focus
by the X-ray foil absorption technique. For this purpose,
the sets of nitrogen and oxygen plasma spectra for dif-
ferent temperatures in the range of Te = 50–200 eV for
nitrogen and Te = 100–200 eV for oxygen have been
calculated to get the X-ray signal ratio R = I/I0 (see
Figs. 12, 13).
1011E8
1E10
1E12
1E14
1E16
1E18
1E20
1E22
1E24
1E26
1E28
Wavelength, Ao
Num
ber
of p
hoto
ns/c
m3 /s
ec./S
tera
d./A
o
Nitrogen specta Te = 100 eVNLTE, Ne = 1e19,
Full spectra Spectra + BPX65 + 12 m Mylar Spectra + BPX65 + 12 m Mylar + 10 m Al Spectra + BPX65 + 12 m Mylar + 30 m Al
μμμ
μμ
Fig. 10 Computed spectra of nitrogen plasma at electron temperature
Te = 100 eV through different sets of filters [BPX65 PIN diode with
12 lm aluminized Mylar (D.1), BPX65 PIN diode with 12 lm
aluminized mylar coupled to aluminum foil thickness of 10 lm (D.2),
and BPX65 PIN diode with 12 lm aluminized mylar coupled to
aluminum foil thickness of 30 lm (D.3))]
J Fusion Energ (2014) 33:677–683 681
123

These ratio curves can be used as calibration curves for
the measurement of electron temperatures for nitrogen and
oxygen plasmas. Finally, these numerical experiments
showed that for generation of EUV and soft X-ray from
plasma focus operated with nitrogen and oxygen optimized
operational and geometrical conditions are required. Then,
based on electron temperatures and ion densities of studied
plasma focus obtained by Lee model, we can proceed to
obtain spectroscopic information for EUV and X-ray
emissions of the plasma focus using XRAYFIL code.
Conclusions
The radiation emission spectra of nitrogen and oxygen
plasma at various plasma parameters have been computed
using the XRAYFIL code by assuming a NLTE model for
the plasma. Nitrogen and oxygen plasma focus spectra
have been calculated for plasma focus operation as soft
X-ray and EUV sources. The suitable electron temperature
ranges for soft X-ray and EUV emissions from studied hot
plasma were found. The calibration X-ray ratio curves for
electron temperature deduction of nitrogen and oxygen
plasma have been computed. These ratio curves could be
used as calibration curves for the measurement of electron
temperatures for nitrogen and oxygen plasma focus.
Finally, we believe that the simulation results presented
here may also be useful to set the condition for any pulsed
hot plasma source to be considered as EUV or soft X-ray
source.
Acknowledgments The authors would like to thank general director
of AECS for support, guidance and encouragement. C. S. Wong’s
participation in this work is supported by University of Malaya
research Grant RG204-11AFR.
1011E8
1E10
1E12
1E14
1E16
1E18
1E20
1E22
1E24
1E26
1E28
Wavelength, Ao
Num
ber
of p
hoto
ns/c
m3 /s
ec./S
tera
d./A
o
Nitrogen specta Te = 100 eVNLTE, Ne = 1e19,
Full spectra Spectra + BPX65 + 12 m Mylar Spectra + BPX65 + 12 m Mylar + 10 m Al Spectra + BPX65 + 12 m Mylar + 30 m Al
μμ
μμμ
Fig. 11 Computed spectra of oxygen plasma at electron temperature
Te = 200 eV through different sets of filters [BPX65 PIN diode with
12 lm aluminized Mylar (D.1), BPX65 PIN diode with 12 lm
aluminized mylar coupled to aluminum foil thickness of 10 lm (D.2),
and BPX65 PIN diode with 12 lm aluminized mylar coupled to
aluminum foil thickness of 30 lm (D.3)]
Fig. 12 Calculated X-ray ratio (R = I/I0) curves of BPX65 PIN
diode coupled to mylar (12 lm) and sets of BPX65 PIN diode
coupled to mylar (12 lm) with different aluminum foil thicknesses
(10, 20, 30, 40, and 90 lm) for X-rays of nitrogen plasma (NLTE,
Ne = 1019 cm-3) at various temperatures
0 10 20 30 401E-3
0.01
0.1
1
Rat
io
Al foil thickness ( m)
Spectra of oxygen plasmaNe = 1e19, NLTE
Te = 100 eV
Te = 150 eV
Te = 200 eV
μ
Fig. 13 Calculated X-ray ratio (R = I/I0) curves of BPX65 PIN
diode coupled to mylar (12 lm) and sets of BPX65 PIN diode
coupled to mylar (12 lm) with different aluminum foil thicknesses
(10, 20, 30, 40, and 50 lm) for X-rays of oxygen plasma (NLTE,
Ne = 1019 cm-3) at various temperatures
682 J Fusion Energ (2014) 33:677–683
123

References
1. M. Shafiq et al., Mod. Phys. Lett. B 16(9), 309 (2002)
2. M. Shafiq et al., J. Fusion Energ, 20(3), 113 (2001) (q 2002)
3. N.K. Neog et al., J. Appl. Phys. 99, 013302 (2006)
4. A. Roomi et al., J. Fusion Energ (2011). doi:10.1007/s10894-011-
9395-2
5. M. A. I. Elgarhy, M. Sc. Thesis, Plasma Focus and its Applica-
tions, Cairo (2010)
6. R. Lebert, W. Neff, D. Rothweiler, J. X-ray Sci. Tech. 6, 2 (1996)
7. R. Lebert, D. Rothweiler, A. Engel, K. Bergmann, W. Neff, Opt.
Quant. Electron. 28, 241–259 (1996)
8. F. Richer et al., Dense z-pinches. Second International Confer-
ence (1989), New York/NY: AIP, (AIP Conference Proceedings
195) (1989)
9. R. Lebert, A. Engel, W. Neff, J. Appl. Phys. 78(11), 6414–6420
(1995)
10. I.V. Fomenkov, N.R. Bowering, C.L. Retting, S.T. Melnychuk,
I.R. Oliver, J.R. Hoffman, O.V. Khodykin, R.M. Ness, W.N.
Partlo, J. Phys. D Appl. Phys. 37, 3266 (2004)
11. I.V. Fomenkov, R.M. Ness, I.R. Oliver, S.T. Melnychuk, O.V.
Khodykin, N.R. Bowering, C.L. Retting, J.R. Hoffman, Proc.
SPIE 5374, 168 (2004)
12. R. Mongkolnavin, P. Tangitsomboon, C. San Wong, J. Sci.
Technol. Trop. 6, 43 (2010)
13. V. Banine, R. Moors, J. Phys. D Appl. Phys. 37, 3207 (2004)
14. S.R. Mohanty et al., Microelectron. Eng. 65, 47 (2003)
15. D. Hong et al., Rev. Sci. Instrum. 71, 15 (2000)
16. G. Xiaoming et al., Proc. SPIE 4343, 491 (2001)
17. S. Saboohi, S.L. Yap, L.S. Chan, C.S. Wong, IEEE Trans. Plasma
Sci. (Part 2) 40(12), 3390 (2012)
18. I.V. Fomenkov et al., Proc. SPIE 5037, 807 (2003)
19. R.S. Rawat et al., Plasma Sources Sci. Technol. 13, 569 (2004)
20. D. Rastovic, Transport theory and systems theory. Nucl. Technol.
Radiat. Prot. 20(1), 50 (2005)
21. D. Rastovic, Fractional variational problems and particle in cell
gyrokinetic simulation with fuzzy logic approach for tokamaks.
Nucl. Technol. Radiat. Prot. 24(2), 138 (2009)
22. D. Rastovic, Feedback stabilization of some classes of nonlinear
transport systems. Rendiconti del Circolo Matematico di Palermo
51(2), 325 (2002)
23. H.K. Chunga, W.L. Morgan, R.W. Lee, J. Quant. Spectrosc.
Radiat. Transf. 81, 107 (2003)
24. G.J. Phillips, J.S. Wark, F.M. Kerr, S.J. Rose, R.W. Lee, High
Energy Density Phys. 4, 18 (2008)
25. R.W. Lee, Manual—the how to for fly (1995)
26. H.K. Chung, R.W. Lee, M.H. Chen, Y. Ralchenko, Manual—the
how to for FLYCHK @ NIST (2008)
27. R.W. Lee, User Manual for RATION, Lawrence Liver more
National Laboratory (1990)
28. C.J. Keane, R.W. Lee, J.P. Grandy, DSP: A detailed spectroscopy
postprocessor for H-, He-, and Li-like ions. UCRL-JC—106737,
DE91 009475. Lawrence Livermore National Laboratory Livei-
more, CA. Proceedings of the International Workshop on Radi-
ative Properties of Hot Dense Matter Sarasota, Florida, February
22 (1991)
29. R.W. Lee, B.L. Whitten, R.E. Strout, J. Quant. Spectrosc. Radiat.
Transf. 32, 91 (1984)
30. S.H. Kim, D.E. Kim, T.N. Lee, IEEE Trans. Plasma Sci. 26(4),
1108 (1998)
31. C. Dumitrescu-Zoita, Ph.D. Thesis, Universite de Paris Sud.
(1996)
32. M. Akel, S. Alsheikh Salo, C.S. Wong, J. Fusion Energ 32(4),
503–508 (2013)
33. M. Akel, Sh. Al-Hawat, S. Lee, J. Fusion Energ 28(4), 355–363
(2009)
34. S. Lee, Radiative Dense Plasma Focus Computation Package:
RADPF. http://www.plasmafocus.net; http://www.intimal.edu.
my/school/fas/UFLF/(archivalwebsites) (2014)
35. S. Lee, J. Fusion Energ. Online 4 March. doi:10.1007/s10894-
014-9683-8 (2014)
36. M. Akel, Sh. Al-Hawat, S.H. Saw, S. Lee, J. Fusion Energ 28(4),
355–363 (2009)
37. M. Akel, S. Lee, J. Fusion Energ 32(1), 121–127 (2013)
38. M. Akel, S. Lee, J. Fusion Energ 32(1), 107–110 (2013)
39. M. Akel, J. Fusion Energ 32(4), 464–470 (2013)
40. M. Akel, J. Fusion Energ 32(5), 523–530 (2013)
41. C.S. Wong, J. Fiz. Malays. 23, 4 (2002)
42. F.C. Jahoda et al., Phys. Rev. 119, 843 (1960)
43. R.C. Elton, Determination of electron temperatures between
50 eV and 100 keV from X-ray continuum radiation in plasmas.
NRL Report, 6738 (1968)
44. C.S. Wong et al., Malays. J. Sci. 17B, 109 (1996)
45. R. Mongkolnavin et al., J. Fiz. Malays. 25(3–4), 87 (2004)
46. C.M. Ng et al., IEEE Trans. Plasma Sci. 26, 4 (1998)
47. S.P. Moo, C.S. Wong, J. Fiz. Malays. 15, 37 (1994)
48. Sh. Al-Hawat, M. Akel, C.S. Wong, J. Fusion Energ 30(6), 503
(2011)
49. M. Akel, S. Alsheikh Salo, C.S. Wong, J. Fusion Energ 32(3),
350–354 (2013)
50. M. Akel, S. Alsheikh Salo, S. Saboohi, C.S. Wong, Vacuum 101,
360–366 (2014)
J Fusion Energ (2014) 33:677–683 683
123