simulation of interstitial nanoparticle flow for … of interstitial nanoparticle flow for...
TRANSCRIPT
Simulation of Interstitial Nanoparticle Flow for Development of Tumor-on-a-Chip Device Melissa P. Vidal-Meza1, Ran Zhou2, Sutapa Barua1, Cheng Wang2, and Joontaek Park*1 1Chemical and Biochemical Engineering Department, Missouri University of Science and Technology, Rolla, MO, USA 2Mechanical and Aerospace Engineering Department, Missouri University of Science and Technology, Rolla, MO, USA *Corresponding author: 1101 N State St., 110 Bertelsmeyer Hall, Rolla, MO, 65409, USA, [email protected] Abstract: A simulation was performed to investigate the flow behaviors of drug delivery nanoparticles in a tumor-on-a-chip microfluidic device, which mimics a tumor cell having endothelial cells with micro-sized gaps. The Navier-Stokes equation and the convection-diffusion equation were used to model the flow field and the time-dependent particle distribution in the device, respectively. We investigated the effect of the drug delivery nanoparticle size on the particle transport from microchannel (mimicking blood stream) into the tumor chamber (tumor cell) through porous arrays (gaps in endothelial cells). The amount of particles transferred into the tumor was measured to estimate the flux of nanoparticles through the porous arrays. The results can give important information of the nanoparticle size effects in drug delivery systems, which is also able to improve the efficacy of therapy treatments. Keywords: Microfluidics, drug delivery, tumor, cell-on-a-chip, nanoparticle flow 1. Introduction
A numerical simulation using COMSOL Multiphysics® was performed to study the flow behaviors of nanoparticles in a microfluidic device, which mimics a drug delivery system in tumor tissues. This microfluidic device, a tumor-on-a-chip, is under development for the efficient study of drug delivery to tumor cells, and to also avoid complicated and costly animal studies [1,2].
Tumors are complex structures with
interweaving connections among multiple irregular and leaky blood vessels. The arrangement of blood vessels in the body, or the vasculature, is usually characterized by tightly connected endothelial cells. These cells form the epithelium, which is what lines the interior surface of blood vessels and forms an interface
between the circulating blood and the rest of the vessel wall. In the case of tumor vasculatures, there are large gaps of about 200μm between the endothelial cells, known as the enhanced permeability and retention effect (EPR), to enhance the transport of nutrients and oxygen into the tumor. Unlike other normal tissues, tumor tissues tend to grow quickly, and they must stimulate the production of blood vessels, which leads to poorly aligned defective endothelial cells and effective lymphatic drainage among many other factors that causes abnormal molecular and fluid transport dynamics [3,4].
EPR is beneficial for nanoparticle drug to
enter into the tumor for therapy. However, due to those factors discussed before, there is limited information about how nanoparticle size affects its movement through these microchannel blood vessels. Thus, it is important to gain a deeper understanding of the effects of nanoparticle geometry in drug delivery systems to be able to improve the efficacy of therapy treatments. Some research has been conducted in this area, but it is still underway [5,6]. One approach to overcome difficulties in drug delivery study is to develop an artificial device which mimics the tumor system [1,2].
In this study, the effect of the drug delivery
nanoparticle size on the particle transport from blood stream into the tumor was investigated utilizing the tumor-on-a-chip device. The flow field in a tumor-on-a chip was simulated and the time-dependent particle concentration distribution in that device was then solved to investigate the amount of particles transferred from microchannel to the tumor region in the device. The outcome can be used in mathematical modeling of the system as well as validation of the performance of the tumor-on-a-chip device.
Excerpt from the Proceedings of the 2016 COMSOL Conference in Boston
1.1 System Description
Our tumor-on-a-chip device under development consists of a tumor tissue microchamber surrounded by porous microarrays (slits), which mimics the micro-sized gaps in the endothelial cells. Microchannels surround the tumor chamber to represent the blood vascular. If nanoparticles are injected in the microchannel flow, some particles will be diffused into the tumor through the slit.
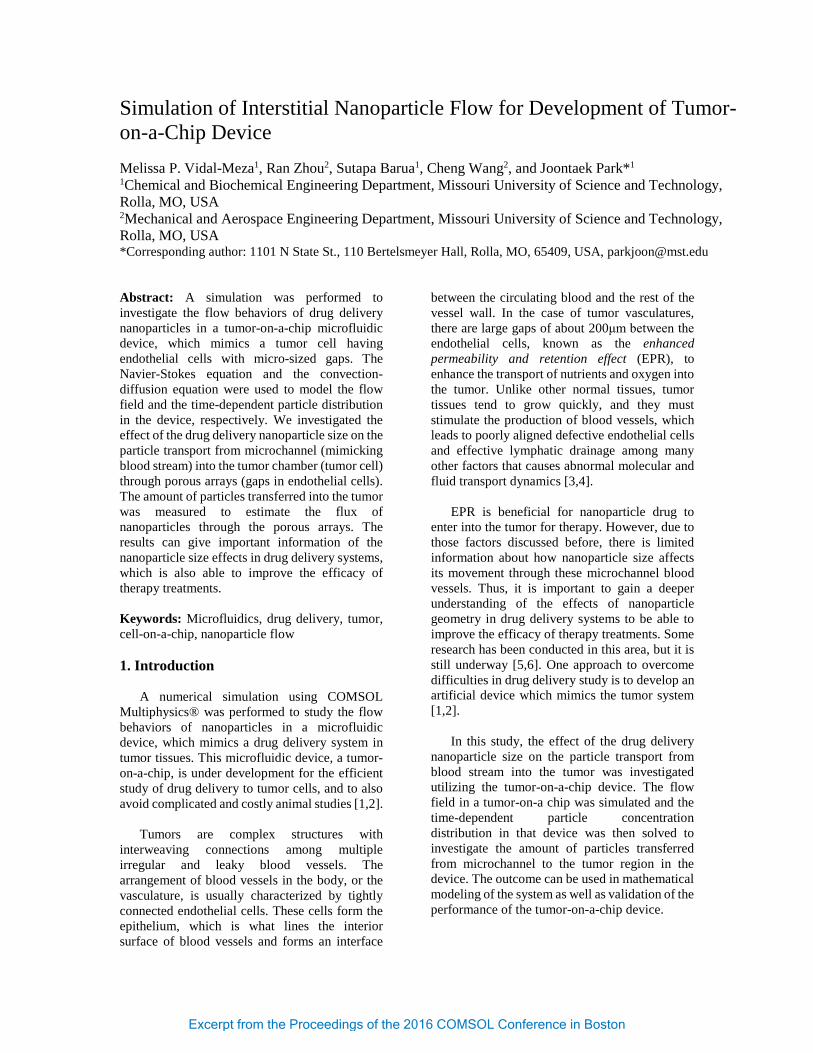
Figure 1. The 2D schematic design of the microfluidic device: The widths of the outer channels (A) and the inner channels (B) are 100µm. The inner-diameters of the tumor chamber (C) and its pillars, with the distance of 50µm with each other, are 1200µm and 25µm, respectively. The slits, with the width of 2µm and length of 100µm, are arrayed with the outer arc distance of 46.9µm (sector angle of 3.84°). The depths of all the channels are 100µm.
Figure 1 shows the schematic design of the synthetic microfluidic device for this study. In the experiment, nanoparticles attached with cancer-treating functional groups will be flowed in the two outer channels (half circular shapes indicated as A in Figure 1), where the endothelial cells will be grown to recreate the interface between the tumor and blood vessels. The inner channels (straight channels at the centerline indicated as B) are only used for introducing tumor cells into the tumor chamber (the middle circular area indicated as C) where the tumor cells will be grown on each small post (the small circles in C). The outer channels and the tumor chamber are interconnected by the slits, which mimic the EPR effect for the nanoparticle transfer into the tumor.
2. Simulation Methods
The simulation in this study was performed as a preliminary study for the experimental study. The effect of the particle size on the particle transfer into the tumor chamber was investigated for a condition where no cells were grown. All the fluid in entire domain was assumed as a Newtonian fluid with the same property as a water (dynamic viscosity, µ=0.001Pa·s and fluid density, ρ=1000kg/m3). Blood and tumor properties will be used in future study. The nanoparticles were assumed as chemically inert and neutrally buoyant spheres. Dilute concentration assumption was made to neglect the inter particle interactions. The inlet and the outlet of the inner channels will be blocked. The particles and the fluid entered/left the inlets/outlets of the outer channels, respectively. 2D geometry was chosen for this simulation assuming the there is no effect in the z-direction (out of plane) on the flow and the concentration. 2.1 Governing Equations
In this study, the fluid field, u, was solved using 2D steady state Navier-Stokes equation and the continuity equation:
𝜌𝜌(𝐮𝐮 ∙ ∇)𝐮𝐮 = ∇ ∙ [−𝑝𝑝𝐈𝐈 + 𝜇𝜇(∇𝐮𝐮 + (∇𝐮𝐮)𝑇𝑇)] (1)
𝜌𝜌∇ ∙ (𝐮𝐮) = 0 (2)
Here, p is a pressure. The inlet velocities of the both outer channels were given as a velocity magnitude of 0.0001m/s, respectively. The outlet conditions of those channels were given as the same as the atmospheric pressure. No slip boundary condition was imposed on all the solid boundaries, including the inlet and the outlet of the inner channels.
Nanoparticle concentration c was solved
using the time-dependent convection-diffusion equation:
𝜕𝜕𝜕𝜕𝜕𝜕𝜕𝜕
+ 𝐮𝐮 ∙ ∇𝜕𝜕 = 𝐷𝐷∇2𝜕𝜕 (3)
𝐷𝐷 =𝑘𝑘𝐵𝐵𝑇𝑇
6𝜋𝜋𝜇𝜇𝜋𝜋 (4)
Excerpt from the Proceedings of the 2016 COMSOL Conference in Boston
Here, D is a diffusion coefficient of a nanoparticle with its radius r. Eq (4) is the Stokes-Einstein equation, where kB=1.38×10⁻²³m2kg/(s2·K) is the Bolztmann constant and T is the absolute temperature, assumed as 293.15K. The inflow condition was given as c=1mol/m3 for the outer channel inlets. 2.2 Implementation in COMSOL
In the “Model Wizard” window, “2D” was chosen as a space domain and “Fluid/Single-Phase Flow/Laminar Flow” as a physics model. This model is provided in the “Fluid Dynamics Module”. “Preset Studies/Stationary” was selected to evaluate steady state flow field u. We defined r and D as the global parameters using “Global Definitions/Parameters”. For kB, we used the built-in physical constant k_B_const, provided by COMSOL.
The 2D representation of the microfluidic
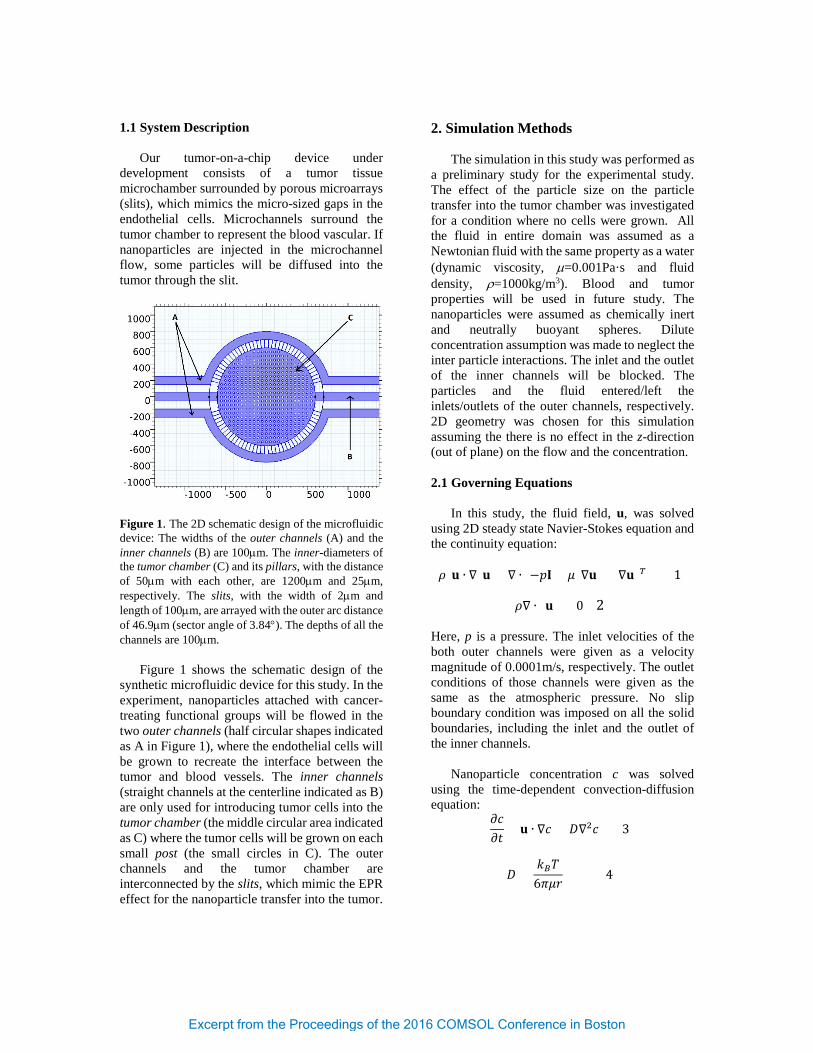
device (Figure 1) was performed using the “Geometry” tools. Instead of describing the details of the whole procedure making of this geometry, we focus on describing how the arrays of the pillars and the slits were made. The “Circle” for a pillar was made with its radius 12.5µm and at the center of x= y= -600µm. The “Array” was applied to the pillar with the array type of “rectangular”, both the x and y sizes of 24, and both the x and y distances of 50µm. The pillars out of the tumor chamber region were manually deleted using the “Delete Entities”. A gap between each slit were made by the “Difference” between two circular sectors with the radii of 600µm and 700µm (the same 3.84° sector angle). The gap was then applied to the “Rotate” with the rotation angle of “range (0,4,356)”. The resulted array of the gaps were applied to the “Difference” with the outer and the inner channel regions to get the slits. Two circles were added using the “Parametric Curve” to separate the slit region and the tumor cell region as separate domains for integrating the total moles of particles in those regions. The triangular meshes were generated in each geometry as shown in Figure 2. Coarser mesh was used in the inner channel domains, which do not give significant effects on the results.
Once the steady state flow field was achieved by solving Eq (1) and Eq (2) in “Study1”, new physics “Transport of Diluted Species” provided in the “Chemical Species Transport Module” was added. “Preset Studies/Time Dependent” was selected to solve for the time-dependent concentration distribution, c. For “Transport Properties”, “Model Inputs” was chosen as “velocity field (spf)” to use the steady state flow filed from “Study1”. “Diffusivity Coefficient” was chosen as “User Defined” to use Eq (4) defined as a global parameter. The “Inflow” conditions were assigned to the inlet of the outer channels to set the inflow “Concentration” as 1 mol/m3. Note here that this value was chosen arbitrarily due to the dilute concentration assumption. The “Outflow” conditions were also assigned to the outlets of the outer channels. The “No Flux” conditions were imposed on all the remaining boundaries.
Figure 2. The triangular meshes generated in the microfluidic device geometry of this study.
For investigation of the particle transport, we
defined Nleak as the total number of moles of the particles in the tumor chamber at time t by integrating c in the tumor cell domain using the “Domain Probe”. The total number of moles of the particles entered into the device at t>0 was also defined as Ntot. “Flux” was also defined as:
𝐹𝐹𝐹𝐹𝐹𝐹𝐹𝐹 =1
2𝜋𝜋𝑡𝑡𝑡𝑡𝑡𝑡𝑡𝑡𝑡𝑡𝜋𝜋𝑑𝑑𝑁𝑁𝑙𝑙𝑙𝑙𝑙𝑙𝑙𝑙𝑑𝑑𝜕𝜕
(5)
Here, rtumor=700 µm is the outer-radius of the tumor chamber, where microchannel contacts. Eq (5) was defined in COMSOL using “Global Probe”.
Excerpt from the Proceedings of the 2016 COMSOL Conference in Boston
Time-dependent solution of c will be solved in “Study2”. In the “Study Settings”, the time range was set up to 300s. In the “Physics and Variable Selection”, the check box for “Laminar Flow” was removed. In the “Values of Dependent Variables”, select the dropdown menus as “Settings/User Controlled”, “Method/Solution”, “Study/Study1, Stationary”, and “Selection/Automatic”. 3. Results and Discussion 3.1 Steady Sate Flow Pattern
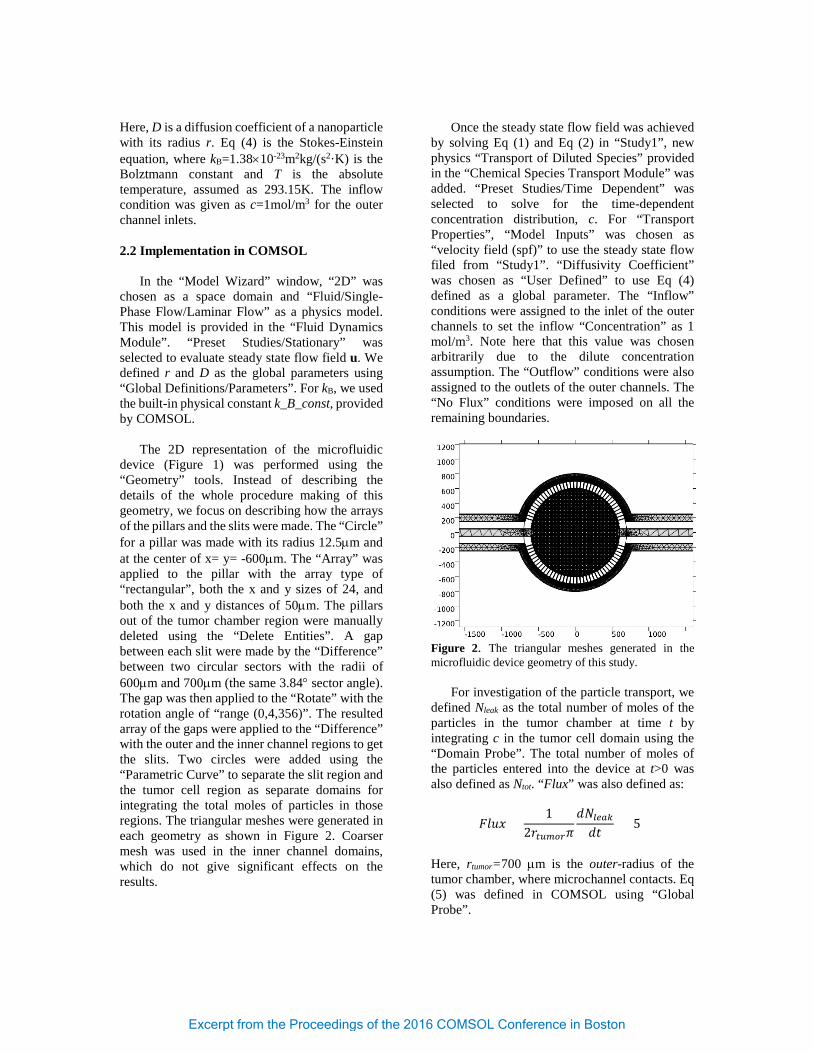
Figure 3. 2D map of the stationary fluid velocity magnitude in the microfluidic device.
Figure 4. 1D line graph of the fluid velocity magnitude in the outer-channel at x=0 µm and y=600-700 µm.
The steady state flow pattern in the microfluidic device is in Figure 3. Almost no flow is detected inside of the tumor chamber, which implies that the particles will be transferred from the outer channels to the tumor chamber mainly by diffusion. Figure 4 shows the velocity profile in the outer-channel at x=0µm and y=600-700µm is a parabolic profile as in the typical pressure-
driven flow, indicating that the effect of the slits on the flow pattern is little.
3.2 Time-Dependent Concentration Profile
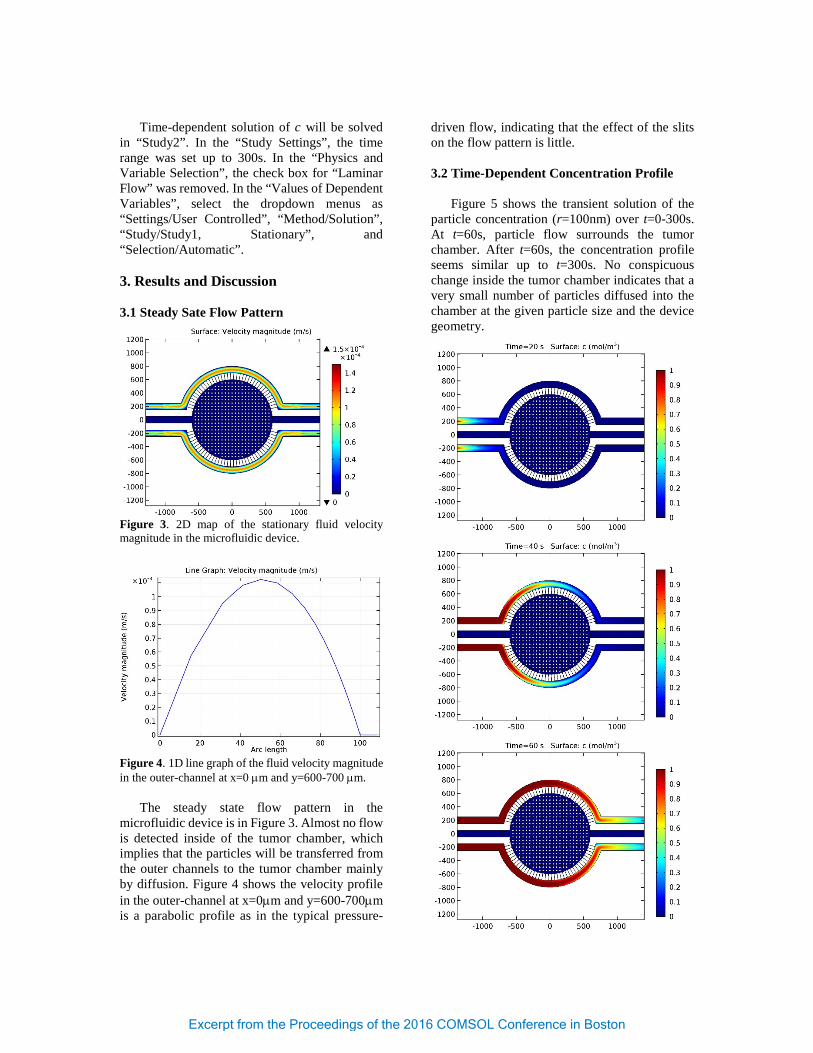
Figure 5 shows the transient solution of the particle concentration (r=100nm) over t=0-300s. At t=60s, particle flow surrounds the tumor chamber. After t=60s, the concentration profile seems similar up to t=300s. No conspicuous change inside the tumor chamber indicates that a very small number of particles diffused into the chamber at the given particle size and the device geometry.
Excerpt from the Proceedings of the 2016 COMSOL Conference in Boston
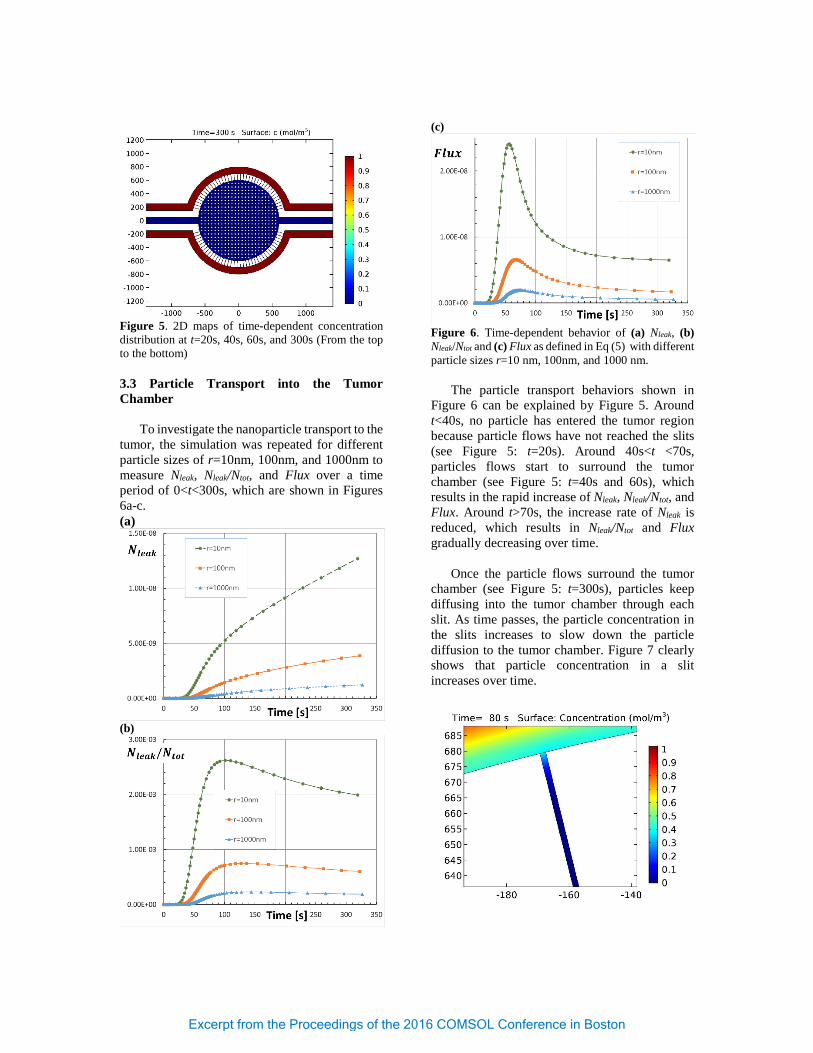
Figure 5. 2D maps of time-dependent concentration distribution at t=20s, 40s, 60s, and 300s (From the top to the bottom) 3.3 Particle Transport into the Tumor Chamber
To investigate the nanoparticle transport to the tumor, the simulation was repeated for different particle sizes of r=10nm, 100nm, and 1000nm to measure Nleak, Nleak/Ntot, and Flux over a time period of 0<t<300s, which are shown in Figures 6a-c. (a)
(b)
(c)
Figure 6. Time-dependent behavior of (a) Nleak, (b) Nleak/Ntot and (c) Flux as defined in Eq (5) with different particle sizes r=10 nm, 100nm, and 1000 nm.
The particle transport behaviors shown in Figure 6 can be explained by Figure 5. Around t<40s, no particle has entered the tumor region because particle flows have not reached the slits (see Figure 5: t=20s). Around 40s<t <70s, particles flows start to surround the tumor chamber (see Figure 5: t=40s and 60s), which results in the rapid increase of Nleak, Nleak/Ntot, and Flux. Around t>70s, the increase rate of Nleak is reduced, which results in Nleak/Ntot and Flux gradually decreasing over time.
Once the particle flows surround the tumor
chamber (see Figure 5: t=300s), particles keep diffusing into the tumor chamber through each slit. As time passes, the particle concentration in the slits increases to slow down the particle diffusion to the tumor chamber. Figure 7 clearly shows that particle concentration in a slit increases over time.
Excerpt from the Proceedings of the 2016 COMSOL Conference in Boston
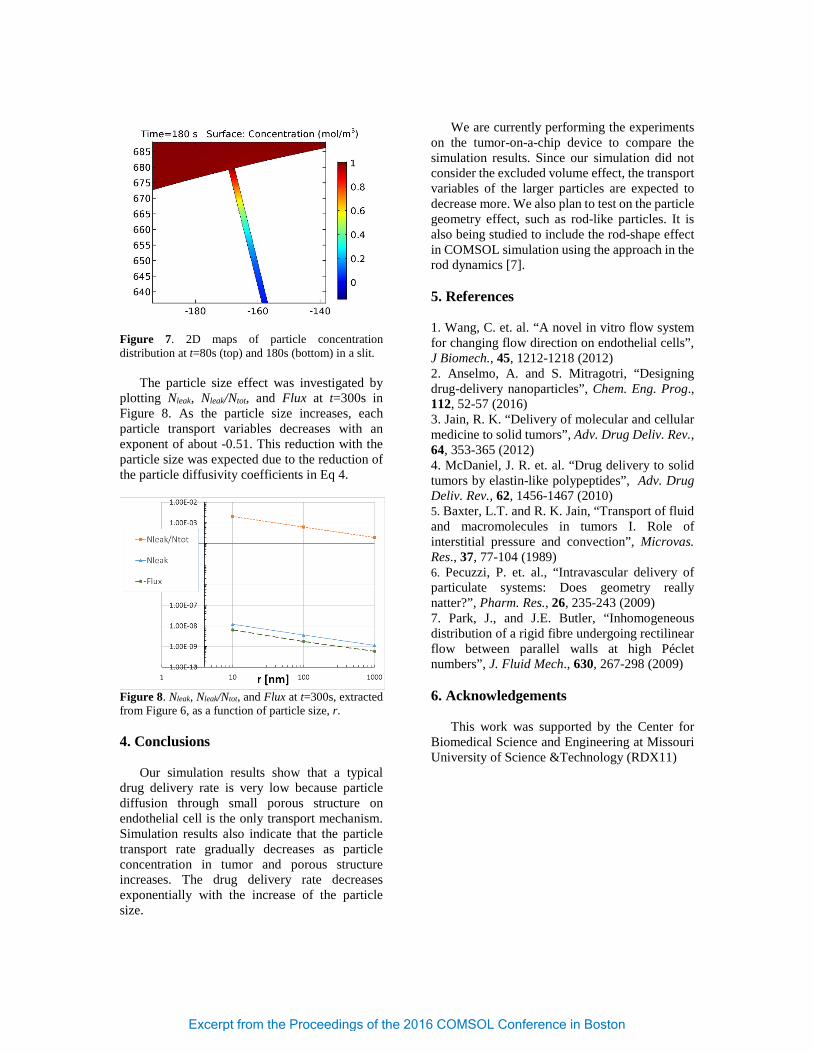
Figure 7. 2D maps of particle concentration distribution at t=80s (top) and 180s (bottom) in a slit. The particle size effect was investigated by plotting Nleak, Nleak/Ntot, and Flux at t=300s in Figure 8. As the particle size increases, each particle transport variables decreases with an exponent of about -0.51. This reduction with the particle size was expected due to the reduction of the particle diffusivity coefficients in Eq 4.
Figure 8. Nleak, Nleak/Ntot, and Flux at t=300s, extracted from Figure 6, as a function of particle size, r. 4. Conclusions
Our simulation results show that a typical drug delivery rate is very low because particle diffusion through small porous structure on endothelial cell is the only transport mechanism. Simulation results also indicate that the particle transport rate gradually decreases as particle concentration in tumor and porous structure increases. The drug delivery rate decreases exponentially with the increase of the particle size.
We are currently performing the experiments on the tumor-on-a-chip device to compare the simulation results. Since our simulation did not consider the excluded volume effect, the transport variables of the larger particles are expected to decrease more. We also plan to test on the particle geometry effect, such as rod-like particles. It is also being studied to include the rod-shape effect in COMSOL simulation using the approach in the rod dynamics [7]. 5. References 1. Wang, C. et. al. “A novel in vitro flow system for changing flow direction on endothelial cells”, J Biomech., 45, 1212-1218 (2012) 2. Anselmo, A. and S. Mitragotri, “Designing drug-delivery nanoparticles”, Chem. Eng. Prog., 112, 52-57 (2016) 3. Jain, R. K. “Delivery of molecular and cellular medicine to solid tumors”, Adv. Drug Deliv. Rev., 64, 353-365 (2012) 4. McDaniel, J. R. et. al. “Drug delivery to solid tumors by elastin-like polypeptides”, Adv. Drug Deliv. Rev., 62, 1456-1467 (2010) 5. Baxter, L.T. and R. K. Jain, “Transport of fluid and macromolecules in tumors I. Role of interstitial pressure and convection”, Microvas. Res., 37, 77-104 (1989) 6. Pecuzzi, P. et. al., “Intravascular delivery of particulate systems: Does geometry really natter?”, Pharm. Res., 26, 235-243 (2009) 7. Park, J., and J.E. Butler, “Inhomogeneous distribution of a rigid fibre undergoing rectilinear flow between parallel walls at high Péclet numbers”, J. Fluid Mech., 630, 267-298 (2009) 6. Acknowledgements
This work was supported by the Center for Biomedical Science and Engineering at Missouri University of Science &Technology (RDX11)
Excerpt from the Proceedings of the 2016 COMSOL Conference in Boston