simulation of hobbing and generation grinding to solve ... · simulation of hobbing and generation...
TRANSCRIPT
15FTM12
AGMA Technical Paper
Simulation of Hobbing and Generation Grinding to Solve Quality and Noise Problems
By Prof. Dr.-Ing. Günther Gravel,
Hamburg University of Applied Sciences
1 15FTM12
Simulation of Hobbing and Generation Grinding to Solve Quality and Noise Problems
Prof. Dr.-Ing. Günther Gravel
[The statements and opinions contained herein are those of the author and should not be construed as an official action or opinion of the American Gear Manufacturers Association.]
Abstract
Due to increasing tolerance requirements for gearboxes and gears, it has become more and more important to establish quality circles in production. A quick detection and correction of the causes of tolerance violation is essential for high quality. This paper shows the possibilities and procedures of searching for the root cause in general, especially with problems in hobbing and generation grinding using multi-start tools.
A new simulation tool has been developed, which allows for the simulation of typical faults that occur during hobbing and generation grinding. The calculated contour on the workpiece is treated as a measured curve, making it easy to compare workpiece measurements and simulations. In this way, possible error causes can be simulated and compared with the real gear surface.
This paper uses practical examples to demonstrate the following applications for simulation. The influence of the tool parameter’s "number of starts" and "number of flutes" on the cutting result is shown in connection with the axial feed parameter. Protuberance and tooth tip rounding on the tool influence the profile form generated on the workpiece. Wobble and eccentric in the tool clamping creates an s-shaped pattern on the profile, based on the number of starts on the tool. The form of the pattern changes with different parameters.
In high-speed gearboxes, ripples on the gear surfaces are frequently the cause of noise problems. Simulation of a tool error and a subsequent evaluation of the ripples enable conclusions to be drawn about the excitations caused by the tool error during the cutting process. A practical comparison between the ripple measurement of a hobbed and subsequently honed gear and the simulation shows that the noise-related ripples on the finished part arises already in the pre-machining stage.
The applications presented in this paper show that the results of the simulation are a very good match with practical tests. Thus, the simulation software is a highly precise tool for determining and eliminating the causes of deviations in production. At the same time, design engineers and planners can quickly and easily develop new process and tool designs, thereby significantly reducing the costs involved in testing.
Copyright © 2015
American Gear Manufacturers Association 1001 N. Fairfax Street, Suite 500 Alexandria, Virginia 22314
October 2015
ISBN: 978-1-55589-023-0
2 15FTM12
Simulation of Hobbing and Generation Grinding to Solve Quality and Noise Problems
Prof. Dr.-Ing. Günther Gravel
Introduction
Due to its high productivity and accuracy, generation manufacturing of gearing is widely used in gear production [1], [2]. When deviations do occur, however, it is not easy to pinpoint the causes, due to the tool design and complex kinematics. This is particularly true of multiple-start tools, which are being used with increasing frequency due to their higher productivity. In such cases, the effect of tool deviations and clamping errors on workpiece quality can only be predicted in a simplified manner and with a great deal of expert knowledge. This article will demonstrate how the causes of error and cause variables can be determined through the use of a newly developed simulation tool.
Searching for reasons for variance
As the tolerance requirements for gears become more and more stringent, manufacturing well within the tolerance limits becomes increasingly challenging. If tolerance violations do occur during testing, it is imperative to quickly determine the causes and to correct them. This is equally true when impermissible noise levels are measured on the end-of-line test rig. The problematic component in the transmission is first identified through component replacement testing.
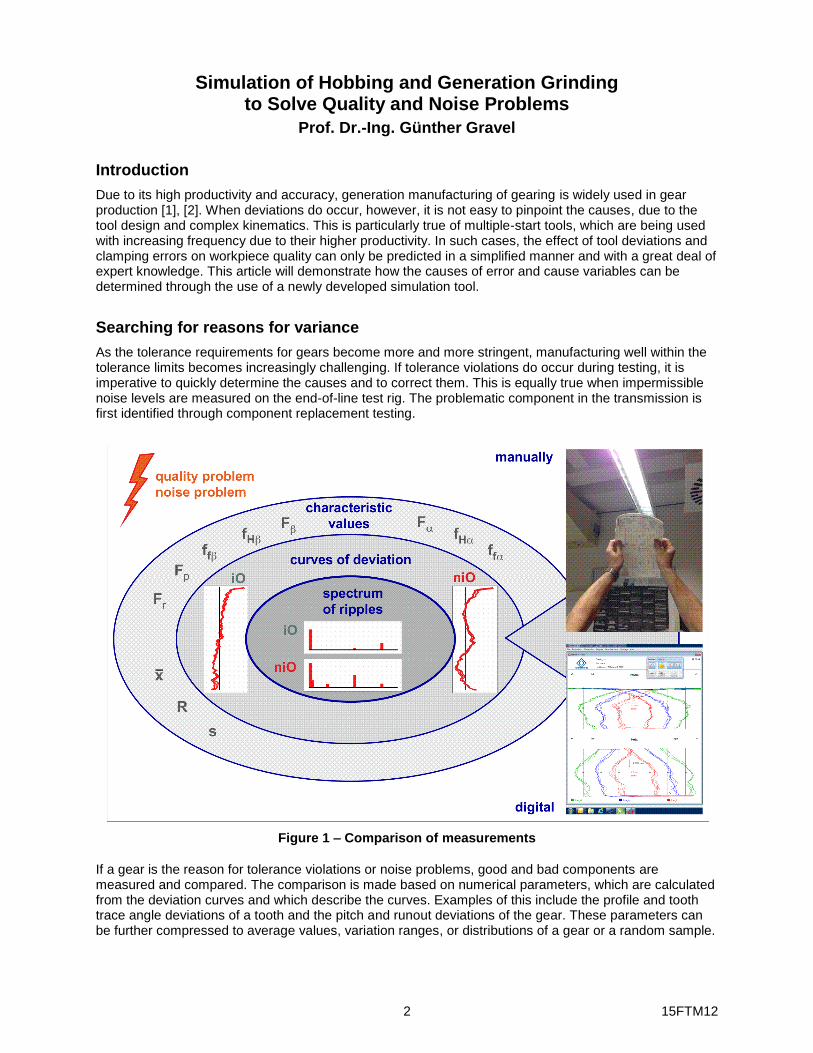
Figure 1 – Comparison of measurements
If a gear is the reason for tolerance violations or noise problems, good and bad components are measured and compared. The comparison is made based on numerical parameters, which are calculated from the deviation curves and which describe the curves. Examples of this include the profile and tooth trace angle deviations of a tooth and the pitch and runout deviations of the gear. These parameters can be further compressed to average values, variation ranges, or distributions of a gear or a random sample.

3 15FTM12
If this results in no significant difference between good and bad components, further investigation is needed [3], as shown in Figure 1. A comparison of the patterns and form of the measured deviation curves is frequently performed in practice by superposing two measurement printouts and holding them up to the light (at top right in Figure 1). Every user is familiar with this method and knows how tedious and inconvenient this method is. Thanks to the ability to save measurement curves, today there are evaluation programs that enable a simple digital comparison of curves. The simulation program presented below enables such an easy comparison of deviation curves based on measurements and simulations.
With noise problems in particular, this graphical comparison is often insufficient for detecting differences between quiet and noisy gears. The noise may be caused by periodic structures on the tooth flank which exhibit amplitudes of just a few tenths of a micrometer and which are overlapped by the deviations in form [4], [5]. Calculation of the common ripple spectrum of the profile and tooth trace curves enables a more detailed analysis of noisy and quiet gears and a targeted search for the noise-provoking influences [6].
Figure 2 – Searching for the root causes of deviations
The process of comparing parameters, deviation curves, and ripple spectra still does not provide an explanation of the reasons for the deviations. The comparison is merely an important component of comprehensive investigations undertaken to identify the cause (Figure 2). In this process—which often takes place according to the trial-and-error principle—tools or process parameters are modified, and workpieces are then manufactured. The comparison after the measurement shows whether significant changes have occurred. This process is extremely costly in terms of time and outlay, since tools must be modified and actual production is required. The test results are also always affected by the sum of all influences from the tool and machine tool, which are never ideally error-free. Thus, the influence of a small change in a single parameter frequently cannot be evaluated in practice.
An alternative to this complex process is a simulation of the production process (and the resulting deviations) with computer programs [7], [8]. Compared with production and measurement, the calculations in this case are significantly faster and error-free tools and error-free machine movements can be assumed. The influence of a small parameter change is clearly detectable if an effect does occur.
4 15FTM12
Simulation of hobbing and generation grinding
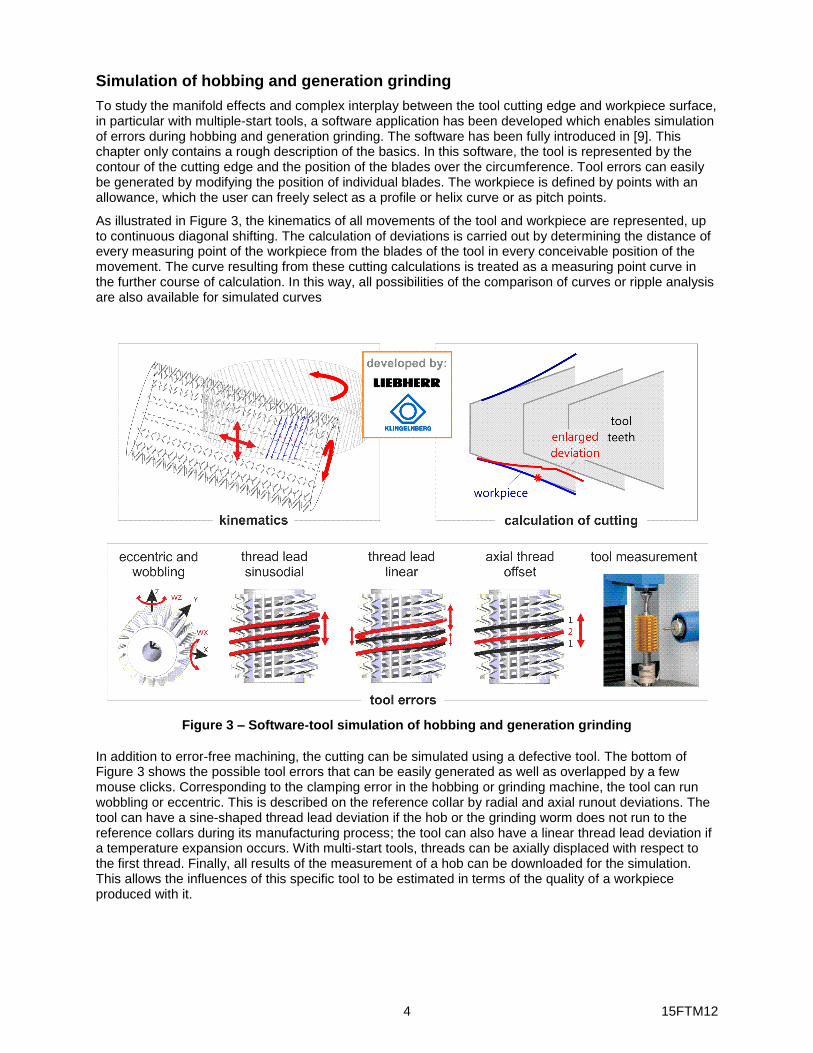
To study the manifold effects and complex interplay between the tool cutting edge and workpiece surface, in particular with multiple-start tools, a software application has been developed which enables simulation of errors during hobbing and generation grinding. The software has been fully introduced in [9]. This chapter only contains a rough description of the basics. In this software, the tool is represented by the contour of the cutting edge and the position of the blades over the circumference. Tool errors can easily be generated by modifying the position of individual blades. The workpiece is defined by points with an allowance, which the user can freely select as a profile or helix curve or as pitch points.
As illustrated in Figure 3, the kinematics of all movements of the tool and workpiece are represented, up to continuous diagonal shifting. The calculation of deviations is carried out by determining the distance of every measuring point of the workpiece from the blades of the tool in every conceivable position of the movement. The curve resulting from these cutting calculations is treated as a measuring point curve in the further course of calculation. In this way, all possibilities of the comparison of curves or ripple analysis are also available for simulated curves
Figure 3 – Software-tool simulation of hobbing and generation grinding
In addition to error-free machining, the cutting can be simulated using a defective tool. The bottom of Figure 3 shows the possible tool errors that can be easily generated as well as overlapped by a few mouse clicks. Corresponding to the clamping error in the hobbing or grinding machine, the tool can run wobbling or eccentric. This is described on the reference collar by radial and axial runout deviations. The tool can have a sine-shaped thread lead deviation if the hob or the grinding worm does not run to the reference collars during its manufacturing process; the tool can also have a linear thread lead deviation if a temperature expansion occurs. With multi-start tools, threads can be axially displaced with respect to the first thread. Finally, all results of the measurement of a hob can be downloaded for the simulation. This allows the influences of this specific tool to be estimated in terms of the quality of a workpiece produced with it.
5 15FTM12
Simulation of influences of the tool and process parameters
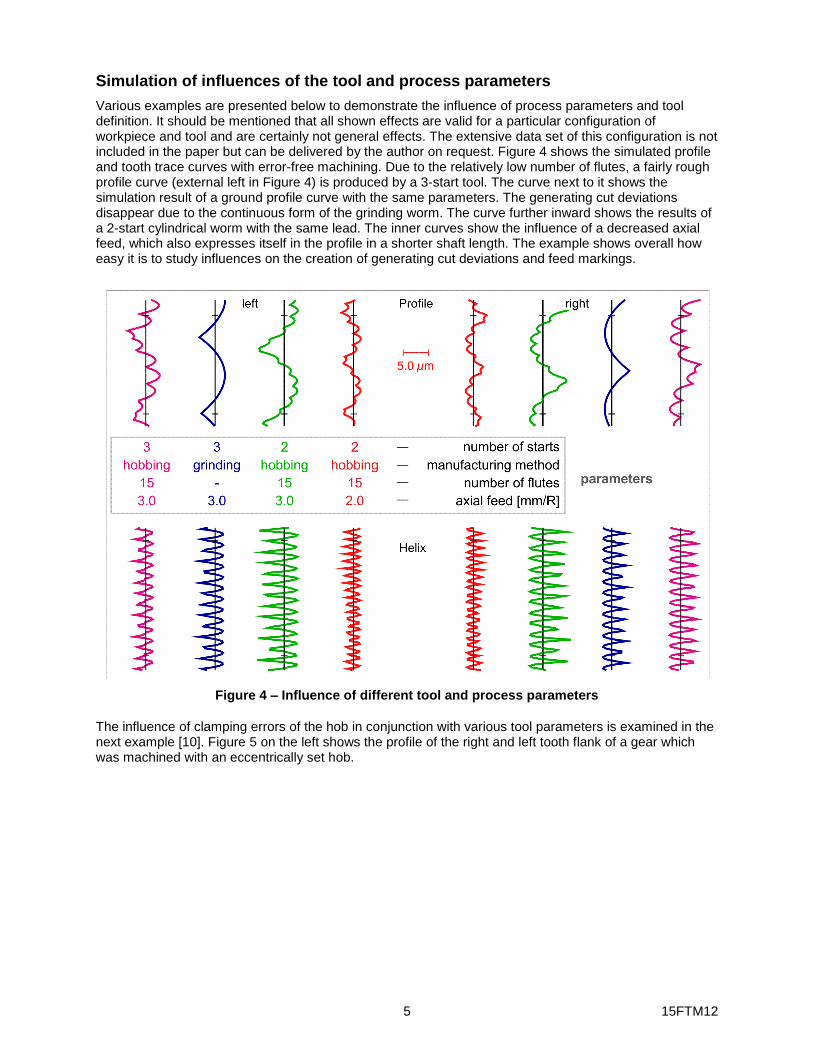
Various examples are presented below to demonstrate the influence of process parameters and tool definition. It should be mentioned that all shown effects are valid for a particular configuration of workpiece and tool and are certainly not general effects. The extensive data set of this configuration is not included in the paper but can be delivered by the author on request. Figure 4 shows the simulated profile and tooth trace curves with error-free machining. Due to the relatively low number of flutes, a fairly rough profile curve (external left in Figure 4) is produced by a 3-start tool. The curve next to it shows the simulation result of a ground profile curve with the same parameters. The generating cut deviations disappear due to the continuous form of the grinding worm. The curve further inward shows the results of a 2-start cylindrical worm with the same lead. The inner curves show the influence of a decreased axial feed, which also expresses itself in the profile in a shorter shaft length. The example shows overall how easy it is to study influences on the creation of generating cut deviations and feed markings.
Figure 4 – Influence of different tool and process parameters
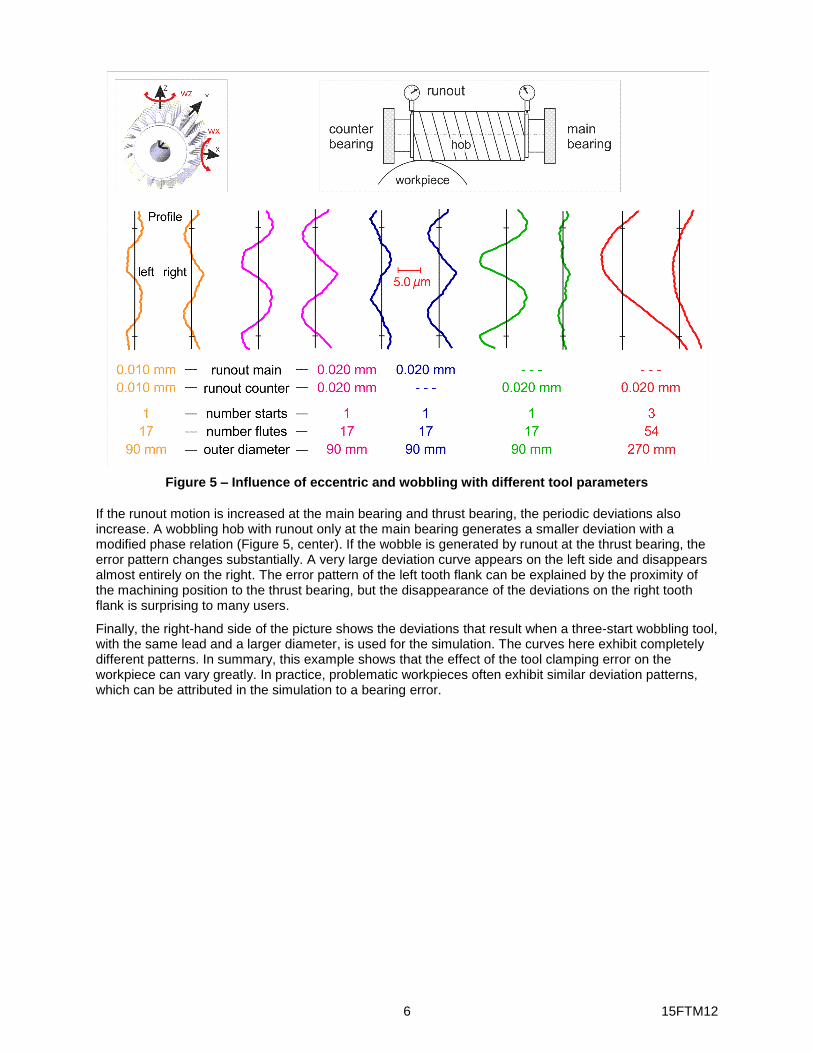
The influence of clamping errors of the hob in conjunction with various tool parameters is examined in the next example [10]. Figure 5 on the left shows the profile of the right and left tooth flank of a gear which was machined with an eccentrically set hob.
6 15FTM12
Figure 5 – Influence of eccentric and wobbling with different tool parameters
If the runout motion is increased at the main bearing and thrust bearing, the periodic deviations also increase. A wobbling hob with runout only at the main bearing generates a smaller deviation with a modified phase relation (Figure 5, center). If the wobble is generated by runout at the thrust bearing, the error pattern changes substantially. A very large deviation curve appears on the left side and disappears almost entirely on the right. The error pattern of the left tooth flank can be explained by the proximity of the machining position to the thrust bearing, but the disappearance of the deviations on the right tooth flank is surprising to many users.
Finally, the right-hand side of the picture shows the deviations that result when a three-start wobbling tool, with the same lead and a larger diameter, is used for the simulation. The curves here exhibit completely different patterns. In summary, this example shows that the effect of the tool clamping error on the workpiece can vary greatly. In practice, problematic workpieces often exhibit similar deviation patterns, which can be attributed in the simulation to a bearing error.
7 15FTM12
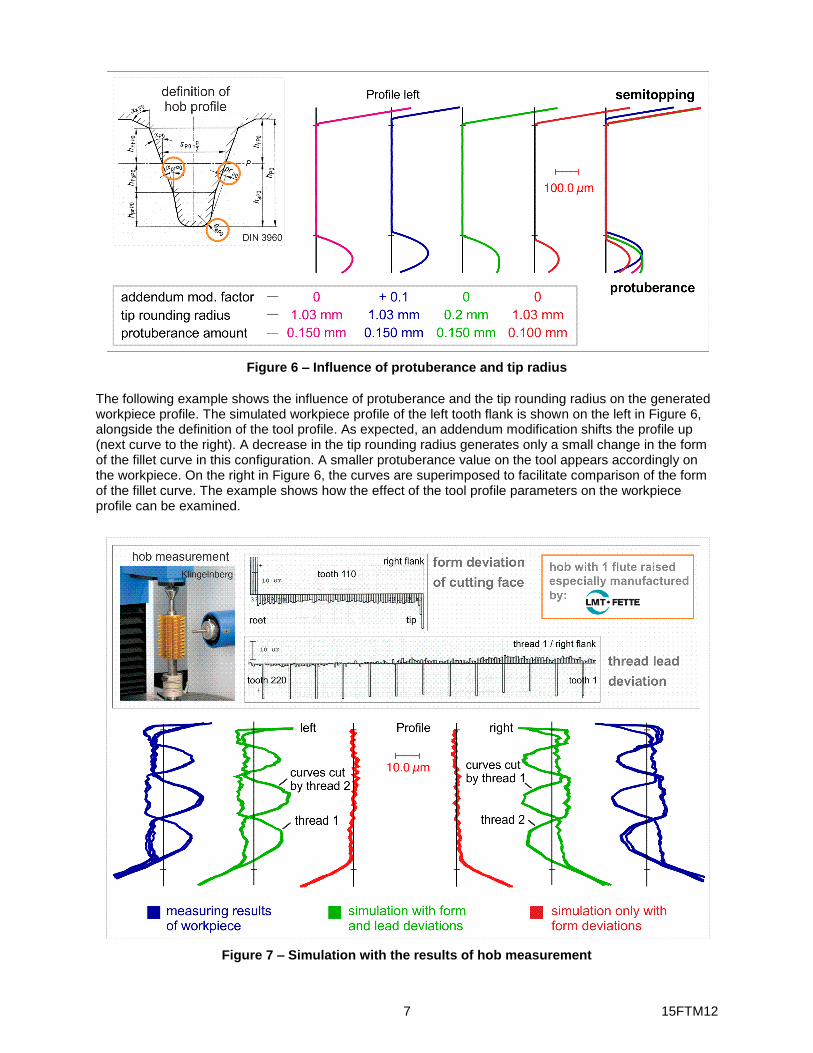
Figure 6 – Influence of protuberance and tip radius
The following example shows the influence of protuberance and the tip rounding radius on the generated workpiece profile. The simulated workpiece profile of the left tooth flank is shown on the left in Figure 6, alongside the definition of the tool profile. As expected, an addendum modification shifts the profile up (next curve to the right). A decrease in the tip rounding radius generates only a small change in the form of the fillet curve in this configuration. A smaller protuberance value on the tool appears accordingly on the workpiece. On the right in Figure 6, the curves are superimposed to facilitate comparison of the form of the fillet curve. The example shows how the effect of the tool profile parameters on the workpiece profile can be examined.
Figure 7 – Simulation with the results of hob measurement
8 15FTM12
The last example describes the ways to carry out a simulation with measured tool deviations. In order to test the assignment of measuring points in the software, a special two-thread hob was made where all flutes except one were reground. The teeth on this one raised flute generate a large negative deviation on the workpiece, which is not reworked by other teeth. The deviations of the hob measurement are shown at the top of Figure 7 [11], [12]. The results of the measurement of a workpiece produced with the hob, as well as the simulation results, are shown in a side-by-side comparison at the bottom of Figure 7. The curves of all teeth are superimposed and exhibit in alternation the deviations generated by start 1 and 2.
In the center of Figure 7, only the form deviations of the cutting edge profile for the hob measurement were used for the simulation. The deviations caused by the lead disappear, and the transfer of the form deviations at the tip of the hob onto the root area of the workpiece becomes apparent. In summary, this example shows an excellent match between measurement of manufactured components and the results of simulation using the data from the hob measurement.
Ripple analysis of simulated deviation curves
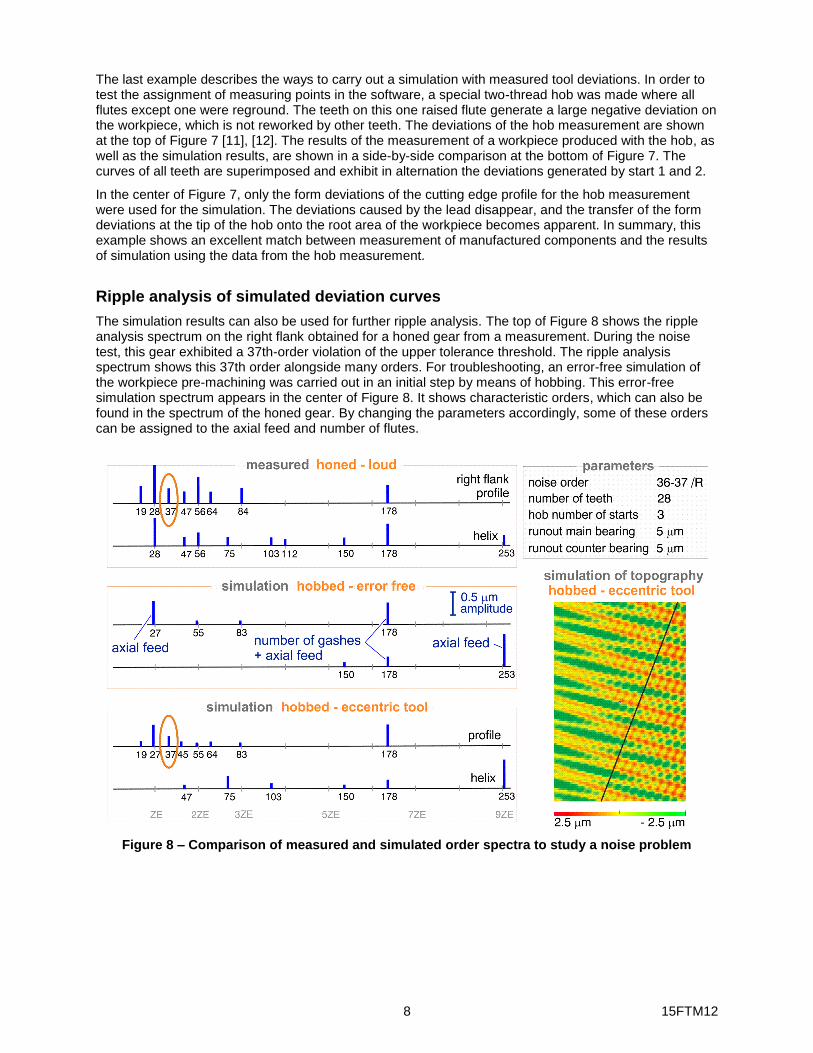
The simulation results can also be used for further ripple analysis. The top of Figure 8 shows the ripple analysis spectrum on the right flank obtained for a honed gear from a measurement. During the noise test, this gear exhibited a 37th-order violation of the upper tolerance threshold. The ripple analysis spectrum shows this 37th order alongside many orders. For troubleshooting, an error-free simulation of the workpiece pre-machining was carried out in an initial step by means of hobbing. This error-free simulation spectrum appears in the center of Figure 8. It shows characteristic orders, which can also be found in the spectrum of the honed gear. By changing the parameters accordingly, some of these orders can be assigned to the axial feed and number of flutes.
Figure 8 – Comparison of measured and simulated order spectra to study a noise problem
9 15FTM12
In a second step, an eccentric hob setting was simulated with runout deviations of 5 µm each at the main bearing and thrust bearing. The resulting spectrum now also shows the 37th order alongside many new orders. The many orders occur as side bands to the mesh orders [13] obtained from the ratio of the number of workpiece teeth to the number of tool starts, which is equal to 28:3. A simulation with numerous profile curves produces the topography shown on the right-hand side of Figure 8. The deviation pattern is complex and consists accordingly of many periodic deviations that occur at various lead angles along the flank. The sloping line on the topography corresponds to the base helix angle. Tooth contact during generating with the mating gear takes place on lines parallel to this one.
The comparison of measurement frequencies and simulation suggests that almost all frequencies of the honed gear occur during the cutting stage. Since the workpiece has been completely reworked during honing, the honing wheel appears to follow the existing ripples. It should be clearly noted that simulation with these small deviations cannot describe the actual resulting workpiece surface. The effects of chip generation and the machine-tool-workpiece vibration system also come into play here. The simulation in this case merely provides evidence of excitations resulting from tool errors, which can thus aid in troubleshooting.
Summary
The search for the causes of deviation in quality or noise problems is extremely time-consuming and costly, in particular with the complex processes involved in generating gear production. The use of simulation programs can be very helpful in these instances. This article presents applications for a newly created simulation software program. Alongside error-free machining, the effects of typical tool and clamping errors can be simulated with a high degree of accuracy and easily compared. Examples demonstrate how changes in tool and process parameters affect the gear surface.
The comparison of the simulation results from a measured hob with the deviations of a gear produced with that hob is impressive. Further use of the simulation results for ripple analysis makes it possible to identify excitations in the machining process, and hence the causes of noise problems, by comparing measured and calculated spectra. In summary, the examples show that this simulation software is a powerful tool for planning and design, as well as troubleshooting and optimization of processes in generation production.

10 15FTM12
Bibliography
[1] Winkel, O.: New developments in gear hobbing, Gear Technology, March/April 2010
[2] Türich, A.: Producing profile and lead modifications in threaded wheel and profile grinding, Gear Technology, January/February 2010
[3] Gravel, G.: Simulation und Korrektur von Verzahnungsabweichungen – Qualitätsregelkreis Zahnradproduktion, VDI-Bericht 2148, 2011
[4] Descher, F.; Winter, W.: Welligkeitsmessung an Stirnradverzahnungen in der Serienfertigung, VDI-Bericht 2236, 2014
[5] Rank, B.: Welligkeiten auf Zahnflanken – Ursachen und akustische Auswirkungen, VDI Bericht 2236, 2014
[6] Gravel G.: Analysis of ripple on noisy gears; Gear solutions, January 2013
[7] Klocke, F.; Gorgels, C.; Schalaster, R.; Stuckenberg, A.: An innovative way of designing gear hobbing processes, International Conference on Gears, VDI Bericht 2108, 2010
[8] Brecher, C.; Brumm, M.; Hübner, F.: Manufacturing simulation for generating gear grinding of large-module gears, International Conference on Gears, VDI Bericht 2199, 2013
[9] Gravel G.: Simulation of Deviations in Hobbing and Generation Grinding; Gear Technology, September/October 2014
[10] Cluff, B. W.: Effects of hob quality and resharpening errors on generating quality, Gear Technology, September/October 1987
[11] VDI/VDE 2606: Messen von Verzahnungswerkzeugen – Messen von Wälzfräsern, 2010
[12] Kotlyar, Y.: Computerized hob inspection & applications of inspection results, Part I and II, Gear Technology, May/June, July/August 1994
[13] Thyssen, W.: Anforderungen an hartfeinbearbeitete Stirnradverzahnungen zur Minimierung der Geräuschemission, Tagung Feinbearbeitung von Zahnrädern, WZL-RWTH Aachen 2013