simulation of fatigue crack growth in …psasir.upm.edu.my/5453/1/fk_2008_70a.pdfuniversiti putra...
TRANSCRIPT

.
UNIVERSITI PUTRA MALAYSIA
SIMULATION OF FATIGUE CRACK GROWTH IN FRICTION
STIR-WELDED JOINTS OF 2024-T351 ALUMINUM ALLOY
AMIRREZA FAHIM GOLESTANEH
T FK 2008 70

SIMULATION OF FATIGUE CRACK GROWTH IN FRICTION STIR-WELDED JOINTS OF 2024-T351 ALUMINUM ALLOY
By
AMIRREZA FAHIM GOLESTANEH
Thesis Submitted to the School of Graduate Studies, Universiti Putra Malaysia, in Fulfillment of the Requirement for the Degree of Master of
Science
November 2008

DEDICATION
To my dear parents, that I owe them my life To my supervisor Dr. Aidy Ali who I learned a lot from To my high school teacher Mr. Shirdavani who interested me in mechanical engineering field.
II

Abstract of thesis presented to the Senate of Universiti Putra Malaysia in fulfillment of the requirement for the degree of Master of Science
SIMULATION OF FATIGUE CRACK GROWTH IN FRICTION STIR-WELDED JOINTS OF 2024-T351 ALUMINUM ALLOY
By
AMIRREZA FAHIM GOLESTANEH
November 2008
Chairman : Aidy Ali, PhD Faculty : Engineering
The present work simulates and predicts the fatigue crack growth in the
friction stir welded (FSW) joint of the 2024-T351 Al alloy. The simulation is
used to estimate the fatigue life of this welded joint. The study is based on finite
element method (FEM) and in the framework of Fracture Analysis Code for two-
dimensional (FRANC2D/L), developed by Fracture Group of Cornell University.
Fatigue crack behavior through the FSW joint is investigated under Linear
Elastic Fracture Mechanics (LEFM) using the Paris’ model. The work
concentrated on a stable crack propagation regime, the obtained fatigue life
shows good agreement with experimental and analytical results. The present
work incorporates a few different types of loading which are 1) the cyclic fatigue
loading for the case of R= 0.1, 2) the longitudinal tensile residual stress, 3) the
crack closure concept and 4) the residual stress relaxation phenomenon. In the
current work the stress intensity factor is calculated by applying displacement
correlation technique, which is based on calculating the displacement field
around the crack tip. The maximum circumferential tensile stress method was
III
used to predict the fatigue crack direction. In fact FRANC2D/L does not have the
capacity to consider different Paris’ constants for FSW zones and it predicts the
crack propagation through the welded zones by considering the same values of
Paris’ constants. This work presents a strategy to investigate the crack growth
based on the corresponding Paris’ constants for each FSW zone. The numerical
results are validated with the previous experimental and analytical work, which
show a good agreement of 88% and 97%.
IV
Abstrak tesis yang dikemukakan kepada Senat Universiti Putra Malaysia sebagai memenuhi keperluan untuk ijazah Master Sains
SIMULASI RAMBATAN RETAK OLEH KELESUAN DI DALAM KIMPALAN GESERAN 2024-T351 AL LOGAM CAMPURAN
Oleh
AMIRREZA FAHIM GOLESTANEH
November 2008
Pengerusi : Aidy Ali, PhD Fakulti : Kejuruteraan
Kerja penyelidikan yang dibentangkan adalah simulasi dan jangkaan hayat
kelesuan rambatan retak di dalam kimpalan secara geseran (FSW) bahan
Aluminium 2024-T351 logam campuran. Kajian adalah berasaskan kaedah unsur
terhingga berangka (FEM) dan didalam kod analisis patah dua dimensi
(FRANC2D/L) yang dibangunkan oleh Kumpulan Kajian Patah Cornell
University U.S.A. Sifat retak dikaji melalui elastik plastik mekanik patahlinear
menggunakan hukum Paris. Kajian tertumpu kepada rambatan retak yang stabil
keputusan hayat kelesuan adalah selari dengan jangkaan yang diperolehi
daripada eksperimen dan formulasi. Kajian menggabungkan 1) bebanan
ulangalik dengan nisbah daya R=0.1, 2) daya dalaman regangan, 3) konsep retak
tertutup dan 4) penggunaan daya dalaman.
Faktor tegasan tumpu dikira melalui teknik anjalan korelasi, mengambilkira
anjakan di depan tip retak. Perisian FRANC2D/L berupaya menjangka dengan
tiga kaedah, di mana tegasan regangan maksimum lilitan dipilih. Kajian
V

mendapati perisian FRANC2D/L tidak berupaya menyerap pemalar Paris untuk
zon yang berbeza ketika retak merambat di dalam kimpalan geseran ini. Kajian
membentangkan kaedah penyelesaian masalah ini. Keseluruhan keputusan
disahkan dengan keputusan eksperimen dan formulasi memberikan ketepatan
jangkaan 88 dan 97 peratus.
VI

ACKNOWLEDGEMENTS
I hereby convey my sincere gratitude and appreciation to my venerable
supervisor Dr. Aidy Bin Ali, who supported me with invaluable and worthwhile
advice on this work, and gave me a panorama of observance into the research. I
also would like to appreciate the efforts of the honorable Associate Professor Dr.
Wong Shaw Voon from Department of Mechanical and Manufacturing
Engineering and Dr. Faizal Mustapha from Department of Aerospace
Engineering, Universiti Putra Malaysia for accommodating me with helpful
advice on my research. I also thank to all other faculty members who somehow
helped me to implement this research.
Finally, I would like to express my gratitude to my beloved parents, for their
guidance, supports, love and encouragement.
VII

I certify that a Thesis Examination Committee has met on 7 November 2008 to conduct the final examination of Amirreza Fahim Golestaneh on his thesis entitled “Simulation of Fatigue Crack Growth in Friction Stir-Welded Joints of 2024-T351 Aluminum Alloy” in accordance with the Universities and University Colleges Act 1971 and the constitution of the Universiti Putra Malaysia [P.U.(A) 106] 15 March 1998. The Committee recommends that the student be awarded the Master of Science. Members of the Thesis Examination Committee were as Follows:
Nor Mariah binti Adam, PhD Associate Professor Faculty of Engineering Universiti Putra Malaysia (Chairman) Mohd Sapuan bin Salit, PhD Professor Faculty of Engineering Universiti Putra Malaysia (Internal Examiner) Barkawi bin Sahari, PhD Professor Faculty of Engineering Universiti Putra Malaysia (Internal Examiner) Ahmad Kamal Ariffin bin Mohd. Ihsan, PhD Profesor Faculty of Engineering and Built Environment Universiti Kebangsaan Malaysia (External Examiner)
HASANAH MOHD. GHAZALI, PhD Professor and Dean School of Graduate Studies Universiti Putra Malaysia Date: 29 January 2009
VIII
This thesis was submitted to the Senate of Universiti Putra Malaysia and has been accepted as fulfillment of the requirement for the degree of Master of Science. The members of the Supervisory Committee were as follows: Aidy bin Ali, PhD Senior Lecturer Department of Mechanical and Manufacturing Engineering Faculty of Engineering Universiti Putra Malaysia (Chairman) Wong Shaw Voon, PhD Associate professor Department of Mechanical and Manufacturing Engineering Faculty of Engineering Universiti Putra Malaysia (Member)
Faizal Mustapha, PhD Lecturer Department of Aerospace Engineering Faculty of Engineering Universiti Putra Malaysia (Member) HASANAH MOHD. GHAZALI, PhD Professor and Dean School of Graduate Studies Universiti Putra Malaysia
Date: February 12, 2009
IX

DECLARATION
I hereby declare that the thesis is based on my original work except for quotations and citation, which have been duly acknowledged. I also declare that it has not been previously or concurrently submitted for any other degree at UPM or other institutions. AMIRREZA FAHIM
GOLESTANEH Date: Nov 26, 2008
X
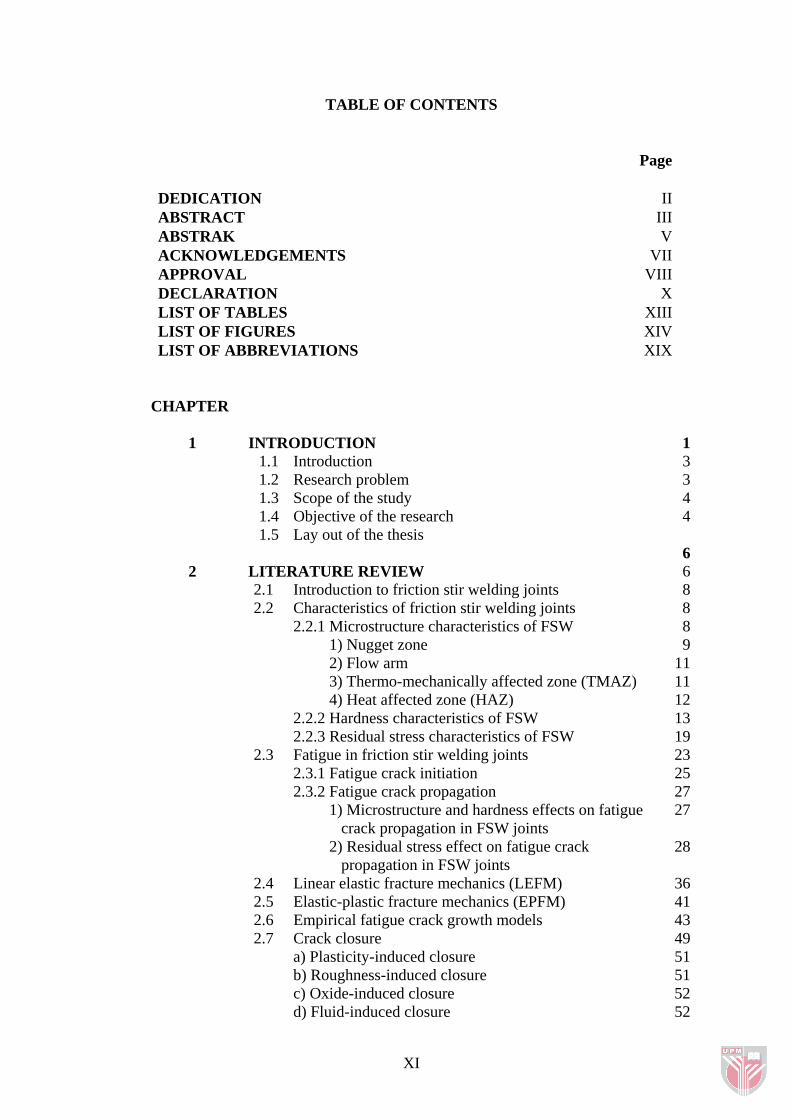
TABLE OF CONTENTS
Page DEDICATION IIABSTRACT IIIABSTRAK VACKNOWLEDGEMENTS VIIAPPROVAL VIIIDECLARATION XLIST OF TABLES XIIILIST OF FIGURES XIVLIST OF ABBREVIATIONS XIX
CHAPTER
1 INTRODUCTION 1 1.1 Introduction 3 1.2 Research problem 3 1.3 Scope of the study 4 1.4 Objective of the research 4 1.5 Lay out of the thesis 6
2 LITERATURE REVIEW 6 2.1 Introduction to friction stir welding joints 8 2.2 Characteristics of friction stir welding joints 8 2.2.1 Microstructure characteristics of FSW 8 1) Nugget zone 9 2) Flow arm 11 3) Thermo-mechanically affected zone (TMAZ) 11 4) Heat affected zone (HAZ) 12 2.2.2 Hardness characteristics of FSW 13 2.2.3 Residual stress characteristics of FSW 19 2.3 Fatigue in friction stir welding joints 23 2.3.1 Fatigue crack initiation 25 2.3.2 Fatigue crack propagation 27 1) Microstructure and hardness effects on fatigue
crack propagation in FSW joints 27
2) Residual stress effect on fatigue crack propagation in FSW joints
28
2.4 Linear elastic fracture mechanics (LEFM) 36 2.5 Elastic-plastic fracture mechanics (EPFM) 41 2.6 Empirical fatigue crack growth models 43 2.7 Crack closure 49 a) Plasticity-induced closure 51 b) Roughness-induced closure 51 c) Oxide-induced closure 52 d) Fluid-induced closure 52
XI

2.8 Simulation of fatigue crack propagation 55
3 METHODOLOGY 68 1) Modeling and meshing procedures 70 2) Analyzing and simulating procedures 70 3.1 Modeling and meshing procedures 71 3.1.1 Experimental specimen 71 3.1.2 Modeling the specimen in CASCA 72 3.1.3 Meshing process 74 3.2 CASCA output data 76 3.3 Analyzing and simulating procedures 77 3.3.1 Pre-processing 77 1) Problem type 77 2) Material properties 78 3) Boundary conditions 82 4) Loading 83 I ) Loading analysis 83 II) Load introducing to the software 88 3.3.2 Stress analysis and post-processing 99 3.3.3 Crack initiation 90 3.3.4 Stress analysis after crack introduction 92 3.3.5 Crack propagation 93 3.3.6 Post-processing stage 99
4 RESULTS AND DISCUSSIONS 105 4.1 Stress distribution 105 4.2 Crack growth simulation under 270 MPa maximum
stress in each zone 106
4.3 Stress intensity factor (SIF) history 116 4.4 Last propagation step 118 4.5 Total crack growth simulation under 270 MPa
maximum stress 120
4.6 Crack growth simulation under various loading 124 4.7 Prediction of fatigue life and S-N curve 132 5 CONCLUSIONS AND RECOMMENDATIONS 135 5.1 Conclusions 135
5.2 Recommendations for further work 136 REFERENCES 138APPENDICES 145BIODATA OF THE AUTHOR 169
XII

LIST OF TABLES
Table Page
2.1 Residual stress within FSW joints in SCT and CT specimens of 2024 Al alloy obtained by hole-drilling method [13] 21
2.2 Residual stresses within FSW joints in SCT and CT specimens of 2024 Al alloy after applying 2% plastic strain [13] 32
2.3 Initial crack dimensions [4] 61
3.1 Mechanical properties of 2024-T351 according to ASTM E8M-94a [1, 3, 72] 70
3.2 Experimental yield stress and Poisson’s ratio for FSW 2024-T351 Al alloy [1, 2] 81
3.3 Load conditions respective to the applied stresses 89
3.4 Paris model constants from Bussu [13] and Ali [2] experiments and regression calculation 100
4.1 Crack growth rate based on simulation and analytical methods for 270 MPa maximum applied stress 121
4.2 Number of cycles at each zone of FSW polished mirror material for different applied stress conditions 132
4.3 Comparison between simulation, analytical and experimental fatigue lifetime of FSW polished mirror material for different applied stress conditions
133
XIII

LIST OF FIGURES
Figure Page
2.1 A schematic illustration of FSW butt joint [19] 6
2.2 FSW technology, schematic view [8] 7
2.3 Weld microstructure zones [8] 10
2.4 Effect of FSW on Al grain size (a) base material (b,c) nugget zone [5, 13] 11
2.5 Typical microstructure in TMAZ [13] 12
2.6 Typical microstructure in HAZ [13] 13
2.7 Hardness characteristic curve for 7050 Al alloy [28] 15
2.8 Hardness variation within 5083 Al alloy [29] 16
2.9 Hardness variation in 2024-T351 Al alloy [13] 17
2.10 Hardness variation for 6082 Al alloy [16] 18
2.11 Hardness variation for AA7005/10 vol.%Al2O3p composite [5] 19
2.12 The residual stress profile along the FSW 2024-T351 Al alloy weld [2] 22
2.13 Empirical crack growth data of 2024-T351 Al alloy for surface cracks [13]. 24
2.14 Schematic illustration of the idealized crack growth [51] 25
2.15 Crack growth behavior of 2024-T351 Al alloy at base material, PJL and 11 mm away from it for SCT specimen [13] 29
2.16 Crack growth behavior of 2024-T351 Al alloy at base material and 25 mm away from it for SCT specimen [13] 30
2.17 Crack growth behavior of 2024-T351 Al alloy at base material and weld material for CT specimen [13] 31
2.18 Crack growth data for 2024-T351 Al alloy SCT specimen after 2% plastic strain parallel to the weld line [13] 32
2.19 Crack growth data for 2024-T351 Al alloy CT specimen after 33
XIV

2% plastic strain perpendicular to the weld line [13]
2.20 Fatigue life of (a) FSW joint as welded (b) FSW polished mirror joint [2] 34
2.21 Fatigue lifetime of (a) FSW peened as welded (b) FSW peened after skimmed [2] 35
2.22 Increase of yield strength in elastic-plastic material under loading and unloading process 37
2.23 Plastic zone at the crack tip in (a) plane strain and (b) plane stress conditions [50] 38
2.24 Nonlinear elastic material under loading and unloading processes 42
2.25 Schematic illustration of the fatigue crack growth and the effect of load ratio [4] 44
2.26 Schematic drawing of polar coordinate axis ahead of a crack tip [37] 46
2.27 Load-displacement behavior of cracked and uncracked specimen [47] 49
2.28 Plasticity-induced closure [47] 51
2.29 Roughness-induced closure [47] 52
2.30 Oxide-induced closure [47] 52
2.31 Crack closure induced by viscous fluid between the crack faces [47] 53
2.32 Extrapolation for the crack opening load from crack opening displacement versus load data [63] 54
2.33 Crack growth measurements and FE predictions versus crack size (a) 14 mm specimen thickness (b) 30 mm specimen thickness [57]
55
2.34 Crack propagation along the crack front after cyclic loading [46] 59
2.35 Initial cracks inserted into the crack growth simulations [4] 61
2.36 Six-node triangular elements around the crack tip [42] 64
XV

3. 1 Process of conducting the study 69
3.2 (a) Four-point bending specimen [1], (b) longitudinal specimen configuration and coordinate system relative to the weld line [2] 72
3.3 Free-body diagram of specimen loaded in four-point bending machine 73
3.4 Two-dimensional simulation specimen covered by mesh elements and subjected to distributed loading 75
3.5 Stress-strain curves for each microstructure zone in FSW 2024-T351 Al alloy a) PZ b) HAZ c) TMAZ d) NZ [2] 81
3.6 Stress contour in Y direction after crack propagation under 270 MPa maximum applied stress 83
3.7 Remeshing process (a) removing the primary mesh elements (b) replacing eight quarter-point elements around the crack tips 92
3.8 Stress intensity factor for 270 MPa max stress at HAZ-PZ boundary (a) displacement correlation technique (b) J integral (c) modified crack closure
96
3.9 Crack tip hits the boundary between HAZ and PZ 97
3.10 Cycles-crack length plot for maximum applied stress=270 MPa after fracture 98
3.11 Number of cycles versus the half of the crack length within (a) TMAZ, (b) NZ, (c) HAZ and (d) PZ for 243 MPa applied stress range
104
4.1 Stress distribution in Y direction for 270 MPa maximum applied stress 106
4.2 Number of cycles versus half of the crack length within the TMAZ up to the HAZ boundary for 270 MPa maximum applied stress
107
4.3 Number of cycles versus half of the crack length within the TMAZ up to the NZ boundary for 270 MPa max applied stress 108
4.4 Number of cycles versus half of the crack length within the HAZ up to the PZ boundary for 270 MPa maximum applied stress
113
4.5 Number of cycles versus half of the crack length within the PZ 116
XVI

for 270 MPa maximum applied stress
4.6 Stress intensity factor based on displacement correlation method (a) the variation of KI versus half of crack length (b) KI of initial crack (c) KI at the end of propagation process
118
4.7 Number of cycles versus half of the crack length at the end of stage II for 270 MPa maximum applied stress 119
4.8 SIF (KI) for 270 MPa maximum applied stress in stage III 119
4.9 Crack propagation data based on simulation and analytical methods for 270 MPa maximum applied stress 122
4.10 Crack growth rate versus SIF range based on simulation and analytical method for 270 MPa maximum applied stress 122
4.11 Crack growth rate versus cycles based on simulation and analytical method for 270 MPa maximum applied stress 124
4.12 Last fatigue crack propagation process through the PZ (a) 270 MPa max applied stress, (b) 277.8 MPa max applied stress, (c) 292.55 MPa max applied stress, (d) 303.67 MPa max applied tress
126
4.13 Last fatigue crack propagation process through the parent zone (a) 311 MPa max applied stress, (b) 322 MPa max applied stress, (c) 333 MPa max applied stress, (d) 351 MPa max applied stress
128
4.14 Last fatigue crack propagation process through the parent zone (a) 373 MPa max applied stress, (b) 395 MPa max applied stress, (c) 418 MPa max applied stress, (d) 444 MPa max applied stress
129
4.15 Last fatigue crack propagation process through the PZ under 466 MPa max applied stress 130
4.16 Fatigue life predictions of FSW joint of 2024-T351 Al alloy 134
A.1 Number of cycles versus the half of the crack length within (a) TMAZ, (b) HAZ and (c) PZ for 277.8 MPa max applied stress
146
A.2 Number of cycles versus the half of the crack length within (a) TMAZ, (b) HAZ and (c) PZ for 292.5 MPa max applied stress
148
XVII

A.3 Number of cycles versus the half of the crack length within (a) TMAZ, (b) HAZ and (c) PZ for 303.6 MPa max applied stress
150
A.4 Number of cycles versus the half of the crack length within (a) TMAZ, (b) HAZ and (c) PZ for 311 MPa max applied stress 152
A.5 Number of cycles versus the half of the crack length within (a) TMAZ, (b) HAZ and (c) PZ for 322 MPa max applied stress 154
A.6 Number of cycles versus the half of the crack length within (a) TMAZ, (b) HAZ and (c) PZ for 333 MPa max applied stress 156
A.7 Number of cycles versus the half of the crack length within (a) TMAZ, (b) HAZ and (c) PZ for 351 MPa max applied stress 158
A.8 Number of cycles versus the half of the crack length within (a) TMAZ, (b) HAZ and (c) PZ for 373 MPa max applied stress 160
A.9 Number of cycles versus the half of the crack length within (a) TMAZ, (b) HAZ and (c) PZ for 395 MPa max applied stress 162
A.10 Number of cycles versus the half of the crack length within (a) TMAZ, (b) HAZ and (c) PZ for 418 MPa max applied stress 164
A.11 Number of cycles versus the half of the crack length within (a) TMAZ, (b) HAZ and (c) PZ for 444 MPa max applied stress 166
A.12 Number of cycles versus the half of the crack length within (a) TMAZ, (b) HAZ and (c) PZ for 466 MPa max applied stress 168
XVIII

LIST OF ABBREVIATIONS
a Edge crack length
effa Total size of the crack
Na
∂∂
0C
pnC ,,′ q
cCTOD
cCTOD
Crack growth rate
b Empirical factor
BEM Boundary Element Method
C Paris’ constant
Material constant
, Constants
CT Compact Tension
CTOD Crack Tip Opening Displacement
Critical Crack Tip Opening Displacement
INIT Initial value of Critical Crack Tip Opening Displacement
CTS Compact Tension Shear specimen
E, ′ Modulus of elasticity E
XIX

EPFM Elastic-Plastic Fracture Mechanics
1F 2F
CK
IK IIK IIIK
maxK
, External forces acting on specimen
FAZ Flow Arm Zone
FNK Forman–Newman–de Koning
FRANC2D Fracture Analysis Code 2-D
FSW Friction Stir Welding
G Shear modulus
g Energy release rate for LEFM
H Constant strain hardening
HAZ Heat Affected Zone
HCF High Cycle Fatigue
I Second moment of inertia
K Stress intensity factor
Fracture toughness
, , Stress intensity factor of three modes
Stress intensity factor of the maximum applied stress
XX

opK Opening stress intensity factor
L Crack length on the crack face
41L
rexMax
Distance from the quarter node to the crack tip
LCF Low Cycle Fatigue
LEFM Linear Fracture Mechanics
M Moment
σ Maximum stress after relaxation
rexMinσ Minimum stress after relaxation
m Paris’ constant
N Number of cycles
n Strain hardening exponent
NZ Nugget Zone
OSM Object Solid Modeler
P External applying load
PJL Plane Joint Line
PZ Parent plate Zone
XXI

Stress ratio R
1R 2R, Support reaction forces
r, θ Polar coordinates
fr
)6( πpr
)(combopr
Plastic zone radius
Plastic zone radius for plane strain
Plastic zone radius for planar condition
SCT Surface Crack Tension
0
maxσ
S Ratio of maximum applied stress to the material yield
strength
TMAZ Thermomechanically Affected Zone
TWI The Welding Institute
u, V Nodal displacements in x and y direction
w Walker exponent
x Distance from origin
y Distance from neutral axis of cross section
Y Correction factor
XXII

α Plane stress/strain constraint
aΔ Mesh element size or incremental crack length
KΔ
effkΔ
thKΔ
eff
Stress intensity factor range
Effective stress intensity factor range
Threshold range
σΔ Effective stress range
ν Poisson ratio
effσ Effective stress
maxσ Maximum applied stress
res+maxσ Maximum stress after incorporating residual stress
minσ Minimum applied stress
res+minσ Minimum stress after incorporating residual stress
opσ Opening stress
resσ Residual stress
0σ Yield strength
XXIII

XXIV
2D Two-dimension