simulation of drilling pressure profile in directional ... · abstract—. maintaining wellbore...
TRANSCRIPT
Abstract—Maintaining wellbore stability is challenging in
any drilling situation, especially when directional drilling with
narrow pressure window are experienced. An imperative
parameter to control wellbore stability is downhole pressure or
equivalent circulating density (ECD). An accurate downhole
pressure is required in order to maintain it in pressure window
and also avoid drilling problems which cause interruption
during drilling operation, resulting in high non-productive time.
Since annular frictional pressure loss increases ECD, it becomes
very challenging to estimate accurate annular pressure loss.
Many experimental studies have been developed annular
pressure loss prediction without validating results with field
measurements. This study aims to estimate an annular pressure
loss in directional drilling with or without pipe rotation using
several developed models with casing program. The
performance of the models are tested by comparing the results
with field measurements obtained from Kam Phaeng San Basin,
Thailand. The conventional annular frictional pressure loss
combined with increasing-pressure-loss model gives a good
agreement with field measurements, a pipe rotation effect is
more influential on annular pressure loss especially in smaller
annular space. In addition, a user-friendly software is also
developed using MATLAB platform to predict real time
downhole pressure and ECD with casing program.
Index Terms—Downhole pressure, annular pressure loss,
equivalent circulating density (ECD), directional drilling.
I. INTRODUCTION
Keeping the downhole pressure or drilling fluid equivalent
circulating density (ECD) in the operating window between
the pore and the fracture pressure is very challenging,
particularly when the pressure window is very narrow. When
downhole pressure is above fracture pressure, drilling fluid
leaks into the formation, and it causes formation damages. On
the other hand when downhole pressure is below pore
pressure, formation fluid will influx into wellbore leading to
kick and blowout. Both situations can cause fluid circulation
loss. Thus, to overcome these challenges, an accurate
estimation of pressure loss is essential to avoid drilling
problem, resulting in an increase of non-productive time.
This downhole pressure consists of hydrostatic pressure from
fluid exerted in wellbore and frictional annular pressure from
fluid flow. To predict an accurate frictional pressure loss,
fluid flow behavior in annular space of wellbore should be
determined. Many published literatures have been studied the
fluid rheology, flow state, and also effect of parameters such
Manuscript received February 15, 2015; revised April 30, 2015.
Weerapong Panichaporn and Kitipat Siemanond are with the Petroleum
and Petrochemical College, Chulalongkorn University, Thailand (e-mail:
[email protected], [email protected]).
Ruktai Prurapark is with the Energy Thai Trading Hub Company Limited
(ETTH), Thailand (e-mail: [email protected]).
as pipe rotation, fluid properties and flow rate that affect
frictional annular pressure loss calculation. However
proposed predictive models has never been validated with
field measurements, and never been applied to practical
fields.
In this research, several developed models have been
conducted to estimate downhole pressure while circulating
power law fluid in concentric annulus, and validate the
results with field measurements obtained from Kam Phaeng
San Basin, Thailand. In addition, the effect of drillpipe
rotation on annular pressure loss is also studied. The
optimum predictive model which is analyzed by using
statistical method is used in development of friendly-user
software using MATLAB platform.
II. FIELD MEASUREMENTS
Field measurements used in this study are obtained from
Kam Phaeng San Basin, Thailand by incorporating with Pan
Orient Energy (Siam) Company Limited. The four different
onshore wells that used in this research; A, B, C and D are
directional drilling at target true vertical depth 935 m, 796 m,
1,253 m, 1,408 m respectively, and measured depth 1,660 m,
890 m, 1,651 m, 1,552 m respectively. Wells are drilled in
hole section 26 inch, 17 ½ inch, 12 ¼ inch, 8 ½ inch and 6 1/8
inch with casing size 20 inch, 13 3/8 inch, 9 5/8 inch, 7 inch and
4 ½ inch respectively and with drillpipe 5 inch following well
program. Drilling fluid flow are approximately in range 350-
750 gallon per minute. Downhole pressure or equivalent
circulating density (ECD) in field were measured by rig
sensor, which were recorded in Log ASCII Standard format.
III. MATHEMATICAL MODELS
Downhole pressure are generated from two different origin:
hydrostatic pressure and frictional losses. The hydrostatic
pressure exerted by the column of fluid inside wellbore while
frictional losses are generated by fluid flowing in annulus
from bottom of hole to surface. In field operation, this
downhole pressure is usually referred to equivalent
circulating density (ECD) which is the effective density
exerted by a circulating fluid against formation, expressing in
pound per gallon (ppg). Thus, downhole pressure and ECD
can be expressed in (1) and (2) respectively [1], [2].
𝐵𝐻𝑃 = ∆𝑃𝑦𝑑𝑟𝑜𝑠𝑡𝑎𝑡𝑖𝑐 + ∆𝑃𝑎𝑛𝑛𝑢𝑙𝑎𝑟 (1)
𝐸𝐶𝐷 = 𝐸𝑀𝑊 + ∆𝑃𝑎𝑛𝑛𝑢𝑙𝑎𝑟
0.052×𝑇𝑉𝐷 ( 2 )
To achieve an accuracy of downhole pressure or ECD, an
Simulation of Drilling Pressure Profile in Directional
Drilling and User Program Development
Weerapong Panichaporn, Ruktai Prurapark, and Kitipat Siemanond
International Journal of Materials, Mechanics and Manufacturing, Vol. 3, No. 4, November 2015
255DOI: 10.7763/IJMMM.2015.V3.206
annular pressure loss calculation is determined using a
narrow slot equation for pipe flow because it is widely used
in the drilling engineering for practical purposes. To
transform annular flow to pipe flow, the effective diameter
needs to be replaced the diameter parameter. Anifowoshe et
al. [3] found that the definition of hydraulic diameter as
expressed in (3) is the appropriate estimation of pressure loss
for power law fluid. Hence frictional pressure loss inside an
annulus using slot equation is defined as (4)
𝐷𝑒 = 𝐷𝑜 − 𝐷𝑖 (3)
𝑑𝑃
𝑑𝑧=
𝑓𝑓𝜌𝑣𝑎2
25.81(𝐷𝑜−𝐷𝑖)
(4)
where D0 and Di
are wellbore diameter or casing diameter and
drillpipe diameter respectively, 𝜌 is static density, 𝑣𝑎 is
average annular velocity and 𝑓𝑓 is friction factor.
A. No Effect of Pipe Rotation
A friction factor significantly depends on fluid flow state
either in laminar regimes, transition regimes or turbulent
regimes, thus flow state should be determined in order to
predeict the pressure losses. The flow in annulus is either
laminar flow, transitional flow or turbulent flow depending
on the parameters such as flow rate, density, and diameter
ratio. The flow state is classified dimensionless Reynold
number which is less than 2100 for laminar flow and more
than 4000 for turbulent flow. A common friction factor in
laminar regime can be describe in (5), and for turbulent
regime in (6). A friciton factor of transition regime is
calculated using linear regression between larminar and
turbulent regime. However, a friction factor for power law
fluid, Blasius formula, in turbulent regime is also proposed as
(7).
𝑓𝑓 = 16
𝑁𝑅𝑒 (5)
𝑓𝑓 = 4
𝑛0.75 𝑙𝑜𝑔 𝑁𝑅𝑒𝑓𝑓1−
1
𝑛 − 0.395
𝑛1.2 (6)
𝑓𝑓 = 0.0791
𝑁𝑅𝑒0.25 (7)
B. Effect of Pipe Rotation
Inside annulus, inner pipe rotation can help increasing
penetration rate to drill in deeper depth and also transporting
cuttings up to the surface to reduce pipe stuck and pressure
build up from an accumulation of cuttings in annular gap.
However pipe rotation generates a tangential flow in the same
direction as rotation, which resists the flow in axial direction
leading to an increase of annular pressure loss. Moreover a
rotating pipe also generates a secondary turbulent flow
(vortex) inside main turbulent stream. It not only creates
more turbulent regime but also resists the fluid flow affecting
an increase of annular pressure loss. Although, a study of
flow behavior when pipe is rotating is still complex
especially in drilling operation, there are several literatures
proposed empirical correlations and mechanistic models.
Hemphill et al. [4] developed the general equation for
increased pressure loss with rotation in term of diameter ratio
and rotation speed (rpm) as expressed in (8)
∆𝑃𝑟𝑜𝑡𝑎𝑡𝑒 = −1.0792 𝐷𝑖
𝐷𝑜 + 17.982
𝐷𝑖
𝐷𝑜
2
(0.00001 × 𝐿 × 𝑁) (8)
where L is length section and N is rotation speed. Ozbayoglu
et al. [5] proposed the empirical correlation for friction factor
in term of both axial and tangential Reynolds number.
Friction factor can be classified using total Reynold number,
which is the sum of axial and tangential Reynold number, as
given below
If 𝑁𝑅𝑒𝑇 < 3000
𝑓𝑓 = 8.274𝑁𝑅𝑒𝑎−0.9075 + 0.00003𝑁𝑅𝑒𝑟 (9)
If 3000 < 𝑁𝑅𝑒𝑇 < 7000
𝑓𝑓 = 0.0729𝑁𝑅𝑒𝑎−0.3017 + 0.000011𝑁𝑅𝑒𝑟 (10)
If 7000 < 𝑁𝑅𝑒𝑇 < 10000
𝑓𝑓 = 0.006764𝑁𝑅𝑒𝑎−0.0286 + 0.00001𝑁𝑅𝑒𝑟 (11)
If 10000 < 𝑁𝑅𝑒𝑇 < 25000
𝑓𝑓 = 8.28𝑁𝑅𝑒𝑎−0.7258 + 0.000001𝑁𝑅𝑒𝑟 (12)
If 25000 < 𝑁𝑅𝑒𝑇 < 40000
𝑓𝑓 = 0.06188𝑁𝑅𝑒𝑎−0.2262 (13)
If 𝑁𝑅𝑒𝑇 > 40000
𝑓𝑓 = 0.03039𝑁𝑅𝑒𝑎−0.1542 (14)
where 𝑁𝑅𝑒𝑇 is total Reynold number, 𝑁𝑅𝑒𝑎 is axial Reynold
number and 𝑁𝑅𝑒𝑟 is tangential Reynold number.
Ahmed et al. [6] introduced the pressure loss ratio (PLR),
which is the ratio of pressure loss while pipe rotating at that
speed and pressure loss with no pipe rotation, from field
measurements with dimensionless analysis expressed in (15)
𝑃𝐿𝑅 = 0.36 × (13.5 + 𝜏𝑦
𝜌𝑈2)0.428 × 𝜀𝑎𝑣𝑒0.158 × 𝑛0.054 ×
𝑇𝑎 × 𝑅𝑒𝑒𝑓𝑓0.042 × 𝑘(
1
𝑘− 1)−0.0152
(15)
where 𝜏𝑦 is yield stress, 𝜀 is eccentric value, 𝑇𝑎 is Taylor
number, and 𝑅𝑒𝑒𝑓𝑓 is effective Reynolds number. The
default values and calculation details are followed given
references.
Erge et al. [7] presented a new correlation for laminar
region, transition from laminar to turbulent regions and
turbulent region to propose new friction factor (𝑓0) in order to
predict annular pressure loss with pipe rotation. The
expression are described as follow:
𝑓0 = 𝑐 𝑓𝑀𝑜𝑑 .𝑁.𝑆. (16)
For laminar flow:
𝑐 = 0.2287𝑁 − 0.0580 𝐹𝑑 + 0.1237 𝜔𝑑 + 0.4289 (17)
International Journal of Materials, Mechanics and Manufacturing, Vol. 3, No. 4, November 2015
256
For transition flow:
𝑐 = −1.0267𝑁 − 0.0096 𝐹𝑑 + 0.0390 𝜔𝑑 + 1.2422 (18)
For turbulent flow:
𝑐 = 1.7821 𝑁 − 0.0132 𝐹𝑑 + 0.1388 𝜔𝑑 + 1.7983 (19)
where N is consistency index, 𝐹𝑑 is the dimensionless force
and 𝜔𝑑 is the dimensionless rotation.
Therefore, several published models of predicting annular
pressure loss with and without drillpipe rotation are
summarized as shown in Table I.
TABLE I: PREDICTIVE MODELS OF ANNULAR PRESSURE LOSS WITH AND
WITHOUT DRILLPIPE ROTATION
Model without pipe
rotation Model with pipe rotation
(5), (6)
(Model A)
(5), (6), (8) ---> Model A1
(5), (6), (15) ---> Model A2
(5), (7)
(Blasius formula)
(5), (7), (8) ---> Model B1
(5), (7), (15) ---> Model B2
(9) – (14) ---> Model C
(16) – (19) ---> Model D
IV. RESULTS AND DISCUSSIONS
Regarding the drilling fluid parameters: Plastic viscosity
(PV) and yield point (YP) obtained from field measurement,
drilling fluid behavior in annular gap is described as power
law fluid flow. Thus, fluid behavior index (n) and consistency
index (k) of four different wells in hole section of 8 ½ inch
diameter are determined and shown in Table II.
In field operation, well is drilled with different bit and
casing program that provide different annular geometry in
each section. When fluid flows passing through this gap,
mean velocity is changed which affect the determination of
flow state whether in laminar or turbulent region. Using
drilling fluid parameters combined with bit and casing
program from actual well program, predicting pressure loss
models with and without pipe rotation are summarized in
Table I in order to predict ECD or downhole pressure.
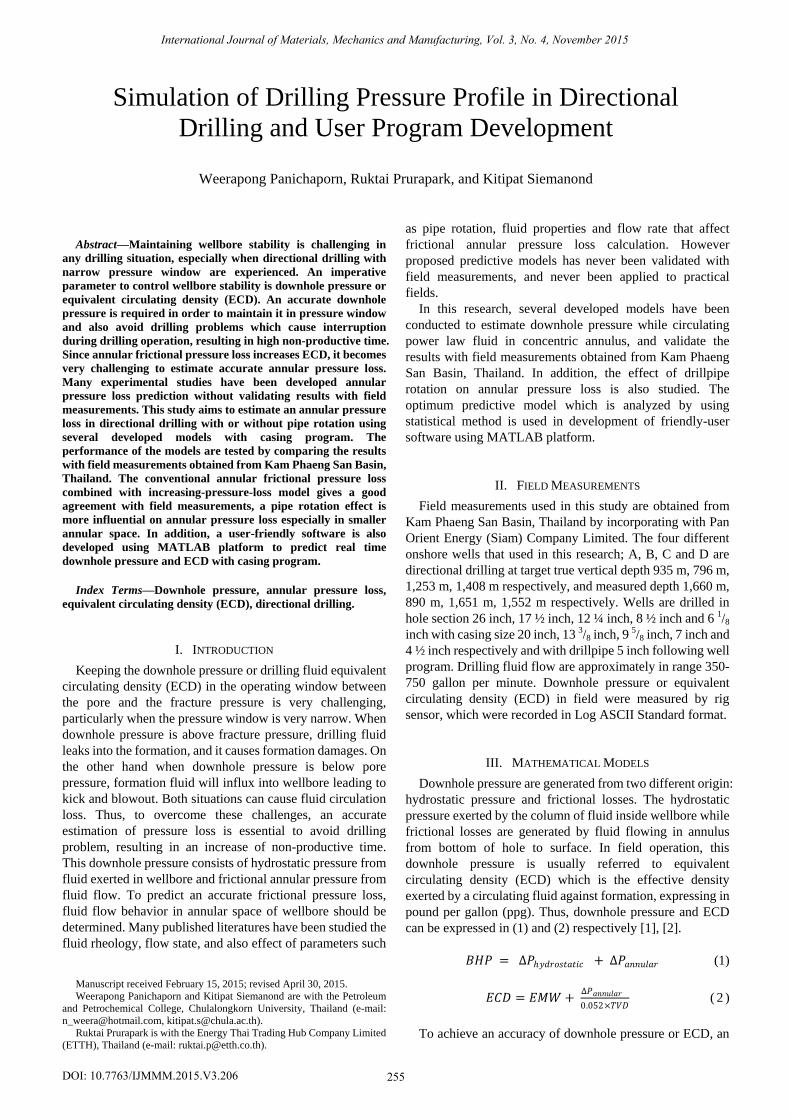
A. Downhole Pressure without Pipe Rotation
An annular frictional pressure loss calculation without pipe
rotation effect is conducted using Model A and Blasius
formula as shown in Table I combining bit and casing
program. Then annular pressure loss are added with
hydrostatic pressure, and express downhole pressure in term
of ECD. The comparison of calculated and measured ECD
without pipe rotation effect based on field measurement of
well A is shown in Fig. 1.
Fig. 1 indicates that the Blasius model gives a good
agreement with field measurements more than Model A. The
Blasius formula was developed using only power law fluid
information while Model A is commonly used for both
Newtonian fluid and Non-Newtonian fluid. Nonetheless,
error lines indicate that both models are under predicted for
ECD or downhole pressure estimation. Additionally, usual
measured ECD are in range 9-13 ppg, but there are some
abnormal data which is over the normal range because of
oilfield data transformation. Regarding to oilfield data record,
all drilling information are recorded as time log including
data not only in drilling activities but also others such as hole
cleaning, tripping in-out and pipe connection. Transforming
time log to depth log, which is considered only in drilling
activities, might not have an appropriate algorithm of
transformation. Hence, the pressure peaks at measured depth
(MD) from 900 to 960 m are caused by unusual flow rate
from hole cleaning activity. On the other hand, it indicates
that flow rate is a major influence of estimating ECD and
pressure loss. In addition, an error becomes more fluctuating
at depth deeper than 780 m since it changes the bit from 12 ¼
inch to 8 ½ inch bit diameter with 5 inch drillpipe diameter.
The narrow annular space also influences pressure loss.
Fig. 1. A comparison of calculated ECD and measured ECD from Blasius
formula and model a using well a data.
B. Downhole Pressure with Pipe Rotation
The gap width between drillpipe and wellbore or inner
casing can cause pipe rotation effect becoming more
dominant especially in hole section of 8 ½ inch diameter or
narrower annular gap. Since an inner pipe rotational speed at
the pipe wall effects axial velocity and it impacts overall
shear rate that controls pressure loss, the effect of drillpipe
rotation on pressure loss is considered to evaluate ECD or
downhole pressure using models in Table I.
Predictive models of annular frictional pressure loss with
pipe rotation are conducted to calculate ECD or downhole
pressure based on Well A while circulating power law fluid
in hole section of 8 ½ inch diameter. The comparison
between calculated ECD and measured ECD from Model A1
and A2, Model B1 and B2, and Model C and D are shown in
Fig. 2-Fig. 4 respectively.
TABLE II: AN EXAMPLE OF FLUID PROPERTIES IN HOLE SECTION OF 8½
INCH IN DIAMETER
Mud Properties Unit Well A Well B Well C Well D
Plastic viscosity (PV) cps 13 13.5 14.5 11
Yield Point (YP) lb/100ft2 17.5 17 16.5 18.5
Flow behavior index (n) - 0.5122 0.5287 0.5536 0.4572
Consistency index (k) eq.cp 638.32 575.96 501.22 869.91
Yield stress (τy ) lb/100ft2 0 0 0 0
International Journal of Materials, Mechanics and Manufacturing, Vol. 3, No. 4, November 2015
257
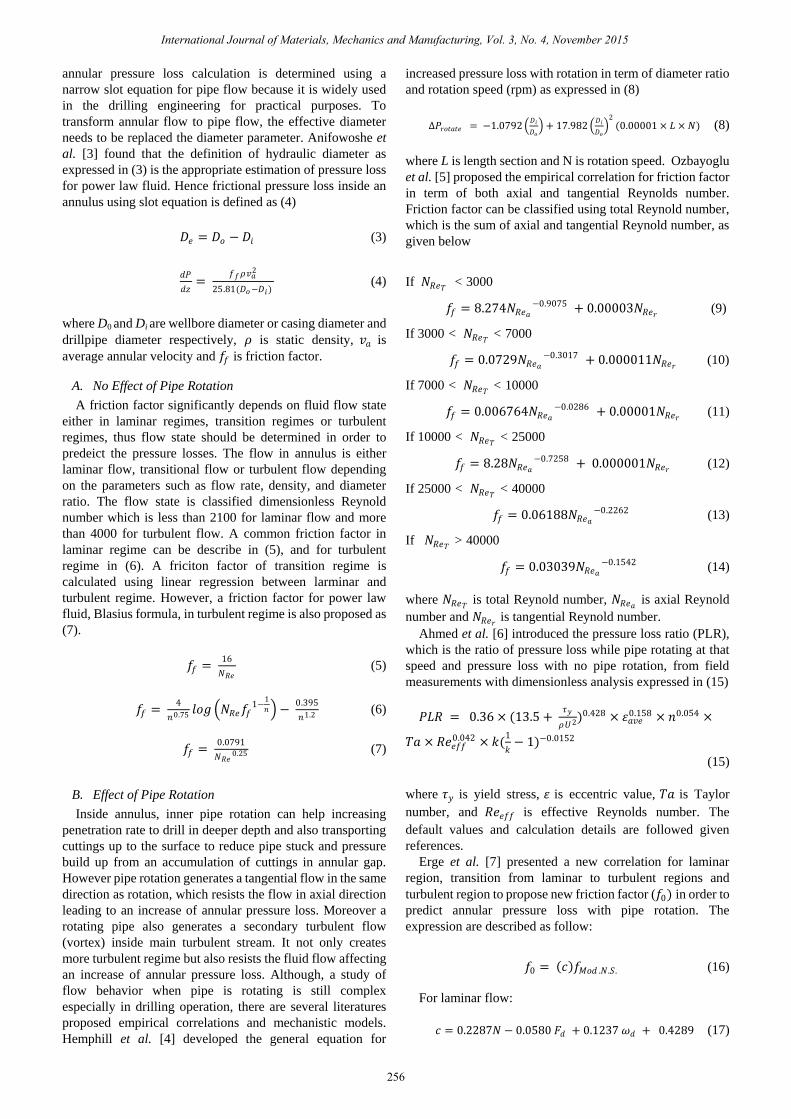
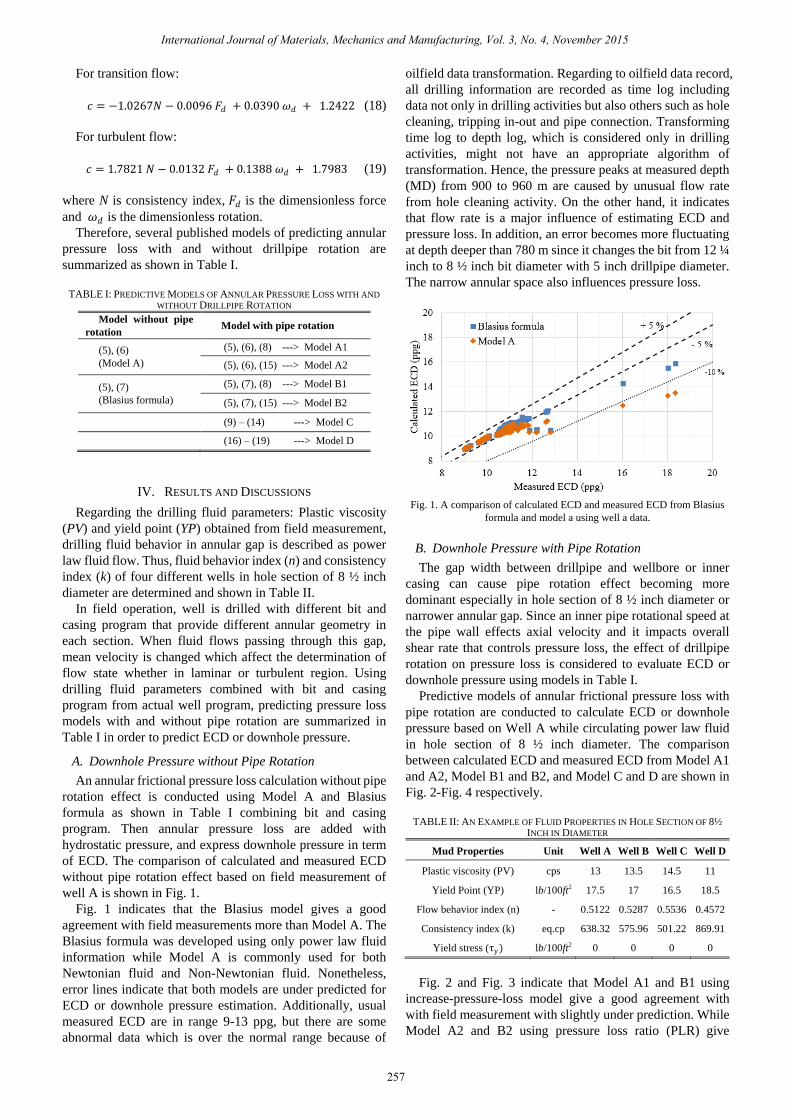
Fig. 2 and Fig. 3 indicate that Model A1 and B1 using
increase-pressure-loss model give a good agreement with
with field measurement with slightly under prediction. While
Model A2 and B2 using pressure loss ratio (PLR) give
slightly over prediction. An increase-pressure-loss model is
more accurate than pressure loss ratio model because an
increase-pressure-loss model was developed from several
field measurement based on different well geometry or
diameter ratio between drillpipe and wellbore diameter.
While PLR was also developed from field measurement
based on drilling fluid properties which PLR can be used
either in power law fluid or yield power law fluid. On the
other hand, annular gap width or diameter ratio between
drillpipe and wellbore significantly impact on ECD or
downhole pressure while drillipipe is rotating.
Fig. 2. A comparison of calculated ECD and measured ECD from model A1
and model A2 using well a data.
Fig. 3. A comparison of calculated ECD and measured ECD from model B1
and model B2 using well a data.
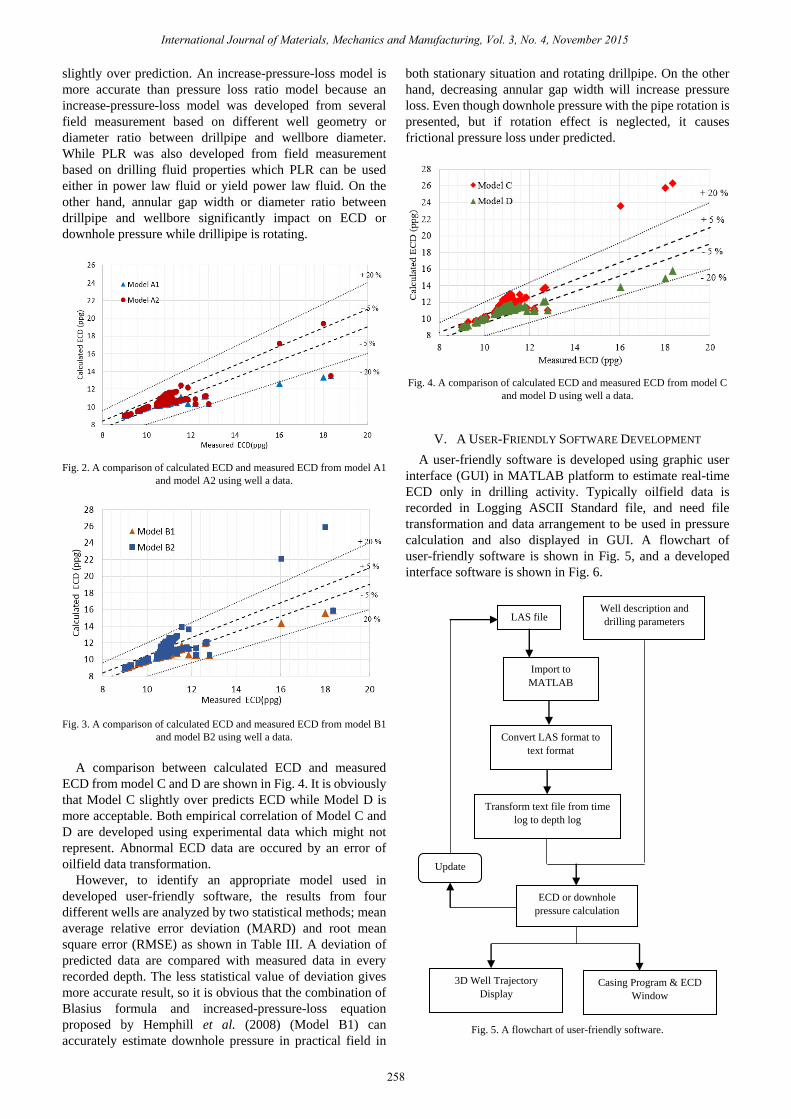
A comparison between calculated ECD and measured
ECD from model C and D are shown in Fig. 4. It is obviously
that Model C slightly over predicts ECD while Model D is
more acceptable. Both empirical correlation of Model C and
D are developed using experimental data which might not
represent. Abnormal ECD data are occured by an error of
oilfield data transformation.
However, to identify an appropriate model used in
developed user-friendly software, the results from four
different wells are analyzed by two statistical methods; mean
average relative error deviation (MARD) and root mean
square error (RMSE) as shown in Table III. A deviation of
predicted data are compared with measured data in every
recorded depth. The less statistical value of deviation gives
more accurate result, so it is obvious that the combination of
Blasius formula and increased-pressure-loss equation
proposed by Hemphill et al. (2008) (Model B1) can
accurately estimate downhole pressure in practical field in
both stationary situation and rotating drillpipe. On the other
hand, decreasing annular gap width will increase pressure
loss. Even though downhole pressure with the pipe rotation is
presented, but if rotation effect is neglected, it causes
frictional pressure loss under predicted.
Fig. 4. A comparison of calculated ECD and measured ECD from model C
and model D using well a data.
A user-friendly software is developed using graphic user
interface (GUI) in MATLAB platform to estimate real-time
ECD only in drilling activity. Typically oilfield data is
recorded in Logging ASCII Standard file, and need file
transformation and data arrangement to be used in pressure
calculation and also displayed in GUI. A flowchart of
user-friendly software is shown in Fig. 5, and a developed
interface software is shown in Fig. 6.
Fig. 5. A flowchart of user-friendly software.
LAS file Well description and
drilling parameters
Transform text file from time
log to depth log
Import to
MATLAB
Convert LAS format to
text format
ECD or downhole
pressure calculation
3D Well Trajectory
Display Casing Program & ECD
Window
Update
International Journal of Materials, Mechanics and Manufacturing, Vol. 3, No. 4, November 2015
258
V. A USER-FRIENDLY SOFTWARE DEVELOPMENT
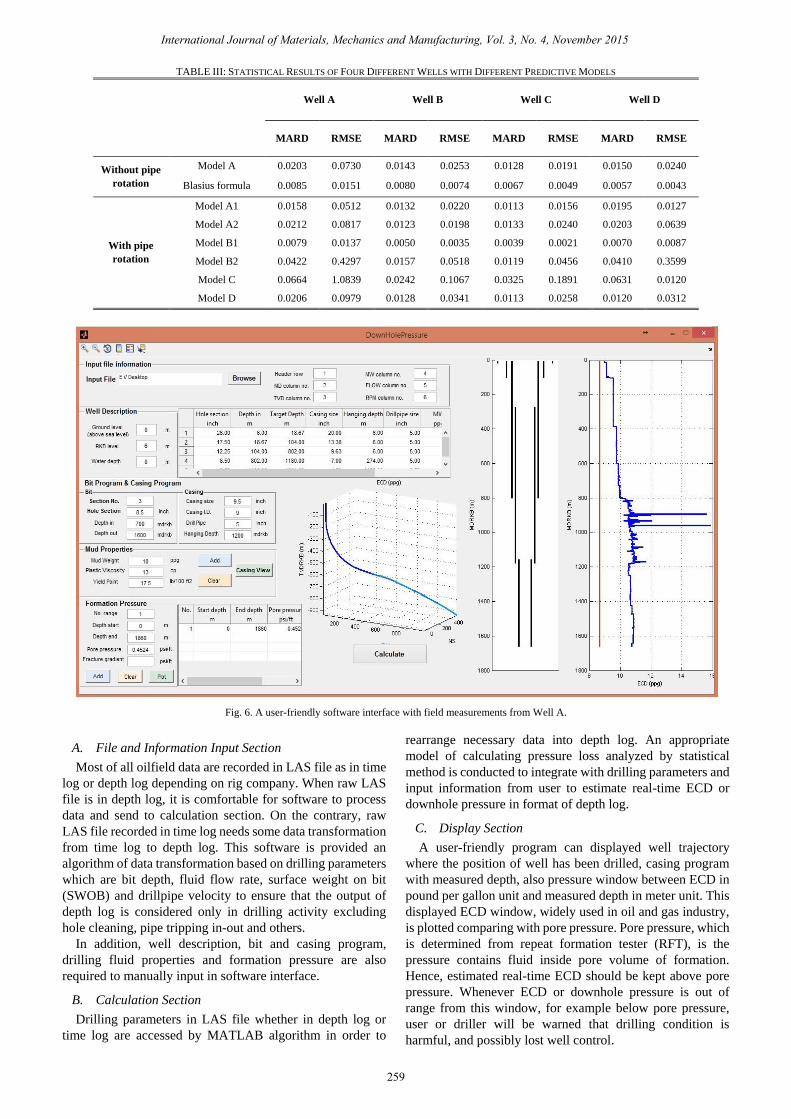
TABLE III: STATISTICAL RESULTS OF FOUR DIFFERENT WELLS WITH DIFFERENT PREDICTIVE MODELS
Well A Well B Well C Well D
MARD RMSE MARD RMSE MARD RMSE MARD RMSE
Without pipe
rotation
Model A 0.0203 0.0730 0.0143 0.0253 0.0128 0.0191 0.0150 0.0240
Blasius formula 0.0085 0.0151 0.0080 0.0074 0.0067 0.0049 0.0057 0.0043
With pipe
rotation
Model A1 0.0158 0.0512 0.0132 0.0220 0.0113 0.0156 0.0195 0.0127
Model A2 0.0212 0.0817 0.0123 0.0198 0.0133 0.0240 0.0203 0.0639
Model B1 0.0079 0.0137 0.0050 0.0035 0.0039 0.0021 0.0070 0.0087
Model B2 0.0422 0.4297 0.0157 0.0518 0.0119 0.0456 0.0410 0.3599
Model C 0.0664 1.0839 0.0242 0.1067 0.0325 0.1891 0.0631 0.0120
Model D 0.0206 0.0979 0.0128 0.0341 0.0113 0.0258 0.0120 0.0312
Fig. 6. A user-friendly software interface with field measurements from Well A.
A. File and Information Input Section
Most of all oilfield data are recorded in LAS file as in time
log or depth log depending on rig company. When raw LAS
file is in depth log, it is comfortable for software to process
data and send to calculation section. On the contrary, raw
LAS file recorded in time log needs some data transformation
from time log to depth log. This software is provided an
algorithm of data transformation based on drilling parameters
which are bit depth, fluid flow rate, surface weight on bit
(SWOB) and drillpipe velocity to ensure that the output of
depth log is considered only in drilling activity excluding
hole cleaning, pipe tripping in-out and others.
In addition, well description, bit and casing program,
drilling fluid properties and formation pressure are also
required to manually input in software interface.
B. Calculation Section
Drilling parameters in LAS file whether in depth log or
time log are accessed by MATLAB algorithm in order to
rearrange necessary data into depth log. An appropriate
model of calculating pressure loss analyzed by statistical
method is conducted to integrate with drilling parameters and
input information from user to estimate real-time ECD or
downhole pressure in format of depth log.
C. Display Section
A user-friendly program can displayed well trajectory
where the position of well has been drilled, casing program
with measured depth, also pressure window between ECD in
pound per gallon unit and measured depth in meter unit. This
displayed ECD window, widely used in oil and gas industry,
is plotted comparing with pore pressure. Pore pressure, which
is determined from repeat formation tester (RFT), is the
pressure contains fluid inside pore volume of formation.
Hence, estimated real-time ECD should be kept above pore
pressure. Whenever ECD or downhole pressure is out of
range from this window, for example below pore pressure,
user or driller will be warned that drilling condition is
harmful, and possibly lost well control.
International Journal of Materials, Mechanics and Manufacturing, Vol. 3, No. 4, November 2015
259
VI. CONCLUSION
The downhole pressure or ECD calculation while
circulating power law fluid has been studied with and without
pipe rotation effect. Several published models from both
empirical correlation and mechanistic models are used with
practical field to accurately predict downhole pressure. A
statistical analysis indicate that conventional model
combined with increased-pressure-loss from rotation speed
and diameter ratio gives precisely estimating pressure loss.
The rotation effect becomes more dominant when annular
space is narrower. An optimized model is used in a
user-friendly software development. The software need the
data input from LAS file and user, then it can display well
trajectory, casing program and ECD window in depth log. In
addition, user will be warned if drilling condition is out of
pressure window.
ACKNOWLEDGMENT
The authors would like to gratefully thank to Pan Orient
Energy (Siam) Company Limited (POES), The Petroleum
and Petrochemical College, Chulalongkorn University and
Energy Thai Trading Hubs Company Limited.
[5] M. E. Ozbayoglu and M. Sorgun, “Frictional pressure loss estimation
of non-Newtonian fluids in realistic annulus with pipe rotation,”
presented at the Canadian International Petroleum Conference (CIPC)
2009, Calgary, Alberta, Canada, June 16-18, 2009.
[6] R. Ahmed, M. Enfis, and H. M. E. Kheir, “The effect of drillstring
rotation on equivalent circulation density: Modeling and analysis of
field measurements,” presented at the SPE Annual Technical
Conference and Exhibition Florence, Italy, September 19-22, 2010.
[7] O. Erge, E. M. Ozbayoglu, S. Z. Miska, M. Yu, N. Takach, A. Saasen,
and R. May, “The effects of drilling eccentricity, rotation and buckling
configurations on annular frictional pressure losses while circulating
yield power law fluids,” presented at the 2014 IADC/SPE Drilling
Conference and Exhibition. Fort Worth, Texas, USA, March 4-6, 2014.
Weerapong Panichaporn was born in Bangkok, Thailand in 1990. He had
earned a bachelor’s in chemical engineering from Mahidol University. In
2013 he got full scholarship and earned a master’s in petroleum technology
(international program) from the Petroleum and Petrochemical College,
Chulalongkorn University, Thailand. During his master program, he worked
as petroleum engineer at Energy Thai Trading Hubs Company Limited
(ETTH), Thailand.
Ruktai Prurapark had earned a bachelor’s in chemical engineering from
Chulalongkorn University, a master’s in petroleum economics, and PhD in
petroleum engineering from Texas A&M University. During his PhD
program, he worked as lead drilling engineer for Weatherford International
in Houston, Texas. During 2008 and 2010 he worked at Schlumberger in
Colorado. In 2011, he was an assistance director of the Geospatial Data
Center located in the Department of Civil and Environmental Engineering,
Massachusetts Institute of Technology (MIT) in the US. He is currently a
founder of Energy Thai Trading Hubs Company Limited (ETTH), Thailand,
and also a visiting professor at the Petroleum and Petrochemical College,
Chulalongkorn University, Thailand.
Kitipat Siemanond had earned a bachelor’s in chemical technology from
Chulalongkorn University, Thailand, a master’s in chemical engineering
from Texas A&M-Kingsville University, USA. In 1997 he earned PhD in
chemical engineering from Lamar University, USA. He is currently an
assistant professor at the Petroleum and Petrochemical College,
Chulalongkorn University, Thailand. His current research interests are
process simulation and control, applications of pinch technology, and
numerical methods for chemical engineering.
International Journal of Materials, Mechanics and Manufacturing, Vol. 3, No. 4, November 2015
260
REFERENCES
[1] B. Hughes, Drilling Engineering Workbook: A Distributed Learning
Course, INTEQ Training & Development, Houston, 1995.
[2] L. W. Lake, Petroleum Engineering Handbook, Drilling Engineering,
Society of Petroleum Engineers, vol. II, 2006.
[3] O. Anifowoshe and S. O. Osisanya, “The effect of equivalent diameter
definitions on frictional pressure loss estimation in an annulus with
pipe rotation,” presented at the SPE Deepwater and Completions
Conference and Exhibition, Galveston, Texas, June 20-21, 2012.
[4] T. Hemphill, K. Ravi, P. Bern, and J. C. Rojas, “A simplified method
for prediction of ECD increase with drillpipe rotation,” presented at the
2008 SPE Annual Technical Conference and Exhibition, Denver,
Colorado, USA, September 21-24, 2008.