simulation of an fpga implementation of holographic video generation … · 2011-07-06 ·...
TRANSCRIPT
SIMULATION OF AN FPGA
IMPLEMENTATION OF HOLOGRAPHIC
VIDEO GENERATION IN REAL TIME
A THESIS
SUBMITTED TO THE DEPARTMENT OF ELECTRICAL AND
ELECTRONICS ENGINEERING
AND THE INSTITUTE OF ENGINEERING AND SCIENCE
OF BILKENT UNIVERSITY
IN PARTIAL FULFILLMENT OF THE REQUIREMENTS
FOR THE DEGREE OF
MASTER OF SCIENCE
By
Timur Eyüp Yılmaz
September 2010
ii
I certify that I have read this thesis and that in my opinion it is fully adequate, in
scope and in quality, as a thesis for the degree of Master of Science.
Dr. Tarık Reyhan (Supervisor)
I certify that I have read this thesis and that in my opinion it is fully adequate, in
scope and in quality, as a thesis for the degree of Master of Science.
Prof. Dr. Ekmel Özbay (Co-Supervisor)
I certify that I have read this thesis and that in my opinion it is fully adequate, in
scope and in quality, as a thesis for the degree of Master of Science.
Prof. Dr. Gözde Bozdağı Akar
I certify that I have read this thesis and that in my opinion it is fully adequate, in
scope and in quality, as a thesis for the degree of Master of Science.
Prof. Dr. Levent Onural

iii
I certify that I have read this thesis and that in my opinion it is fully adequate, in
scope and in quality, as a thesis for the degree of Master of Science.
Assist. Prof. Dr. Defne Aktaş
Approved for the Institute of Engineering and Sciences:
Prof. Dr. Levent Onural
Director of Institute of Engineering and Sciences
iv
ABSTRACT
SIMULATION OF AN FPGA IMPLEMENTATION OF HOLOGRAPHIC VIDEO GENERATION IN REAL TIME
Timur Eyüp Yılmaz
M.S. in Electrical and Electronics Engineering
Supervisor: Dr. Tarık Reyhan
Co-Supervisor: Prof. Dr. Ekmel Özbay
September 2010
Holography is a promising method for three-dimensional vision. Different
research efforts are being spent to improve generation of holograms and image
reconstruction from holograms. A computer generated hologram can be a
precise method of generating a real like video in the future. Rayleigh-
Sommerfeld diffraction method and Fresnel-Kirchhoff diffraction formula are
two algorithms suitable for FPGA implementation of hologram calculation.
Simulator image reconstructions and optical image reconstructions with spatial
light modulator using the generated holograms are compared and it is seen that
they are quite similar. A field programmable gate array (FPGA) implementation
of real time holographic video generation based on Rayleigh-Sommerfeld
formulation is simulated. FPGA implementation is tested and verified by a
computer simulator. An FPGA board capable of capturing video input and
giving video output for spatial light modulator (SLM) is chosen as the
implementation platform for simulations. A small size hologram calculator can
be implemented on the FPGA board. A custom board for specific hologram
calculation algorithm can be designed to increase the performance. Pipelined
architecture and SDRAM memories can be used to increase the performance.
Keywords: Computer generated holograms, Field programmable gate array,
Rayleigh-Sommerfeld diffraction, spatial light modulator, image reconstruction
using hologram.

v
ÖZ
GERÇEK ZAMANLI HOLOGRAFIK VIDEO
ÜRETİMİNİN FPGA UYGULAMASI SİMÜLASYONU
Timur Eyüp Yılmaz
Elektrik ve Elektronik Mühendisliği Bölümü Yüksek Lisans
Tez Yöneticisi: Dr. Tarık Reyhan
Tez Eş Yöneticisi: Prof. Dr. Ekmel Özbay
Eylül 2010
Holografi üç boyutlu görüntü için gelecek vadeden bir yöntemdir.
Hologramların üretilmesini ve hologramlardan elde edilen görüntüleri
geliştirmek için farklı araştırmalar yapılmaktadır. Gelecekte bilgisayarla
üretilmiş hologramlar gerçek gibi görünen görüntülerin üretilmesi için uygun bir
yöntem olabilir. Rayleigh-Sommerfeld kırınım yöntemi ve Fresnel-Kirchhoff
kırınım yöntemi hologram üretiminin saha programlanabilir kapı dizini (FPGA)
uygulaması için uygun iki algoritmadır. Üretilen hologramları kullanarak optik
görüntü oluşturma sonuçları ile simülatör ile üretilen görüntüler
karşılaştırılmıştır ve tutarlı oldukları görülmüştür. Rayleigh-Sommerfeld
formülasyonu ile gerçek zamanlı holografik video üretiminin FPGA uygulaması
simülasyonu yapılmıştır. FPGA uygulaması bir bilgisayar simülatörü ile test
edilmiş ve doğrulanmıştır. Simülasyonlar için uygulama platformu olarak video
alabilen ve uzaysal ışık modülatörüne (SLM) uygun video çıkışı verebilen bir
FPGA kartı seçilmiştir. FPGA kartı üzerinde küçük boyutlu hologram üreteci
uygulanabilir. Performansı arttırmak için seçilen bir hologram üretim yöntemine
uygun özel bir kart yapılabilir. Ardışık düzenli bir yapı ve SDRAM bellekler
performansı arttırmak için kullanılabilir.
Anahtar Kelimeler: Bilgisayarla üretilmiş hologramlar, FPGA, Rayleigh-
Sommerfeld kırınımı, SLM, hologram kullanarak görüntü oluşturma.
vi
Acknowledgements
I would like to thank my supervisors Dr. Tarık Reyhan and Prof. Dr. Ekmel
Özbay for their supervision, guidance, and suggestions throughout my graduate
studies.
I would also like to thank Prof. Dr. Levent Onural, Dr. Gökhan Bora Esmer, and
Dr. Fahri Yaraş for their help and comments about my graduate studies.
I would also like to thank ASELSAN and TÜBİTAK for aiding and encouraging
my graduate study.
Finally I would like to thank my wife Sezen and my family for their
understanding and help throughout my graduate study.

vii
Table of Contents
1 Introduction ................................................................................................ 1
2 Hologram Generation and Holographic Displays Using SLMs ............. 5
2.1 Hologram Generation ......................................................................... 5
2.2 Image Reconstruction Using Holograms ............................................ 6
2.3 Computer Generated Hologram Algorithms ...................................... 7
2.3.1 Rayleigh-Sommerfeld Diffraction Method ............................... 8
2.3.2 Fresnel-Kirchhoff Diffraction Method ................................... 12
2.3.3 Bipolar Intensity Method ........................................................ 18
2.4 Image Reconstruction Methods for Computer Generated Holograms
................................................................................................................ 23
2.4.1 Dynamic Display Reconstruction ........................................... 24
2.4.2 Computer Reconstruction ....................................................... 30
3 Simulator Implementation ...................................................................... 33
3.1 Introduction ...................................................................................... 33
3.2 Computer Simulation Results ........................................................... 36
3.3 Optical Reconstruction Results ........................................................ 66
4 Simulation of FPGA Implementation ..................................................... 70
4.1 Introduction ...................................................................................... 70
viii
4.2 Implementation ................................................................................. 72
4.2.1 Auxiliary Operation Blocks .................................................... 72
4.2.2 Main Operation Blocks ........................................................... 77
5 Conclusions ............................................................................................... 89
A ML 505 Board Features ........................................................................... 93

ix
List of Figures
2.1 Real Part Of A Transfer Function Calculated By R-S Diffraction Formula
(Eq. 2.11). ................................................................................................... 11
2.2 Imaginary Part Of A Transfer Function Calculated By R-S Diffraction
Formula (Eq. 2.11). .................................................................................... 12
2.3 Real Part Of Transfer Function Calculated By Fresnel-Kirchhoff Diffraction
Formula (Eq. 2.15). .................................................................................... 17
2.4 Imaginary Part Of Transfer Function Calculated By Fresnel-Kirchhoff
Diffraction Formula (Eq. 2.15). .................................................................. 18
3.1 Optical Setup Used To Reconstruct Images From Simulator Generated
Holograms .................................................................................................. 34
3.2 The Input Pattern That Is Used To Simulate Diffraction From A Single
Point. ........................................................................................................... 38
3.3 The Magnitude Of The Diffraction Field At A Distance Of 4 Cm For
Rayleigh-Sommerfeld Method Shown By Equation (2.8). ........................ 39
3.4 The Phase Of The Diffraction Field At A Distance Of 4 Cm For Rayleigh-
Sommerfeld Method Described By Equation (2.8). ................................... 40
3.5 The Magnitude Of The Diffraction Field At A Distance Of 4 Cm For
Fresnel-Kirchhoff Method Using By Equation (2.16). ............................... 41
3.6 The Phase Of The Diffraction Field At A Distance Of 4 Cm For Fresnel-
Kirchhoff Method Using Equation (2.16). ................................................. 42

x
3.7 The Two-Dimensional Input Image Used In Simulations. .......................... 43
3.8 Magnitude Of The Hologram Calculated By Rayleigh-Sommerfeld
Diffraction Using Equation (2.8). ............................................................... 44
3.9 Phase Of The Hologram Calculated By Rayleigh-Sommerfeld Diffraction
Using Equation (2.8). ................................................................................. 45
3.10 Phase Of The Reconstructed Image Calculated By Rayleigh-Sommerfeld
Diffraction Using Equation (2.8). ............................................................... 46
3.11 Magnitude Of The Reconstructed Image Calculated By Rayleigh-
Sommerfeld Diffraction Using Equation (2.8). .......................................... 47
3.12 Magnitude Of The Hologram Calculated By Fresnel-Kirchhoff Diffraction
Using Equation (2.16). ............................................................................... 48
3.13 Phase Of The Hologram Calculated By Fresnel-Kirchhoff Diffraction
Using Equation (2.16). ............................................................................... 49
3.14 Phase Of The Reconstructed Image Calculated By Fresnel-Kirchhoff
Diffraction Using Equation (2.16). ............................................................. 50
3.15 Magnitude Of The Reconstructed Image Calculated By Fresnel-Kirchhoff
Diffraction Using Equation (2.16). ............................................................. 51
3.16 The Two-Dimensional Gray Scale Input Pattern. ..................................... 52
3.17 Magnitude Of The Hologram Calculated By Rayleigh-Sommerfeld
Method Using Equation (2.8) ..................................................................... 53
3.18 The Phase Of The Reconstructed Image Calculated By Rayleigh-
Sommerfeld Method Using Equation (2.8). ............................................... 54
xi
3.19 The Magnitude Of The Reconstructed Image Calculated By Rayleigh-
Sommerfeld Method Using Equation (2.8). ............................................... 55
3.20 The Phase Of The Hologram Calculated By Rayleigh-Sommerfeld Method
Using Equation (2.8). ................................................................................. 56
3.21 The Phase Of The Reconstructed Image Using Equation (2.8). ................ 57
3.22 The Magnitude Of The Reconstructed Image Using Equation (2.8). ........ 58
3.23 The Magnitude Of The Hologram Calculated By Fresnel-Kirchhoff
Method Using Equation (2.16). .................................................................. 59
3.24 The Phase Of The Reconstructed Image Calculated By Fresnel-Kirchhoff
Method Using Equation (2.16). .................................................................. 60
3.25 The Magnitude Of The Reconstructed Image Calculated By Fresnel-
Kirchhoff Method Using Equation (2.16). ................................................. 61
3.26 Phase Of The Reconstructed Image Generated By Rayleigh-Sommerfeld
Method Using Equation (2.8). .................................................................... 63
3.27 Magnitude Of The Reconstructed Image Generated By Rayleigh-
Sommerfeld Method Using Equation (2.8). ............................................... 64
3.28 Phase Of The Reconstructed Image Generated By Fresnel-Kirchhoff
Method Using Equation (2.16). .................................................................. 65
3.29 Magnitude Of The Reconstructed Image Generated By Fresnel-Kirchhoff
Method Using Equation (2.16). .................................................................. 66
3.30 Optically Reconstructed Image From The Hologram Shown In Figure 3.16
Using The Setup Shown In Figure 3.1. ...................................................... 68

xii
3.31 Optically Reconstructed Image From The Hologram Shown In Figure 3.8
Using The Setup Shown In Figure 3.1. ...................................................... 69
4.1 FPGA Implementation Architecture. ........................................................... 72
4.2 Block Diagram Of Clock Synthesizers ........................................................ 73
4.3 The Block Diagram Of Video Input Buffer. ................................................ 75
4.4 The Block Diagram Of Video Output Buffer .............................................. 76
4.5 The Block Diagram Of The SRAM Memory Interface. .............................. 77
4.6 The Block Diagram Of Fourier Transform Block ....................................... 80
4.7 The Simulation Result That Shows No Overflow Exist. ............................. 81
4.8 The One-Dimensional Input Pattern Used For Fourier Transform Test
Block. ......................................................................................................... 82
4.9 The Input Pattern Used In Fourier Transform Simulation. ........................ 83
4.10 The Output Obtained From The Fourier Transform Test Block .............. 84
4.11 The Simulation Window Obtained From The Fourier Transform Test ..... 85
4.12 The Block Diagram Of Complex Multiplier Block ................................... 86
4.13 The Block Diagram Of “Arc Tan” Conversion Block. ............................. 88
1
Chapter 1
Introduction
Communication plays an important part in human life. Various methods are used
to communicate through human history. Visual communication is one of the
effective communication methods as “a picture is worth a thousand words”.
Extending the visual communications to 3D and even to 3D-video is one of the
dreams of the new technological age. Today technological developments have
made the transfer of text, sound, image or video including the three-dimensional
video possible. The invention of television was an important step for mass
communication and from the beginning of its usage; the futurists dreamed about
three-dimensional televisions. One of the desires of researchers is transferring
three-dimensional video in real time and communicating with three-dimensional
vision.
One of the display type used to display three-dimensional images is
stereoscopic displays [9]. Stereoscopic displays use human vision properties to
display a three-dimensional image. The target scene is recorded with two
aligned cameras [9]. The recording process is similar to looking at an object
with two eyes. Then the recorded image on the right camera is displayed only to
right eye and the image of the other camera is displayed only to the left eye.
Various types of optical equipment can be used to achieve this goal. Our brain
processes these two slightly different images and a three-dimensional vision is
created in our mind. Thus stereoscopic three-dimensional displays do not show a
real three-dimensional image [28]. Today stereoscopic display television sets are
commercially available.
2
Denis Gabor invented holography in 1947 and took Nobel Prize in physics
in 1971 for his invention [1]. He stated that recording the properties of light
coming from a scene by using a coherent light source as a reference and later
reconstructing the recorded complete information of the scene would be possible
[1]. His idea did not become real until the laser was invented and Denis Gabor
stated that Emmett N. Leith and Juris Upatnieks published the first successful
hologram by the help of their knowledge in side-looking radar in his Nobel
lecture. In this method information of the incoming light from a scene is
recorded and thus three-dimensional image of the scene becomes visible when
the recorded hologram is illuminated [1].
The display is one of the important parts in a three-dimensional system since
the observer interacts with the display and this interaction is the impressive and
interesting part of a three-dimensional system [4]. To be able to display a three-
dimensional image on a dynamic display Savaş Tay et al have developed an
updatable holographic three-dimensional display [29]. Lucente et al developed a
three-dimensional display which uses an acousto-optic modulator and scanners
to display three-dimensional images [14]. In fact developing a dynamic three-
dimensional display has become a goal for many researchers [4].
Optical reconstruction of a scene using hologram is important because this
operation results in promising real three-dimensional images. Today a scene can
be reconstructed optically or on the computer using hologram. The results of
these two methods are close and relevant and thus computer reconstruction of
the scene is used to verify the computer generated holograms before optical
reconstruction of the scene [4], [5], [6], [25]. Spatial light modulators available
today are used to optically reconstruct images using holograms [4], [5], [6], [7].
Additionally, different researchers tried to extract more from spatial light
modulators. They used cascaded systems to increase the quality of the
reconstructed image [18]. Reconstructing a color image by spatial light
modulators is also possible and implemented [17], [21], [23]. Furthermore,

3
reconstructing an image larger that the spatial light modulator and reconstructing
images at different depths using a single hologram is also possible [5]. These
work show that using a spatial light modulator for scene reconstruction using
hologram is useful and promising for the future.
The developments in computer technology made it possible to generate a
hologram using a computer as stated above. However the computational need of
computer generated holograms is huge since a lot of points on the object must be
considered for a successful image reconstruction. To overcome this problem
various methods are used. The use of a graphic processing unit or graphics
hardware as an application specific hardware to calculate the hologram are
methods to accelerate the computation of holograms on computer [2], [3]. Use
of precomputed look-up tables is another method to accelerate the calculation of
a hologram on computer [8]. Reducing the data to be used in the calculation is
also another method to reduce the time to calculate a hologram on computer
[14]. Some researchers used FPGAs to accelerate the calculation of a hologram
[10], [11], [12]. Some useful approximations are made to reduce the
computational time in FPGA based hologram generation systems [10], [11].
In this thesis, we targeted to reduce the computational time need for
hologram generation. To reduce this time, we chose a method to generate the
hologram in a faster way. We focused on hardware implementation of hologram
generation and simulated an implementation of hologram generation algorithm
in FPGA. We chose to use a FPGA because it can work in real time and
different blocks in a FPGA can work simultaneously. This is one of the main
strength of FPGA against processors. FPGAs can also do some operations used
in calculation and displaying of hologram in a few clock cycles while a
processor needs a few hundred clock cycles to carry out the same function. It
has floating point operation disadvantage against processors in the past but
today it can do the calculations needed to generate the hologram by using its
special hardware embedded in it.

4
In this thesis, we have simulated the implementation of Rayleigh-
Sommerfeld diffraction method in FPGA to generate a hologram and display the
hologram on Holoeye HEO1080P phase-only spatial light modulator. We chose
this method because it worked in our setup including the FPGA and the SLM.
This implementation takes a color video in and uses one of the color
components as input, calculates the hologram of that monochrome image and
outputs the result in a suitable format to drive the spatial light modulator. The
reconstructed image of the monochrome input pattern is obtained when the
hologram is displayed by using the spatial light modulator.
The organization of this thesis is as follows. In Chapter 2, hologram
generation and scene reconstruction using hologram methods are discussed,
computer generated hologram algorithms Rayleigh-Sommerfeld, Fresnel-
Kirchhoff and bipolar intensity method are summarized. Computer
reconstructions of images using holograms are discussed and scene
reconstruction by using dynamic displays is explained. In Chapter 3, the
simulator prepared to verify and assist the simulation of the implementation in
the FPGA is introduced, computer generation of holograms by Rayleigh-
Sommerfeld method and Fresnel-Kirchhoff methods for different patterns and
different scenarios are discussed, computer reconstruction of the scenes by using
holograms generated by these methods are stated and finally optical image
reconstruction results are shown. In Chapter 4, simulation of FPGA
implementation of Rayleigh-Sommerfeld method is discussed, the blocks used
for this implementation are summarized and the decisions made for this
implementation are stated. Future developments and discussion of the
implementation are discussed in Chapter 5.

5
Chapter 2
Hologram Generation and Holographic Displays Using SLMs
2.1 Hologram Generation
A hologram can be generated by using an optical set up designed for recording a
hologram on a holographic plate. There are different methods and setup types to
generate a hologram depending on the optical equipment used in the setup [1].
The main idea in these setups is using a laser as coherent light source. The laser
beam is split into two parts; one beam is named the reference beam and the other
beam is named the object beam. Reference beam is directed to holographic plate
and evenly distributed over it with suitable optical equipment and directly goes
to holographic plate without diffraction or reflection apart from propagation
diffraction. Object beam goes to desired object to illuminate it and reflects from
the object onto the holographic plate. At the plate; the diffraction pattern created
by the interference of the reflected and the reference beams is recorded. This
interference pattern carries the information about the distribution of the light
fields over the aperture defined by the holographic plate including phase and
magnitude [1].
Computer generated holograms are holograms that are calculated by using
computers without using an optical setup. Since propagation and diffraction of
light can be calculated numerically; calculating the hologram of a virtual object
is possible [1]. To generate a hologram by computer; first the desired object is
modeled and rendered by using several methods such as triangular meshes

6
representation and point models [2], [3]. After modeling the object; reference
beam’s and object beam’s propagation, reflection, and diffraction are calculated
by using numerical methods. At the end magnitude and phase properties of light
at the virtual hologram plate created the interference of the reference beam and
the reflected object beam is found [1].
2.2 Image Reconstruction Using Holograms
Today a hologram can be used to reconstruct a scene optically and by using a
computer. To optically reconstruct a scene by using an optically recorded
hologram; a suitable laser beam is directed to recorded hologram plate by using
suitable diverging lenses and mirrors [1]. The recorded hologram plate diffracts
the incoming laser beam according to the recorded light properties and so the
desired image is created as real image and virtual image and can be viewed by
the observer. Optical image reconstruction method can also be used for
reconstructing images from computer generated holograms. However; a scene
represented by a computer generated hologram can be reconstructed by the help
of suitable displays such as SLMs or it must be printed on a holographic film or
plate [1], [4], [18], [20], [21], [22]. Computer generated holograms printed on
holographic film or plate are used to reconstruct images as optically recorded
holograms are used to reconstruct images. Reconstruction of images from
computer generated holograms by using special displays is similar to image
reconstruction from an optically recorded hologram. It uses the special display
as printed or optically recorded holographic film in image reconstruction from
optically recorded hologram. The special display must be properly driven to be
used as recorded hologram plate. The other optical elements and methods used
to reconstruct an image from a computer generated hologram are the same
optical elements and methods used to reconstruct an image from an optically

7
recorded hologram. Namely, in image reconstruction from computer generated
hologram by using special displays; the display is used as the holographic film.
Image reconstruction from hologram by using computer is also possible and
it is common to do so [4], [5], [6], [13]. This method is widely used for viewing
the estimated results of an experiment in a short time. It is based on numerical
calculation of propagation and diffraction of light that passes through or reflects
from the hologram plate. The diffraction and propagation of suitable light beam
directed towards the hologram is calculated numerically and the vision at the
desired observation point is calculated. This vision is the reconstructed image of
the hologram.
2.3 Computer Generated Hologram Algorithms
Researchers have been dealing with computer generated holograms for long time
and they developed different methods and algorithms for this purpose [4], [8].
One of these methods is to calculate the diffraction of light due to a planar object
in space. In this method; hologram of a two-dimensional image is calculated to be
reconstructed as a two-dimensional real image. There are frequently used
methods used in computer generated holograms to compute the diffraction due to
a planar object in space. These methods are called Rayleigh-Sommerfeld
diffraction method, Fresnel-Kirchhoff diffraction formula and bipolar intensity
method [4], [8]. For far field diffraction calculations; Fraunhofer approximations
are more convenient than these methods [4]. Additionally there are iterative
methods and algorithms to calculate the hologram of an object [5].
For a successful generation of and reconstruction from a computer generated
hologram, optical properties of the target display film or device and the coherent
light source to be used must be taken into account. These optical properties
8
include the number of pixels and pixel period of the display device, the medium
that reconstruction light beam travels through, the diffraction type of the display
device and its diffraction capability, geometrical properties of the display device
such as cavity and size, the wavelength of the light beam and the distance
between the desired image location and the display device [4]. These properties
are needed to make proper calculation of the hologram possible.
2.3.1 Rayleigh-Sommerfeld Diffraction Method
Rayleigh-Sommerfeld diffraction method is one of the methods that can be used
to calculate a computer generated hologram that can be displayed by a suitable
spatial light modulator. The diffraction formula is described in detail in [4]. The
scalar diffraction of monochromatic coherent light that travels in a homogeneous
and linear medium between two parallel planes can be expressed as a plane-wave
decomposition (PWD). By using the plane-wave decomposition; the diffraction
field relation between the input object and the output fields can be
written as [4]:
(2.1)
where is a set of such that:
(2.2)
and is the two-dimensional Fourier transform from (x,y) domain to (kx , ky)
domain defined as:
� � . (2.3)
9
The spatial frequencies of the propagating waves along the , , and axes are
represented as , , and where [4]
(2.4)
and
(2.5)
By using these equations; Equation (2.1) can be rewritten as
� (2.6)
where is the inverse Fourier transform from domain to domain
defined as:
� � (2.7)
To use Equation (2.6) in computer calculations it has to be written in discrete
form. This can be done by sampling the Equation (2.6) with spectral sampling
period equal to along all spatial axes with , , and . After
these operations discrete representation of Equation (2.6) is written as:
(2.8)
where is the discrete Fourier transform size, is the discrete Fourier
transform written as:

10
�
�
�
� (2.9)
and is the inverse discrete Fourier transform written as:
�
�
�
� (2.10)
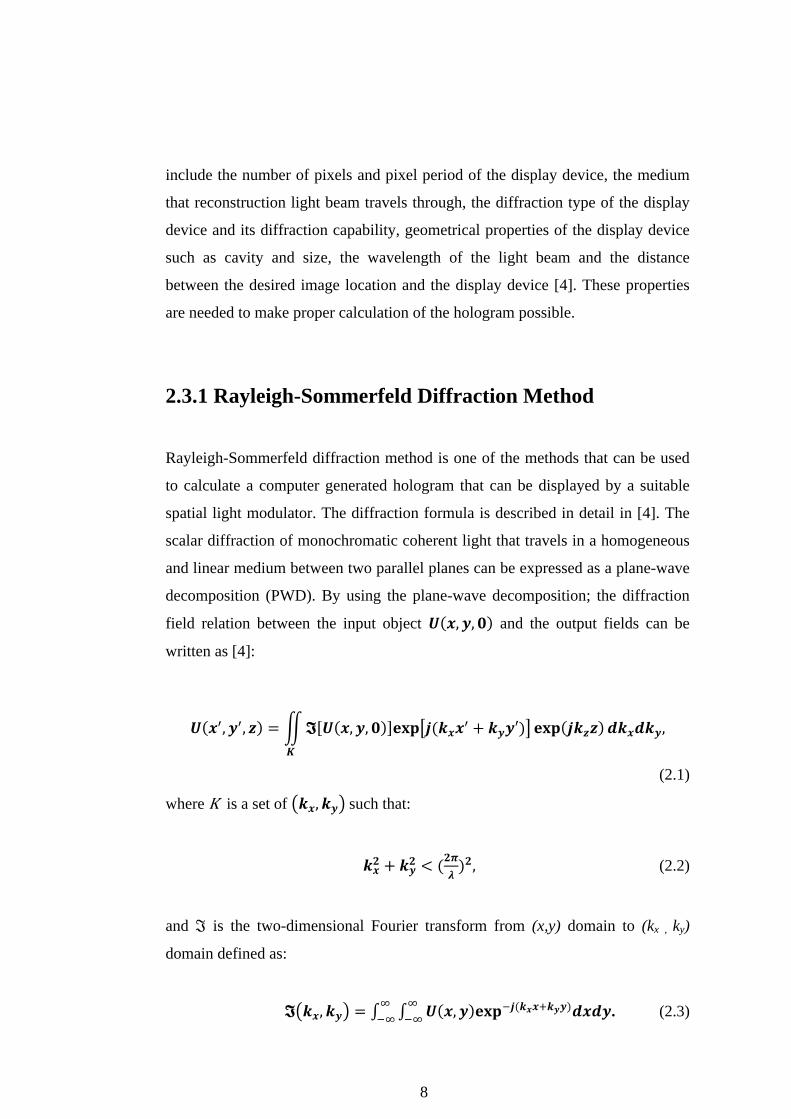
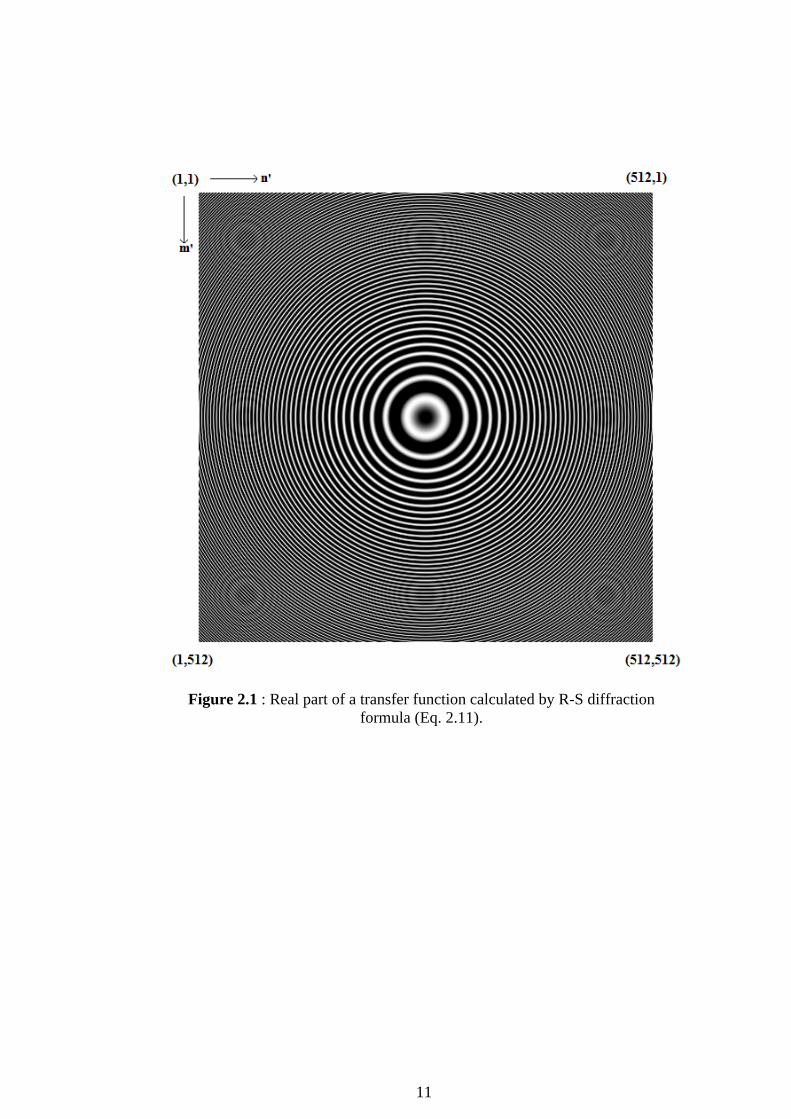
and the transfer function is:
, (2.11)
(2.12)
In Equations (2.9) and (2.10); is the number of samples in direction and
is the number of samples in direction. Equation (2.11) is named as the
transfer function related to wave propagation. This function changes with the
distance between the object and the hologram plane, number of samples in
and direction , the sampling period which is equal to pixel period of the
spatial light modulator to be used in reconstruction and the wavelength of the
coherent light source. Figure 2.1 shows the real part of a Transfer Function
(2.11) calculated by R-S diffraction method for =3.9cm, =532nm, =8µm,
=512. The variables [1,512]. Figure 2.2 shows the imaginary part of
this transfer function.
11
Figure 2.1 : Real part of a transfer function calculated by R-S diffraction formula (Eq. 2.11).

12
Figure 2.2 : Imaginary part of a transfer function calculated by R-S diffraction formula (Eq. 2.11).
2.3.2 Fresnel-Kirchhoff Diffraction Method
The other method to calculate the diffraction field due to a planar object in space
is Fresnel-Kirchhoff diffraction formula. According to Fresnel diffraction
formula; the field over the hologram plane U(x’,y’,z) is [4]:
(2.13)

13
The equation above is the two-dimensional convolution of the input object
U(x,y,0) with transfer function K(x,y,z) which equals to [4]:
� �
(2.14)
Equation (2.14) can be written in discrete form. This can be done by sampling the
Equation (2.14) with spectral sampling period equal to along all spatial axes
with , , and . After these operations discrete representation
of Equation (2.14) is written as:
� �
�� � �
��
(2.15)
where is the number of samples in and direction. The hologram calculation
by using Equation (2.15) is done as:
(2.16)
where is the inverse Discrete Fourier transform defined in Equation
(2.10) and is the Fourier transform defined in Equation (2.9).
When we drop the constant terms (-j/λz; exp(jkz)) in Equation 2.13 and write the
inner integral with respect to x for a specific value of y with overall discrete array
size equal to X, we can split the integral for each pixel of the desired display
device as follows [4]:
(2.17)

14
where
� �
(2.18)
and
(2.19)
In Equation (2.19); ci is the magnitude of the pixel in the input image or object.
The value of y is kept constant at a fixed value σ. After these equations; it is seen
that for a single pixel’s area; U(x,y,0) i.e. the input pattern is constant. If we
adjust xi , σ, and the integral boundaries to coincide with the input pattern’s pixel
boundaries and write the integral above; U(x,y,0) will be constant for all split
integral parts [4]. And thus; we can write U(x,y,0) out of the integral. We can
write this situation as follows [4]:
�
� ��
. (2.20)
To write each of the integrals in (2.17) as Fresnel integrals the substitutions:
�
(2.21)
are done [4]. After these substitutions the equation for each split part becomes
[4]:
�
�
, (2.22)
15
where 1 ≤ i ≤ N. In the equation above; C(τi) and S(τi) are cosine and sine Fresnel
integrals. Each integral in (2.17) corresponds to an area at the input field which is
a pixel area and thus has a constant value equals to U(xi,y). If we assume that:
, (2.23)
we can write [4]:
, (2.24)
where 1 ≤ i,j ≤ N. The sum of Equation (2.17) along x direction can be written as
follows [4]:
. (2.25)
This equation is the discrete form of the convolution along x direction. These
operations can be applied along y direction. If we assume that there are M
samples in y direction, the equation along y direction becomes as follows [4]:
,
(2.26)
where
. (2.27)
When we combine Equation (2.25) with (2.26) in both coordinate axis directions,
we can derive the two-dimensional convolution of the equations in discrete form
as:
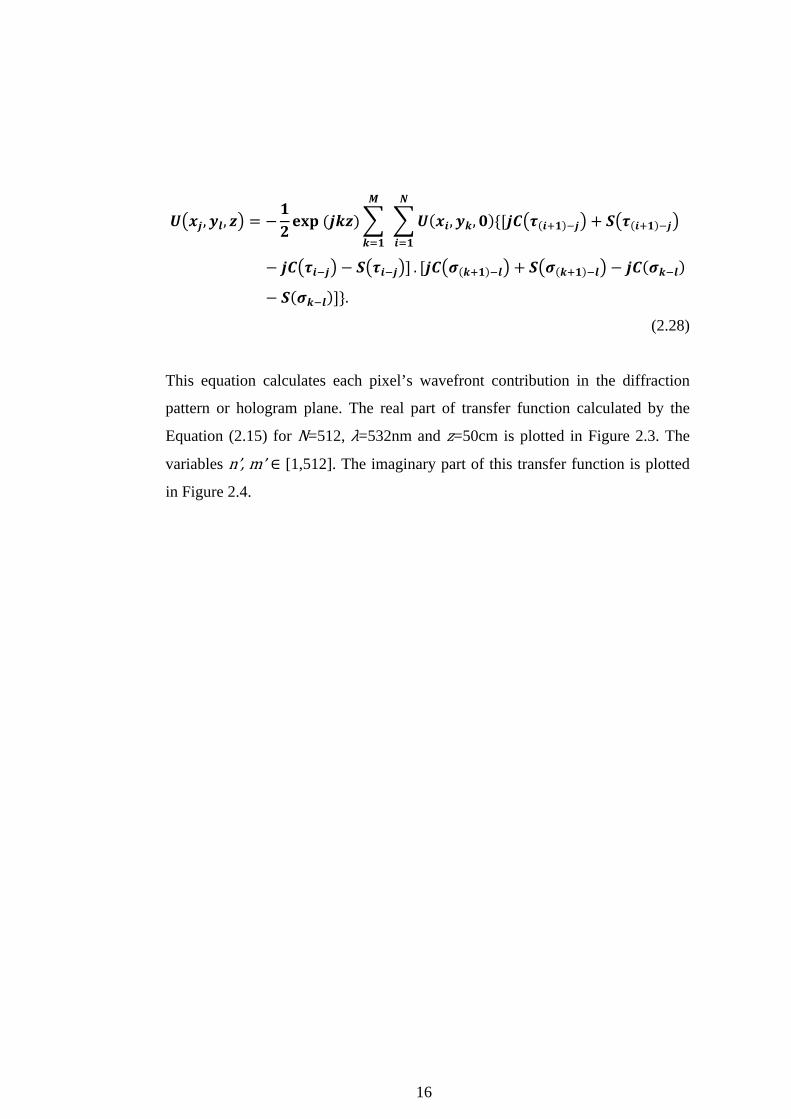
16
(2.28)
This equation calculates each pixel’s wavefront contribution in the diffraction
pattern or hologram plane. The real part of transfer function calculated by the
Equation (2.15) for =512, =532nm and =50cm is plotted in Figure 2.3. The
variables [1,512]. The imaginary part of this transfer function is plotted
in Figure 2.4.

17
Figure 2.3 : Real part of transfer function calculated by Fresnel-Kirchhoff diffraction formula (Eq.2.15).

18
Figure 2.4 : Imaginary part of transfer function calculated by Fresnel-Kirchhoff diffraction formula (Eq.2.15).
2.3.3 Bipolar Intensity Method
In computer generated holograms; huge computational power is required to
numerically compute optical diffraction and interference of light. This need for
huge computational power is a challenging problem of hologram generation,
image reconstruction from hologram and real three-dimensional vision. To
overcome these complex calculation procedures several different methods are
introduced [3], [8], [9], [10], [11], [12], [14]. For calculation reduction; the
vision characteristics of human eye is carefully studied and several sampling and
19
calculation reductions are introduced without significant degrading the imaging
performance of the system [9], [14], [15].
Bipolar intensity method is another numerical calculation method for
diffraction and interference of light travelling from a source to hologram plane.
It is named as bipolar because it allows the hologram plane intensity output
representation to be both positive and negative which is physically impossible
but computationally possible [8]. In optical generation of hologram; reference
beam is directed toward the hologram plane. This means that the reference beam
provides a nearly invariant DC bias to hologram plate. This bias makes sure that
the intensity of light at the hologram plate is always larger than the sensitivity of
the hologram recording plate which corresponds to intensity being physically
nonnegative [8].
In optical holography; the object beam and the reference beam are both
represented by spatially varying complex time harmonic electric field vectors
[8]. The reference beam is named Er and the object beam is named as Eo. Since
both object beam and reference beam originate from the same monochrome light
source; their polarizations are thought to be same. On the hologram plate; the
square of the magnitude of incoming light beams are regarded as optical
intensity. By these assumptions; one can write total intensity pattern on the
hologram plate as [8]:
(2.29)
In this formula; the first term is the self-interference of the object beam;
which is caused by interfering light beams reflected from different points on the
object. This term causes unwanted image distortions during the reconstruction
process. The second term is named reference beam intensity. It adds a DC bias
term to intensity of points on the hologram plane which makes sure that the
intensity at the hologram plane is always larger than the minimum sensitivity of

20
the hologram recording medium. The third term is the interference between the
object beam and reference beam. This term is the necessary information term for
hologram generation and using only this term is sufficient to reconstruct
holographic image [8].
To reduce the computational cost of computer generated holograms; the first
and second term in the formula can be omitted. The first term can be omitted
because it contains the objects self interference patterns which usually causes
unwanted distortions in the reconstructed image. The second term can be also
omitted because in computer generated holograms; normalization and
quantization according to the display medium will be applied to the results to
obtain the generated holograms [8]. To calculate and generate a hologram only
the third term which is the interference between the reference beam and object
beam is calculated.
When point source summation method is used to compute the horizontal
parallax only hologram it is assumed that every point on the object has magnitude
ap and phase Φp relative to the reference beam. Since y is constant for horizontal
parallax only hologram; the following equation for Φ(x) can be written [8]:
, (2.30)
where
. (2.31)
The total sum of object field for a single line for a constant y can be written as
[8]:
�
�
� (2.32)
21
where Ny is the number of points on the object that contributes to the desired
hologram line for constant y. In this formula it is assumed that each point on the
object is a source. The function e(x) is the envelope function. This envelope
function limits the contribution region of the point on the object. It is equal to one
in the contribution region of point , and equal to zero for other values of . This
limitation is useful to limit the spatial bandwidth to avoid aliasing and reduce the
number of calculations to generate the hologram [8].
The magnitude of the reference beam is assumed to be constant for the
hologram plane because zr is larger enough than xr so the change in the magnitude
of the reference beam across the hologram line is very small. By using these
assumptions one can write the reference beam as [8]:
(2.33)
where
(2.34)
where
is the magnitude of reference beam at the hologram plane’s center. This
magnitude is assumed to be constant at the hologram plane [8].
When we use Equation (2.32) and Equation (2.33) to compute the third term in
Equation (2.29) i.e. Ib(x) we find the following:
�
�
�
(2.35)
�
�
� (2.36)
22
where denotes the real part function and denotes the complex conjugate
function. This equation equals to:
�
�
� . (2.37)
In this equation; the normalization procedure is applied by assuming
as
unity. Additional DC bias and scaling is done to the resultant equation to make
sure that point values on the hologram plate can be displayed on the desired
display device such as spatial light modulators [4].
If we write the Equation (2.37) for a hologram which is not a horizontal
parallax only hologram; we can write the intensity function as [3]:
(2.38)
where intensity of a pixel on the hologram plane is , is the number of
points on the object, is the magnitude of the currently calculated object point,
is the wavelength of the reference light, and are the coordinates of the
currently calculated object point and is the object point number of the currently
calculated point.
Every point on the object must be taken into account to calculate a single
pixel on the hologram plane when using Equation (2.38). This means that for
well defined and sampled objects and large holograms, the calculation time will
be larger. To speed up this process; a pre-calculated look-up table set can be
used. Several different tables can be generated for different look-up operations
and by using these tables; computation time of the hologram can be reduced
dramatically [16].

23
2.4 Image Reconstruction Methods for Computer Generated Holograms
Images from computer generated holograms can be reconstructed by using
various methods and algorithms. A computer generated hologram can be printed
on a holographic film and the image from the hologram can be reconstructed
optically. It is also possible to observe a computer generated hologram under
daylight if it is printed on a suitable holographic film. Holographic films are
good at creating realistic three-dimensional static images but they are not useful
for real time three-dimensional video imaging applications.
The technical advances in optics, material sciences and electronics yield
display devices such that light passing through or reflected from the device can
be modulated. These display devices can change the properties of light directed
to it like a printed holographic film. One of the important property of these
devices is one can update the hologram frame displayed on the device as fast as
a monitor refreshes the image displayed on it. This type of display devices are
called dynamic displays. They made possible to show a holographic video in
real time. Today their number of pixels, pixel pitch, and fill factor are high
enough to reconstruct holographic images but this is not high enough to
reconstruct realistic looking three-dimensional images [4].
Another method to create the output image of a computer generated
hologram is numerical reconstruction. Since diffraction, reflection and
propagation of light can be calculated numerically on computers, it is also
possible to calculate the resultant image of the calculated hologram illuminated
by a specific light beam at a desired point. In fact this operation is nearly the
same operation when calculating a hologram on the computer. Additionally this
method is easier because it does not need an optical setup. Changing the
parameters in the reconstruction process is also easier than optical
reconstruction. Another benefit of this method is you do not have to feed your
24
calculated hologram located on the memory of your computer to other device.
The result of a hologram can be quickly observed.
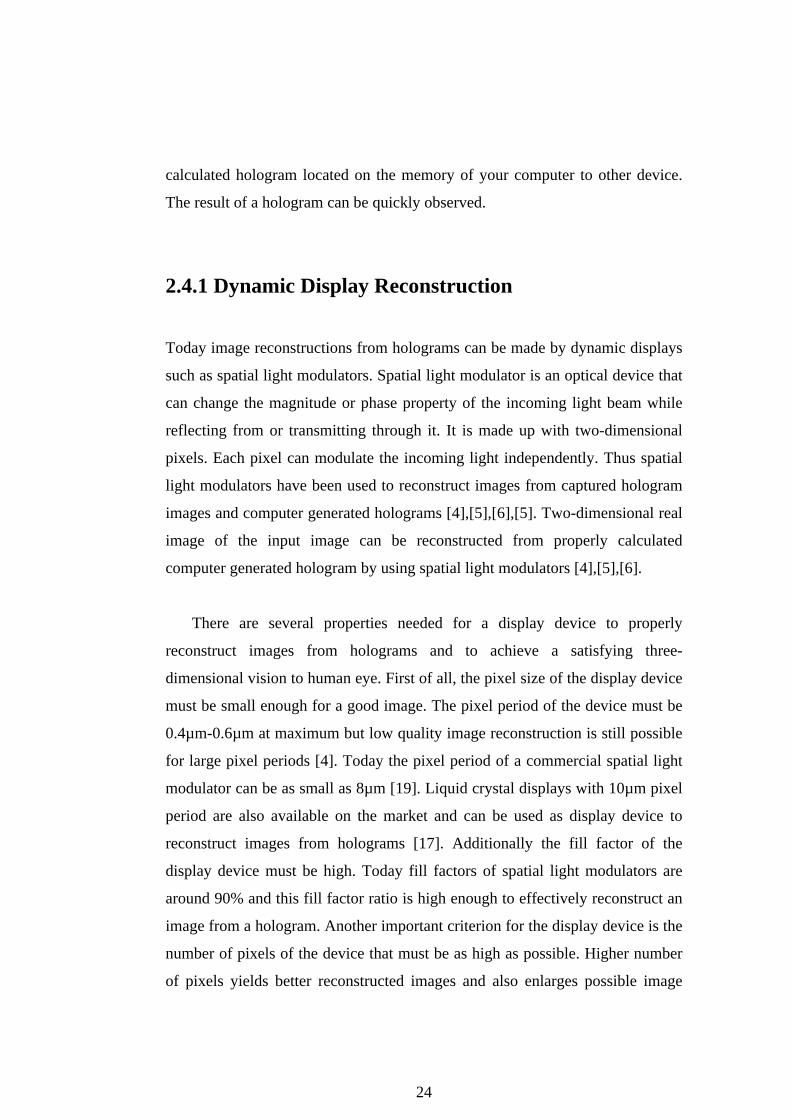
2.4.1 Dynamic Display Reconstruction
Today image reconstructions from holograms can be made by dynamic displays
such as spatial light modulators. Spatial light modulator is an optical device that
can change the magnitude or phase property of the incoming light beam while
reflecting from or transmitting through it. It is made up with two-dimensional
pixels. Each pixel can modulate the incoming light independently. Thus spatial
light modulators have been used to reconstruct images from captured hologram
images and computer generated holograms [4],[5],[6],[5]. Two-dimensional real
image of the input image can be reconstructed from properly calculated
computer generated hologram by using spatial light modulators [4],[5],[6].
There are several properties needed for a display device to properly
reconstruct images from holograms and to achieve a satisfying three-
dimensional vision to human eye. First of all, the pixel size of the display device
must be small enough for a good image. The pixel period of the device must be
0.4µm-0.6µm at maximum but low quality image reconstruction is still possible
for large pixel periods [4]. Today the pixel period of a commercial spatial light
modulator can be as small as 8µm [19]. Liquid crystal displays with 10µm pixel
period are also available on the market and can be used as display device to
reconstruct images from holograms [17]. Additionally the fill factor of the
display device must be high. Today fill factors of spatial light modulators are
around 90% and this fill factor ratio is high enough to effectively reconstruct an
image from a hologram. Another important criterion for the display device is the
number of pixels of the device that must be as high as possible. Higher number
of pixels yields better reconstructed images and also enlarges possible image

25
area at the observation point. Number of pixels and pixel period of the display
device together determine the output image size and quality.
A hologram contains the information of light magnitude and phase that falls
on its surface. This means that for proper reconstruction of an image, the used
display device must be capable of modulating both magnitude and phase of the
incoming light. However today there is no such device that can effectively
modulate phase and magnitude of the incoming light at the same time. A display
device which can modulate the phase of light also modulates the magnitude of
light but this is not fully controllable. To overcome this problem two phase-only
spatial light modulators can be used successively [18]. In this method; the first
spatial light modulator is used in a way such that its output contains the desired
magnitude levels. The second spatial light modulator is used to align the phase
of the desired output. For the second spatial light modulator, the output of the
first spatial light modulator is transformed into Fourier plane by using a suitable
lens. After the second spatial light modulator the light beam is back transformed
to object plane using a lens. To obtain a desired output a(x,y) at a specific plane,
(2.39)
must be solved [18]. Equation (2.39) represents the desired output a(x,y) as
magnitude and phase elements. To obtain this output the complex field in the
Fourier plane can be written as follows [18]:
(2.40)
where
(2.41)

26
In this equation corresponds to the wavelength of the used light beam and
corresponds to the focal length of the Fourier-transforming lens [18].
In this method the values to be displayed on first spatial light modulator are
calculated iteratively such that | | is at the desired magnitude level in the
Fourier plane. The values for the second spatial light modulator are calculated
by subtracting the Fourier plane phase form the desired phase and taking
modulus of the result. By these two spatial light modulators it is possible to
reconstruct good images from a hologram since both magnitude and phase of the
output can be determined [18].
In early works to dynamically reconstruct images from holograms
researchers used different materials and devices as spatial light modulators. The
main problem with these modulators was that they do not have small enough
pixels. The number of pixels on the modulator was another problem. Since the
number of pixels was small proper reconstructions had low quality [9].
Additionally updating time of a single pixel was long to display holographic
videos in the reconstructed images. In 1990 a modulator which can be updated
in a very short time was developed and used to reconstruct an image from a
hologram [7]. However the reconstructed image was still small and the quality
was not good.
Another method to overcome the spatial light modulator problems in 1990s
was to use a quickly updateable small array of light modulating pixels and to
scan the display area by using proper lenses and scanning mirrors [9]. For
example, an acousto-optic modulator was used as the spatial light modulator.
This acousto-optic modulator modulates the phase of light beam that passes
through it and scanners direct the modulated light toward the desired location on
the image volume. By using the scanners a relatively large size holographic
image can be reconstructed with a small size acousto-optic spatial light

27
modulator which can be updated in a short time and can display holographic
videos [9].
Choosing a suitable spatial light modulator for reconstruction is also
important. Images from computer generated holograms generated by Rayleigh-
Sommerfeld diffraction formula or Fresnel-Kirchhoff diffraction formula can be
easily reconstructed by phase-only spatial light modulators but image from a
computer generated hologram calculated by bipolar intensity method can be
effectively reconstructed by amplitude modulating spatial light modulators [6].
Using a phase-only spatial light modulator to reconstruct images from
holograms generated by bipolar intensity method result lower quality images
than using an amplitude-only spatial light modulator [6]. Thus the method used
in hologram generation and the estimations made to reduce calculation must be
taken into account for the reconstruction process. In other words hologram
calculation must be done by considering the display medium and the
reconstruction method to be used.
A phase-only spatial light modulator can be used as display device to
reconstruct images from computer generated holograms [4], [5], [9], [18], [20],
[21], [22]. In this case the phase of the light beam on the hologram plane is
calculated and the incoming light beam to the phase-only spatial light modulator
is modulated according to these calculated values. The light magnitude
information on the hologram plane is lost but the reconstructed images are still
good enough. In some methods the magnitude information of the hologram
plane is used to generate phase information to be displayed on the spatial light
modulator. In these methods coherent or incoherent light source and suitable
optical elements to distribute light equally to the spatial light modulator’s
surface are used to illuminate the spatial light modulator. Some distortions occur
during the reconstruction because of the edges of spatial light modulator, surface
roughness of the spatial light modulator and loss of data of the holographic
plane [4], [5].

28
The reconstruction of images from holograms with phase-only spatial light
modulators can also be done for color holograms [17], [21], [23]. For these
holograms, a new spatial light modulator is used for each color component of
the hologram. Then reconstructed color images are brought together by using
beam splitters and lenses and finally a color image is obtained [21], [23].
Intersecting the diffraction zones of the spatial light modulators also merges
color hologram components [17]. These experiments are important because this
method promises three-dimensional color images. In this method a different
hologram for each color component on the hologram is calculated and displayed.
This is because every color component on the hologram can travel through
different distances. Additionally the input pattern for each color component is
different. Furthermore the wavelengths of different color components are also
different. A color image can be also calculated by reconstructing images of the
color components from a hologram and then superposing the color components
[4], [6]. In this method; the hologram is calculated and image from the hologram
is reconstructed for each color component in the source object; the displayed
reconstruction results are recorded and finally the recorded results are
superposed on computer to visualize the desired color holographic image.
There are experiments showed that it is also possible to use an incoherent
light source to reconstruct holographic images [17], [21], [24]. Normally in
holographic reconstructions a coherent light source is used. This source is
usually a laser. In these experiments; light emitting diodes which can produce a
nearly coherent light with a nearly constant wavelength are used. Light emitting
diodes are successful to reconstruct holographic images with different colors
[17], [21], [24]. Additionally the speckle noise caused by lasers in classic optical
reconstruction is removed [21]. These experiments are important to reduce the
possible cost of future three-dimensional displays. Moreover they are important
to reduce the possible power consumption of future holographic displays. They
are also important in reducing the size of possible future holographic displays.

29
These improvements are caused by cheap, low power and small sized light
emitting diodes.
Another important feature about holographic reconstructions using phase-
only spatial light modulator is that one can reconstruct objects which have larger
size than the used display device [5]. This means that a hologram can
reconstruct scenes that are larger than itself. In reconstructions from holograms
using spatial light modulators to set images larger than the display device, the
quality of the reconstructed images are reduced but the size of the image is
increased. The quality of the points around the center of the reconstructed image
is high but the quality dramatically reduces for points near the edge of the
reconstructed image [5]. This shows that there is a trade-off between image
quality and image size for display devices with limited number of pixels. This is
another important fact because it opens a way for future displays to be smaller in
size while creating images larger than their sizes with an image quality penalty.
Actually this phenomenon is known for long time but implementing this
phenomenon on a dynamic display is also important.
Another interesting achievement done in holographic reconstruction with
phase-only spatial light modulator is one can display different depth objects on
single hologram [5]. This is caused by the properties of hologram since a
hologram records the incoming light properties and thus when it is used for
reconstruction, it is able to reconstruct images of objects with different depths
with respect to the hologram plane [5]. The importance of this experiment is that
it showed the holograms of the images for objects at different depths can be
superposed and the resultant hologram can used to reconstruct objects on
different depth planes at the same time.
30
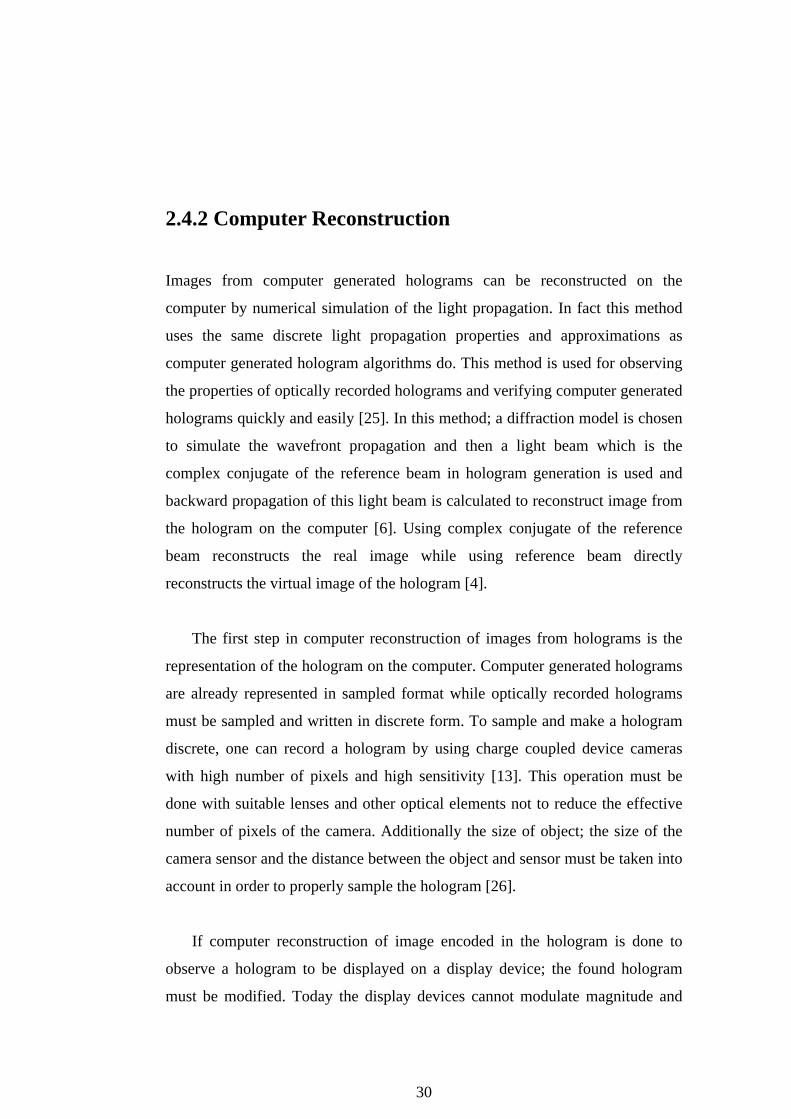
2.4.2 Computer Reconstruction
Images from computer generated holograms can be reconstructed on the
computer by numerical simulation of the light propagation. In fact this method
uses the same discrete light propagation properties and approximations as
computer generated hologram algorithms do. This method is used for observing
the properties of optically recorded holograms and verifying computer generated
holograms quickly and easily [25]. In this method; a diffraction model is chosen
to simulate the wavefront propagation and then a light beam which is the
complex conjugate of the reference beam in hologram generation is used and
backward propagation of this light beam is calculated to reconstruct image from
the hologram on the computer [6]. Using complex conjugate of the reference
beam reconstructs the real image while using reference beam directly
reconstructs the virtual image of the hologram [4].
The first step in computer reconstruction of images from holograms is the
representation of the hologram on the computer. Computer generated holograms
are already represented in sampled format while optically recorded holograms
must be sampled and written in discrete form. To sample and make a hologram
discrete, one can record a hologram by using charge coupled device cameras
with high number of pixels and high sensitivity [13]. This operation must be
done with suitable lenses and other optical elements not to reduce the effective
number of pixels of the camera. Additionally the size of object; the size of the
camera sensor and the distance between the object and sensor must be taken into
account in order to properly sample the hologram [26].
If computer reconstruction of image encoded in the hologram is done to
observe a hologram to be displayed on a display device; the found hologram
must be modified. Today the display devices cannot modulate magnitude and
31
phase of the light at the same time. Thus while reconstructing an image from a
hologram by using a spatial light modulator some of the hologram data is lost.
Moreover a spatial light modulator cannot modulate light with infinite precision.
Most of the spatial light modulators today are driven by 8-bit or 10-bit interfaces
so their precision is limited. These limitations of spatial light modulators must
be considered in computer reconstruction if the hologram is planned to be
displayed on a spatial light modulator for optically reconstruction. To do this the
magnitude or phase information on the hologram can be deleted depending on
the display device to be used and the remaining information must be quantized
according to properties of the spatial light modulator to be used.
On the next step the method to numerically calculate the wavefront
propagation must be selected. The diffraction formulas stated in 2.3.1, 2.3.2 and
2.3.3 can be used to calculate the light propagation as they are used in hologram
generation. Other methods and formulas can also be used. Useful
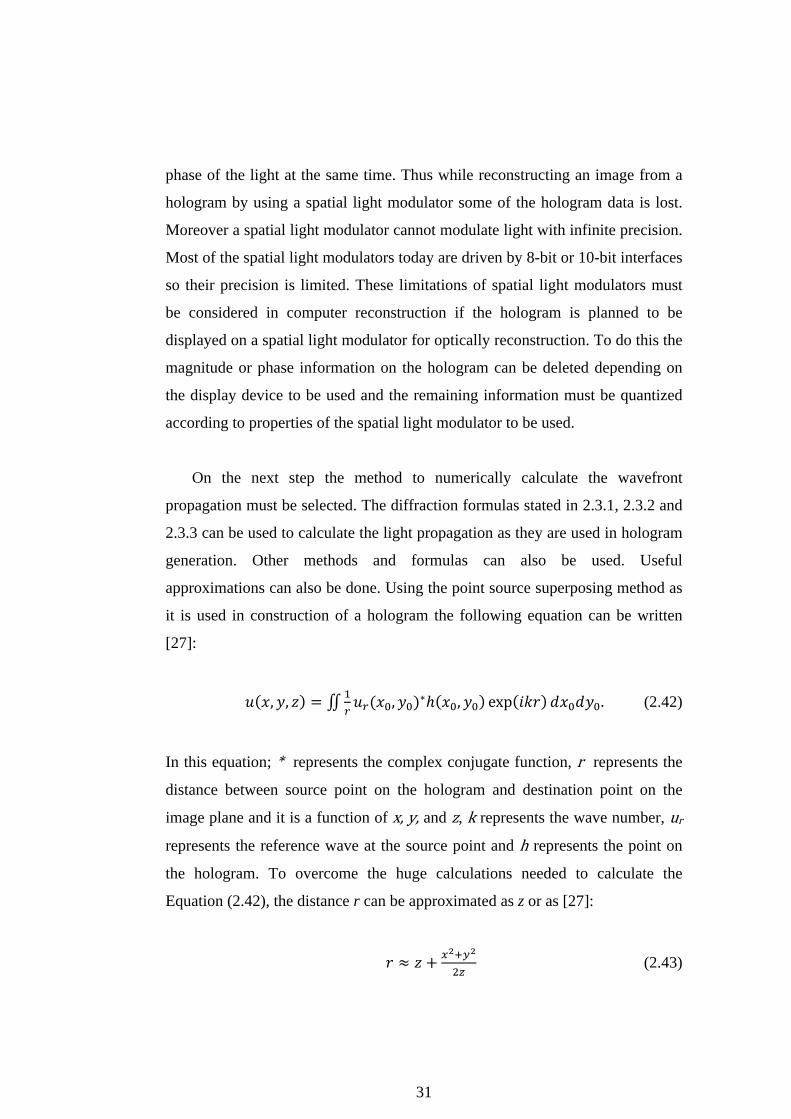
approximations can also be done. Using the point source superposing method as
it is used in construction of a hologram the following equation can be written
[27]:
(2.42)
In this equation; represents the complex conjugate function, represents the
distance between source point on the hologram and destination point on the
image plane and it is a function of and , represents the wave number,
represents the reference wave at the source point and represents the point on
the hologram. To overcome the huge calculations needed to calculate the
Equation (2.42), the distance r can be approximated as z or as [27]:
� �
(2.43)
32
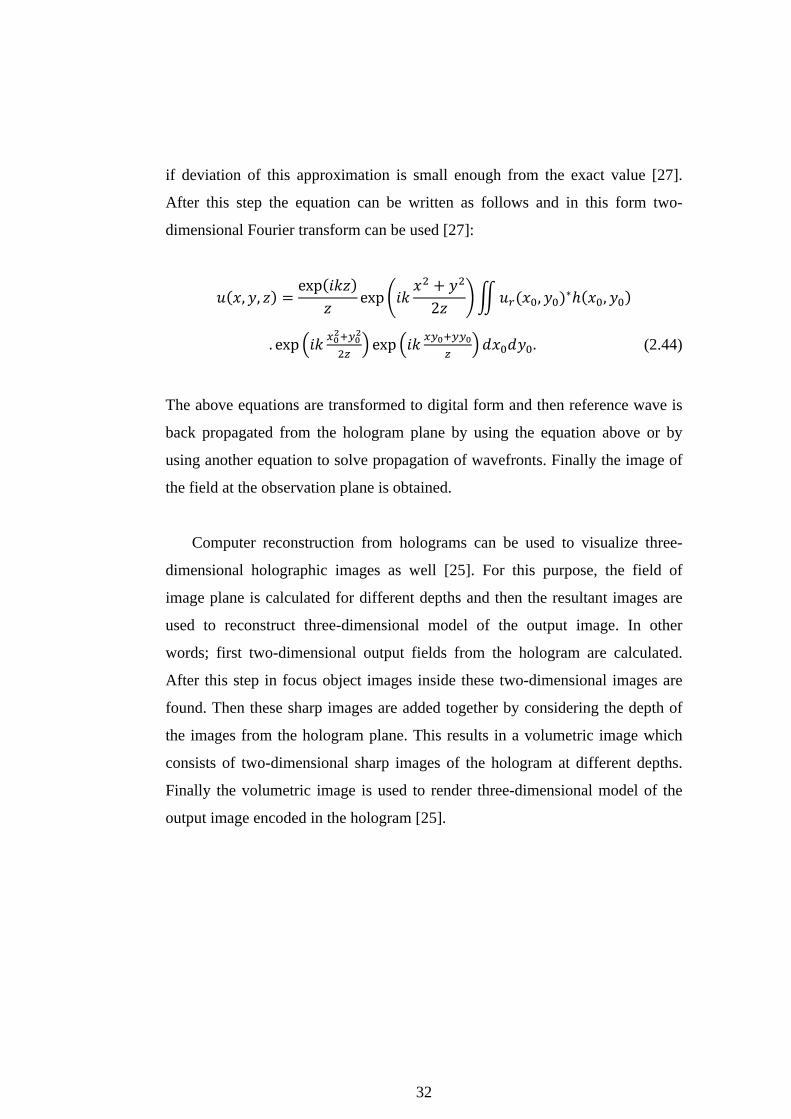
if deviation of this approximation is small enough from the exact value [27].
After this step the equation can be written as follows and in this form two-
dimensional Fourier transform can be used [27]:
��
��
� � (2.44)
The above equations are transformed to digital form and then reference wave is
back propagated from the hologram plane by using the equation above or by
using another equation to solve propagation of wavefronts. Finally the image of
the field at the observation plane is obtained.
Computer reconstruction from holograms can be used to visualize three-
dimensional holographic images as well [25]. For this purpose, the field of
image plane is calculated for different depths and then the resultant images are
used to reconstruct three-dimensional model of the output image. In other
words; first two-dimensional output fields from the hologram are calculated.
After this step in focus object images inside these two-dimensional images are
found. Then these sharp images are added together by considering the depth of
the images from the hologram plane. This results in a volumetric image which
consists of two-dimensional sharp images of the hologram at different depths.
Finally the volumetric image is used to render three-dimensional model of the
output image encoded in the hologram [25].

33
Chapter 3
Simulator Implementation
In this chapter, simulation implementation of hologram calculations to verify the
method planned to be used in FPGA implementation is presented in detail. The
choices made for FPGA implementation are also presented in this chapter.
3.1 Introduction
In hardware design process, time management is important to overcome the
problems occur during the design. In fact for a hardware to be represented as
working prototype more test and verification time is needed than design and
manufacturing time. This means that good verification and testing is as
important as good design. It can be said that half of total prototyping time is
used for testing and verification of design.
The verification of the prototype starts from the beginning of the design. In
ideal cases verification and testing must be done at every design step. This
seems to increase design time but in total, finding an error as early as possible
results in a huge time saving through the prototyping process and makes
detection of an error at the last steps of the prototype, easier.
In this work, we implemented real time holographic video generation on a
FPGA. The design process has two main parts. First part is the algorithm part
and the second part is the FPGA implementation part. To verify the algorithm
part first computer simulation of the algorithm is made and after verifying the
algorithm on the computer, the results are implemented on an optical setup with

34
spatial light modulator. The optical setup is shown in Figure 3.1. In this step it is
seen that the output of the optical setup and computer simulations match. This
showed that the algorithm implemented in the simulation works well. After this
step the algorithm is implemented in hardware.
Figure 3.1 : Optical setup used to reconstruct images from simulator generated holograms. L1 and L2 denote the lenses, A denotes the pinhole, P1 denotes the
polarizer and P2 denotes the analyzer.
Suitable algorithms for FPGA implementation are chosen for simulation. An
FPGA is a programmable hardware device that can process huge number of
signals at the same time, but can do mathematical operations with its limited
number of resources embedded in it while a classical processor can process one
event at a time but has nearly no resource limit in contrast with FPGA. Thus our
algorithm must need resources which do not exceed the mathematical operation
capability of the FPGAs. Additionally the chosen algorithm must be parallel
operation compatible to benefit from parallel processing capability of the FPGA.

35
By considering these limitations, it is clear that the algorithm to be chosen
must not be an iterative algorithm. Iterative algorithms need huge computational
power and usually take a lot of time to get the result. The implementation of an
iterative algorithm requires a lot of numerical comparisons and this consumes a
lot of FPGA resource. Furthermore parallel processing benefit of the FPGA
cannot be exploited by using an iterative algorithm. Finally hardware coding of
an iterative algorithm in FPGA reduces the calculation speed dramatically.
Bipolar intensity method described in 2.3.3 is one of the possible alternative
methods to calculate the hologram. However this algorithm needs a huge
computation power. Although a FPGA can overcome this problem, the time
required to finish the calculation is longer than other alternative hologram
generation methods. Additionally, for each point on the hologram plane full
object plane must be considered and so for each point on the hologram plane,
whole input image must be read from memory and processed. This memory
reading periods increases the computational time since an arithmetic unit in a
FPGA does not have cache memory hardware. A cache for arithmetic unit can
be implemented but this cache will be small and will not be able to fully store
the input image. For these reasons it is not a good idea to implement bipolar
intensity method for real time holographic video calculation in FPGA. Using
look-up tables for this algorithm decreases the computation time but a FPGA
cannot store large look-up tables [8].
Rayleigh-Sommerfeld and Fresnel-Kirchhoff diffraction methods are two
alternatives that can be implemented in FPGA. These algorithms need fewer
operations than bipolar intensity method. These two algorithms employ two-
dimensional Fourier transforms which can be implemented in FPGA easily and
fast enough. The transfer function matrices used in these algorithms can be
calculated on the computer and loaded in a memory to be used by FPGA.
Complex multiplications and quantization needed to implement these methods

36
for spatial light modulator reconstructions can be also implemented in the
FPGA. For these reasons, these two algorithms are selected.
While implementing Rayleigh-Sommerfeld and Fresnel-Kirchhoff
diffraction methods for simulation, the display device to be used in
reconstruction and the input video source of the FPGA implementation must
also be taken into account. The display device planned to be used is a phase-
only spatial light modulator with 8µm pixel period, 1920X1080 pixels with 8-bit
modulation quantization [19]. Since two-dimensional Fourier transforms will be
used, a maximum size hologram (2048X1024) must be generated for minimum
truncation and zero padding need in Fast Fourier Transform computations. But
input video limits the hologram size, too. Since most digital video formats
available today employ 4:3, 16:9 or 16:10 formats and a single video connection
can feed a 1920X1080 video at 60 frames per second at maximum, hologram
generation with 2048X1024 pixels is not implementable using the current
standards. To avoid zero padding needed for the Fast Fourier Transform and to
generate a hologram that fits into the target size; a 1024X1024 hologram size is
appropriate. Feeding an input video image with size 1024X1024 can be
implemented by cutting a part of the input image working at 60 frames per
second with a size of 1280X1024. This size does not meet the 4:3, 16:9 or 16:10
ratios but it is a VESA standard available and used today.
3.2 Computer Simulation Results
The computer simulations here are done using Rayleigh-Sommerfeld or Fresnel-
Kirchhoff diffraction formulas. For computer simulations except single point
diffraction simulation; a 1024X1024 grayscale image is used as the input image
since the image reconstruction from the hologram will be implemented for
single color component. Then the hologram of the image at distance d from the
input image is calculated. At this step; properties of reconstructing light and

37
display device are taken into account to properly construct the hologram. After
this step the planar image is reconstructed from the hologram using the
computer by back propagating the virtual reference wave.
These steps are first done for a small point at the center. Its diffraction at the
hologram plane is observed. Since the diffraction of a single point and a square
is known, this pattern is used as the first step in simulation to verify that the
diffraction formulas are correct and working. After this verification process a
grayscale image is used to generate a hologram. Then the generated hologram is
used to reconstruct the image using the computer to see the possible output
image of the hologram. In this step first the reconstruction is done using both
magnitude and phase of the complex valued hologram. If the result is sufficient
then the magnitude of the calculated hologram is used as phase information of
the phase-only hologram used for reconstructions. Thus we simulate an optical
reconstruction using a phase-only spatial light modulator where the plane data is
copied from the magnitude information of the computed hologram.
On the next step the information on the hologram is quantized to simulate
the optical reconstruction of a hologram by using an 8 bit phase-only spatial
light modulator. The results obtained here are the expected output results of the
optical reconstruction process.
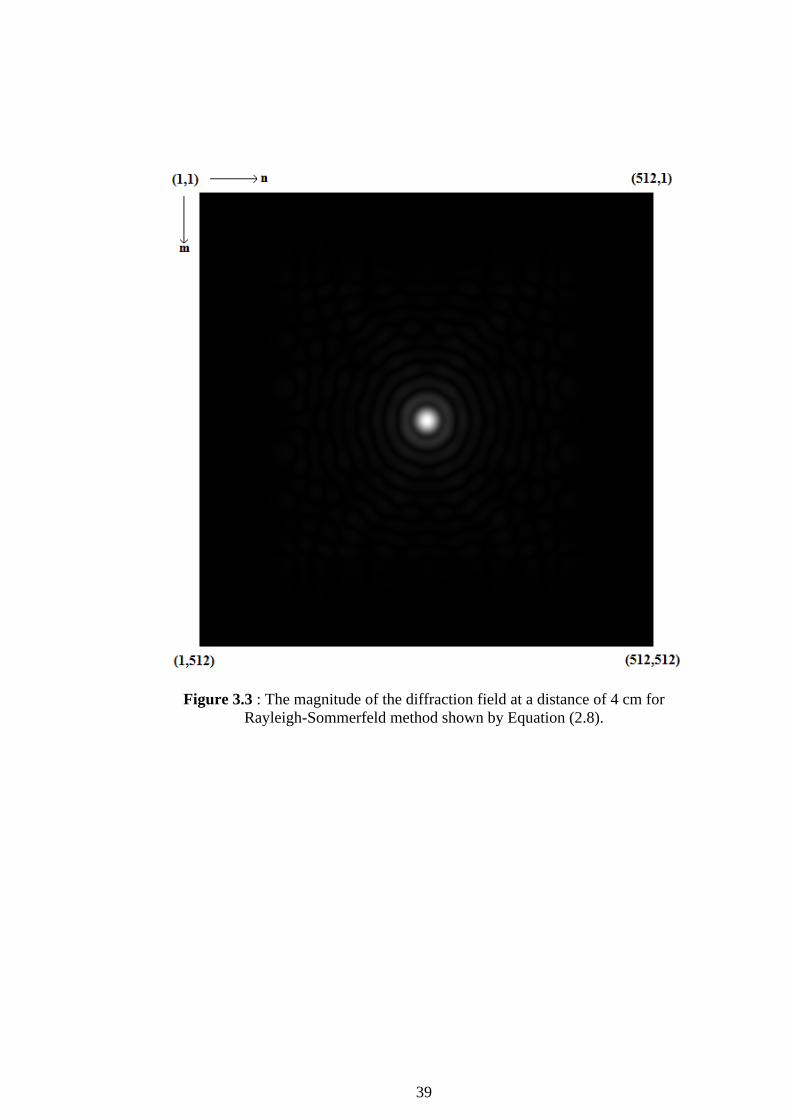
The input pattern that is used as the small point to start the
verification is shown in Figure 3.2.

38
Figure 3.2 : The input pattern that is used to simulate diffraction from a single point.
When Rayleigh-Sommerfeld method is used to calculate the diffraction field
of this input pattern; the Equation (2.8) is used. Parameters in Equation (2.8) are
set as =532nm, =4cm, =8µm and =512. The variables
[1,512]. When the Equation (2.8) is solved for Figure 3.2 and the parameters
stated above, the following diffraction field is obtained. The
magnitude of the diffraction field is shown in Figure 3.3 and phase is shown in
Figure 3.4.
39
Figure 3.3 : The magnitude of the diffraction field at a distance of 4 cm for Rayleigh-Sommerfeld method shown by Equation (2.8).

40
Figure 3.4 : The phase of the diffraction field at a distance of 4 cm for Rayleigh-Sommerfeld method described by Equation (2.8).
When Fresnel-Kirchhoff method is used to calculate the diffraction field of
this input pattern, Equation (2.16) is used. Parameters in Equation (2.16) are set
as =532nm, =4cm, =8µm. The variables [1,512]. When the
Equation (2.16) is solved for Figure 3.2 and the parameters stated above, the
following diffraction field is obtained. The magnitude of the diffraction field is
shown in Figure 3.5 and phase is shown in Figure 3.6.

41
Figure 3.5 : The magnitude of the diffraction field at a distance of 4 cm for Fresnel-Kirchhoff method using by Equation (2.16).

42
Figure 3.6 : The phase of the diffraction field at a distance of 4 cm for Fresnel-Kirchhoff method using Equation (2.16).
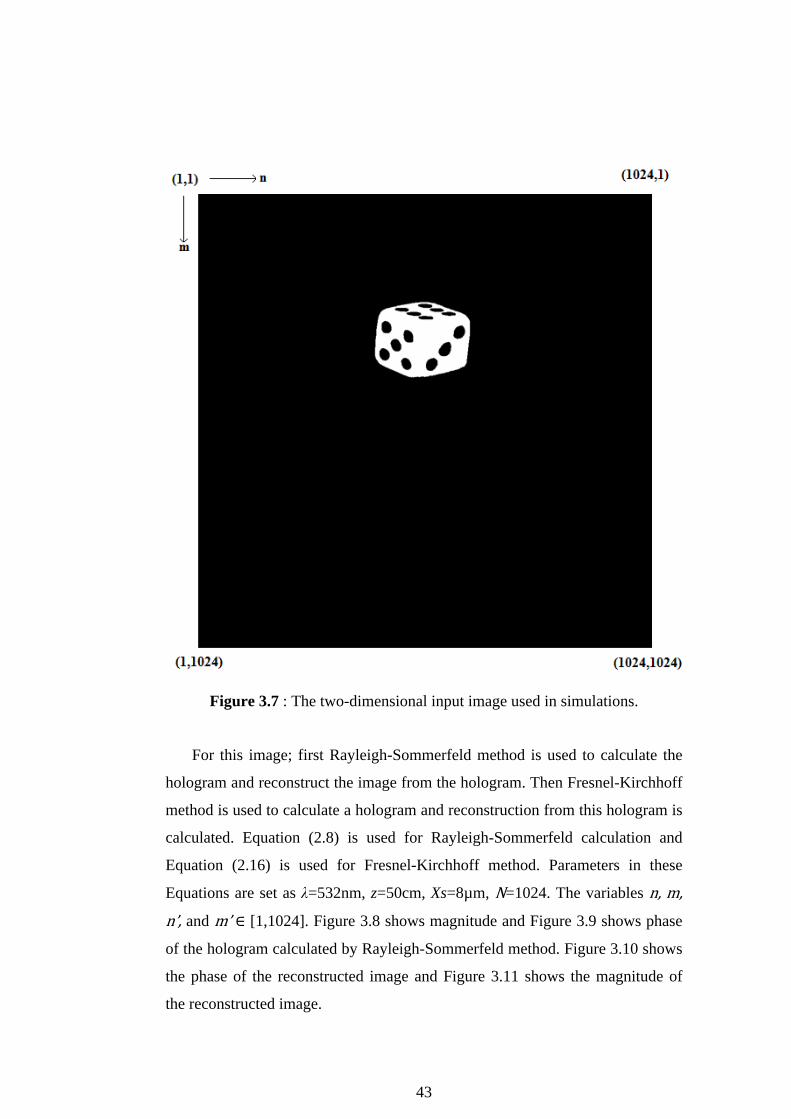
On the next step the calculations are done for =50cm distance using
Equation (2.16) and Equation (2.8). The two-dimensional input pattern used for
these calculations is as follows:
43
Figure 3.7 : The two-dimensional input image used in simulations.
For this image; first Rayleigh-Sommerfeld method is used to calculate the
hologram and reconstruct the image from the hologram. Then Fresnel-Kirchhoff
method is used to calculate a hologram and reconstruction from this hologram is
calculated. Equation (2.8) is used for Rayleigh-Sommerfeld calculation and
Equation (2.16) is used for Fresnel-Kirchhoff method. Parameters in these
Equations are set as λ=532nm, z=50cm, Xs=8µm, =1024. The variables
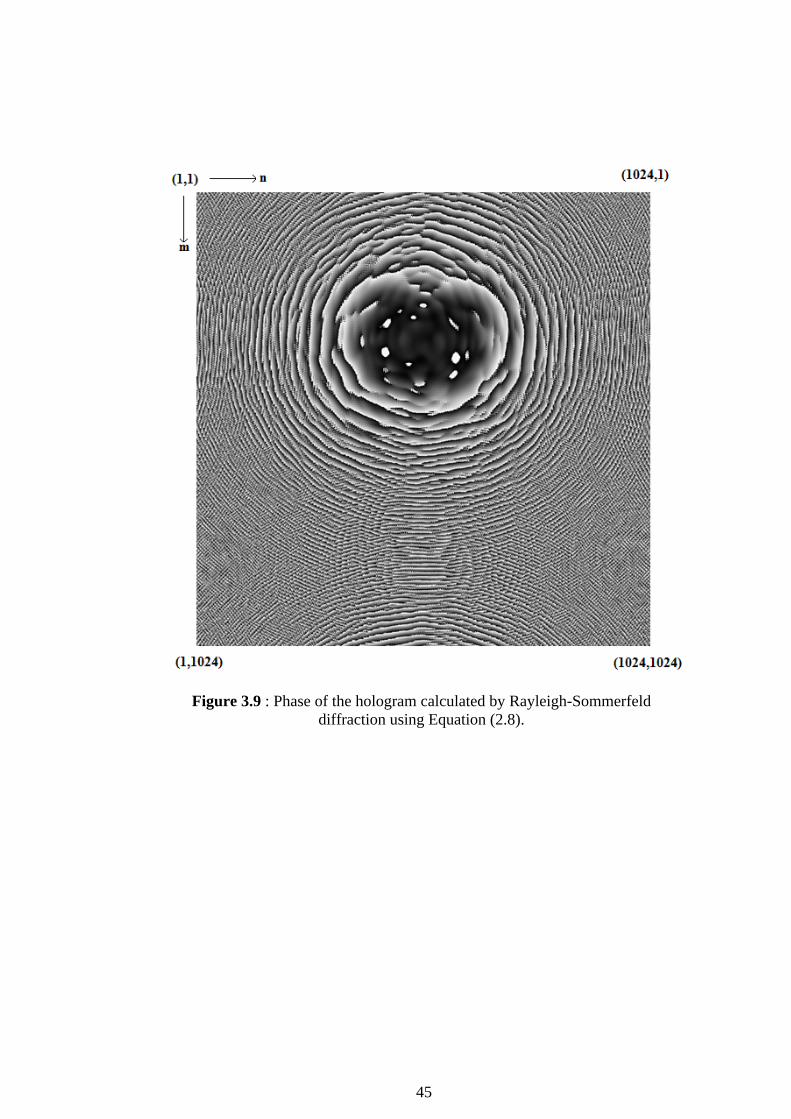
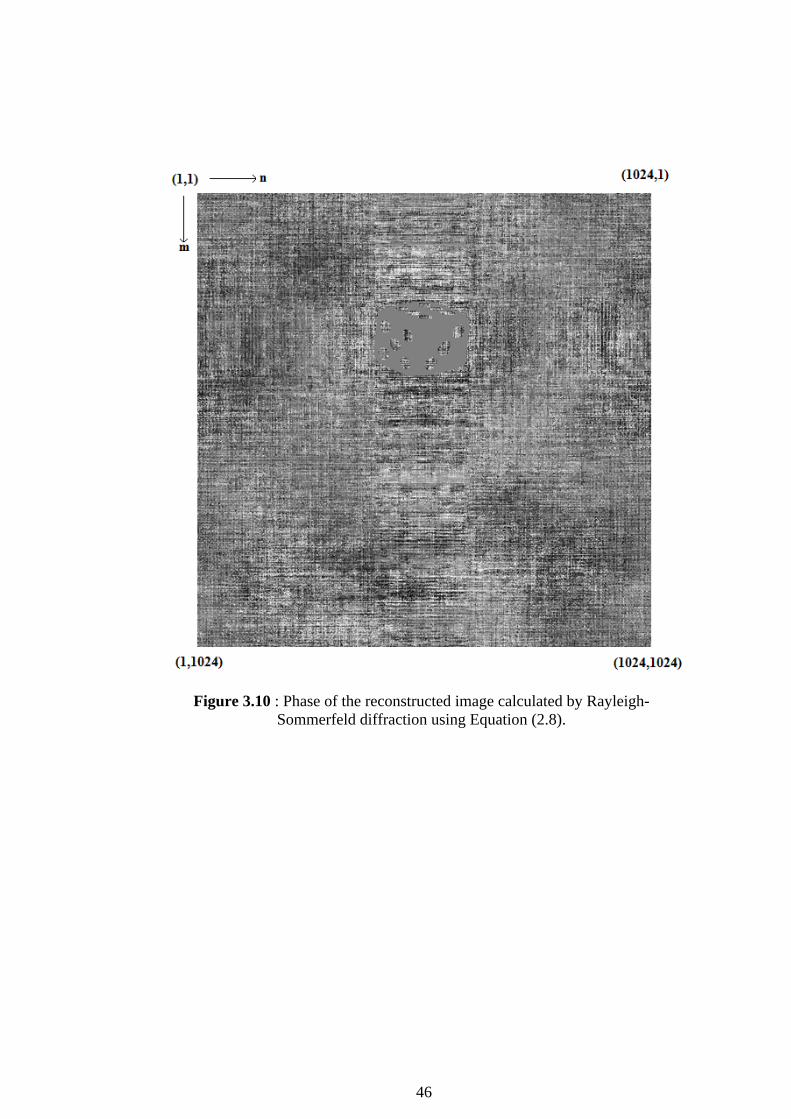
and [1,1024]. Figure 3.8 shows magnitude and Figure 3.9 shows phase
of the hologram calculated by Rayleigh-Sommerfeld method. Figure 3.10 shows
the phase of the reconstructed image and Figure 3.11 shows the magnitude of
the reconstructed image.

44
Figure 3.8 : Magnitude of the hologram calculated by Rayleigh-Sommerfeld diffraction using Equation (2.8).
45
Figure 3.9 : Phase of the hologram calculated by Rayleigh-Sommerfeld diffraction using Equation (2.8).
46
Figure 3.10 : Phase of the reconstructed image calculated by Rayleigh-Sommerfeld diffraction using Equation (2.8).

47
Figure 3.11 : Magnitude of the reconstructed image calculated by Rayleigh-Sommerfeld diffraction using Equation (2.8).
From these figures, it can be seen that a hologram generated and an image
reconstructed by Rayleigh-Sommerfeld diffraction method can be used
successfully. The output image seems to be the same image as the input but it is
not the same image since the input image contains only real numbers while the
output image is formed of complex numbers, but the imaginary parts in the
reconstructed image are very small. The imaginary parts in the reconstructed
image are result of computational noise. This computational noise is not
observed in the real part of the reconstructed image. In this reconstruction, no
data loss due to quantization or spatial light modulator properties is
48
implemented. Thus it is expected that the reconstructed image is the same image
as the input image.
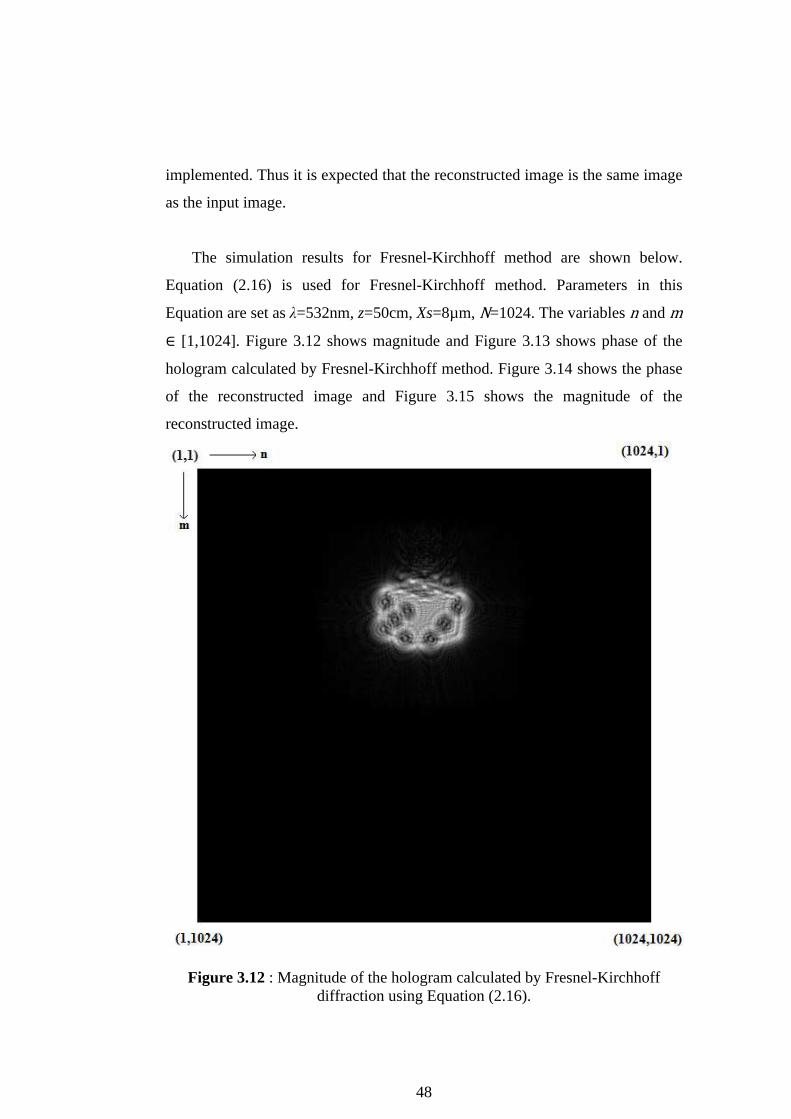
The simulation results for Fresnel-Kirchhoff method are shown below.
Equation (2.16) is used for Fresnel-Kirchhoff method. Parameters in this
Equation are set as λ=532nm, z=50cm, Xs=8µm, =1024. The variables and
[1,1024]. Figure 3.12 shows magnitude and Figure 3.13 shows phase of the
hologram calculated by Fresnel-Kirchhoff method. Figure 3.14 shows the phase
of the reconstructed image and Figure 3.15 shows the magnitude of the
reconstructed image.
Figure 3.12 : Magnitude of the hologram calculated by Fresnel-Kirchhoff diffraction using Equation (2.16).

49
Figure 3.13 : Phase of the hologram calculated by Fresnel-Kirchhoff diffraction using Equation (2.16).

50
Figure 3.14 : Phase of the reconstructed image calculated by Fresnel-Kirchhoff diffraction using Equation (2.16).
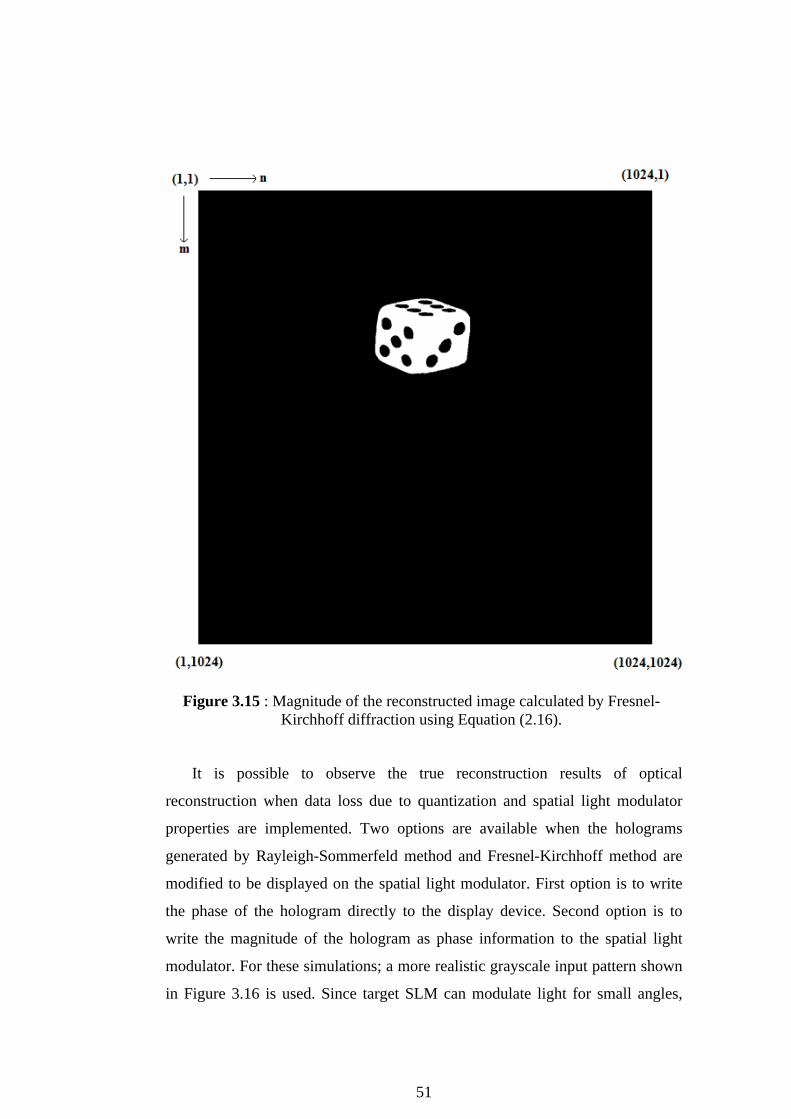
51
Figure 3.15 : Magnitude of the reconstructed image calculated by Fresnel-Kirchhoff diffraction using Equation (2.16).
It is possible to observe the true reconstruction results of optical
reconstruction when data loss due to quantization and spatial light modulator
properties are implemented. Two options are available when the holograms
generated by Rayleigh-Sommerfeld method and Fresnel-Kirchhoff method are
modified to be displayed on the spatial light modulator. First option is to write
the phase of the hologram directly to the display device. Second option is to
write the magnitude of the hologram as phase information to the spatial light
modulator. For these simulations; a more realistic grayscale input pattern shown
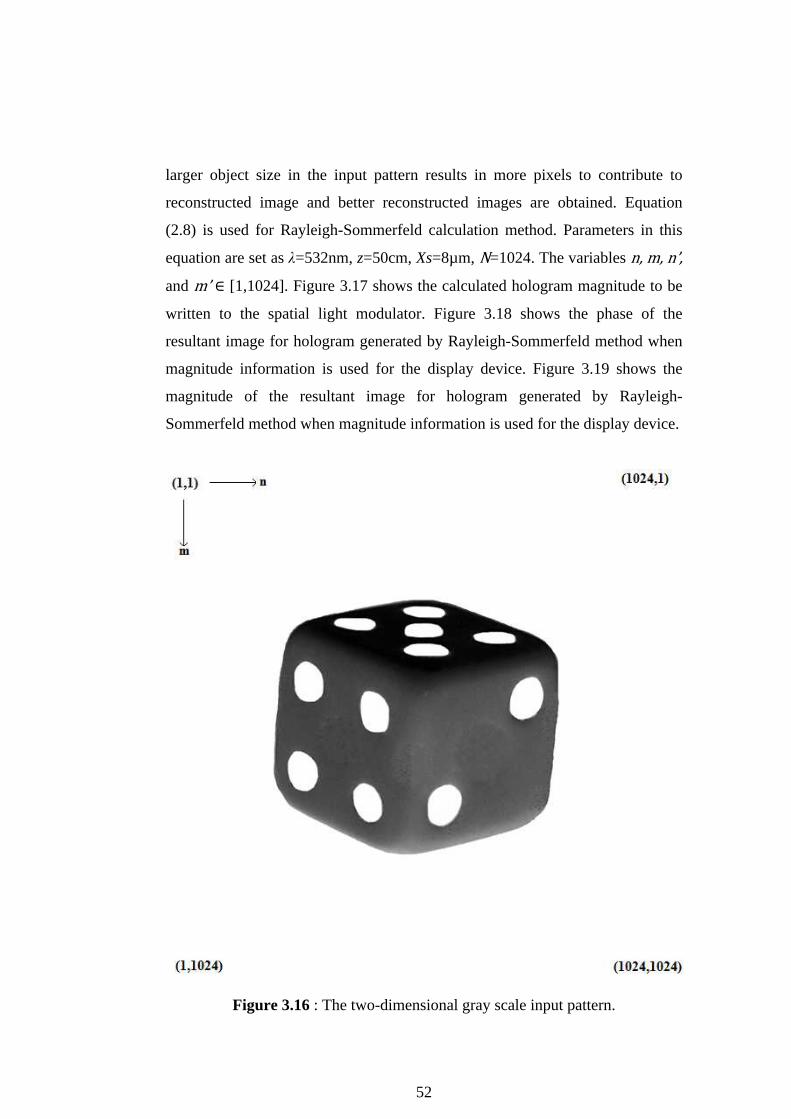
in Figure 3.16 is used. Since target SLM can modulate light for small angles,
52
larger object size in the input pattern results in more pixels to contribute to
reconstructed image and better reconstructed images are obtained. Equation
(2.8) is used for Rayleigh-Sommerfeld calculation method. Parameters in this
equation are set as λ=532nm, z=50cm, Xs=8µm, =1024. The variables
and [1,1024]. Figure 3.17 shows the calculated hologram magnitude to be
written to the spatial light modulator. Figure 3.18 shows the phase of the
resultant image for hologram generated by Rayleigh-Sommerfeld method when
magnitude information is used for the display device. Figure 3.19 shows the
magnitude of the resultant image for hologram generated by Rayleigh-
Sommerfeld method when magnitude information is used for the display device.
Figure 3.16 : The two-dimensional gray scale input pattern.

53
Figure 3.17 : Magnitude of the hologram calculated by Rayleigh-Sommerfeld method using Equation (2.8). This information is the information written on to
phase only computer generated hologram.

54
Figure 3.18 : The phase of the reconstructed image calculated by Rayleigh-Sommerfeld method using Equation (2.8).
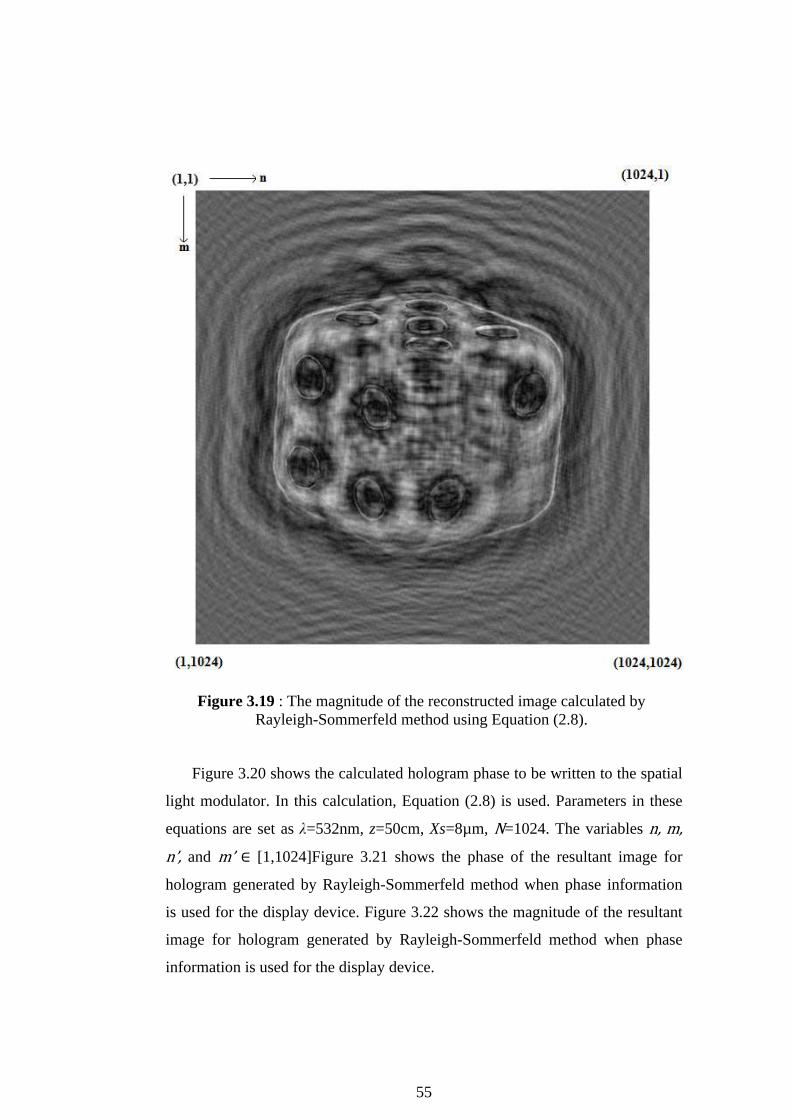
55
Figure 3.19 : The magnitude of the reconstructed image calculated by Rayleigh-Sommerfeld method using Equation (2.8).
Figure 3.20 shows the calculated hologram phase to be written to the spatial
light modulator. In this calculation, Equation (2.8) is used. Parameters in these
equations are set as λ=532nm, z=50cm, Xs=8µm, =1024. The variables
and [1,1024]Figure 3.21 shows the phase of the resultant image for
hologram generated by Rayleigh-Sommerfeld method when phase information
is used for the display device. Figure 3.22 shows the magnitude of the resultant
image for hologram generated by Rayleigh-Sommerfeld method when phase
information is used for the display device.
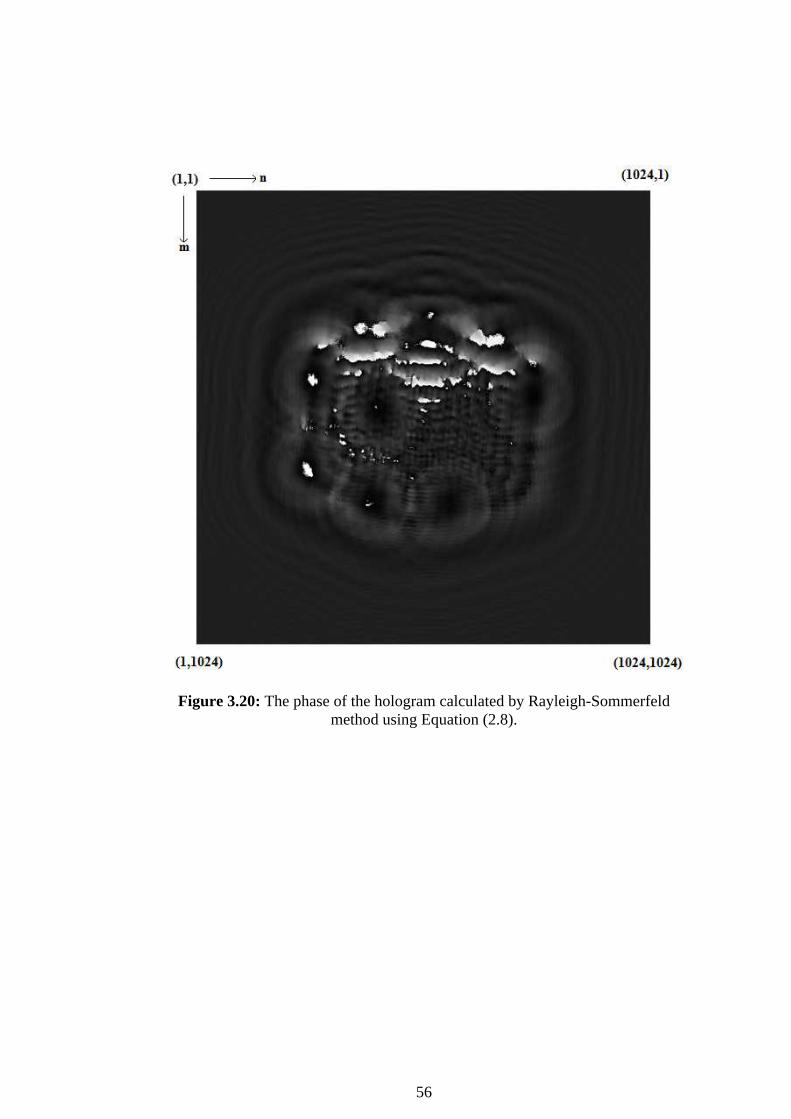
56
Figure 3.20: The phase of the hologram calculated by Rayleigh-Sommerfeld method using Equation (2.8).

57
Figure 3.21: The phase of the reconstructed image using Equation (2.8).
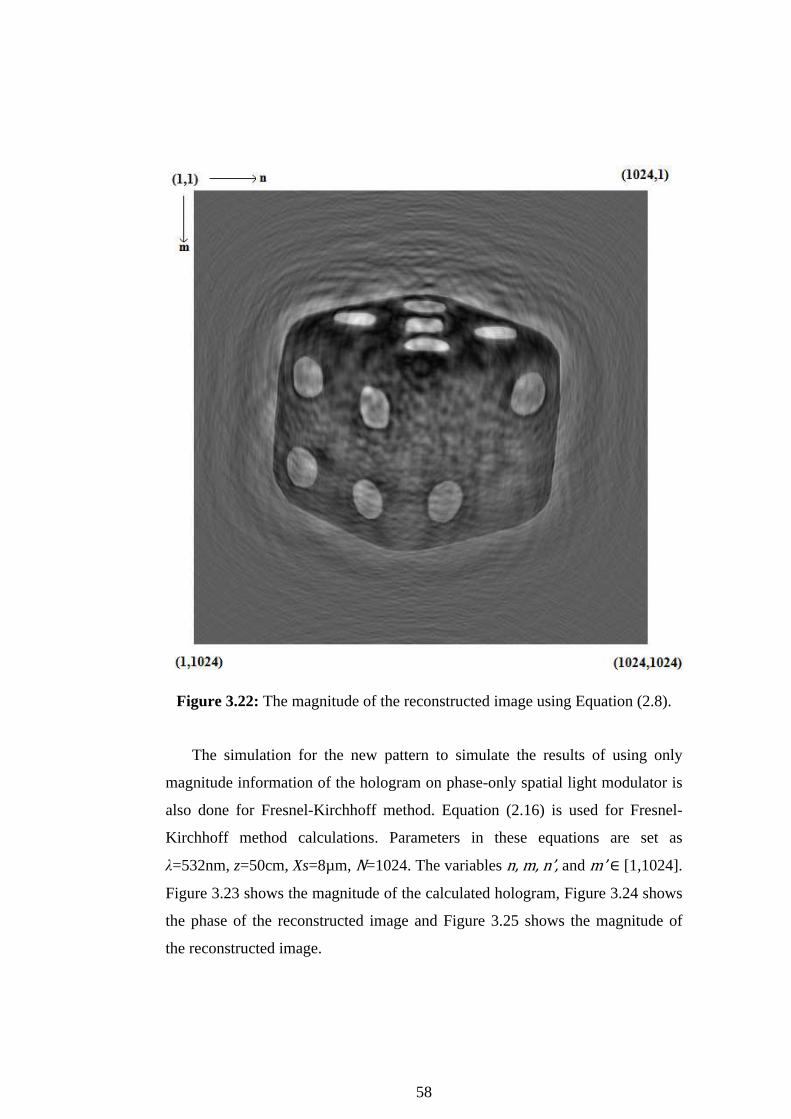
58
Figure 3.22: The magnitude of the reconstructed image using Equation (2.8).
The simulation for the new pattern to simulate the results of using only
magnitude information of the hologram on phase-only spatial light modulator is
also done for Fresnel-Kirchhoff method. Equation (2.16) is used for Fresnel-
Kirchhoff method calculations. Parameters in these equations are set as
λ=532nm, z=50cm, Xs=8µm, =1024. The variables and [1,1024].
Figure 3.23 shows the magnitude of the calculated hologram, Figure 3.24 shows
the phase of the reconstructed image and Figure 3.25 shows the magnitude of
the reconstructed image.

59
Figure 3.23 : The magnitude of the hologram calculated by Fresnel-Kirchhoff method using Equation (2.16).
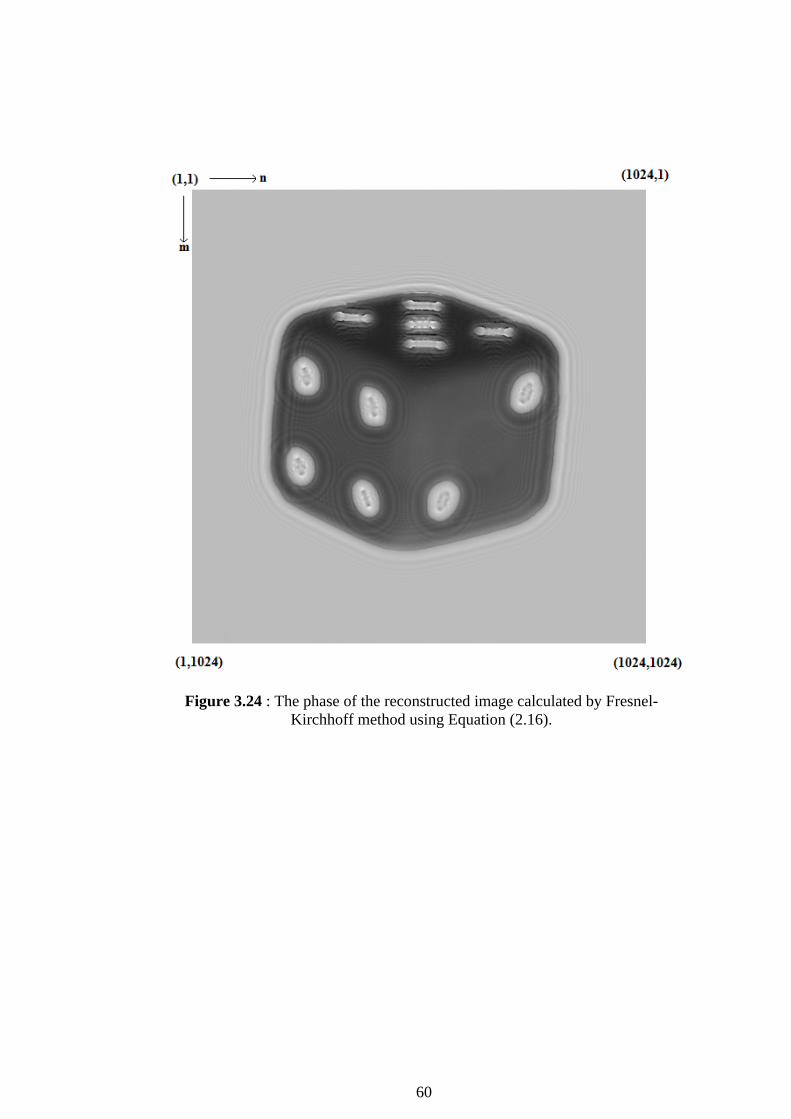
60
Figure 3.24 : The phase of the reconstructed image calculated by Fresnel-Kirchhoff method using Equation (2.16).
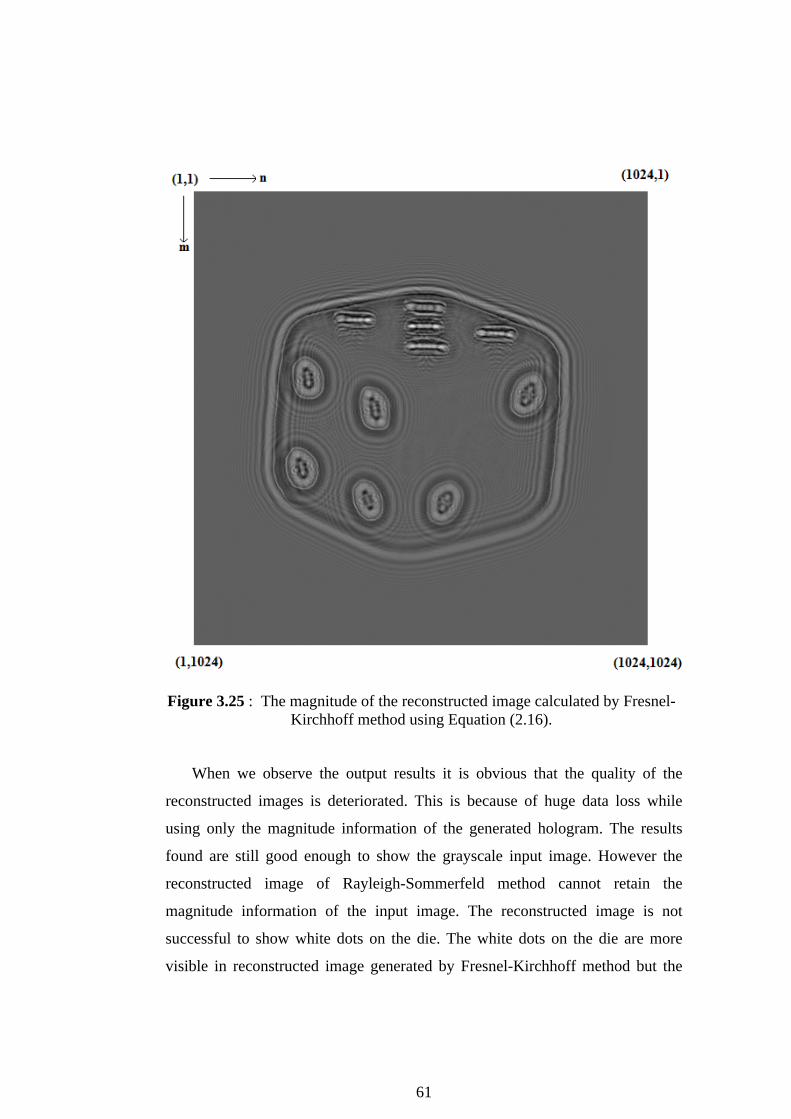
61
Figure 3.25 : The magnitude of the reconstructed image calculated by Fresnel-Kirchhoff method using Equation (2.16).
When we observe the output results it is obvious that the quality of the
reconstructed images is deteriorated. This is because of huge data loss while
using only the magnitude information of the generated hologram. The results
found are still good enough to show the grayscale input image. However the
reconstructed image of Rayleigh-Sommerfeld method cannot retain the
magnitude information of the input image. The reconstructed image is not
successful to show white dots on the die. The white dots on the die are more
visible in reconstructed image generated by Fresnel-Kirchhoff method but the
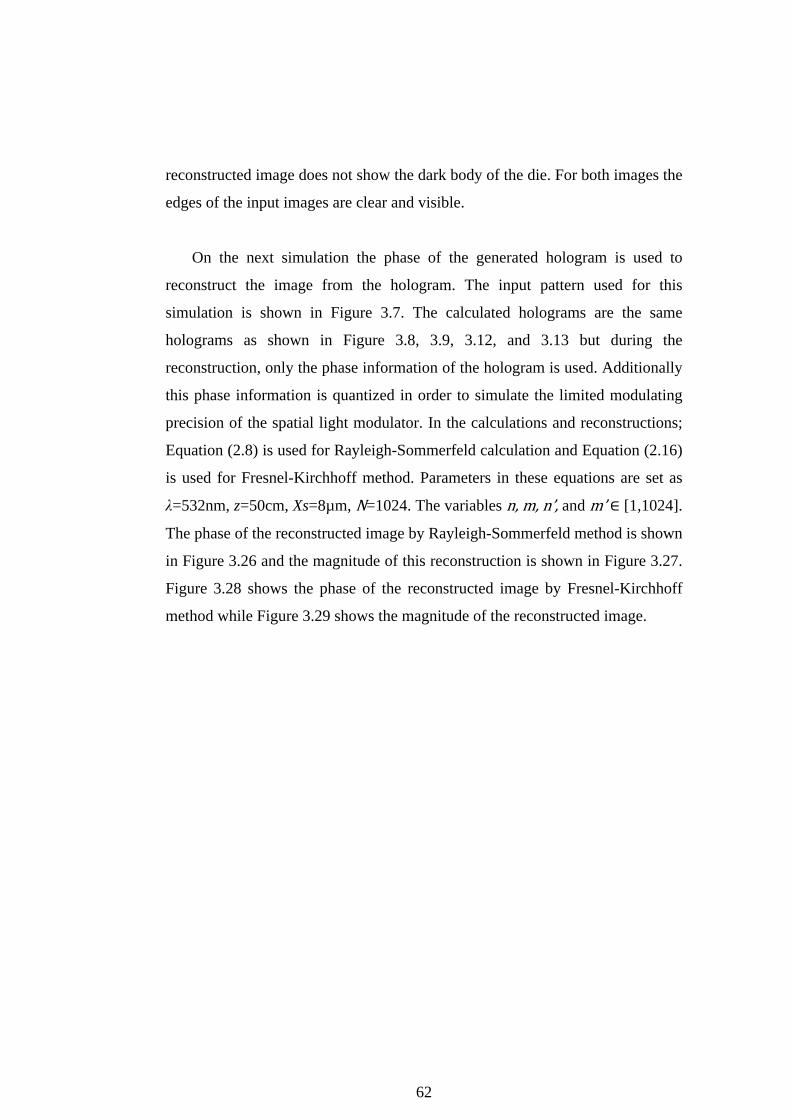
62
reconstructed image does not show the dark body of the die. For both images the
edges of the input images are clear and visible.
On the next simulation the phase of the generated hologram is used to
reconstruct the image from the hologram. The input pattern used for this
simulation is shown in Figure 3.7. The calculated holograms are the same
holograms as shown in Figure 3.8, 3.9, 3.12, and 3.13 but during the
reconstruction, only the phase information of the hologram is used. Additionally
this phase information is quantized in order to simulate the limited modulating
precision of the spatial light modulator. In the calculations and reconstructions;
Equation (2.8) is used for Rayleigh-Sommerfeld calculation and Equation (2.16)
is used for Fresnel-Kirchhoff method. Parameters in these equations are set as
λ=532nm, z=50cm, Xs=8µm, =1024. The variables and [1,1024].
The phase of the reconstructed image by Rayleigh-Sommerfeld method is shown
in Figure 3.26 and the magnitude of this reconstruction is shown in Figure 3.27.
Figure 3.28 shows the phase of the reconstructed image by Fresnel-Kirchhoff
method while Figure 3.29 shows the magnitude of the reconstructed image.

63
Figure 3.26 : Phase of the reconstructed image generated by Rayleigh-Sommerfeld method using Equation (2.8).
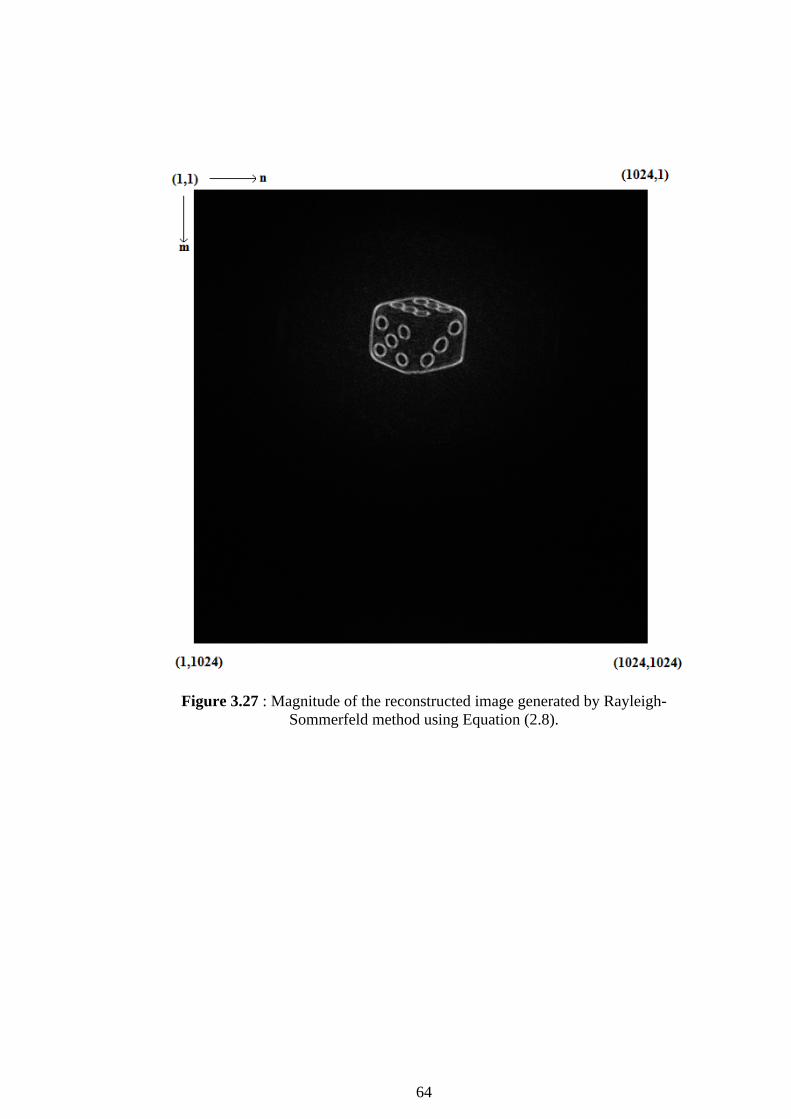
64
Figure 3.27 : Magnitude of the reconstructed image generated by Rayleigh-Sommerfeld method using Equation (2.8).
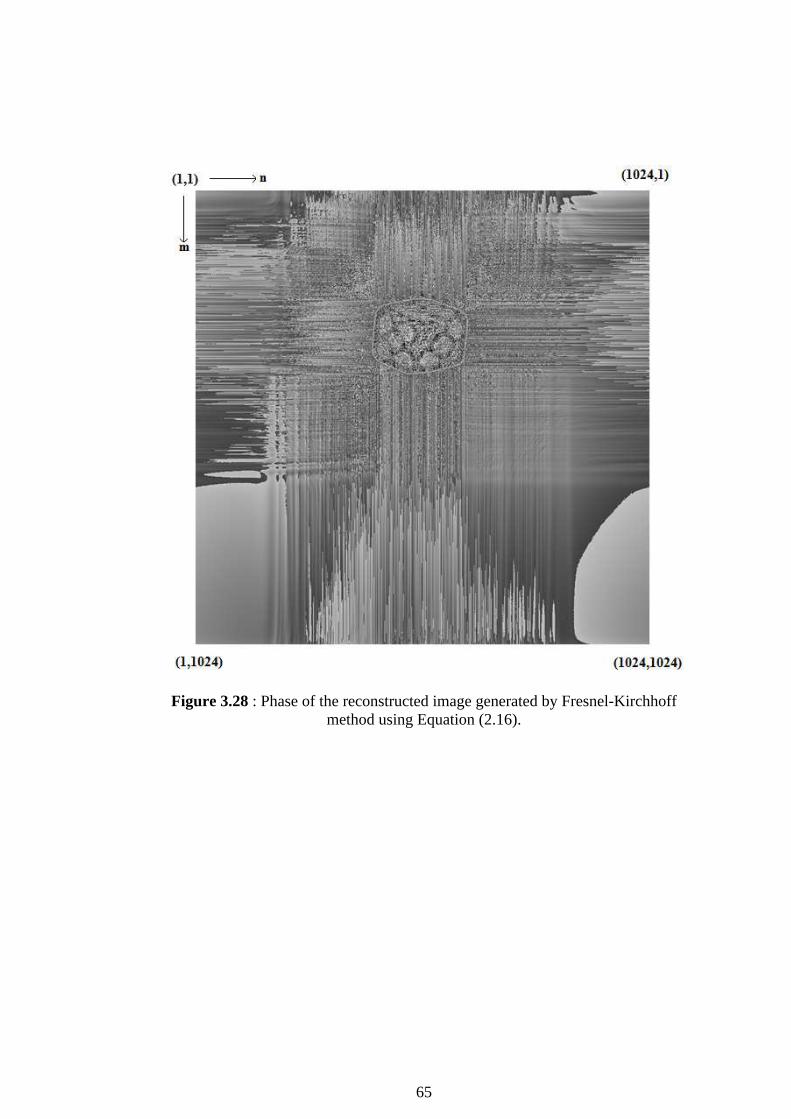
65
Figure 3.28 : Phase of the reconstructed image generated by Fresnel-Kirchhoff method using Equation (2.16).

66
Figure 3.29 : Magnitude of the reconstructed image generated by Fresnel-Kirchhoff method using Equation (2.16).
In these reconstructions; only the sharp edges are visible. In both cases the
magnitude information on the hologram is lost and thus the reconstructed
images do not show the magnitude variations in the input image.
3.3 Optical Reconstruction Results
The last part of the verification process is to use the generated holograms to
reconstruct the images by using an optical setup. This step verifies the past steps

67
in the simulation process. If the reconstructed images on the computer match the
optically reconstructed images this means that both hologram generation and
reconstruction process is working properly and transfer function and
reconstruction information can be used for hardware implementation. The
holograms generated and shown in the previous parts are optically reconstructed
and their results are shown here.
Simulations shown in Figures 3.19 and 3.27 are reconstructed with the same
phase precision of the actual spatial light modulator used in optical
reconstruction in order to be able to observe the effect of the limited precision of
the spatial light modulators. The optical image reconstructions from these
holograms are shown in Figures 3.30 and 3.31. The computer reconstruction
calculations are carried out with infinite precision except the spatial light
modulator phase precision. Optically reconstructed images are the images that
implemented the quantization and data loss due to spatial light modulator
properties during computer reconstruction process. The other holograms do not
need reconstruction because optical and computer reconstructions cannot be
compared.
The results for holograms generated by Rayleigh-Sommerfeld method are
shown below. Figure 3.30 shows the image reconstructed from the hologram
shown in Figure 3.17. There is additional distortion on the reconstructed image
because the laser used as the reference light in this reconstruction is conically
directed to spatial light modulator. Thus the output image seems as it is
projected on a ball. Figure 3.31 shows the reconstructed image from the
hologram shown in Figure 3.9. The optical setup used in these reconstructions is
shown in Figure 3.1.
68
Figure 3.30 : Optically reconstructed image from the hologram shown in Figure 3.17 using the setup shown in Figure 3.1.

69
Figure 3.31 : Optically reconstructed image from the hologram shown in Figure 3.9 using the setup shown in Figure 3.1.
The reconstructed images from the holograms generated by Rayleigh-
Sommerfeld diffraction are similar to reconstructed images on the computer.
This shows that the computer program used for generating hologram and
simulating the image reconstruction from it by using Rayleigh-Sommerfeld
method can be used for generating the transfer function needed for FPGA
implementation. This benefits the design process in such a way that every step in
the hardware can be simulated on the computer numerically. The output of every
step in hardware implementation has a reference to be compared. This will help
to find out numerical errors in the design easily. In the hardware implementation
phase verifying the calculation methods and devices will help to find out timing
failures in an easier way. Since we need a reference to verify the calculations
and the optical reconstructions match computer reconstruction of the images
from holograms generated by Rayleigh-Sommerfeld diffraction choosing
Rayleigh-Sommerfeld method for hardware implementation is more appropriate.

70
Chapter 4
Simulation of FPGA Implementation
4.1 Introduction
In this chapter, we present the simulation of implementation of Rayleigh-
Sommerfeld algorithm for hologram generation in FPGA. In the first step we
had to decide on which platform we will implement the design. We could design
our custom board for the implementation; we could obtain a professional high-
end application board; or we could obtain one of the general purpose demo
boards on the market. We decided to use a general purpose demo board in order
to implement this work. We chose a general purpose FPGA board because it is
easy to obtain one of these boards; the documentation for the board is easy to
access; finding assistance for the problems that we may encounter during the
design period is easier since lots of people use the same board for different
purposes. Designing our custom board for this application was not feasible for
the first attempt since a lot of design time must be consumed before the
implementation to design the board. Using a professional high end board was
not feasible either because accessing assistance for the bugs and errors and
documentation of these type boards are relatively harder than general purpose
boards.
There are lots of alternative general purpose boards available on the market.
For our implementation the following specifications must be met. First of all, the
board must have a video input in order to get a video stream as input pattern and
a digital visual interface video output to display the generated hologram on

71
Holoeye HEO 1080P spatial light modulator. Additionally it must have a fast
and large memory available on the board. The memory need in hologram
generation is large and becomes larger when the desired input and output size
increase. Moreover the board must have another on board memory which can be
used as buffer for the video output process. This memory seems irrelevant but it
is critical as buffer for video output since our target display device only supports
60 Hz video input. If the speed of hologram generation is not fast enough to
support 60 Hz operation; this buffer makes sure that the video output is at 60 Hz.
Furthermore the FPGA on the board must be as large as possible and also must
be as fast as possible. It must be capable of calculating the required complex
operations in Rayleigh-Sommerfeld diffraction method. The ML 505 board of
the Xilinx is one of the boards that meet the requirements stated above and we
chose ML 505 as the board to implement the algorithm.
After choosing the board we had to choose the input video and the output
video criteria. First of all, we decided to use red color component of the input
video stream as a monochrome input signal. The video input is a VGA input in
our board and analog color signals of the VGA input are converted to 8-bit
digital signals. Secondly, we chose the size of the generated holograms. For this
step many design iterations are made in order to reach a suitable solution. A
square shaped input and output are chosen because reusing the one dimensional
Fast Fourier Transform blocks in the FPGA is only possible by this way.
Additionally, we had to keep the size as large as possible while carefully
consuming the limited digital signal processing hardware available in FPGA.
The FPGA on the board has 48 digital signal processing blocks embedded in it.
A 1024 point Fast Fourier Transform unit consumes nearly half of these blocks,
and this shows that there will be no block available after implementing the
complex multiplier block. It is possible to reduce the number of used blocks but
this means that speed and precision of the calculation will be sacrificed. After
some trials, the size for this implementation was chosen to be as 512X512
pixels. This is relatively low especially for the target spatial light modulator but
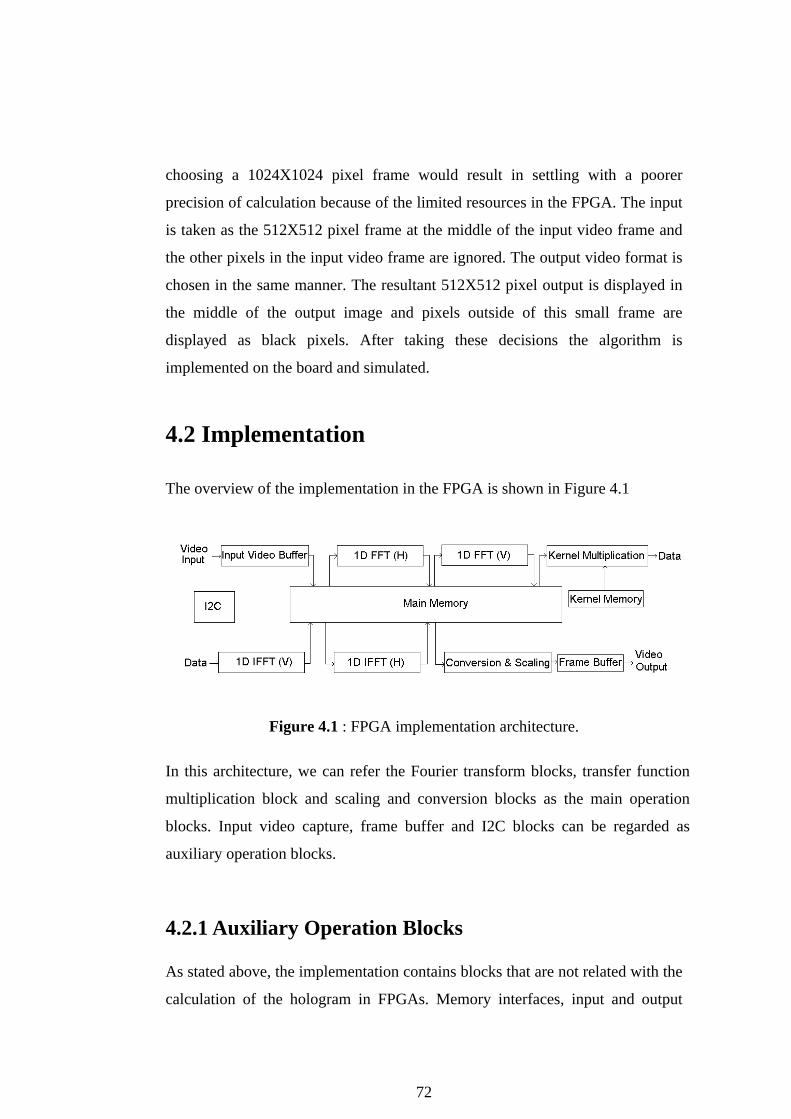
72
choosing a 1024X1024 pixel frame would result in settling with a poorer
precision of calculation because of the limited resources in the FPGA. The input
is taken as the 512X512 pixel frame at the middle of the input video frame and
the other pixels in the input video frame are ignored. The output video format is
chosen in the same manner. The resultant 512X512 pixel output is displayed in
the middle of the output image and pixels outside of this small frame are
displayed as black pixels. After taking these decisions the algorithm is
implemented on the board and simulated.
4.2 Implementation The overview of the implementation in the FPGA is shown in Figure 4.1
Figure 4.1 : FPGA implementation architecture.
In this architecture, we can refer the Fourier transform blocks, transfer function
multiplication block and scaling and conversion blocks as the main operation
blocks. Input video capture, frame buffer and I2C blocks can be regarded as
auxiliary operation blocks.
4.2.1 Auxiliary Operation Blocks As stated above, the implementation contains blocks that are not related with the
calculation of the hologram in FPGAs. Memory interfaces, input and output
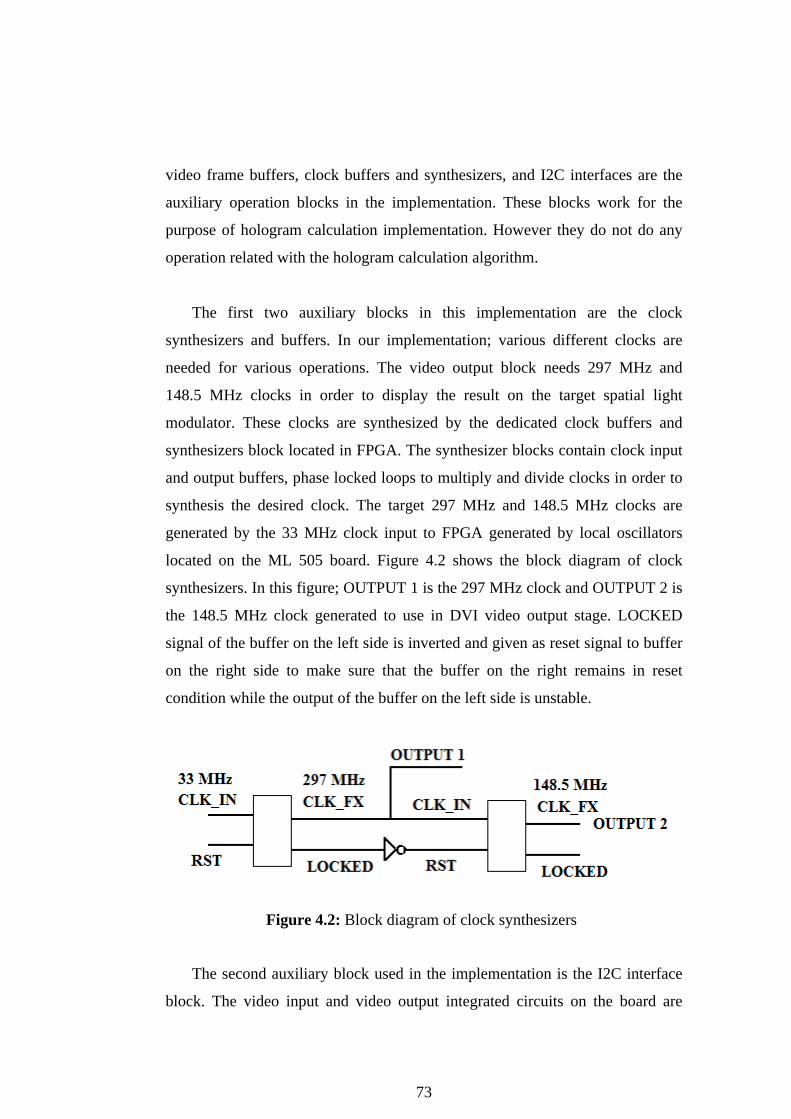
73
video frame buffers, clock buffers and synthesizers, and I2C interfaces are the
auxiliary operation blocks in the implementation. These blocks work for the
purpose of hologram calculation implementation. However they do not do any
operation related with the hologram calculation algorithm.
The first two auxiliary blocks in this implementation are the clock
synthesizers and buffers. In our implementation; various different clocks are
needed for various operations. The video output block needs 297 MHz and
148.5 MHz clocks in order to display the result on the target spatial light
modulator. These clocks are synthesized by the dedicated clock buffers and
synthesizers block located in FPGA. The synthesizer blocks contain clock input
and output buffers, phase locked loops to multiply and divide clocks in order to
synthesis the desired clock. The target 297 MHz and 148.5 MHz clocks are
generated by the 33 MHz clock input to FPGA generated by local oscillators
located on the ML 505 board. Figure 4.2 shows the block diagram of clock
synthesizers. In this figure; OUTPUT 1 is the 297 MHz clock and OUTPUT 2 is
the 148.5 MHz clock generated to use in DVI video output stage. LOCKED
signal of the buffer on the left side is inverted and given as reset signal to buffer
on the right side to make sure that the buffer on the right remains in reset
condition while the output of the buffer on the left side is unstable.
Figure 4.2: Block diagram of clock synthesizers
The second auxiliary block used in the implementation is the I2C interface
block. The video input and video output integrated circuits on the board are

74
connected to the same I2C bus. This bus is used to configure and start the
operation of the video integrated circuits. All required registers in the video
integrated circuits are modified by this interface. This step is important because
any programming error in this step causes the integrated circuit not to work
properly. Additionally; the video integrated circuits must be programmed in a
special order given in the manufacturer’s data sheets. For the digital visual
interface integrated circuits, the I2C programming interface is used to reset the
internal phase locked loops in the integrated circuit. This operation is done in
synchronization with the clock generating circuits in the FPGA in order to lock
the loop properly. Image size, input and output type, input and output level
properties of video integrated circuits are adjusted by this I2C interface block.
Another auxiliary block used in the implementation is the video input
buffer. The function of this block is to capture the target frame in the video input
frames, buffer this frame and ignore the rest of the input video frame. This block
captures the target frame and writes it to input video buffers in a format useful
for the hologram generation blocks. This block is responsible for capturing the
monochrome signal in the input frame and for writing it to the buffer memory.
Writing data to memory is done in a way that horizontal and vertical lines can be
addressed easily. The block diagram of video input buffer is given in Figure 4.3.
Here ANALOG VGA IN is the input VGA signal to the block and RESET is the
digital reset signal for the block. VGA DATA CLK is the clock signal for the
digital output side of the video input buffer. VGA DATA OUT is the 8 bit data
bus that carries the grayscale input video information. VGA DATA OUT
VALID is the signal that shows a valid data is available in VGA DATA OUT
signal. VGA OUT PIXEL ADDRESS is the 18-bit bus that shows the location
of the pixel data that is available at the VGA DATA OUTPUT. The video
output buffer is needed for outputting the hologram. This video buffer contains
the calculated hologram information and displays it at the center of the output
video frame. The other parts in the output video frame are set to zero. This block
is necessary to make sure that the video output always work at 60 Hz frame rate.

75
Additionally this buffer is responsible for displaying the pixels at correct
locations on the target display device. The block diagram of video output buffer
is given in Figure 4.4. Here VIDEO DATA IN is the 8-bit input signal that
carries the pixel data of the currently displayed pixel. CLK 297 and CLK 148.5
are required clock input signals for the block. RESET is the signal to reset the
block. HSYNC OUT and VSYNC OUT are video synchronization signals for
DVI output integrated circuit. DATA ENABLE is the signal which shows that
valid display data is available on the 12-bit OUTPUT DATA bus. CLK OUT is
the clock output for the DVI output integrated circuit. READ CLK is the clock
that goes to SRAM interface. READ ADDRESS is the 18-bit bus that goes to
SRAM interface to read the display data. READ EN is the signal that shows a
valid address is available on READ ADDRESS bus for SRAM interface.
Figure 4.3: The block diagram of video input buffer.

76
Figure 4.4: The block diagram of video output buffer
The last auxiliary block used in the FPGA is SRAM memory interfaces of
the hologram buffer and video output buffers. This memory interface is designed
to operate as interface between the SRAM memory, hologram calculation and
video transmitting blocks. There are two memory interfaces for the video
buffers, one for hologram video and one for output video. These memory
interfaces make the implementation of video input and video output blocks
easier by providing them a fast and easy access interface. The SRAM memory
interface block diagram is shown in Figure 4.5. HOLOGRAM DATA IN is the
8-bit display data signal that comes from “arc tan” conversion block.
HOLOGRAM CLK is the clock signal to synchronize the signals coming from
the hologram calculation part. HOLOGRAM ADDRESS is the 18-bit address
signal to show the location of the data available in HOLOGRAM DATA IN
signal. HOLOGRAM DATA VALID is the signal that shows a valid address is
available in HOLOGRAM ADDRESS signal. READ CLK, 18-bit READ
ADDRESS signal, READ EN and 8-bit VIDEO DATA OUT signal are the
signals connected with video output buffer block. They are used to send the
pixel data of the display from SRAM interface to VIDEO BUFFER OUT.
SRAM CLK is the clock signal that goes to SRAM integrated circuit. SRAM
ADDRESS is the 18-bit address bus of the SRAM integrated circuit. SRAM

77
DATA is the 32-bit data bus for the SRAM integrated circuit. SRAM WE is the
active low write enable signal for the SRAM integrated circuit.
Figure 4.5: The block diagram of the SRAM memory interface.
4.2.2 Main Operation Blocks
The main operation blocks in the hologram generation implementation are the
Fourier transformation blocks, main memory interface, transfer function
memory and transfer function multiplication block and scaling and conversion
block. These blocks contribute to the hologram calculation directly.
The first main block of the implementation is the main memory interface.
The main memory in this work is a 256 MB DDR2 SDRAM memory. Xilinx
provides a DDR2 memory interface but pin assignments of the provided
interface must be adjusted for ML 505 board. In FPGA applications with DDR2
memory usage, a good interface is important to make sure that the device works
properly and fast. The memory interface for the DDR2 memory is responsible
for adjusting the data delays caused by the internal routing of the data signals in
the FPGA. For this adjustment and proper operation, first-input-first-output

78
(FIFO) buffer memories are used in the DDR2 interfaces implemented in
FPGAs. These buffer memories provide a stable interface for both DDR2 side
and user side. The sizes of these memories are important and changes from
application to application. In our case, two reading buffers and two writing
buffers are used. The sizes of these buffers are equal and they are 512X128 bit
memories. The bit depth of 128 comes from the DDR2 interface of the FPGA.
During calculations, each pixel is represented as 32-bit real and 32-bit imaginary
numbers in order to avoid overflow problems. Representing the pixel with less
bit precision is also possible but these buffers must be designed for the largest
representation situation possible in the calculation process. Since we will
calculate a 512X512 hologram because of the resource needs and do our
operations in a row-by-row or column-by-column way a 512 address sized
buffer is required. If the FIFO buffers are properly designed, it is possible to
extract more from these memories.
The remaining important blocks in our implementation are the Fourier
transform blocks. The Fourier transform block used in the design is a Xilinx IP.
There are two Fourier transform blocks in the system, the forward Fourier
transform and the inverse Fourier transform blocks. Fourier transform is the
main operation in hologram generation with Rayleigh-Sommerfeld algorithm. In
this algorithm, two-dimensional Fourier transform and two-dimensional inverse
Fourier transform operations are performed in order to calculate the hologram.
Two-dimensional Fourier transform can be divided into one dimensional Fourier
transforms in vertical and horizontal directions and applying it successively. For
two-dimensional Fourier transforms, first horizontal transform is performed.
After finishing the horizontal transforms for each line in the pattern, the
resultant matrix is the used as input for vertical Fourier transforms. The main
memory of the system is used as buffer for these operations. The same
architecture is used in the inverse Fourier transform operation.
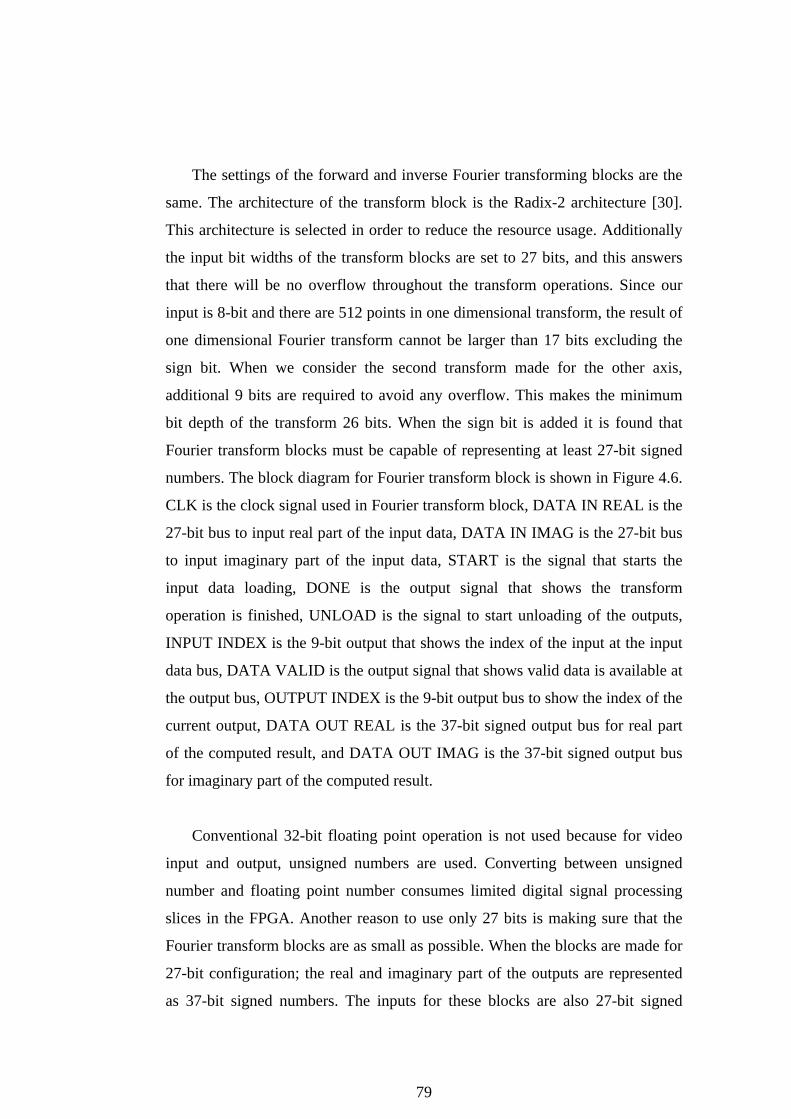
79
The settings of the forward and inverse Fourier transforming blocks are the
same. The architecture of the transform block is the Radix-2 architecture [30].
This architecture is selected in order to reduce the resource usage. Additionally
the input bit widths of the transform blocks are set to 27 bits, and this answers
that there will be no overflow throughout the transform operations. Since our
input is 8-bit and there are 512 points in one dimensional transform, the result of
one dimensional Fourier transform cannot be larger than 17 bits excluding the
sign bit. When we consider the second transform made for the other axis,
additional 9 bits are required to avoid any overflow. This makes the minimum
bit depth of the transform 26 bits. When the sign bit is added it is found that
Fourier transform blocks must be capable of representing at least 27-bit signed
numbers. The block diagram for Fourier transform block is shown in Figure 4.6.
CLK is the clock signal used in Fourier transform block, DATA IN REAL is the
27-bit bus to input real part of the input data, DATA IN IMAG is the 27-bit bus
to input imaginary part of the input data, START is the signal that starts the
input data loading, DONE is the output signal that shows the transform
operation is finished, UNLOAD is the signal to start unloading of the outputs,
INPUT INDEX is the 9-bit output that shows the index of the input at the input
data bus, DATA VALID is the output signal that shows valid data is available at
the output bus, OUTPUT INDEX is the 9-bit output bus to show the index of the
current output, DATA OUT REAL is the 37-bit signed output bus for real part
of the computed result, and DATA OUT IMAG is the 37-bit signed output bus
for imaginary part of the computed result.
Conventional 32-bit floating point operation is not used because for video
input and output, unsigned numbers are used. Converting between unsigned
number and floating point number consumes limited digital signal processing
slices in the FPGA. Another reason to use only 27 bits is making sure that the
Fourier transform blocks are as small as possible. When the blocks are made for
27-bit configuration; the real and imaginary part of the outputs are represented
as 37-bit signed numbers. The inputs for these blocks are also 27-bit signed

80
numbers. By this configuration, the blocks are made to be as small as possible
while making sure that no overflow occurs. When the blocks were tested for
biggest input levels for all samples, no overflow occurred in any Fourier
transform. The result of this test can be seen on Figure 4.7. The maximum
number obtained at the output is 66846720 which can be represented as a 26-bit
unsigned number.
Figure 4.6: The block diagram of Fourier transform block
To validate the Fourier transform blocks, some tests were made. For these
tests a Fourier transform block and an inverse Fourier transform block are
cascaded. Then a known pattern is given as input to Fourier transform block.
This pattern is shown in Figure 4.8. The output of the Fourier transform block
and inverse Fourier transform block are compared with the simulation results.
These comparisons showed that the input array and the output array of these test
blocks match and so both blocks work fine. The input of the test block is shown
as xn_re signal in Figure 4.9 and the output of the test block is shown as
xk_re_out signal in Figure 4.10. The simulation window is presented in Figure
4.11.
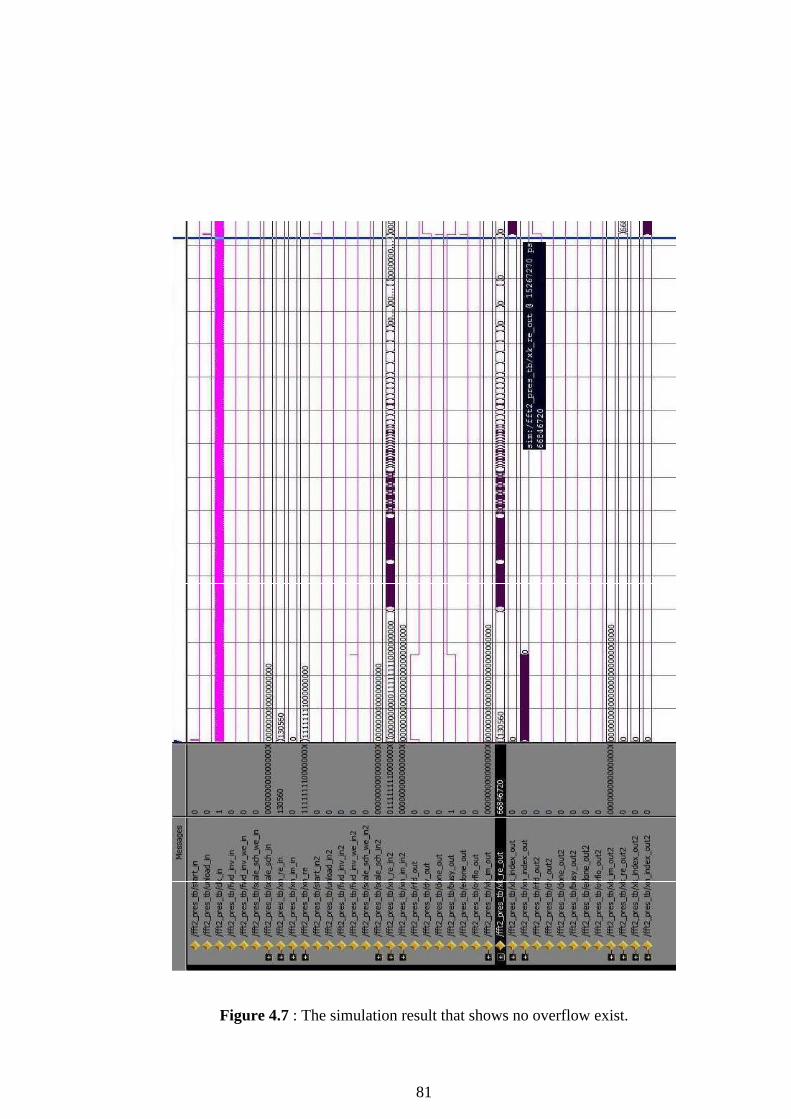
81
Figure 4.7 : The simulation result that shows no overflow exist.

82
Figure 4.8 : The one-dimensional input pattern used for Fourier transform test block.
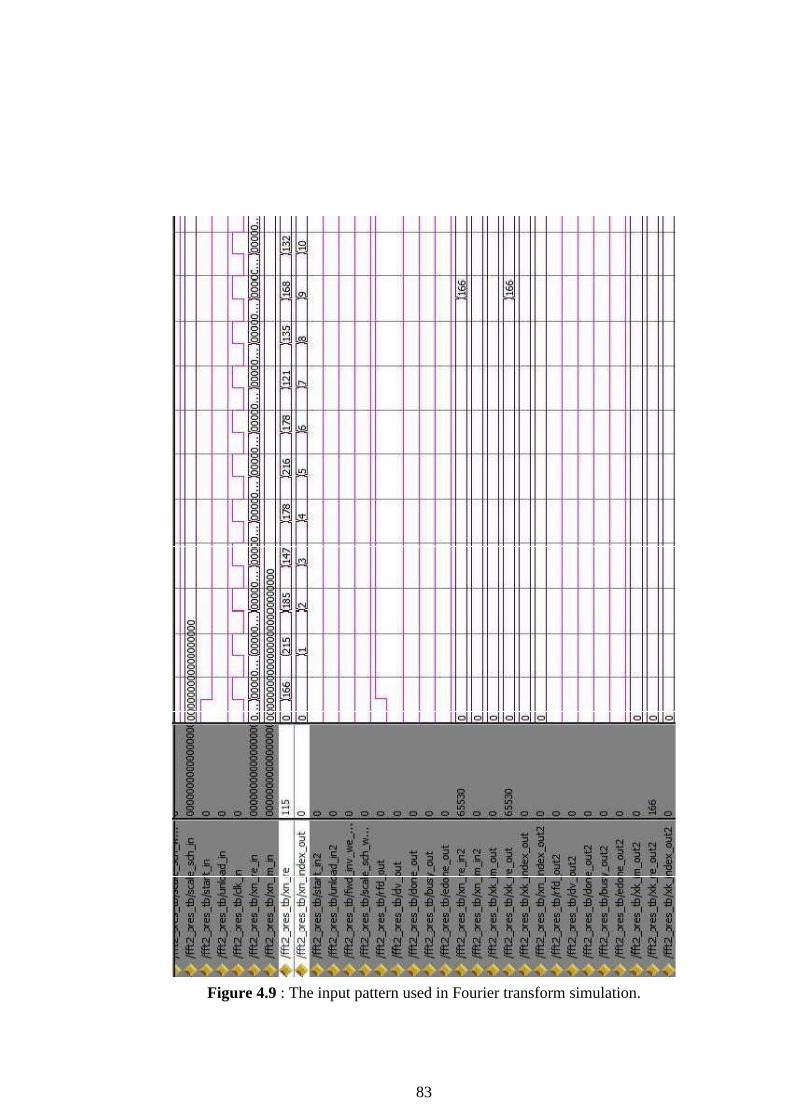
83
Figure 4.9 : The input pattern used in Fourier transform simulation.
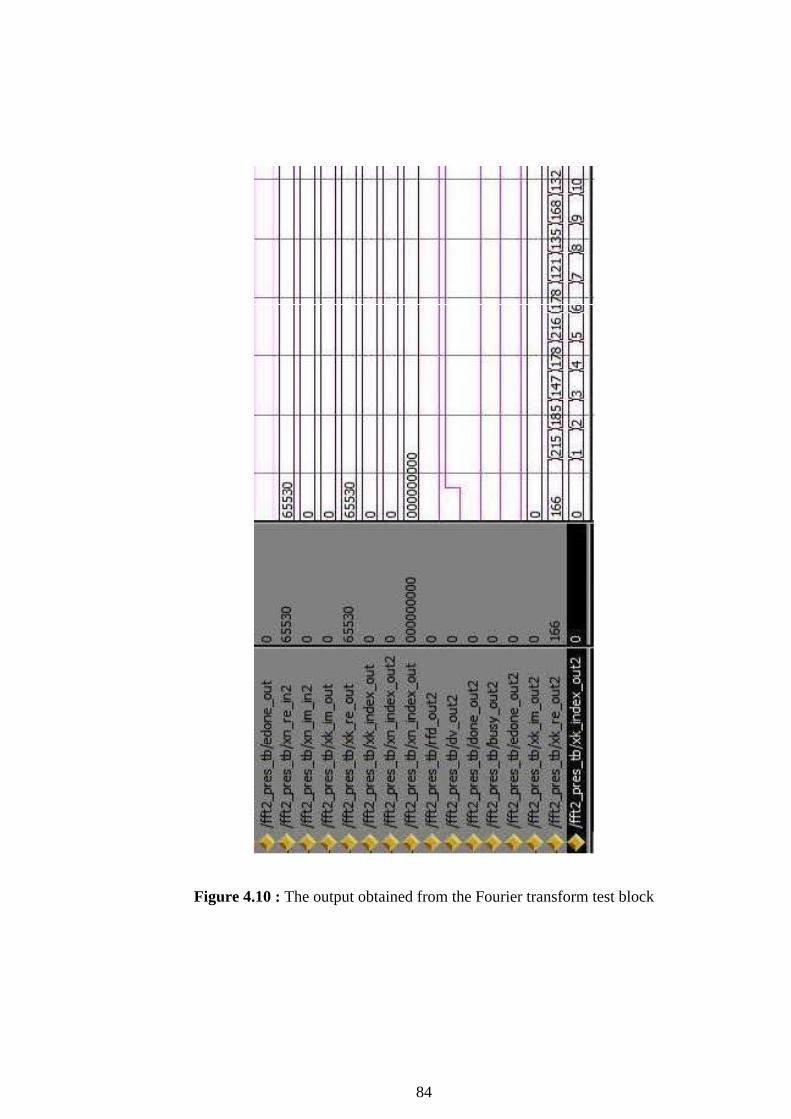
84
Figure 4.10 : The output obtained from the Fourier transform test block

85
Figure 4.11 : The simulation window obtained from the Fourier transform test

86
The transfer function multiplication operation in Rayleigh-Sommerfeld
method is implemented by the transfer function memory block and transfer
function multiplication block. Transfer function multiplication block is a
complex multiplier block with one 27-bit signed complex input array and one
16-bit signed complex input array for transfer function. It is generated with the
help of Xilinx CoreGen IP generation software and it uses 6 digital signal
processing blocks in the FPGA. The transfer function is represented as 16-bit
signed number array in the FPGA. This 16-bit notation can be simplified by
sacrificing the precision of the transfer function but this results in low quality
reconstructed images. The result of the complex multiplier is truncated to 27 bits
to feed into inverse Fourier transform block. Figure 4.12 shows the block
diagram of complex multiplier block. CLK is the clock signal used in this block.
INPUT A REAL IN is the 27-bit real input bus for the first number. INPUT A
IMAG IN is the 27-bit imaginary input bus for the first number. INPUT B
REAL IN is the 8-bit real input bus for the second number. INPUT B IMAG IN
is the 8-bit imaginary input bus for the second number. RESULT REAL OUT is
the 35-bit bus for the real part of the output and RESULT IMAG OUT is the 35-
bit bus for the imaginary part of the output.
Figure 4.12 : The block diagram of complex multiplier block
Another important part in transfer function multiplication process is the
transfer function memory part. The memory must be capable of storing all the
transfer function values. A single transfer function value is represented as an 8-
bit real and an 8-bit imaginary number. This means that each transfer function
87
value need 16-bit storing unit. There are 262144 different transfer function
values. This shows that a 512 KByte memory is required for storing the transfer
function. Usage of main memory for the transfer function storage increases the
process time and thus slows the calculation process. The transfer function in the
main memory reduces the effectivity of the DDR2 memory since the Fourier
transform results and transfer function values cannot be located in the same
memory banks. Transfer function is stored in a memory different than main
memory to increase the calculation speed. The transfer function is stored in
memory blocks located in the FPGA. However the memory blocks in the FPGA
are limited and can store approximately 2 MBit data and some of these memory
blocks are used by the Fourier transform blocks. To reduce the memory size, the
symmetry of the transfer function is exploited. The transfer function is divided
into four matrices of equal size and only one of them is stored. The others are
obtained by rotating the original one 90 degrees. Thus the transfer function can
be represented by a matrix, one fourth of the actual transfer function size. This
reduces the memory required by the transfer function. This property is exploited
in this work and the transfer function is represented by 1Mbit memory and a
memory address generator which maps all pixels with the same value to the
same memory location. This transfer function memory is initialized as read only
memory for simplicity. The transfer function memory blocks is a simple block
that takes in a clock signal and an 18-bit address signal and outputs the desired
16-bit data two clock cycles later.
Another block used in the implementation is the “arc tan” conversion block.
This block is generated by using Xilinx CoreGen software. This block is used to
find the phase of the output and scale it over 2π angular region with 8-bit
precision. The input of this block is a complex number with 16-bit precision for
real and imaginary parts and the 8-bit output of this block is directed to the
output video buffer. The output of the inverse Fourier transform block is used as
input for this block. The block diagram of the “arc tan” conversion block is
shown in Figure 4.13. In this figure, CLK represent the clock of the block, X

88
DATA IN represents the 16-bir real data input, Y DATA IN represents the 16-
bir imaginary data input, and PHASE OUT represents the 8-bit phase output
scaled over 2π angular region.
Figure 4.13 : The block diagram of “arc tan” conversion block.
These blocks are used during the hologram generation. All of them must be
properly configured to work without errors. The optimization of these blocks is
done by considering the overall system, the available resources, and the signal
interface between the neighboring blocks. There must not be important data loss
during the calculations. The balance between higher precision and limited
resource must be considered at every step. A successful hologram generation
system can be achieved by considering these design constraints and finding an
implementable solution.
89
Chapter 5
Conclusions
In this thesis, hologram calculation in real time is studied. There are several
different algorithms available today to calculate the hologram of an object.
However, these algorithms require huge computational power. Data reduction,
useful approximations and parallel processing techniques are used to reduce the
hologram generation time. In this work, first different methods for hologram
generation are discussed and simulated to find the useful method for hardware
implementation. After this step, parallel processing by using FPGA is focused
on. Real time implementation of hologram generation with chosen Rayleigh-
Sommerfeld method in FPGA is attempted and simulated.
The algorithms for hologram calculation; Rayleigh-Sommerfeld method,
Fresnel-Kirchhoff method and bipolar intensity method are reviewed and
discussed. Fresnel-Kirchhoff method and Rayleigh-Sommerfeld method
presented here are useful for hardware implementation in FPGA since they
require less numerical operations and they do not require pointwise calculation
as bipolar intensity method. They perform calculation in the Fourier domain and
thus they do not require pointwise calculations. A drawback of these methods is
they can be used to calculate the hologram for planar inputs.
Simulations of Rayleigh-Sommerfeld method and Fresnel-Kirchhoff method
are presented and discussed. This simulator can calculate the hologram by using
the methods above and can reconstruct the images from the computed
holograms. Additionally the results of these simulations are used as reference in
the hardware implementation of the hologram generation. Several input patterns
are used to observe the output of the simulators for two methods and they are
90
compared. In these simulations both methods work fine in hologram generation
and image reconstruction. Finally, optical image reconstructions for different
holograms generated by Rayleigh-Sommerfeld method are presented and they
are compared with computer image reconstructions. It is seen that hologram
with only phase information is more successful than the hologram with only
magnitude information in optical image reconstructions. Computer image
reconstructions and optical image reconstructions for holograms generated by
Rayleigh-Sommerfeld method are matched.
When the holograms generated by Rayleigh-Sommerfeld method and
Fresnel-Kirchhoff method are compared, it is seen that they do not match. In
normal case, the holograms generated for the same input pattern and same
parameters must match. Optical image reconstructions from holograms
generated by Rayleigh-Sommerfeld method are successful and match the image
reconstructions of the simulator. Optical image reconstructions from holograms
generated by Fresnel-Kirchhoff method are not successful. This shows there is a
problem in the Fresnel-Kirchhoff simulator and it does not work properly. A
missing or wrong variable in the Fresnel-Kirchhoff equation may cause the
simulator to fail. Several attempts are done to find the problem but no successful
result is obtained.
The hardware implementation took a lot of iterations and trial-and-errors. It
is seen that all limitations of hardware and implementation must be considered
to start the design. Additionally a good simulation and verification method must
be selected before starting the design. The simulator developed for Rayleigh-
Sommerfeld method is used as reference to verify the hardware and simulate the
hardware implementation. It is seen that it is necessary to have a reference to
verify the hardware implementation and simulate it.
The expected calculation time for one frame is found as follows: the
horizontal transform for a single line is completed in 3500 clock cycles. Reading

91
the input from and writing the output of transform block to DDR2 memory
consumes 600 clock cycles. Thus total process for single line takes 4100 clock
cycles. So a two-dimensional Fourier transform takes approximately
2X512X4100 clock cycles. The inverse Fourier transform consumes the same
time as forward Fourier transform. The transfer function multiplication takes
approximately 512X522 clock cycles since pipelined architecture is used. Since
input and output frames are buffered, they are not used in timing calculation.
The hologram calculation time for 100MHz system clock and 200 MHz DDR2
memory clock was found to be approximately 90ms. This corresponds to 11 fps
frame rate.
The DDR2 memory interface can process 128 pixel data in one burst.
Additional FIFO to store one row or column is required. But since memory in
the FPGA was mostly consumed by transfer function memory and memory for
FFT and IFFT blocks; the remaining memory in FPGA was not enough. A
solution for this problem can be reducing the hologram size. Reduction in the
size also increases the speed of hologram calculation. The size of the hologram
must be chosen carefully by considering software and hardware limitations
before the implementation. Reducing the size of hologram at the end of the
design process causes all work done until that time to be lost.
Future work can be described as follows. For implementation on ML 505
board, size of the hologram can be reduced in order to decrease the memory
requirement. However, implementing a specific algorithm on a general purpose
board reduces the performance since some useful tricks cannot be implemented
on general purpose board. A board can be designed for a specific hologram
calculation algorithm. For Rayleigh-Sommerfeld method, pipeline architecture
can be used with several FPGAs cascaded with each other. The data transfer
between these FPGAs must be one directional except control signals and there
must be a dual port SDRAM between each FPGA. Using dual port SDRAM
allows pipelining two-dimensional FFT and IFFT calculations. Additionally
92
using SDRAM dramatically reduces the memory read-write time required with
respect to DDR2 memory in column wise operations since DDR2 memories are
optimized for burst read and write operations and SDRAMs do not wait between
read and write operations for addresses from different locations. In custom board
implementation additional memory can be used to store the transfer function.

93
Appendix A
ML 505 Board Features The features of the ML 505 general purpose demo board can be summarized as follows:
• FPGA: Xilinx Virtex-5 LX50T-1FFG1136.
• CPLD: XC95144XL.
• 256-MB DDR2 SODIMM RAM.
• 262144x32 bit ZBT synchronous SRAM.
• VGA Video Input.
• DVI Video Output.
• 33MHz-27MHz-100MHz single ended clock sources.
• 200MHz differential clock source.
• General Purpose DIP switches (8), LEDs (8), pushbuttons (8).
• JTAG configuration port for use with Platform USB download cable.
• 32 MB linear flash.
• 2 MB SPI flash.
• Expansion header for 32 single-ended I/O.
• Stereo AC97 audio codec.
• RS-232 serial port.
• 16 character x 2 line LCD display.
• PS/2 mouse and keyboard connectors.
• 10/100/1000 tri-speed Ethernet.
• USB interface chip with host and peripheral ports.

94
Bibliography
[1] J.E. Kasper and S.A. Feller, "The Complete Book of Holograms", John
Wiley & Sons Inc., 1987.
[2] I. Hanak, M. Janda, and V. Skala, “Computer generated holograms of
triangular meshes using a graphical processing unit”, International Journal
of Image and Graphics, Aug 2006.
[3] L. Ahrenberg, P. Benzie, M. Magnor, and J. Watson, “Computer generated
holography using parallel commodity graphics hardware”, Optics Express
Vol. 14, pp. 7636-7641, August 2006.
[4] M. Kovachev, R. Ilieva, P.Benzie, G. B. Esmer, L. Onural, J. Watson, and
T. Reyhan, “Holographic displays using spatial light modulators”, in Three-
Dimensional Television, eds. H. M. Ozaktas, L.Onural, Springer, pp. 529-
555, 2007.
[5] F. Yaras, M. Kovachev, R. Ilieva, M. Agour, and L. Onural, "Holographic
Reconstructions Using Phase-Only Spatial Light Modulators", 3DTV
Conference: The True Vision - Capture, Transmission and Display of 3D
Video, 2008, pp.PD-1-PD-4, 28-30 May 2008.
[6] M. Kovachev, R. Ilieva, L.Onural, G. B. Esmer, T. Reyhan, P. Benzie, J.
Watson, and E. Mitev, “Reconstruction of computer generated holograms
by spatial light modulators” in Multimedia Content Representation,
Classification and Security, eds. B. Gunsel, A. Jain, A. Tekalp, B. Sankur,
Springer, pp. 706-713, 2006.
95
[7] S. Fukushima, T. Kurokawa, and M. Ohno, “Real-time hologram
construction and reconstruction using a high-resolution spatial light
modulator”, Applied Physics Letters Vol. 58, pp. 787-789, 1991.
[8] M. Lucente, “Interactive computation of holograms using a look-up table”,
Journal of Electronic Imaging Vol. 2, no. 1, Jan.1993.
[9] M. Lucente, "Diffraction-Specific Fringe Computation for Electro-
Holography", Doctoral Thesis Dissertation, MIT Dept. of Electrical
Engineering and Computer Science, Sept. 1994.
[10] I. Hanak,P. Zemcik, M. Zadnik, and A. Herout, “Partial quadratic
interpolation for acceleration of hologram synthesis on FPGA”, Optical
Society of America, 2008
[11] I. Hanak,P. Zemcik, M. Zadnik, A. Herout, and V. Skala, “Accelerated
optical field computation for hologram synthesis using FPGA”, 3DTV-
Research Internal Report, 2007
[12] T.A. Nwodoh, “Using field programmable gate arrays to scale up the speed
of holographic video computation”, Journal of Electronic Imaging Vol. 12,
pp. 558-566, July 2003.
[13] U. Schnars, T. Kreis, and W. Juptner, “CCD-recording and numerical
reconstruction of holograms and holographic interferograms”, SPIE Vol.
2544, pp 57-63, 1995.
[14] M. Lucente, “Computational holographic bandwidth compression”, IBM
Systems Journal Vol. 35, pp. 349-365, 1996.

96
[15] L. P. Yaroslavsky, “Computer generated holograms and 3-D visual
communication”, Journal of Holography and Speckle Vol.5, pp. 1-6, 2008.
[16] M. Lucente, "Optimization of Hologram Computation for Real-Time
Display", in SPIE Proceedings 1667 Practical Holography (SPIE,
Bellingham, WA, Feb 1992), S.A. Benton, pp 32-43.
[17] T. Ito, T. Shimobaba, H. Godo, and M. Horiuchi, “Holographic
reconstruction with a 10-µm pixel-pitch reflective liquid-crystal display by
use of a light-emitting diode reference light”, Optics Letters Vol. 27, pp.
1406-1408, 2002.
[18] A. Jesacher, C. Maurer, A. Schwaighofer, S. Bernet, and M. Ritsch-Marte,
“Near-perfect hologram reconstruction with a spatial light modulator”,
Optics Express Vol. 16, pp. 2597-2603, 2008.
[19] HOLOEYE Photonics AG “HDTV Phase Panel Developer Kit,” HEO
1080P Specification Sheet, Oct. 2007.
[20] T. Inoue, H. Tanaka, N. Fukuchi, M. Takumi, N. Matsumoto, T. Hara, N.
Yoshida, Y. Igasaki, and Y. Kobayashi, “LCOS spatial light modulator
controlled by 12-bit signals for optical phase-only modulation”,
Proceedings of SPIE Vol., no. 1, 6487, 2007.
[21] F. Yaraş, H. Kang, and L. Onural, “Real-time phase-only color holographic
video display system using LED illumination”, Applied Optics Vol. 48, pp.
48-53, Sept. 2009.
[22] A. Michalkiewicz, R. Lymarenko, X. Wang, M. Kujawinska, O.Budnyk,
and P.J. Bos, “Simulations, registration and reconstruction of digital

97
holograms of arbitrary objects by means of liquid crystal on silicon spatial
light modulator”, Proceedings of SPIE Vol. 5947, 2005.
[23] Y. Sando, M. Itoh, and T. Yatagai, “Color computer-generated holograms
from projection images”, Optics Express Vol. 12, pp. 2487-2493, May
2004.
[24] T. Yamaguchi and H. Yoshikawa, “Real time calculation for holographic
video display”, Proceedings of SPIE Vol. 6136, 2006.
[25] M. Koenig, O. Deussen, V. Padur, and T. Strothotte, “Visualization of
hologram reconstruction”, Proceedings of SPIE Vol. 4302, pp. 80-87, 2001.
[26] T. Kreis, “Digital holography methods in 3D-TV”, 3DTV Conference, 2007,
pp.1-4, 7-9 May 2007.
[27] M. Janda, I. Hanak, and V. Skala. “Scanline rendering of digital hologram
and hologram numerical reconstruction” in Spring Conference on Computer
Graphics 2006, pp. 66-74, 2006.
[28] G. B. Esmer, "Computation of Holographic Patterns between Tilted
Planes", M.S. Thesis, Bilkent University Department of Electrical and
Electronics Engineering, June 2004.
[29] S. Tay, P. A. Blanche, R. Voorakaranam, A.V. Tunç, W. Lin, S. Rokutanda,
T. Gu, D. Flores, P. Wang, G. Li, P. St Hilaire, J. Thomas, R.A. Norwood,
M. Yamamoto, and N. Peyghambarian, “An updatable holographic three-
dimensional display”, Nature Vol. 451, pp. 694-698, 2008.
[30] Xilinx Inc, “Xilinx Logicore Fast Fourier Transform v7.0 Product
Specification”, June 24 2009.