simulating the effects of alternative forest management
TRANSCRIPT

Journal of Environmental Management (1996) 46, 77-94
.
Simulating the Effects of Alternative Forest Management Strategies _l_on Landscape Structure _ •L IEric J. Gustafson and Thomas R. Crow
x
U.S. Department of Agriculture, Forest Service, North Central Forest ExperimentStation, Forestry Sciences Laboratory, Rhinelander, WI54501, U.S.A.
Received 27 February 1995
Quantitative, spatial tools are needed to assess the long-term spatial consequences -., i:i.... "
of alternative management strategies for land use planning and resource .317::_?i,__ ,_,.management. We constructed a timber harvest allocation model (HARVEST) ;.!_;_:i;_,that provides a visual and quantitative means to predict the spatial pattern of . ._%.,;_-_,. . ,forest openings produced by alternative harvest strategies. HARVEST was usedto investigate the effect on landscape structure of alternate management plans • _i/i.; "•formulated for the Hoosier National Forest (HNF) in southern Indiana, U.S.A. ..... :- ,The 1985Forest Plan for the HNF specified primarily clear,cutting across most ofthe forest, and the 1991Amended Forest Plan specified primarily group selection(removal of small groups of trees), limited to a much smaller portion of the forest.We assessed the relative importance of variation in the extent and intensity of otimber harvest on landscape spatial pattern. We simulated 150years for eachalternative and calculated several measures of forest spatial pattern. The totalarea of forest interior and the mean size of forest interior blocks declined moreunder the 1985Plan than under the 1991Plan, primarily because of the greater _ _"area dedicated to timber production in the 1985Plan. Despite the 65% decrease intimber production in the 1991Plan, that Plan produced almost as much forestedge as the 1985Plan due to heavy reliance on small harvests with largeperimeter-to-area ratios. Both Plans resulted in an even distribution of age classes ' /Jup to the age equal to rotation length, a dramatic decline in mid-age classes, and a ., ,_ /large area of mature forest. The restriction of harvest activity to more limited _,areas in the 1991Plan appeared to have a greater effect on forest spatial patternthan did the differences in harvest intensity of the two Plans. HARVEST providesa tool to link planning alternatives with potential changes in landscape structure,commodity produotion, and other resource values that are spatially dependent.© 1996AcademicPressLimited
Keywordsi forest management planning, landscape ecology, simulation models,.habitat fragmentation_ forest interior, forest edge, clearcutting, age-classdistribution, biological diversity, spatial pattern, scale.
1. Introduction
Provisions of the National Forest Management Act of 1976(NFMA) require the U.S.Department of AgricultureForest Serviceto completea plan for each National Forest
. 770301-4797/96/010077+ 18$12.00/0 © 1996AcademicPressLimited
• ° l". )
\.
' • 4 [] ' -.-
..• _ . . . . • . . : .... ,
• ,, ..

6
78 Simulating forest management strategies '\ "
that constitutes a comprehensive statement of management direction. The contents ofa Forest Plan include forest-wide, multiple-use goals and objectives, standards andguidelines for fulfilling these goals and objectives, projections of timber harvest quant-ities, andprocedures for monitoring management impacts. The Forest Plan is a guidingdocument, covering a 10-year period, that provides the broad framework for more site-specific analysis and project implementation. NFMA requires the preparation of anEnvironmental Impact Statement as part of the planning process, including the de-Iineation and evaluation of multiple management alternatives (USDA Forest Service,1985a).
Because there are ecological consequences of creating different landscape patterns _'_: ', , ',
in space and time, quantitative, spatial tools are needed to assess the long-term _: _ .:spatial consequences of alternative management strategies (Franklin and Forman, 1987; -_:_,:_:_'_ ...._,'_...."..Hemstrom and Cissel, 1991; Li et al., 1992; Thompson, 1993). To this end, we have ::_:_::_:::_;',i:_'_:_:constructed a timber harvest allocation model (HARVEST) that provides a visual and •-i:!_:;;:%ii::_i.'.. _" .!i__._ . ,quantitative means to predict the spatial pattern of forest openings produced under _-_,_.....:__ .alternative harvest strategies (Gustafson and Crow, 1994). The model allows simulation :_i¢!-_.:_ '..-_, .of differences in the size of timber harvest units, the total area harvested, rotation _:_:::_:_:*_:_ _-
lengths, and the spatial distribution of harvested areas. In this paper, we present a case _::_.... =_.t_i):::......_,study in which we used HARVEST to predict the effects of published management ;i,;_ _/-alternatives for the Hoosier National Forest (HNF) on the spatial pattern of forest "_ ' __
openings, and we assessed the relative importance of variation in ha_est intensity and ;_. ,_!i_:_i!:_ ' _"management area configuration. 'i_..... _Y_ _,
In'1985, the HNF in southern Indiana released its Forest Plan. Even-age manage- 1_}_'._ _:__-ment, primarily clearcutting, was emphasized in this Plan, and reaction of some segments I :_::_i!_ _;i__of the public was swift and clear: clearcutting on 85% of the land base was not an _ _ _'
. acceptable option. As a result, the Forest Plan was amended in 1991 changing themanagement emphasis from even to uneven-age management and reducing the timber : _ 'base to about 40% of the forest. The Amended Plan proposed that timber harvest and . _ . '
vegetation management be applied "within the context of perpel_uating and enhancing ._ _ .._,biological diversity at different spatial scales and of differing desired conditions indifferent management units" (USDA Forest Service, 1991).A primary silvicultural tool
for implementing this new management direction was group selection (i.e. the harvesting "- ,. /,_of small forest patches no more than 0.4 ha in size). Furthermore, in the amended Plan, /emphasis was placed on creating interior forest conditions and reducing the amount of __ _"forest edge. _
However, these goals are not always easy to achieve because of existing conditions.The current composition and structure of a landscape reflect the physical environment,.past land uses, and the interaction between the two (Crow, 1991; Baker, 1992). Past
. forest treatments often create age structures that are fragmented and distributed inSmall patches (Ripple et al., 1991;Mladenoff et al., 1993). Federal ownership, especially _ .in the eastern U.S., is often fragmented and interspersed with commonly up to 50%private ownership, creating management problems for both ownerships and restrictingsome management options. Furthermore, the effectiveness of the change in managementstrategy in achieving the desired future condition is difficult to predict without spatialinformation and without the ability to project change in spatial patterns with time. ..
In our study, we used HARVEST to simulate management alternatives for theHNF, using stand maps compiled by the HNF for initial conditions. We used thestandards and guidelines provided in the 1985 Hoosier Forest Plan (primarily clear-cutting) and the 1991 Amended Plan (primarily group selection) as rule-bases for the

i_ ...._%_ii_:_\i_=_:_i_5_ .........E.J. GustafsonandT. R. Crow 79 [ \
model. Our objectives were to (1) characterize the differences in landscape structure over
time that result from the implementation of these fundamentally different management v_._ .......,strategies, and (2) determine the relative effects of differences in harvest intensity andthe spatial extent of harvested areas.
2. Methods 1
2.1. _w_sT' :_'__:i_._ __:i_':_HARVEST was constructed to allow the input of specific rules to allocate forest stands _.:_' :_:_:_:_"=::_for even-age harvest (clearcuts and shelterwood) and group selection, using parameters _. -commonly found in National Forest Plan standards and guidelines. The model produces ' _ ._landscape patterns that have spatial attributes resulting from the initial landscape " :...... ..conditions and the proposed management activities. The model is simplistic in that it
does not attempt to optimize timber production or quality, nor does it predict the , _ _:_ _ .specific locations of future harvest activity, as it ignores many considerations such as .....r:._ ._::' .... . "visual objectives and road access. Instead, the model mimics stochastically the allocation '_ _ '_,: _"of stands for harvest by Forest planners within the constraints of the broad management • - :_ili_:_;::. . •
strategies. Modelling this process allows experimentation to link variation in man- :_=:_ _. _..agement parameters with the resulting landscape patterns. In our study, we considered [:-:i_i__ '_:i:_
-only harvests that produce openings within the forest. Harvest by single-tree selection .......was not modelled because such methods usually maintain an essentially closed canopy .... _ _ ,_.HARVEST. was constructed to run within ERDAS v.7.5 (Erdas, Inc., Atlanta,
GA, U.S.A.) Geographic Information System (GIS) software using ERDAS Toolkit __:_;!' "_(FORTRAN) routines l%r input and output. ERDAS is a grid-cell GIS that allows :_ _:_:_'_;_/i_flexible display and manipulation of digital maps. Timber harvest allocations weremade by the. model using a digital stand map, where grid-cell values reflect the age (in _.years) .of each timber stand. The model allows control of the size distribution of
•harvests, the total area of forests to be harvested, the rotation length (by specifyingthe minimum age on the input stand map where harvests may be allocated), and the ._ a,width of buffers left between adjacent harvests and between harvests and non-forest
habitats. HARVEST selects stands randomly for harvest, checking first to ensure that _ _the Stand is old enough to meet rotation length requirements. The assumption that ."
past _harvest allocations have been spatially random was tested, and that test is described , ,4 /below. Grou p selection is implemented on the HNF such that one-sixth of a stand is /i_:cut on each entry, and entries occur every 20-30 years (USDA Forest Service, 1991;
T. Thai(e, pers. comm.). The model randomly selects stands for group selection fromthose stands with an age greater than the prescribed rotation length, and tracks the
stands managed by group selection, ensuring re-entry at 30 year intervals and preventing• . .
other treatments in those stands. Within group-selected stands, openings are placedrandomly, with at least 30 m (1 pixel) between openings. _ "
2.2. svtroY AREAS•
Simulations '_ere conducted at two spatial scales. Input data at 30 m resolution allowedsimulation of openings within stands and enabled detailed, stand-level analysis to be "made of the ecological pattern produced by the management alternatives. Data with
100 m resolution allowed analysis of how the management alternatives would producelandscape patterns across an entire National Forest. Areas to be studied at 30m
80 Simulating forest management strategies '\
resolution-were selected in three of the four administrative units of the HNF [PleasantRun stUdy area (PRUN, 34053 ha), Lost River (LRIV, 38 822ha), and Tell City(TELL, 49 515 ha)]. Stand age maps of National Forest land within the three studyareas were digitized from paper-based and mylar planning maps and gridded to 30mcells, and ages were calculated as of 1988. The two management Plans included mapsdelineating management area (MA) boundaries. Each MA has a specific managementobjective, the MA boundaries encompass tracts to be managed to meet that objective, n
and several disjunct polygons of a particular MA may be designated within an _,:_ ,: ....
administrative unit. The objectives of each MA and the decimal designations (e.g. 3.1) );,iii,_:,:i:.....are used consistently among all National Forests. MA boundaries were manually /_ '_":_''. " -b
transferred from the Forest Plan maps (approximate scale, 1"127000) to 1"100000., _. "scale U.S. Geological Survey (USGS) maps and digitized. Land use on non-Forest _...
Service land was derived from Landsat Thematic Mapper (TM) imagery collected in _: :.,1988, as described in Gustafson and Crow (1994). The Lost River study area en- !i_i•_+_:!_:_i.compassed most of Martin State Forest (MSF), and limited group selection (21.6 ha/ ......:_,, ., .
decade) was simulated on MSF land. "_-i__YSimulations were conducted using maps with 100m resolution on a rectangular _ _,_ .,, -
study area (1 058 046 ha) that included the entire HNF Purchase Area. Ownership :i'_ _: _!_,,_boundaries were digitized from 1:24 000 scale paper maps produced by USGS for the _ • _ :-•
Forest Service. Because it was not feasible to digitize stand maps for the entire Forest, :U_ _, _:i_/. , .-
:we generated a forest cover map by resampling USGS-Land Use bata Acquisition i!! ;_ _ii!i!!i_.i_(LUDA) data (200-m cells) to produce a map with 100m resolution which allowed _iii_i --allocation of harvests as small as 1ha. We assumed that the LUDA data represented
forest cover at 'the start of the simulations (1988), even though they were derived from _._:..:._i_,__,,_,._!..........aerial photography acquired in 1978. We assumed that stand ages were distributed _!_'_•_ ''_
• randomly across the Forest (see test of this assumption below), and we began the oSimulations with a homogeneous stand age map (i.e. all stands = 90 years). " '
Because the mean size of group selection openings under both Plans was less thanthe cell size (1 ha), we attempted to mimic the pattern produced by group selection by . _,allocating 9 pixels (3 x 3) to represent each group selection stand. Nine pixels (9 ha)reflects the average size of HNF stands. Because the prescription calls for one-sixth ofa Stand to be harvested on each entry (9 pixels/6= 1.5 pixels) and fractions of pixels /,_ .
could not be allocated, the model allocated either 1 or 2 pixels on each entry. Each , _ ./Pixel allocated represented a group of groups (i.e. pixel dominated by group openings). ;_11_:This algorithm thus modelled the location of group selected stands and produced smallopenings at 30-year intervals in those stands, but some of the fine-grain spatial detailOf group selection was lost at this scale. Management on the MSF was not simulated
' at this scale.• . .
We examined the assumption of random distribution of stand ages by conducting• a nearest neighbor analysis (Davis, 1986) on ten subareas of the (30 m) stand age maps _ "
in all three study areas, randomly selected from areas where there were few gaps in thestand maps (i.e. little privately-owned land). Weconducted two analyses: (1) to determinethe distribution of stands allocated by HNF planners, we analyzed stands between1-10 years on five of the subareas; and (2) to determine the distribution of standsreaching rotation age in the most recent decade, we analyzed stands between 80-89years On the remaining five subareas. To eliminate edge effects, nearest neighborsoutside the subareas were included in the analysis. This analysis required point data,so we identified the centroid of each stand, and used FRAGSTATS 1.0 (McGarigal
:." ,• . 0.
h

E. J. Gustafson and T. R. Crow 81
and Marks, 1993) to calculate the mean nearest neighbor distance (_r) of these centroids.The expected mean distance between nearest neighbors is: __,,_ _ ,
_=_ (I)
With standard error: - :_: n
.. .06831A
ss=Q N2 (2) ,> ,+,_!_i":',,.:,.V )
where A is the area of the subset and N is the number of stand centroids. The ratio:-- . _ i)
R=d / _ (3) _............
is the nearest neighbor statistic and ranges from 0"0 for a distribution where all points _ " '.... . .., ; , .1
are in the same location to 1.0 for a random distribution, to a maximum of 2.15 for a ....." ' . " -• ,r
regular hexagonal pattern. We constructed a two-tailed z-test for each subset to test --, ...
the null hypothesis that the stands are distributed randomly (Ho: R = 1.0): "_:_" "
z=(d-_)/S_, (4) "
rejecting.the null with a confidence coefficient (1 -a) of 0"95when ]z]> 1.96. The results . '_,, ' _-of this Simple analysis (Table 1) suggest that a random allocation of treatments isconsistent with historical allocations, and that random allocations for the 100m "
simulations should approximate those that would beproduced if actual stand age maps ._,_ ,,..............were available, .-, (-,-?_!"_
e
. I)
2.3. EXPERIMENTAL DESIGN
We Simulated 5 specific-management alternatives on each study area: (I) the 1985Forest .Plan (USDA Forest Service, 1985b), (2) the 1991 Forest Plan Amendment - _)"(USDA Forest Service 1991), (3) the management area (MA) boundaries of the 1985Plan wi,th the harvest intensity of the 1991 Amended Plan (85 Intensity-91 Map), (4) • ,
.. //the MA boundaries of the 1991 Plan Amendment with the harvest intensity of the 1985Plan (91 Map-85 Intensity), and (5) no harvest (i.e. no openings produced or maintained , _ /"on National Forest land). The 91 Map-85 Intensity scenario used the parameters of _:MA 3"!, which is the most intense of the 1985 Plan harvest scenarios (Table 2), toprovide the greatest contrast with the 1991 Plan harvest intensity (MA 2.8). Wesimulated 150years of management under each alternative and produced three replicates
.. of each Simulation. The variability of the spatial pattern of the simulations was verylow, and three replicates were deemed adequate to ensure robust results. Because theharvesting rules differed among MAs under the 1985 Plan, each MA was simulatedseparately, and the maps output by the model were combined to produce a completestand age map for each decade. Wildlife openings were maintained throughout thesimulations except in the "no-harvest" scenario where conversion to forest was simulatedand closed canopy forest was achieved in two decades.
To avoid confounding our investigation of the effects of alternative managementstrategies on'public lands, we did not simulate harvest activities on privately-ownedinholdings. The existing pattern of forest openings on private land was derived from• ._
the TM imagery, and these conditions were maintained throughout the simulations.

-.:r_¸__'_'.....,_ " ......... ' ,<:_<ii_'_._i_._<', ' ....i!i_:i;_:_¸ i,'

E. J. Gustafson and 1".R. Crow 83 \' "
TABLE2. Harvest intensities as derived from the 1985Hoosier National Forest Plan and the°
1991Forest Plan Amendment
1985 MA 1 1991 MA 2
Model parameter 2.1 3-1 3.2 6.1 Total 2-8
Mean clearcut openingsize (ha) 7-0 4.9 4.0 2.8 IMean group opening size (ha) 0-4 m m 0-2Maximum opening size (ha) 0-7 10.8 7.2 5.4 m 4.0Total harvested/decade3(ha) 96.0" 2360.6 2890-0 363.0 5709.6 2504-8 _:i_:,Harvest rate/decade4(%) 5.4 11-5 7.8 7.5 9"5 10.1 : _, '_..... ,Timber yield/decade3(Mbf) 180 4928 6006 767 11881 4360 .... /:_i___'.__' *Rotation length (years)- 80 80 120 120 80 ,/' : ....."_BufferWidth5(m) " 30 30 30 30 30 ....._..........._
1985Forest Plan Management Areas. The decimal designation of MAs is that used by the Forest Service. !i_'i_';'__:i:_:.:i_ .21991 Forest Plan Amendment Management Areas. , ............ • " "
"_i!;:_! _i_:_.__ . - • -3Represents harvest activity by Management Area across the entire Forest. :_,._,,:_._ ._ ....4Represents percent of forest within the Management Area that is harvested each decade.5The vfidth of buffers left between harvest allocations and other harvests, streams, and openings. :I!"-'_+_U_......
.. _,__., ,
2,4. SPATIAL ANALYSIS :_:'_ ....__:....'*_
To assess the pattern of forest openings produced by the management alternatives, we :_ __.... -assumed that forest pixels _<20 years old functioned as openings, and all other forest _::,......... _,:-_:,,_....
.pixels were considered closed-canopy forest. Because the management alternatives 1,i__'_:_remained constant throughout the 150-year simulations, the relative difference in the ,
equilibrium pattern among alternatives would hold even if openings were defined ] _,:_i_,_differently. Using a GIS proximity function, we produced maps of forest interior habitat ! _•"__?_!::_[forest pixels >210m from an opening (DellaSalla and Rabe, 1987; Andren and ,.Angelstam, 1988)] and calculated the area of forest interior, the mean size of contiguousblocks of forest interior and linear forest edge at each decade for each alternative. At , _
100m resolution,, forest interior was defined as forest pixels >300 m from an opening. ._ _ __,Each index of spatial pattern was plotted as a function of time. To establish the
pre-simulation trend, we successively recoded the 1988 stand age maps by decrementing
the. age Value (A) at time t for each pixel j by 10 to produce the stand age map of the "' : _"previous decade (i.e. Aj(t_lO)=aj(t)- 10). This was done four times to establish the ; /:pattern of forest openings since 1948. Stands that reached an age of zero (i.e. harvested) _dUri.ngthis process were assumed to have been mature forest (>80 years) before thattime.
Also. tabulated throughout the simulations were the stand age-class distributions•on:HNF land. To illustrate long-term age-class distribution trends clearly, we simulated
" the. 1985 and 1991 Plan scenarios for an additional 60 years (a total of 210 years) onthe Tel! City study.area. _ .• ,
To evaluate the relative effects of harvest intensity and the zonation of harvestactivity, a repeated measures ANOVA was used to test for treatment effects reflectingharvest, intensities (INTENSITY), management area boundaries (MAP) and time
• (DECADE)., The time periods were included in the analysis to account for potentialautocorrelation among spatial pattern measures across successive decades. . •
3. Results• 9
The replications of the simulations produced little variability. Harvest levels in all MAs
84 Simulating forest managementstrategies
were high enough that most stands >rotation age were allocated each decade. Variabilitywould be likely to be higher if harvest rates in timber production management areaswere lower, allowing stochasticity in harvest placement to have more of an effect onthe resulting pattern of openings. Even the 1991 Plan had a high intensity of harvestin MA 2.8, because the use of groups of small openings required the allocation ofmanystands to achieve the specified timber production. Although harvest intensity was _;__ihigh within MA 2"8, much less of the land base was dedicated to timber production.
Alternatives. with lower harvest intensities within MAs would result in greater spatial :'_i_ _,_......._,._:,_,,,pattern variability. The variability in our results was too low to show clearly with errorbars on histograms and line graphs, so error bars are not shown. The standard deviation _!_i:_i!l!_ii:'
0
from the mean of interior area produced by three replicates never exceeded 0.03 ha in . -. "any combination of treatments, and the standard deviation from mean linear edgenever exceeded 0.008 km. _:_:_.:__+_
3.1. SPATIAL PATTERN OF FOREST OPENINGS :::',_-!-;"' _': " ",,,_" 4,
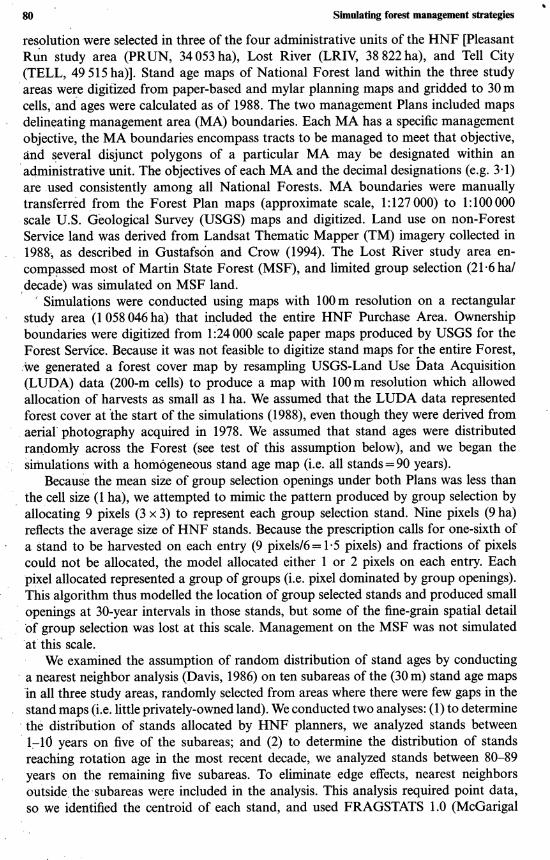
Scenarios that used the 1985 Plan MA boundaries (1985 Plan, 85 Map-91 Intensity) _ ......_/" -
showed a decline in the total area of forest interior habitat (forest >210m from an I _¢" "• edge) on all study sites, and the decline was greater than for those scenarios that used _ i_ _. :-_:,
the 1991 Plan boundaries (1991 Plan, 91 Map-85 Intensity, Figure 1). This was due .:.:iii.......... N_...............primarily to a greater proportion of the total area dedicated to tinaber production _ '_:_iT_i_!_._ "under the 1985 Plan (see Table 2). The total area of forest interior habitat decreased _;!_ _'_'-
under "scenarios that used the 1991 Plan boundaries, except on the TELL site (Figure :i!_:_!i,!i!ii_-ii_i_i_,-1). This site was different because timber harvest activity had been greater than on the .-,,_i:_:,,_ ......other sites in recent decades and because it included the greatest proportion of area ,i_.....,_!_:2_!_'
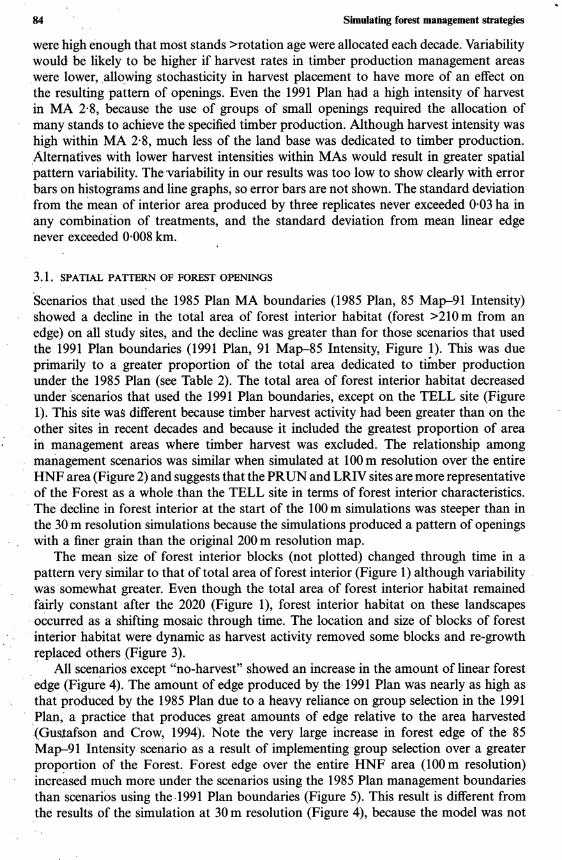
. in management areas where timber harvest was excluded. The relationship among °management scenarios was similar when simulated at 100m resolution over the entire • 'HNF area (Figure 2) and suggests that the PRUN and LRIV sites are more representative
of the Forest as a whole .than the TELL site in terms of forest interior characteristics. -_ . _,• The decline in forest interior at the start of the 100m simulations was steeper than inthe 30 m resolution simulations because the simulations produced a pattern of openings
With a finer grain than the original 200 m resolution map. , /,_The mean size of forest interior blocks (not plotted) changed through time in a _ /
pattern very similar to that of total area of forest interior (Figure 1) although variability . _4wassomewhat greater. Even though the total area of forest interior habitat remained _
. fairly constant after the 2020 (Figure 1), forest interior habitat on these landscapes ' '.•occurred as a shifting mosaic through time. The location and size of blocks of forest
, interior habitat were dynamic as harvest activity removed some blocks and re-growth• " replaced others .(Figure 3).
All scenarios except "no-harvest" showed an increase in the amount of linear forest' edge (Figure 4). The amount of edge produced by the 1991 Plan was nearly as high as
that produced by the 1985 Plan due to a heavy reliance on group selection in the 1991.Plan, a practice that produces great amounts of edge relative to the area harvested(Gus.tafson and Crow, 1994). Note the very large increase in forest edge of the 85Map-91 Intensity scenario as a result of implementing group selection over a greater •proportion of the Forest. Forest edge over the entire HNF area (100 m resolution)increased much more under the scenarios using the 1985 Plan management boundariesthan scenarios using the, 1991 Plan boundaries (Figure 5). This result is different fromthe results of the simulation at 30m resolution (Figure 4), because the model was not
'." , -• , 0.
E. J. Gustafson and T. R. Crow 85 \'• .
12000" PRUN
10000 - " "---" --"• *- "- -" "-- -" "- "-- -"
8000
ooo gm m m m m m m m m n mm m
4000 - !::__._ •_. I :. _I_'"
2000 , , , I I , , I I , , I I , , I , , I .- ¢
10000 . "LRFV
9ooo0:{
•,., .wl.
8000 ..... • _0 _'_', .,
"t_ 7000 .... . "
"._ 6000 : " . .
5000• _ . •
4000 ',• I .,
3000 ..
I2000_ TELL " "- -" "- -" "- "- -" "- -" "- "- -" " " ' ".
ioooo -_.,'z-:_Lt>.,,
8000 ...........,_ ........
6000
' _ i m i _ _ i _ _ _ m i i t- .- t
4000 , -- "",, -,-2000 I I I ,. _.
1940 1980 2020 2060 2100 2140
Year
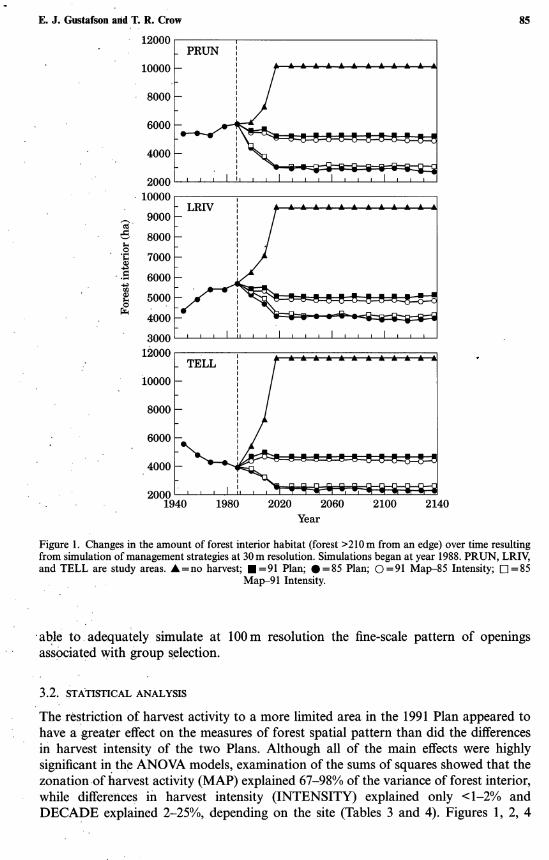
Figure 1. Changes in the amount of forest interior habitat (forest >210m from an edge) over time resulting .' /,_'_from simulation of management strategies at 30m resolution. Simulations began at year 1988.PRUN, LRIV, _ /._and TELL are study areas. • = no harvest; i = 91 Plan; • = 85 Plan; O = 91 Map-85 Intensity; F-1= 85 ,
Map-91 Intensity. ;l_:
,
•able to adequately simulate at 100m resolution the fine-scale pattern of openings" associated with group selection.
• ,
3.2. STATIStiCALaNALYSIS
The restriction of harvest activity to a more limited area in the 1991 Plan appeared to• have a greater effect on the measures of forest spatial pattern than did the differences
in harvest intensity of the two Plans. Although all of the main effects were highlysignificant in the ANOVA models, examination of the sums of squares showed that thezonation of fiarvest activity (MAP) explained 67-98% of the variance of forest interior,while differences in harvest intensity (INTENSITY) explained only <1-2% andDECADE explained 2-25%, depending on the site (Tables 3 and 4). Figures 1, 2, 4
.._,:_,_:,-_ _._%, _::_::_;_,_;._?_:.,!c4:¢_::_,_!_,.':.?_:i!_?,i_:_:. •

86 Simulating forest management strategies
220000" ENTIRE HNF
200000
180000
160000 • _,-.
"°<�~�:..140000980 2020 2060 2100 2140
Year _ "
Figure 2. Changes in the amount of forest interior habitat (forest >300 m from an edge) over time resulting _ _ " _ _.from simulation of management strategies across the entire HNF at 100m resolution. Simulations began :_: .... _:_:
assuming a homogeneous 90 year-old forest. Symbols as for Figure 1. _: :_, !_....
._ ...
and 5 show that the curves representing a common Plan map are clustered. The main " ' -"effects are less important in explaining the length of forest edge, but the zonation ofharvest activity (MAP) explained 43-54% of the variance, while harvest intensityexplained only 1-27% and DECADE explained 13-29%. The curves fn Figures 4 and _5 are not clustered as much by Plan map, but the use of group selection in the 1991
f
Plan consistently increased the amount of forest edge. ,.
3.3. STAND AGE CLASS DISTRIBUTIONS.
e
Simulation of the 1985Plan resulted in an even distribution of young age classes (Figure • ,_6) related to the rotation lengths specified in the Plan. Approximately two-thirds of the
timber base was to be managed with a rotation length of 80 years, and the remainder .. _,was to.be managed with a rotation length of 120 years (Table 2). In the MAs managedfor timber, most stands were harvested at rotation age which, over time, caused a
dramatic drop in the abundance of mid-age classes. A significant number of very old .stands resulted in areas where timber harvesting was restricted. It should be noted herethat we maintained a static management strategy throughout our simulations, while __/ /'National Forest managers are required by law to review their management plans every _10 years. Our results show that static management would in fact produce striking .consequences for age class distribution. The 1991 Plan showed a great reduction ineven-aged stands, and a preponderance of uneven-aged and old-growth stands (Figure7). Recallthat our simulations did not consider single-tree selection, and a few of theseOlder stands may in fact have undergone multiple single-tree selection treatments. _ .
• ' However, most of these stands are in areas set aside from any timber harvest, and thesewould be true old-growth stands.
4. Discussion
HARVEST is a versatile model to simulate timber harvest management alternatives,when 'combined with the user interface of the ERDAS GIS system. Using HARVEST,we simulated two published management alternatives for the HNF and three variantsto assess how those plans might be expected to impact forest interior habitat and forest
• • O

6
[ __l....i _....._Ii,. ,, .
E. J. Gustafson and T. R. Crow 87
l ! I I
" 0 1 2 3km
a- '_i";'_ _ 7 i,',_,_._--__'___
m_
• .. ": :.>
• ,,
,_".e' .k_:¢<
_'.
• -7,; _ " "_
/
•"_.-, _ . ,_.. "_. ,_ "/
• _
• ._. ,
N
Figure 31 Maps of.forest interior habitat (forest >210m from an edge) during decades 13, 14, and 15 (a, b,
and ¢, respectively) of simulation of the 1985 Plan on the TELL study area, demonstrating the shiftingmosaic nature of interior habitat through time. I-1= non-forest; _ = edge; _ = interior.
[ i "

-- "_ ...... J__....... I .... ;-- . _ [_JlJl.J
'\ .
88 Simulating forest managementstrategies
2600" PRUN 1 __. "-_ .......... _,
2400
2200
9.000 Ii,-IY •
"X1800 _ ,
_dliL.. 1600 ,, '_7 :/_
1400
2800LRIV_
2600
2400 I
2200 - 'rd_ , *
t,,,4 :P . .
1800 ' ' J :'_!':_ _:_" "4000 ___:: '"....
TELL " : ":_:...., ,-,_:_,_:?_,:_.5_._".-.,
o
3000
e
2000 .. . liP,1940 1980 2020 2060 2100 2140
Year
Figure 4. Changes in the amount of linear forest edge over time resulting from simulation of management ' /_strategies at 30m resolution. Simulations began at year 1988. PRUN, LRIV, and TELL are study areas.
Symbols as for Figure 1. - _ /J
edge over time, and to evaluate the relative effects of timber harvest intensity andzonation of timber harvest on forest spatial pattern.
" Projections of landscape structure and commodity outputs using the 1985 Plan and•the 1991 amended Plan as the rule-bases for the model suggest that the nearly 60%reduction in timber production under the 1991 Plan would not improve the spatialcomponents of habitat for interior-forest species as much as might be expected. Only.small reductions in forest edge and relatively small increases in forest interior occurred-during the 150-year simulation, due to the change in management approach of the1991 Plan. Widely distributed small harvest units, with their large perimeter-to-arearatios, result in large amounts of forest edge even when it is assumed that edges areephemeral. Using the HARVEST model, Gustafson and Crow (1994) found that theamount Of forest edge increased dramatically and amount of forest interior decreased.dramatically when the size of the cutting edge unit was reduced to 10ha or less. This
• , _, . w, ,
"" "_ _ " _ '" T .
• _ ' _ " l '
..... ..... :i ii:

E. J. Gustafson and T. R. Crow 89 \
1-8000° .
•170001500016000/, , ", z. -, -, -i -, , , I , , , H14000 :ii_i::i_:::_ "_ e
1980 2020 2060 2100 2140 _.
Year .. -. •.... : v
Figure 5. Changes in the amount of linear forest edge over time resulting from simulation of management _:_:,(_. _;;_.
strategies across the entire HNF at J 00 m resolution. Symbols as for Figure 1....... _:_i.i_:_"' .r ,
TABLE3. Analysis of variance comparing the effect of harvest intensity (INTENSITY), the ,......._.;_::_;::7 . .zonation, of harvest activity by management area boundaries (MAP), and the time period . -:_:-.............'_:"_:_"_",:._ '"simulated (DECADE) on the area of forest interior and linear forest edge maintained on the _- _'_ .landscape. Analysis included three replicates of simulations conducted on the entire HNF at -;_{_ i_}i " "
" 100m resolution for 15 decades •:ii....... _-,,...... •
Forest interior (ha) Forest edge (km) , _,?_.
Source df SS, F Prob>F R 2 SS F Prob>F R 2 _._:,.<_;,_: ......
MAP 1 1.269E+10 99999.9 0"0001 4.740E+09 2033.4 0"001 --INTENSITY 1 .7.404E+07 723.5 0.001 1.044E +08 44.8 0-0001 -.DECADE . 14 2.254E+08 157.3 0"0001 2.131E+09 65"3 0.0001 _ *Error 163 1.668E + 07 _ 3.800E + 08 _ _ , "Total 179 1.300E+.10 _ 0.99 7.356E+09 _ 0.95 ,,
trend held even with significant reductions in total harvested area and clustering of _ /cutting units. - ¢
Consolidation of management activities appears to have a more important effect '_:• ,
on spatial pattern than changes in intensity of harvest. Forest interior is especially
sensitive .to the management area boundaries (identified as MAP in Tables 3 and 4).This,ltrendis confirmed by Figures 1 and 2, where projections of forest interior area
• ' are Clustered by Common management area boundaries (MAP). Much of the gain inforest interior related to the 1991 Plan resulted from withdrawing lands from timber _ .production. Very 1Rtle interior forest remained or was created in production areaswhere harveSting Occurred under either plan. The similarity in forest interior over time -Ybetween the. 1991 Plan and the 91 Map-85 Intensity scenario indicates that high intensity
• timber production can be sustained and yet maintain levels of forest interior similar to
that of a lower intensity, group-selection strategy if timber production is concentrated . •in only a part. of the landscape. Comparing the effects of harvest intensity and zonationof harvest intensity activity by management area boundaries also showed zonation tobe more important than harvest intensity in terms of linear forest edge maintained on
the landscape, but not to the same extent as forest interior. The increase in edge
.' ,. , ¢, .

90 Simulating forest management strategies
TABLE4. Analysis of variance comparing the effects of harvest intensity (INTENSITY), thezonation of harvest activity by management area boundaries (MAP), and the time periodsimulated (DECADE) on the area of forest interior and linear forest edge maintained on the
landscape. Analysis included three replicates of simulations conducted on the three study areaswithin the HNF at 30 m resolution for-15 decades
Forest interior (ha) Forest edge (km) /
sourc ss ss .....(a) LRIV 29956027 1918-3 0.0001 850 529.6 957.8 0.0001 _ :: _:_:_i ,MAP 1 ' ,.INTENSITy 1 876 897 56.2 0.0001 531 448.5 598.5 0-0001 _ • "DECADE 14 11002 428 50.4 0-0001 438 687.8 35.3 0.0001 _ i_i
• • . ,.,--: _,Error 163 2 543 696 _ _ 144739-9 _ _ i_ _ i _:Total 179 44 359 048 ---- 0-94 1 965 405.7 _ 0.93 ii:_,i!_.ii_+_:
(b) PPxUN 180600901 7702"8 0"0001 _ 3583 623"9 1365"3 0"0001 _ ._:::_ _: "MAP 1 _,"'INTENSITY 1 2 118528 90-4 0.0001 1 614 153.9 615-0 0.0001 _' __ :?;DECADE 14 14621 016 44.5 0-0001 1 137 397"8 31-0 0"0001 _ _+_:::::_:_:_:_," :" "Error 163 3 821 701 _ _ 427 852-5 _ _ _,,., ,Total .179 201 162 145 -- -- 0-98 6 763 028.2 -- 0.94 - _ i_
.... _!?_ _(e) TELL 176 380 778 4441"0 0"0001 _ 5 200 194"8 1242:6 0-0001 f_!
INTENSITY 1 1 363 464 34-3 0"0001 _ 2 467 538-3 589"6 0"0001DECADE 14 6840519 12"3 0-0001 _ 1254361"2 21"4 0"0001 '_Error 163 6473 799 683 132.8 _ ...._ :_.....Total " 179 191 105 560 _ 0.97 9 604 227.1 -- 0.93
t,
.
• \ ,: .-_-"
produced by group selection under the 1991 Plan appears to have offset the reducedarea where harvesting occurred.
If minimizing forest fragmentation across the entire forest is a goal, these results • /,,,I"
suggest that the most effective approach to reaching this goal is to establish areas of __ ./"undisturbed forest with continuous canopy adjacent to forests with relatively high jharvest intensity, rather than simply reducing cutting intensity across the entire forest. • .
•The 85 Map--91 Intensity scenario illustrates the effect on the area of forest interior of
a reduction in cutting intensity across a large area, and it differs little from the high-. intensity 1985 Plan scenario (Figures 1 and 2). For the Lake States region, Solheim et
al. (1987) advocate establishing large, contiguous blocks of undisturbed forest (i.e. no. harvest) to minimize edge effects and to protect sensitive species. Our results do not " "
address the question of how large such blocks should be, but do suggest that protectingblocks from harvesting is the most effective means for increasing forest interior anddecreasing forest edge even when more intensive harvesting results on lands outsidethe protected area. Indeed, various management strategies on different parts of theland base are required to meet the needs of species with disparate life histories andhabitat requirements (Freemark and Merriam, 1986; Hansen et al., 1993). HARVEST
could be used to evaluate alternative management area boundaries and harvest strategiesover long time periods to optimize the allocation and temporal rotation of multipleuses on public lands.
• , o.

41
E. J. Gustafson and I'. R. Crow 91 _ '\ "
3000 0 Years
2000IIi.1000 Ii _ .__0 IIIIIIIIIIIIIIIIIIIIIiill
3°°°t. |2000 ..
1000 .....
00
_ 120 Years _ 150 Years ::_,::__._,,/,_,:_v_ .
2000 . ¢:_:_:'_!ii_:..... -, .
-_. .
0 "
3000 180 Years .._ _ . .,2000 _:_
• : _ _. ,.,
e,l
Stand age classes (years) . ,
i "
• Figure.6. Changes in stand age.class distribution during simulation of 210 years of implementation of the1985 Plan on the Tell City Unit of the Hoosier National Forest. The distributions on the other study areas _,
were similar, and are not shown. _ ' "
///.
The three study areas provided different initial conditions related to past man- _,_ /agement history. The study areas differed in stand age-class distribution and in the _:temporal trends in amounts of forest edge and forest interior before the 1988 baseline _year. In spite of these differences, the resulting measures of forest spatial patternproduced over time by the simulations were similar for all three areas. Small errorterms were associated with estimates of total edge and total forest interior among thethree replicates run for each study area. Low variability in these parameters does not _ .suggest Staticconditions. The simulated landscapes were indeed dynamic, with shiftingmosaics, as seen in Figure 3.
Variance also serves as a source of error propagation that may be serious if thevariance is large, and multiple time steps are run (Gardner et al., 1990). The lowvariability .associated with our simulations produced robust results with relatively few(N= 3) replicates. Scale is also an important determinant of predictability (Costanzaand Maxwell, :1994). Possible effects of resolution on predictability can be analyzed bycomparing the simulations for the three study areas (30m resolution) with thoseconducted at 100m resolution for the entire Hoosier National Forest. For all three
,-. .. ,

92 Simulating forest managementstrategies '\, "
3000
- • 2000
1000
0
3[000 60 Years /
2000 _- . I Li'!i_:_ ___!_ _
1000 ' ,. , ,
" 0" Illlll In__ ., _ ; " ,I I I I_l I-I I I I I I I I I I I I I I I I I I I I I • ,C_
.3000 ,:_:::;:::_._,=
1060 _::'_':' "__""_'_
_ ..... I
10 000 180 Years ............. -2_ :_': _ _7_• . ,
o nmm,,m F. ............. Innl/I UI I I,I UI I I I I I I I I I I I I I I I I I I I I I I I I UI I I I I I I I I I UI I I I UI I I I I
Stand age classes (years) " ...
Figure 7. Changes in stand age class distribution during simulation of 210 years of implementation of the1991 Plan on the Tell City study area of the HNF. Note the change in scaling of the y-axis for years 180 .l_,• \ ._ .
and 210. The distributions on the other study areas were similar and are not shown. .....
parameters (total forest interior, mean interior patch size and total linear edge), the _: /model indicated that rates of change with time were higher at the coarser resolution.Differences in rates of change were due to differences in measurable edge because oflarger cells at the 100m resolution, and the fact that smaller openings could not be
• , detectedl The general trends, however, were similar between the two resolutions,. suggesting that these trends are scale invariant. .
As with all models, simplifying assumptions were made in the simulations that _ ,• affected the outcome. In this case, holding the treatments constant over a long period
created extremely skewed age class structures (Figures 6 and 7). Although managementalways involves adjustments, the extreme cases presented here provide useful com-iparis.0ns. Another simplifying assumption, that of holding private lands in a constantstate of canopy coverage throughout the simulation, probably reduced fragmentation ..at the landscape level. Studies involving broader questions of context and interactionbetween adjacent public and private lands have been conducted or are underway (e.g.Gustafson and Crow, 1994). Disturbances other than harvesting were not included inour-simulations to avoid confounding our analysis with the effects of management

,i
_.,....L_t_....• \ , ,
E. J. Gustafson and T. R. Crow 93 • ",_ •. .
alternatives. The stochastic allocation of stands is a simplistic representation of acomplex decision-making process. Based on our analysis of past allocations (Table 1),lit is reasonable to expect that the spatial patterns produced by our simulations providereliable general principles about the effect of these management alternatives on forestspatial pattern through time.
In the case study presented here, substituting uneven-age management in the formof group selection for even-age management and reducing harvest levels produces both
economic as welt as ecological consequences. Yet the substantial reductions in harvest -!___levels do not necessarily result in substantial increases in forest interior or substantialdecreases in forest edge. Furthermore, oak-hickory forests may be difficult to maintain ._;i;!i'i__'_' '!_'_iI:_:i_ _ ,
withoUt clearcutting (Johnson, 1993). Public land managers must also consider many .... - "other ecological concerns as well, such as water quality, disturbance-dependent com- : '
munities, backcountry recreational opportunities and invasion of exotics. It is the ;_! ....!_.i_'balancing of.various ecological and ec6nomic values that is the challenge to public : _.- ¢ 4
land managers. If the public limits management options in the HNF, this social ; ....... . .(and thus polhical) consideration may override the ecological and economic factors. _. "" ,"HARVEST provides a tool to link policy (planning) with changes in landscape char- "
acteristics (structure), commodity prodt_tion, and other potential benefits and values __that are spatially dependent. Such a tool may enable managers to better understand "
management consequences and to defend their decisions to the public and other ?._ ,professionals. " i_!_ _!_::i.... -
We thank Monica Schwalbach, Ellen Jacquart, Libby Rice, Mary Stafford, Tom Thake and e:_,,?_i_;:,Steve Olson of the Hoosier National Forest for their assistance in providing data. Thanks alsoto Janet Eger for producing a stand age map of the Martin State Forest and to Kyle Forbes for ':_ '_ _digitizing stand maps. Thanks to Ellen Jacquart, Regis Terney, Cid Morgan, Louis Iverson andLucy Burde for their critical comments on earlier drafts of the manuscript, o
....
References ., . a,
Andren,H. andAngelstam,P.(1988).Elevatedpredationratesasan edgeeffectinhabitat islands:experimentalevidence.Ecology69, 544-547.
Baker,.W_L. (1992).Effectsof settlementand firesuppressionon landscapestructure.Ecology73, 1879-1887. ., /Constanza, R. and Maxwell,T. (1994).Resolutionand predictability:an approach to the scalingproblem. . /
LandscapeEcology9, 47-57. __4 "Crow,T. (I991). Landscapeecology:the big pictureapproach to resourcemanagement.In Challengesin the _i
Conservationof BiologicalResources,a Practitioner'sGuide(D. J. Decker, M. E. Krasny, G. R. Goff, _,C. R.Smith and D. W. Gross, eds), pp. 55-65. Boulder,CO:WestviewPress.
Davis,J. C. (1986).Statisticsand DataAnalysisin Geology,pp. 308-312.NewYork: John Wileyand Sons.DellaSalla,' D. A. and Rabe, D. L. (1987). Response of least flycatchersEmpidonaxminimus to forest
disturbances.BiologicalConservation41, 291-299." Franklin, J. F. and Forman, R. T. T. (1987).Creating landscape patterns by forest cutting: ecological
consequencesand principles.LandscapeEcology1, 5-18..Freemark,K. E. and Merriam,H. G. (1986).Importanceofarea andhabitat heterogeneityto birdassemblages
in temperateforest,fragments.BiologicalConservation36, 115-141.Gardner,R. H., Dale,V.H. and O'Neill,R. V.(1990).Errorpropagationanduncertaintyinprocessmodeling.
In ProcessModelingof Forest GrowthResponsesto EnvironmentalStress (R. K. Dixon, R. S. Meldahl,G. A. Ruai'kand W. G. Warren,eds),pp. 208-219.Portland, Oregon:Timber Press.
Gustafson, E. J.'and Crow, T. R. (1994).Modeling the effectsof forest harvestingon landscapestructureand the spatial distribution of cowbird brood parasitism.LandscapeEcology9, 237-248.
Hansen, A. J., Garman, S. L., Marks, B. and Urban, D. L. (1993).An approach for managingvertebratediyersityacross multiple-uselandscapes.EcologicalApplications3, 481-496.
Hemstrom,M. and Cisse!,J. (1991).Evaluatingalternativelandscapepatterns over time--an examplefromthe WillametteNational Forest in Oregon. In Proceedingsof the 1991Society of AmericanForestersNationalConvention,SAFPublication91-05,pp. 231-235 Bethesda,MD: Societyof AmericanForesters.

94 Simulating forest management strategies
Johnson, E S, (1993). Perspectives on the ecology and silviculture of oak-dominated forests in central andeastern states. USDA Forest Service, General Technical Report NC-153, pp. 1-28. St. Paul, MN: NorthCentral Forest Experimental Station. V
Li, H., Franklin, J. F., Swanson, F. J. and Spies, T. A. (1992). Developing alternative forest cutting patterns:a simulation _approach. Landscape Ecology 8, 63-75.
McGarigal, K. and Marks, B. J. (1993). FRAGSTATS: spatial pattern analysis program for quantifyinglandscape structure. Unpublished software. Corvallis, OR, U.S.A. Department of Forest Science, OregonState University.
Mladen0ff, D. J., White, M. A., Pastor, J. and Crow, T. R. (1993). Comparing spatial pattern in unaltered Illold-growth and disturbed forest landscapes. Ecological Applications 3, 294-306.
1
Ripple, W.J., Bradshaw, G. A. and Spies, T. A. (1991). Measuring forest landscape patterns in the CascadeRange of Oregon, USA. Biological Conservation 57, 73-88.
Sotheim, S. L., Alverson, W. S. and Waller, D. M. (1987). Maintaining biotic diversity in National Forests: "_:._!__-the necessity for large blocks of mature forests. Endangered Species: Technical Bulletin Report 4, 1-3. iI.... .-_, ........ , •
Ann Ar.bor, MI: The School of Natural Resources, University of Michigan. •.........Thompson, F. R. iII. (1993). Simulated responses of a forest-interior bird population to forest management ' '
options in central hardwood forests of the United States. Conservation Biology 7, 325-335. _":_:._/._.LI_)!_,II_._,,USDA Forest Service. (1985a). Final Environmental Impact Statement, Land and Resource Management Plan, _'ii:_ _-i_:_.;L_;:
Hoosier National Forest, pp. 1.1-1-4. Bedford, IN: USDA Forest Service, Eastern Region, Hoosier " ,_::"":_:_ :. , . "
National Forest. : !_!_!,,,_:_:;__:_:.__:....USDA Forest Service. (1985b). Land and Resource Management Plan, Hoosier National Forest, pp. 1-243. :_:_!_!::)_::_, _, • .,
Bedford, IN: USDA Forest Service, Eastern Region, Hoosier National Forest. [ !_',,::i_.i_i_'.... "I_ISDA Forest Service. (1991). Plan Amendment, Land and Resource Management Plan, Hoosier National
Forest, pp. 1-220. Bedford, IN: USDA Forest Service, Eastern Region, Hoosier National Forest .... [ __, "
r
. t,
°
//
' . ,,,
i
• .