simulating microbial electrolysis for renewable …
TRANSCRIPT

University of Tennessee, Knoxville University of Tennessee, Knoxville
TRACE: Tennessee Research and Creative TRACE: Tennessee Research and Creative
Exchange Exchange
Masters Theses Graduate School
8-2017
SIMULATING MICROBIAL ELECTROLYSIS FOR RENEWABLE SIMULATING MICROBIAL ELECTROLYSIS FOR RENEWABLE
HYDROGEN PRODUCTION INTEGRATED WITH SEPARATION IN HYDROGEN PRODUCTION INTEGRATED WITH SEPARATION IN
BIOREFINERY BIOREFINERY
Christian James Wilson University of Tennessee, Knoxville, [email protected]
Follow this and additional works at: https://trace.tennessee.edu/utk_gradthes
Part of the Biochemical and Biomolecular Engineering Commons, Catalysis and Reaction Engineering
Commons, Membrane Science Commons, and the Process Control and Systems Commons
Recommended Citation Recommended Citation Wilson, Christian James, "SIMULATING MICROBIAL ELECTROLYSIS FOR RENEWABLE HYDROGEN PRODUCTION INTEGRATED WITH SEPARATION IN BIOREFINERY. " Master's Thesis, University of Tennessee, 2017. https://trace.tennessee.edu/utk_gradthes/4914
This Thesis is brought to you for free and open access by the Graduate School at TRACE: Tennessee Research and Creative Exchange. It has been accepted for inclusion in Masters Theses by an authorized administrator of TRACE: Tennessee Research and Creative Exchange. For more information, please contact [email protected].

To the Graduate Council:
I am submitting herewith a thesis written by Christian James Wilson entitled "SIMULATING
MICROBIAL ELECTROLYSIS FOR RENEWABLE HYDROGEN PRODUCTION INTEGRATED WITH
SEPARATION IN BIOREFINERY." I have examined the final electronic copy of this thesis for form
and content and recommend that it be accepted in partial fulfillment of the requirements for the
degree of Master of Science, with a major in Chemical Engineering.
Abhijeet Borole, Major Professor
We have read this thesis and recommend its acceptance:
Robert M. Counce, Sankar V. Raghavan, Paul D. Frymier
Accepted for the Council:
Dixie L. Thompson
Vice Provost and Dean of the Graduate School
(Original signatures are on file with official student records.)

SIMULATING MICROBIAL ELECTROLYSIS FOR
RENEWABLE HYDROGEN PRODUCTION INTEGRATED
WITH SEPARATION IN BIOREFINERY
A Thesis Presented for the
Master of Science
Degree
The University of Tennessee, Knoxville
Christian James Wilson
August 2017

ii
ACKNOWLEDGEMENTS
I would like to thank my advisor Dr. Abhijeet Borole for giving me an abundance of
guidance and support during this endeavor. I appreciate the relationship that we have built over
the last two years and wish him further success throughout his career. I would also like to thank
Dr. Paul Frymier for telling me about Dr. Borole during my sophomore year of undergrad after
class and putting me in contact with him all of these years later for graduate school. I would like
to thank Dr. Sankar Raghavan for the opportunity of being his teaching assistant my first year of
graduate school and his help with Aspen software. I would also like to thank Dr. Peter Counce for
introducing me to the extensive use of Aspen simulation software as an undergraduate.
I thank Dr. Thomas Zawodzinski for giving me the opportunity to work in his lab as an
undergraduate and opening me up to the world of scientific research. I thank Dr. Douglas Aaron
for his friendship and constant support an over the years and introducing me to microbial fuel cells.
I thank Dr. Gabriel Goenaga for the many opportunities he has given me and his friendship. I
would also like to thank Dr. Alex Lewis for helping me better understand microbial electrolysis
cells.
I would like to thank my girlfriend Mary McBride for her flood of support and
encouragement every single day and wish her great success in medical school. Finally, I would
like to thank my parents for everything they did for me over the years. I know if they were here
today they would be proud.

iii
ABSTRACT
Biomass conversion to hydrocarbon fuels requires significant amounts of hydrogen. Fossil
resources typically supply hydrogen via steam reforming. A new technology called microbial
electrolysis cells (MECs) has emerged which can generate hydrogen from organic sources and
biomass. The thermochemical route to fuels via pyrolysis generates bio-oil aqueous phase (BOAP)
which can be used to make hydrogen. A process engineering and economic analysis of this
technology was conducted for application in biorefineries of the future. Steam methane reforming,
bio-oil separation and microbial electrolysis unit operations were simulated in Aspen Plus to derive
the mass and energy balance for conversion of biomass. A process scheme using MEC to generate
hydrogen, while minimizing use of natural gas was developed. A process design developed by
Pacific Northwest National Laboratory was used as baseline biorefinery flowsheet. The results
show that hydrogen production at a rate of 1,723 lb/hr can be derived using 19.5 % of the bio-oil
as the substrate BOAP, while eliminating the need for natural gas. A two-step quench system
allows separation of an aqueous stream containing about 23,000 lb/hr of organic substrate,
sufficient for hydrogen generation, besides that generated from off-gas, so as to meet the total
biorefinery hydrogen needs. The techno-economic analysis (TEA) showed that hydrogen can be
generated for a minimum hydrogen selling price of $ 3.35/kg-H₂. The results of this study show
that hydrogen can be practically derived from an aqueous soluble bio-oil stream, while majority
of the bio-oil is used for hydrocarbon production, using a wholly biomass-sourced hydrogen. This
alternative has potential to reduce greenhouse gas emissions from the biorefinery.

iv
TABLE OF CONTENTS
CHAPTER 1: INTRODUCTION ..........................................................................................1
1.1 Problem Statement .....................................................................................................1
1.2 Overview ....................................................................................................................2
1.3 Baseline Biorefinery Process .....................................................................................3
1.4 Baseline Biorefinery Process and Integration ............................................................5
1.5 Steam Reforming .......................................................................................................7
1.6 Microbial Electrolysis ................................................................................................8
1.6.1 Concept of MEC ...............................................................................................8
1.6.2 Current status of technology .............................................................................10
1.6.3 Literature Review of MEC Process and Economic Analysis ...........................13
1.7 Bio-oil Separation ......................................................................................................14
CHAPTER 2: NATURAL GAS REFORMING....................................................................18
2.1 Process Design ...........................................................................................................18
2.1.1 Natural Gas Reforming - Overview ..................................................................18
2.1.2 Natural Gas Reforming - Detailed Description ................................................19
2.1.3 Off-Gas Reforming ...........................................................................................25
2.2 Results ........................................................................................................................25
2.2.1 Comparison of SMR Simulation Results with PNNL ......................................25
2.2.2 Natural Gas and Off-Gas Steam Reforming Results ........................................28
2.3 Differences in Design Compared to PNNL Process ..................................................31

v
CHAPTER 3: MICROBIAL ELECTROLYSIS ....................................................................35
3.1 Biorefinery Feed to MEC...........................................................................................35
3.2 The Hydrogen Need of the Biorefinery .....................................................................37
3.3 MEC Conversion Model ............................................................................................37
3.3.1 Effect of Feedstock Composition on Hydrogen Production .............................38
3.3.2 Effect of Efficiency on Hydrogen Production ..................................................39
3.4 Techno-Economic Analysis Model............................................................................40
3.4.1 Electrochemical Control System.......................................................................42
3.4.2 MEC Operation and Performance Specification...............................................42
3.4.3 Biorefinery Process Analysis ............................................................................44
3.5 Results and Discussion ..............................................................................................46
3.5.1 Mass Balance for Hydrogen Production ...........................................................47
3.5.2 MEC Process Cost Estimation ..........................................................................49
3.5.3 Minimum Hydrogen Selling Price ....................................................................50
CHAPTER 4: BIO-SEPARATION .......................................................................................52
4.1 Pyrolysis Oil Vapor Quenching Process ....................................................................52
4.2 MEC Aspen Model Process Design ...........................................................................54
4.3 Quench-MEC System Results....................................................................................55
4.4 Stage Fractionation ....................................................................................................56
4.4.1 Pollard Process Design .....................................................................................56
4.4.2 Stage Fractionation Simulation .........................................................................58

vi
4.5 Comparison of Separation Results with ISU Process ................................................60
CHAPTER 5: INTEGRATION OF STEAM REFORMING OF HYDROCARBON GASES
WITH BIO-OIL SEPARATION AND MEC ........................................................................64
5.1 Bio-oil Separation and Steam Reforming ..................................................................64
5.2 Process Design Change Implications and Results .....................................................65
CHAPTER 6: CONCLUSIONS AND RECOMMENDATIONS .........................................67
6.1 Conclusions ................................................................................................................67
6.2 Recommendations ......................................................................................................68
REFERENCES ......................................................................................................................69
APPENDIX ............................................................................................................................70
VITA ......................................................................................................................................92

vii
LIST OF TABLES
Table 2.1. Gases converted via combustion and conversion reactions for catalyzing
reformer................................................................................................................23
Table 2.2. Comparison of reactant and product ratios ...........................................................27
Table 2.3. Combustion exhaust heat exchangers: Temperature changes with
natural gas ............................................................................................................29
Table 2.4. Combustion Exhaust Heat Exchangers: Temperature Changes
Minimized Natural Gas ........................................................................................29
Table 2.5. Stream 662 (Reformer Feed) mass fraction composition natural gas and
off-gas ..................................................................................................................30
Table 2.6. Steam reformer exit stream results .......................................................................30
Table 3.1. MEC operating and performance parameters .......................................................44
Table 3.2. BOAP hydrogen production rates .........................................................................46
Table 3.3. Capital investment costs for MEC system for the baseline case ..........................50
Table 4.1. Flash temperature variation ..................................................................................62
Table 4.2. Stage fraction bio-oil distribution comparison .....................................................63
Table A1. Hydrogen Productivity Calculations .....................................................................91

viii
LIST OF FIGURES
Figure 1.1. Techno-economic analysis approach ...................................................................3
Figure 1.2. Simplified flow diagram of overall biorefinery process ......................................4
Figure 1.3. Block diagram of baseline biorefinery process described in PNNL report .........5
Figure 1.4. Simple process flow diagram of separation + MEC process integration ............6
Figure 1.5. A schematic of a generic microbial electrolysis cell ...........................................9
Figure 1.6. Schematic of ion and mass transfer across (a) cation and (b) anion exchange
membrane ...........................................................................................................10
Figure 1.7. PNNL report bio-oil recovery system .................................................................15
Figure 1.8. Bio-oil stage fractionation process flow diagram ................................................16
Figure 2.1. Simple block diagram of the hydrogen production system .................................19
Figure 2.2. Process flow diagram of combustion reactor feeds .............................................20
Figure 2.3. Process flow diagram of combustion exhaust heat recovery ...............................22
Figure 2.4. Process flow diagram of heat recovery from reformer ........................................24
Figure 2.5. Full hydrogen production process flow diagram from PNNL-23053 .................33
Figure 3.1. Model compounds representing bio-oil ...............................................................36
Figure 3.2. Process flow diagram for hydrogen production from biorefinery stream using
microbial electrolysis .........................................................................................41
Figure 3.3. Detailed flow sheet of the hydrogen production system integrated with the
quench columns ..................................................................................................48
Figure 3.4. Sensitivity analysis for minimum hydrogen selling price ...................................51
Figure 4.1. Simple block diagram of pyrolysis oil vapor quenching process ........................52
Figure 4.2. Simple process flow diagram of pyrolysis oil vapor quenching .........................53
Figure 4.3. Simple process flow diagram of MEC Aspen model ..........................................54
Figure 4.4. Bio-oil stage fractionation process flow diagram ................................................56
Figure 4.5. Bio-oil stage fractionation simulation process flow diagram ..............................59
Figure 4.6. Hu biomass conversion system ...........................................................................61
Figure 4.7. Hu bio-oil fractionation system ...........................................................................61
Figure 5.1. Simple diagram of the relationship between bio-oil separation, SMR, and
hydrotreating processes ......................................................................................64

ix
Figure 5.2 Simple diagram of the relationship between bio-oil separation, MEC, steam
reforming, and hydrotreating processes .............................................................65
Figure A1. Mass and Energy Balance: Hydrogen Production via Steam Reforming w/
Natural Gas .........................................................................................................75
Figure A2. Mass and Energy Balance: Hydrogen Production via Steam Reforming
Minimized Natural Gas ......................................................................................81
Figure A3: Mass and Energy Balance: Pyrolysis Oil Vapor Quenching and MEC ..............87

x
LIST OF ABBREVIATIONS
AEM Anion exchange membrane
BOAP Bio-oil aqueous phase
CCE Cathode conversion efficiency
CE Coulombic efficiency
CEM Cation exchange membrane
COD Chemical oxygen demand
GGE Gasoline gallon equivalent
GHG Greenhouse gas
HER Hydrogen evolution reaction
HRT Hydraulic retention time
INL Idaho National Laboratory
MACRS Modified accelerated cost recovery
MEC Microbial electrolysis cell
MFC Microbial fuel cell
MFSP Minimum fuel selling price
MHSP Minimum hydrogen selling price
MMscfd Millions of standard cubic feet per
day
NCG Non-condensable gas
NREL National Renewable Energy
Laboratory
OLR Organic loading rate
PNNL Pacific Northwest National
Laboratory
PSA Pressure swing adsorption
SF Stage fractionation
SMR Steam methane reforming
System
1
CHAPTER 1
INTRODUCTION
1.1 Problem Statement
Dependence on fossil fuels coupled with high CO2 emissions and their effect on global climate
change have become the impelling causes for the research and development of sustainable
alternative energy sources over the last few decades. Biomass has proven to be such a source for
alternative energy as it can be converted to a wide variety of useful products. However, to meet
the fuel demands of today’s economy, biomass must be processed at an industrial scale by the
means of a biorefinery. Biorefinery consists of multiple conversion processes that convert biomass
into a range of fuels and products. The goal of the biorefinery is to generate these products in an
economic way and this represents a big challenge requiring significant level of innovation. Many
facets of biorefinery can and have been developed to achieve this goal efficiently and effectively.
A key intermediate step within this overall process is hydrogen production, which is necessary for
biomass deoxygenation. Producing hydrocarbon fuel from biomass containing about 40 wt. %
oxygen requires a lot of hydrogen. Traditionally, this hydrogen comes from natural gas.
Environmental incentive to minimize the use of such non-renewable resources for fuel production
relate back to the overall goal of the biorefinery. Efforts to improve energy efficiency, decrease
operating and capital costs and greenhouse gas (GHG) emissions within the biorefinery scheme is
necessary to achieve goals related to climate change. Integrating a baseline biorefinery process
with a modern biotechnological apparatus called a microbial electrolysis cell (MEC) to source the
hydrogen and reduce environmental impact was the goal of this study. A techno-economic
analysis was conducted using Aspen simulation software for key operations within the biorefinery
2
and a baseline mass and energy balance for the newly developed MEC technology was conducted
to evaluate the impact of including MEC in the biorefinery design.
1.2 Overview
Pacific Northwest National Laboratory (PNNL) has conducted a study to simulate the
biorefinery process for production of biofuels from biomass via fast pyrolysis pathway. A report
based on this study provides the process conditions, mass balance and economic analysis for
production of gasoline and diesel fuel at a competitive price based on minimum fuel selling price
(MFSP) estimation (Jones et al., 2013). While the report was detailed, it lacked information on
the energy balance of the system. The primary goal of this work was to generate energy in the
form of hydrogen using waste resources available in the biorefinery. Thus, having an energy
balance in addition to mass balance was necessary. Therefore, a mass and energy analysis of the
unit operations relevant to hydrogen production was conducted. Following this, changes to the
baseline biorefinery process were conducted to allow integration of the MEC into the biorefinery.
While natural gas is the fuel source for hydrogen production in biorefinery, a water-soluble organic
substrate is the fuel source for hydrogen production in a MEC. Through the decomposition of
biomass via fast pyrolysis, an organic bio-oil and an aqueous substrate rich in water-soluble
compounds suitable for hydrogen production can be derived from the product vapors using various
separation techniques.
MECs have been investigated for hydrogen production at various scales, however, their
practical implementation has not yet been established (Escapa et al, 2016). This is of particular
importance for fuel production within a biorefinery because steam reforming functions to produce
hydrogen gas for downstream bio-oil upgrading and hydrocracking. Typically, off-gases from the

3
overall biorefinery that are used to produce hydrogen through the steam reforming process are not
sufficient to meet the demands necessary for these downstream processes. Thus, a supplemental
source of hydrogen, such as natural gas is used to meet these demands. Here, an alternate process
to generate the hydrogen is investigated, which will allow minimization of the use of natural gas,
thereby minimizing greenhouse gas emissions. This study investigates the MEC technology from
a process engineering and economics perspective. Additionally, the process flow diagrams
generated to perform mass and energy balance and utility data generated in this study may help in
filling some of the gaps in the PNNL report. The design and cost analysis of the MEC process and
its implementation into a baseline biorefinery process are described in the following sections and
chapters of the thesis.
1.3 Baseline Biorefinery Process
The PNNL report contained a simulation of a large-scale biorefinery (including but not limited
to mass balances, costing data, unit operation data, and reaction mechanism information) (Jones et
al., 2013). The report was authored jointly by the Pacific Northwest National Laboratory (PNNL),
the National Renewable Energy Laboratory (NREL), and the Idaho National Laboratory (INL).
The approach used to develop a techno-economic model followed the system given in Figure 1.1.
Figure 1.1. Techno-economic analysis approach (Jones et al., 2013)

4
It begins with establishing feedstock composition, operating conditions, and conversion
yields; all of which are determined based on an extensive literature review and relevant
assumptions. This data is then evaluated using process model software, in this case specifically
Aspen Plus and CHEMCAD, where the material balance information is obtained. From there,
equipment costing and sizing is estimated based on the specific characteristics of each process and
is represented using Microsoft Excel. Finally, a minimum fuel selling price (MFSP) is established
using a discounted cash flow analysis. The simulated biorefinery itself is broken up into five main
sections: fast pyrolysis, hydrogen production, hydrodeoxygenation (hydrotreating),
hydrocracking, and product separation as shown in Figure 1.2.
Figure 1.2. Simplified flow diagram of overall biorefinery process (Jones et al., 2013)

5
In the first section, A100: Fast pyrolysis, a biomass feedstock enters, where it is dried out,
ground to the target particle size, converted to pyrolysis vapor, condensed to bio-oil and then sent
to a hydrotreating section, where it is upgraded. Non-condensable off-gas product from fast
pyrolysis is sent to the hydrogen production plant. In the section, A600, the off-gas along with
off-gas from hydrocracking and natural gas are used to produce hydrogen via catalytic steam
reforming. The bio-oil from fast pyrolysis is upgraded in two stages using fixed bed reactors and
sent to a hydrocracking section, A500. Here, the upgraded heavy fraction bio-oil is cracked to
produce additional fuel before final separation into gasoline and diesel product. The fuel is then
sent to a collection pool and shipped out.
1.4 Baseline Biorefinery Process and Integration
Figure 1.3. Block diagram of baseline biorefinery process described in PNNL report

6
The baseline biorefinery process described in the PNNL report is shown in the form of a
block diagram in Figure 1.3. One of the goals of the work described in this thesis is to generate
hydrogen from the acidic and polar organic compounds present in the bio-oil (using an MEC). The
water-soluble compounds are separated from the organic portion of the bio-oil via a separation
step, followed by the MEC to convert them to hydrogen. The separation can be carried out using
a quench system such as that described in the PNNL report or using a more extensive separation
scheme such as that described by Pollard et al., (Pollard et al., 2012). The latter is called stage
fractionation (SF), since it uses five stages. Integrating the separation and MEC unit operations
into the baseline biorefinery process requires an understanding of the upstream and downstream
processes and identification of suitable entry point. A simple process flow diagram of the
integrated separation+MEC process within the biorefinery process is shown in Figure 1.4.
Figure 1.4. Simple process flow diagram of separation + MEC process integration

7
Including the separation+MEC process into the baseline biorefinery process involves many
changes in the process flows and re-analysis of the mass and energy balance. A notable change in
process flow is the removal and replacement of bio-oil collecting unit operations (quench column
and filter). Notable downstream effects consist of the use of the hydrogen gas produced by the
MEC for hydrotreatment, and changes associated with the separation step into the biorefinery.
This process flowsheet thus minimizes use of natural gas in the biorefinery.
Determining the amount of hydrogen needed to be produced by the MEC to make up for
the amount generated from natural gas is a key part of this work. Thus, a challenge is to portion
off the minimum amount of water-soluble bio-oil to the MEC to meet this hydrogen production
target so that the remaining bio-oil can be sent to the hydrotreater. Based on this, the steam
reforming process and the hydrogen production process are designed. The following sections
outline the separation processes and the MEC and steam reforming processes, which are then
simulated to enable integration with the rest of the biorefinery in the subsequent chapters.
1.5 Steam Reforming
In a biorefinery, off-gases containing hydrocarbons are produced as by-products from
multiple unit operations including pyrolysis, hydrodeoxygenation and hydrocracking. These off-
gases are utilized in the section A600 for hydrogen production via steam reforming. Steam
reforming is a process of producing CO2 and H2 by reacting hydrocarbons and steam at high
temperatures. The steam reforming reaction seen below is reversible, and thus catalyst is typically
added to maximize H2 production.
𝐶𝑥𝐻𝑦 + 𝐻2𝑂 ⇌ CO + 𝐻2; H = 206 kJ/mol, for methane reforming (Equation 1.1)

8
This reaction is endothermic, so large amounts of heat have to be supplied for the reaction to
proceed. Off-gases portioned to this section of the biorefinery are not sufficient to meet the
hydrogen production demands throughout the rest of the plant, thus supplemental natural gas is
added. Due to methane being a key component for hydrogen production this process is commonly
referred to as steam methane reforming (SMR). This reaction is endothermic and thus requires an
external heating source that is usually provided by the combustion of additional methane and/or
using available energy from any separated exhaust streams via heat exchange, etc. (Simpson &
Lutz, 2007). Additionally, a water-gas shift reaction (CO + H2O ⇌ CO2 + H2) is usually coupled
with this process to further convert CO from the reforming reaction into hydrogen. Thus, these
two reactions within the baseline biorefinery serve as the source for hydrogen production for the
overall plant. Chapter 2 describes the SMR process in detail and describes how this process was
simulated using Aspen Plus.
1.6 Microbial Electrolysis
1.6.1 Concept of MEC
A MEC is an electrochemical cell, consisting of an anode containing a microbial consortium
or single species, a cathode, and a membrane separating the two electrodes. The two half reactions
at the anode and the cathode can be described as follows:
Anode: 𝐶𝑥𝐻𝑦𝑂𝑧 + 𝐻2𝑂 → 𝐶𝑂2 + 𝐻+ + 𝑒− (Equation 1.2a)
Cathode: 2𝐻+ + 2𝑒− → 𝐻2 (Equation 1.2b)

9
The cathode can use a biological or a chemical catalyst to produce hydrogen. A MEC requires
an applied voltage of 0.3 V or higher across the cell to produce hydrogen (Borole & Mielenz,
2011).
Figure 1.5. A schematic of a generic microbial electrolysis cell. (Borole & Mielenz, 2011)
A MEC is essentially an electrochemically assisted microbial production of hydrogen. This
concept was first introduced in 2005 (Liu, H. et al, 2005). Essentially, a MEC acts as a reaction
vessel for the electrohydrogenesis reaction, where the decomposition of organic matter takes place
using bacteria to produce electrons that are then combined with hydrogen ions to make the
hydrogen gas in the cathode (Logan et al., 2006).
The finer details of MEC design have been greatly researched over the past decade and have
been largely influenced by the standard microbial fuel cell (MFC) design (Kadier et al., 2016).
Unlike a MEC, a MFC’s main product is electricity rather than hydrogen. However, both cells
typically undergo a similar reaction at the anode mediated by microorganisms requiring a large

10
surface area electrode, which can be made up of carbon cloth, carbon paper, graphite felt, and other
simpler material (Ahn & Logan, 2013).
Membrane selection can vary based on experimental intent; however, charge transfer is
essential in both systems. In order to separate the anode and cathode electrochemically as well as
hydraulically, ion exchange membranes have been used (Figure 1.6). Either anion exchange
membrane (AEM) or cation exchange membrane (CEM) may be used to enable charge transfer
(Daud et al, 2015).
Figure 1.6. Schematic of ion and mass transfer across (a) cation and (b) anion exchange
membrane (Harnisch & Schröder, 2010)
1.6.2 Current Status of Technology
There have been many advancements in MEC technology over the last decade. Much work
has been done to determine the best suited cathode material and catalysts for hydrogen generation
(Kundu et al, 2013). It has been shown that combined together, these two components make up
roughly 47% of the total capital costs for MECs, thus they have become a target for reducing
overall costs for the system (Rozendal et al, 2008). Platinum (Pt) is a commonly used catalyst in

11
electrochemical systems and has shown low overpotential when accompanied with a buffer for
hydrogen evolution reactions (HER) as seen below (Jeremiasse, 2009).
2𝐻+ + 2𝑒− → 𝐻2 (Equation 1.2a)
2𝐻2𝑂 + 2𝑒− → 𝐻2 + 2𝑂𝐻− (Equation 1.2b)
However, Pt catalyst tends to be more expensive than alternatives and has been shown to
be poisoned by chemicals such as sulfide, which is often found in wastewater (Logan et al., 2008).
Alternatives include biocathodes which are cathodes catalyzed by microorganisms (Jafary et al.,
2015). First row transition metals such as nickel and stainless steel alloys have shown to be stable,
abundant, low cost, and low toxicity to living organisms (H. Hu, Fan, & Liu, 2009). Tungsten
carbide, shows lower performance than platinum, but benefits from a low price and insensitivity
towards catalyst poisons such as sulfide and carbon dioxide (Harnisch et al, 2009). Recently, a
NiFe layered double hydroxide electrocatalyst was directly grown on nickel foam for hydrogen
gas evolution from brewery wastewater and showed a similar production rate to standard Pt
catalyst at 2.01-2.12 m³ H₂/m³d (Lu et al, 2016). Hydrogen production in a study conducted using
an electroformed Ni mesh cathode catalysts in a single-chamber MEC was compared to carbon
cloth containing Pt cathode (4.25±1 m³ H₂/m³d) and showed comparable with a maximum rate of
4.18±1 m³ H₂/m³d.
Modifications in MEC design have included the use of AEM separating anode from
cathode, graphite granules pretreated with high temperature ammonia gas (increases current
density) and carbon cloth as a surface for microbial growth, a Pt catalyst placed in the cathode
chamber as designed by Cheng and Logan (Cheng & Logan, 2007). This design resulted in a

12
hydrogen production rate of 1.1 m³ H₂/m³d with an overall energy efficiency of up to 86%
efficiency when evaluated on the basis of both the voltage added and the heat of combustion of
the substrate added. Other design modifications include a concentric tubular MEC, enrichment of
MEC bio-cathodes from sediment MFC bio-anodes, a single chambered MEC with a brush anode
and flat carbon cathode, continuous flow MECs, and MEC-MFC coupled systems for hydrogen
production (Kadier et al., 2016; Kyazze et al., 2010; Pisciotta et al, 2012).
The selection and treatment of inoculum is often required for efficient MEC operation.
Wastewater treatment plants provide an abundant consortium of bacteria from a digester slurry as
a starting inoculum (requiring enrichment). Multiple waste streams have been established as a
source for energy recovery by MECs and MFCs (Escapa et al., 2016). In fact, de-oiled wastewater
from a lignocellulosic biorefinery was used as inoculum showing better performance than standard
domestic wastewater (Ren et al., 2013). Additionally, energy recovery within a lignocellulosic
biorefinery using MECs was studied upstream of wastewater in a new approach for hydrogen
production using an integrated pyrolysis-microbial electrolysis process (Lewis et al., 2015). This
approach utilizes an aqueous stream generated during pyrolysis of switchgrass, as a substrate for
hydrogen production in a MEC. As a result, this process achieved a hydrogen production rate of
4.3 L H₂/L anode-day. The substrate, bio-oil aqueous phase (BOAP), was continuously fed at a
loading rate of 2 g/L-day to 10 g/L-day resulting in hydrogen production rates of 0.9 ± 0.06 to 4.3
± 0.05 L/L-day, respectively. This high production rate is attributed to the use of a patented
enrichment process with a previously enriched inoculum over several months to develop a
community capable of converting a variety of compounds into electrons (Borole, 2010).

13
1.6.3 Literature Review of MEC Process and Economic Analysis
Developments in MEC design have given an informative look at how they can be scaled-
up (Kadier et al., 2016). The use of wastewater as a source of carbon and energy for production
of biofuels and biochemicals whilst simultaneously treating local wastewater is a novel proposition
(Angenent et al, 2004). The use of MEC technology at a commercial scale has not been
demonstrated yet. As a first step towards that objective, preliminary engineering and economic
analysis of the process has been conducted (Escapa et al, 2012). This was a case study using a
wastewater from a treatment plant in Andalucía, Spain. The study explored four scenarios for
large-scale MEC design and determined the cost of the process. A consensus on the design of the
MEC for best implementation on a large-scale has yet to be reached, however; many designs have
been suggested (Kadier et al., 2016). A feasibility analysis begins with minimizing costs and
maximizing hydrogen gas production. In the case study reported by Escapa et al., 2012, high
capital costs associated with MECs were identified as the main barrier for commercialization. The
capital cost issue can be resolved to some degree with better performance of the MEC. A target
productivity of 20 L/L-day of hydrogen has been reported for achieving economic feasibility
(Sleutels et al., 2012). Recent studies have reported rates approaching that target (Borole & Lewis,
2017) and in some cases, the hydrogen production rate or current density have been surpassed, but
primarily using model substrates (Ichihashi et al., 2014).
Application of MECs in wastewater treatment plants and biorefineries is a challenging
proposition, however; it can result in many benefits, if demonstrated successfully. The large
footprint of MECs, which is not very different from other waste to energy operations such as
anaerobic digestion, can be a hurdle for commercialization; however, demonstrating economic
feasibility can overcome that hurdle. Investigations of MECs at a larger scale have been explored

14
and reported in literature, however, the performance has been found to deteriorate with increasing
scale (Escapa et al, 2015; Gil-Carrera et al., 2013; Keller & Rabaey, 2008). Improved designs and
process alternatives have potential to overcome these issues (Borole & Lewis, 2017; Borole et al.,
2009; Heidrich et al, 2014; Lewis & Borole, 2016; Pannell et al, 2016). The use of a biomass-
derived pyrolytic aqueous stream as a substrate producing hydrogen in a flow-through MEC was
recently shown to improve proton transfer rate to a maximum of 0.36 ± 0.01 moles per m² per h,
which is equivalent to a hydrogen production rate of 9.08 L/L-day (Borole & Lewis, 2017). Based
on data from Jones et al., 2013 (the PNNL report), and results from Lewis et al., 2015, the
implementation of microbial electrolysis within a biorefinery process is investigated in this study.
The integrated MEC-biorefinery process has potential to reduce the water demand and GHG
emissions resulting from use of natural gas reforming for H₂ production. Chapter 3 describes the
process design for the MEC unit operation and a mass and energy balance for conversion of BOAP
to hydrogen. Chapter 5 describes the MEC-associated accessories and unit operations to integrate
MEC into the biorefinery.
1.7 Bio-oil Separation
Biomass pyrolysis is a reaction that results in the production of three main products: bio-
oil, bio-char and non-condensable gas. Such reactions occur in a vessel known as a pyrolyzer,
where the decomposition of organic material takes place at very high temperatures with a residence
time of only a few seconds. The exact composition of the products varies from case to case
depending on the parameters defining the process such as feed type, reactor conditions, and
residence time. Determining this composition is usually achieved by commonly used techniques
such as gas chromatography and mass spectroscopy. The variety of functional groups found in

15
bio-oil typically include carboxylic acids, alcohols, ketones, furans, phenols, and sugars (Milne et
al, 1997). For example, in a study of the characterization of bio-oil, the pyrolysis of red oak
showed levoglucosan, acetic acid, 2-furan methanol, vanillin, and phenol as major components
(Pollard et al., 2012). Oftentimes, the primary goal of the pyrolyzer is to produce bio-oil as an
energy product. Since pyrolysis reactions occur at such high temperatures, the recoverable
products are usually in a vapor phase aside from undesired solid phase products such as char, sand,
and ash. The bio-oil is recovered through separation of the pyrolysis vapor into the aforementioned
three products. The PNNL report uses a system of two quench columns and a filter (Figure 1.7)
to achieve pyrolysis vapor condensation and bio-oil separation. Stream 130 is the pyrolysis vapor
entering the system and Stream 151 is the bio-oil fed into a filtration unit to remove remaining
solids.
Figure 1.7. PNNL report bio-oil recovery system (Jones et al., 2013)

16
More advanced, alternative separation methods may be used to fractionate the liquid stream
into multiple class of compounds present in bio-oil and potentially higher value products. One
such separation process has been developed by Iowa State University called stage fractionation
(SF) seen below in Figure 1.8 (Pollard et al., 2012).
Figure 1.8. Bio-oil stage fractionation process flow diagram (Pollard et al., 2012)
After removing solids from the exhaust via a cyclone separator, the pyrolysis vapors are
passed through a series of five unit operations. Essentially, stage fractionation separates the
pyrolysis vapors into five liquid fractions and a stream of non-condensable gases. This is
practically achieved using three heat exchangers to condense vapors and two electrostatic
precipitators to recover aerosols (W. Hu, 2016).
Bio-oil derived from switchgrass has been shown to partition up to 70% of its organic
content into aqueous phase, when diluted with water (Imam & Capareda, 2012). Indeed the

17
recovery of such an aqueous phase for the use of hydrogen production within a MEC is of great
interest. Chapter 4 describes the simulation of the Quench process and the SF process and
strategies to integrate these separation processes with MEC into the biorefinery.

18
CHAPTER 2
STEAM REFORMING OF HYDROCARBON GASES
2.1 Process Design
Steam reforming is an essential process within a biorefinery’s systematic design. It
functions to produce hydrogen to support the hydrotreating and hydrocracking stages downstream
by utilizing natural gas and off-gases produced in other processes within the biorefinery. The
steam reforming process was modeled in Aspen Plus using a scheme similar to that provided in
the PNNL report with a few exceptions involving combustion exhaust heat recovery and final
product recovery via pressure swing adsorption (PSA). Within the next two sections, a description
of the process design for natural gas and off-gas reforming simulated in Aspen Plus V8.8 is
described. One of the main goals of simulating this hydrogen production process was to investigate
the effect of changing feedstock conditions on hydrogen production. For example, the effect of
using off-gases alone, without natural gas input, on the production of hydrogen is explored. In
addition, this model would allow investigations of the effect of other process conditions on
hydrogen production, which may be needed during integration of additional unit operations along
with MEC in the biorefinery.
2.1.1 Natural Gas Reforming - Overview
A simple block diagram of the hydrogen production system (Figure 2.1) illustrates essential
inlet and outlet streams of the reforming process. A natural gas stream containing mostly methane
is mixed with off-gas from the hydrocracking and hydrotreating sections of the biorefinery. This
new stream is then mixed with superheated steam. This final stream of natural gas, steam, and off-
gas is then fed into a reforming reactor. A small portion of the off-gas from hydrocracking along

19
with an inlet stream of combustion air is fed into a combustion reactor that jackets the natural gas
reforming reactor to provide the heat needed to drive the reaction forward. The resulting stream
from reforming produces hydrogen gas along with other non-condensable gases and unreacted
steam. The hydrogen gas is fractioned off according to the hydrogen recovery specified in the
PNNL report (85%) and remaining vapors are recycled to the combustor. The combustor effluent
serves as a heat source for various intersecting streams within the hydrogen production system to
recover the heat. The exhaust is ultimately released to the atmosphere and is the only waste stream
in the process.
Figure 2.1. Simple block diagram of the hydrogen production system
2.1.2 Natural Gas Reforming - Detailed Description
The process begins with off-gas from an upstream pyrolysis process (Stream 170) and a
downstream hydrocracking process (Stream 600) entering the hydrogen production section of the
biorefinery [The stream numbers used in this thesis are the same as that used in PNNL report, to

20
the extent possible, to allow direct comparison of the results with those in the report]. The off-gas
from pyrolysis consists mostly of CO and CO₂ while the hydrocracking off-gas contains additional
non-condensable gases (CH₄, C₂H₄, C₃H₈, C₄H₁₀, and C₅H₁₂). The off-gas from hydrocracking
is split and the larger portion is mixed with the pyrolysis off-gas and then compressed to be sent
to the reformer (Stream 609). This compressed gas is also mixed with a natural gas feed (Stream
650) that serves to supplement the NCG for hydrogen production to meet the hydrogen demand
for the plant (44.5 MMscfd, 9841 lb/hr) (Jones et al., 2013). The supplemental natural gas feed
stream is mostly methane gas (87.8 wt %). The natural gas/off-gas mixture together generates
hydrogen in the baseline biorefinery process. A full process flow diagram can be found in the
Appendix Figure A1.
The natural gas/off-gas mixture (Stream 651) is then mixed further with a portion of
superheated steam (Stream S3) that is a fed from the plant’s steam drum (via Stream 730). Prior
to mixing with the natural gas/off-gas mixture, the superheated steam is split where a larger portion
is recycled back to the steam driver.
Figure 2.2. Process flow diagram of combustion reactor feeds

21
The only remaining feed to the hydrogen production section of the biorefinery is an inlet
air stream (Stream 610) that serves to support a combustion reaction downstream. This air is
pressurized before entering a heat exchanger to preheat the air using heat from the combustor
exhaust. The smaller portion of the hydrocracking off-gas split (Stream 601) also enters the
combustor along with a recycled NCG stream (Stream 682) from a downstream pressure swing
adsorption process, see Figure 2.2 above.
The combustion reactor essentially serves as a heat catalyst to drive the natural gas
reforming reaction where the reformer reactor (R-600) is effectively jacketed by the combustor
(B8) by an outlet heat stream (S2) leaving B8 and entering R-600. Before entering the reformer,
the natural gas/off-gas/superheated steam mixture (Stream S10) is heated by the exhaust of the
combustion reaction to pre-heat it to bring it closer to the reaction temperature.
The combustor is modeled as a Gibbs reactor that requires a high temperature and pressure
(1800˚F and 15 psia) along with a list of specified products with the valid phases of each. Possible
products must be specified when using a Gibbs reactor. Its reactants are based on the inlet stream
composition. Setting the calculation type to “calculate phase equilibrium and chemical
equilibrium” allows Aspen to generate the stoichiometry. Additionally, this is the exact technique
used in PNNL and resulted in nearly the exact same outlet (Stream 667) composition. The list of
products specified were based upon the products found in the exhaust stream in the PNNL report
(water, hydrogen, nitrogen, carbon monoxide, carbon dioxide, methane, and hydrogen sulfide).
The reaction temperature was set based on a specified burner temperature as described in
the PNNL report. The reaction pressure was implicitly specified as “slightly positive” in the report
and was thus sent to a pressure, 0.3 psia above atmospheric pressure.

22
Figure 2.3. Process flow diagram of combustion exhaust heat recovery
The products of this exothermic, combustion reaction reach a temperature of 1800˚F, which
leaves the reactor as exhaust, and is used as a source of heat, as described earlier, see Figure 2.3
above. A simulation of the heat exchangers needed was modeled such that the heat transfer to
these streams was in an order that allows for its gradual temperature reduction. Thus, the order in
which heat is recovered with the intersecting streams begins with the highest temperature stream
(natural gas/off-gas mixture) and ends with the intersecting stream with the lowest inlet
temperature (compressed air). This allows a reasonable temperature exchange between the
combustion exhaust and intersecting streams by maintaining a T of at least 20°F, otherwise
known as the minimum approach temperature.
For designing each heat exchanger within the exhaust heat recovery system, the cold stream
(intersecting streams) outlet temperature was specified with the exception of the exchanger fed
with saturated liquid water (Stream 721). In this heat exchanger, the hot stream (exhaust) outlet
temperature was specified such that the exhaust temperature could reach its lowest possible value
to avoid temperature crossover and to maintain the temperature and pressure of the saturated liquid.
Each model fidelity was selected as “short cut” and the short cut flow direction was selected as

23
“countercurrent”. After the fourth and final heat exchanger (E4), the resulting stream (Stream
S22) is slightly pressurized to enable its release into the atmosphere (Stream 630).
The reformer (R-600) is modeled as a Gibbs reactor as well. Phase equilibrium and
chemical equilibrium were calculated based on the operating temperature and pressure, 1562˚F
and 314 psia. The heat duty was specified based on the heat stream (S2) leaving the combustion
reactor and entering the reformer. This unit operation was set to identify possible products (water,
hydrogen, nitrogen, carbon monoxide, carbon dioxide, methane, and hydrogen sulfide), (Stream
667). Conversion of hydrogen sulfide was not modeled in our process, to keep it simple. A pre-
reformer hydrodesulfurization step is used to remove it prior to the steam reformer in the PNNL
process. Aspen Plus is capable of determining products based on this information and physical
properties specified alone, though for the sake of clarity the reactions of the components that are
largely converted are included below (Table 2.1).
Table 2.1: Gases converted via combustion and conversion reactions for
catalyzing reformer
Rxn No. Gas Converted Stoichiometry
1 Methane CH₄ + H₂O → CO + 3H₂
2 Ethane C₂H₆ + 2H₂O → 2CO + 5H₂
3 Propane C₃H₈ + 3H₂O → 3CO + 8H₂
4 N-Butane C₄H₁₀ + 4H₂O → 4CO + 9H₂
5 N-Pentane C₅H₁₂ + 5H₂O → 5CO + 11H₂

24
A series of boiler feed water streams (Streams 706, 752, and 752-0) from the steam driver
section of the biorefinery are used as a heat recovery agent via three separate heat exchangers (E-
674, E-676, and E-670), see Figure 2.4 below.
Figure 2.4. Process flow diagram of heat recovery from reformer
The reformer products (Stream 667) exit the reactor and as much heat from this stream is
recovered as possible by an inlet of boiler feed water (Stream 752-0) prior to entering the water-
gas shift reactor (R-675). Here, the water-gas shift reactor serves to maximize hydrogen
productivity by converting the remaining steam from the reforming reaction into hydrogen as seen
in the reaction below.
𝐶𝑂 + 𝐻2𝑂 ⇌ 𝐶𝑂2 + 𝐻2 (Equation 2.1)

25
R-675 was also modeled as a Gibbs reactor and was operated at 675˚F and 300 psia. The
above reaction stoichiometry was specified as the only reaction occurring within the vessel. The
boiler feed water (Stream 752) then further cools the resulting products (Stream 672). The
products are then cooled to 250˚F by a heat exchanger modeled as a heater (E-677) before final
separation. Finally, the remaining vapor is fed into a flash drums and a separator (B11 and PSA)
that function to recover pure hydrogen. Subsequently, a liquid stream from B11 (Stream 681) is
sent to the stream driver and a liquid stream from PSA (Stream 682) is recycled back into the
combustion reactor. The pure hydrogen (Streams 250 and 532) is sent to the hydrotreating and
hydrocracking sections of the biorefinery, respectively.
2.1.3 Off-Gas Reforming
When considering simulating hydrogen production without supplemental natural gas, the
process flow diagram is the same but with one exception. Stream 650 (natural gas) is omitted,
thus Stream 609 (pyrolysis vapor/hydrocracking off-gas split) alone is mixed with the superheated
steam (Stream S3). Adjustment of the inlet conditions were made to adjust the steam to natural
gas ratio and other parameters resulting from natural gas minimization in the reformer. These
effects and ratios are discussed in Section 2.2.
2.2 Results
2.2.1 Comparison of SMR Simulation Results with PNNL Report
A comparison of the simulation results with those from the PNNL report serves to
determine the accuracy of our natural gas steam reforming process. It also provides an informative
look at how our off-gas steam reforming process effects overall hydrogen production. The most

26
noticeable differences were seen in the combustion exhaust section of both simulated processes
and a decrease in overall hydrogen gas production in the off-gas steam reforming process. Both
of these results were expected. The former was due to the elimination of sulfide hydrotreater prior
to the reformer and the latter was due to reduction in substrate for the reforming reaction.
In the PNNL report, after the water-gas shift and pressure swing adsorption in the hydrogen
production plant (Stream 690), a total of 9,841 lb/hr of hydrogen gas is produced. About 8,846
lb/hr (90%) is portioned to the hydrotreating section (Stream 250) of the plant and 995 lb/hr (10%)
to the hydrocracking section (Stream 532). The natural gas reforming simulation resulted in a
hydrogen production rate of 9,900 lb/hr (0.60% error). This difference is mostly likely attributed
to rounding errors for input data (PNNL report component mass flow rates, temperatures, and
pressures are rounded to the nearest whole number and were used for input stream specifications).
Regardless, this hydrogen production rate exceeds overall demand for the biorefinery of 44.5
MMscfd (9,841 lb/hr). The off-gas reforming simulation resulted in a hydrogen production rate
of 8,176 lb/hr, 83.0% of hydrogen demand.
Beyond matching the amount of hydrogen produced, it was also important to verify certain
ratios to ascertain that the stoichiometry of the reforming reaction was maintained. These
consisted of the oxygen to fuel ratio in the combustion chamber, the substrate (natural gas and/or
off-gas) to steam ratio, the hydrogen to steam ratio, and the steam in to steam out ratio. The O₂ to
fuel ratio is of particular importance because it a way of determining how much oxygen is being
converted in the combustor for generating heat. Table 2.6 shows a comparison of the ratios from
the natural gas steam reforming simulation to what is found in the PNNL report.

27
Table 2.2. Comparison of reactant and product ratios
Ratio PNNL
Report
Natural
Gas Steam
Reforming
Off-gas
Stream
Reforming
Off-gas SR
with 15%
Reduction
O₂ in Exhaust/ O₂ in Air Inlet 0.079 0.089 0.326 0.173
Gas In/Steam In 0.505 0.505 0.433 0.520
H2 Out/Steam In 0.101 0.101 0.084 0.096
Steam Out/Steam In 0.494 0.493 0.580 0.523
The O₂ in exhaust to O₂ in air inlet ratio differs from the PNNL report in the natural gas
steam reforming simulation showing a slightly higher value. This is most likely due to a marginal
difference in the composition of the recycled NCG stream from PSA (Stream 682) to the
combustor. The combustor, modeled as a Gibbs reactor, calculates the chemical and phase
equilibrium based on feed information, thus a difference in reactant composition results in a
difference in product composition. The PNNL report showed total steam consumption (steam out
to steam in) after reforming and the water-gas shift to be 49.4%; this matched the natural gas steam
reforming simulation.
Naturally, for the simulation with the minimization of natural gas from the process, these
ratios differ significantly. There was a 15% decrease in enthalpy added to the system by the
minimization of natural gas. Reducing the flow rate of all other reactants (steam to reformer, air
to combustor, and off-gas to combustor) in the off-gas steam reforming simulation by 15% was
done to adjust for this change in the process design and meet the above ratios. As the results show,
this adjustment decreased the margin of error for each ratio by about 11% excluding the O₂ in
exhaust to O₂ in air inlet ratio which decreased by 194%. The drastic decrease of the latter error
is again do Stream 682; the error for the off-gas steam reforming process is quite high due to this

28
stream being even more different in composition than in the natural gas steam reforming process.
Thus, after the adjustment there is a significant change in the ratio.
Results for the combustion exhaust vent obtained using the model differ from those
reported in the PNNL report notably in the exit temperature. The PNNL report gives an exit vent
temperature of 324˚F while the results of the simulation found the temperature to be 528˚F and
527˚F, for the natural gas steam reforming and the off-gas steam reforming processes, respectively.
This may be due to a combination of design differences. The pre-reformer and hydro-
desulfurization reactors may remove heat from the incoming natural gas and off-gas streams to
some capacity since they are both endothermic reactions. In our simulations, the natural gas/off-
gas and off-gas streams (Stream S10 in both simulations) only intersect the exhaust once before
entering the reformer and do so at a high temperature 671˚F and 708˚F, respectively. Thus, less
heat is removed compared to the PNNL process resulting in higher vent temperatures.
2.2.2 Natural Gas and Off-Gas Steam Reforming Simulations Results
The resulting heat duty given off by the combustion reactor in natural gas reforming and
off-gas reforming were simulated to be 1.33 × 10⁸ Btu/hr and 6.61 × 10⁷ Btu/
hr, respectively. This is the maximum heat transfer between the combustor (jacket) and the
reformer (reactor). The exhaust from the combustion reaction exits the system, but not before
exchanging heat with intersecting streams within the hydrogen production system. The order in
which these streams recover heat (see Table 2.2 and 2.3 below) is important due to the exhaust
progressively cooling before exiting the system (Stream 630). Thus, appropriately, a series of heat
exchangers are used to model the exchange of heat between intersecting streams (cold streams)
and the progressive cool down of the exhaust.

29
Table 2.3. Combustion exhaust heat exchangers: Temperature changes with natural gas
Order
Number
Unit
Operation
Cold Inlet
Temp. (˚F)
Cold Outlet
Temp. (˚F)
Exhaust Inlet
Temp (˚F)
Exhaust Outlet
Temp ˚(F)
1 E1-B20 671 1110 1800 1464
2 E2-B15 499 750 1464 1169
3 E3-B22 496 496 1169 517
4 E4 124 140 517 507
Table 2.4. Combustion exhaust heat exchangers: Temperature changes minimized natural gas
Order
Number
Unit
Operation
Cold Inlet
Temp. (˚F)
Cold Outlet
Temp. (˚F)
Exhaust Inlet
Temp (˚F)
Exhaust Outlet
Temp ˚(F)
1 E1-B20 708 1110 1800 1495
2 E2-B15 499 750 1495 1181
3 E3-B22 496 496 1181 517
4 E4 124 140 517 506
Though the final exhaust temperatures are the same, the amount of recoverable heat from
the combustion reaction is different. This difference comes from the recycled NCG (Stream 682)
to the combustor having a lower flow rate in the off-gas steam reforming than in natural gas steam
reforming. Essentially, there is less recovered off-gas from the reforming process and thus less to
be used in the combustor for heating.
Naturally, there is a tradeoff in composition of the reformer feed stream between the
simulations with and without a natural gas feed. For the simulation with natural gas, the stream
entering the reformer (Stream 662) is 67% steam and 8% methane, while the stream without natural

30
gas is 70% steam and 4% methane. A breakdown of the converted components for each simulation
can be seen below.
Table 2.5. Stream 662 (Reformer Feed) mass fraction composition natural gas and off-gas
Natural Gas Off-Gas
Component Mass Fraction Mass Fraction
Water (steam) 0.67 0.70
Methane 0.08 0.04
With the minimization of natural gas, there is a 52.3% decrease in the amount of methane
fed into the reforming reactor. Hydrogen and carbon monoxide, the main products of the steam
reforming reaction, resulted in a 17% and a 23.6% decrease in production prior to entering the
water-gas shift reactor, respectively. Additionally, water and carbon monoxide, the main reactants
of the water-gas shift reaction, saw an 8% increase and 1% decrease in production, respectively.
Table 2.6. Steam reformer exit stream results
W/ Natural Gas Off-Gas Percent Change
Component Mass Flow (lb/hr) Mass Flow (lb/hr) (%)
Water (Steam) 64790.77 69942.69 8%
Hydrogen 9783.045 8129.108 -17%
Nitrogen 114 0 -100%
Carbon Dioxide 32607.84 24902.57 -24%
Carbon Monoxide 35024.86 34731.25 -1%
Methane 4683.009 2300.906 -51%
Hydrogen Sulfide 17.703 17.703 0%
Not all of the heat from the combustor exhaust stream is recovered before exiting the
process as waste. Thus, considering the heat loss from the exhaust leaving the system, the overall

31
energy efficiency of the simulations were 98.4% and 97.5% for natural gas and off-gas hydrogen
production, respectively.
2.3 Differences in Design Compared to PNNL Process
In the PNNL report, the hydrogen production system is designed specifically to meet
demands of the overall biorefinery. The essential purpose of the steam reformer is to utilize off-
gas from integrated sections of the overall biorefinery to produce hydrogen gas. The more efficient
this process is the less dependency there is on supplementary reforming gases i.e. natural gas.
Ideally, a supplemental source of gas would not be necessary if off-gases used from within the
overall system were capable of being reformed to sufficiently meet hydrogen demand. Thus,
analyzing the efficiency of the hydrogen production system from mass and energy balance data
aids in determining if the purpose of this process is appropriately fulfilled. At the same time, this
sheds light on where and how deficiency in hydrogen production can be recovered.
The difference between the simulated model for the hydrogen production process
compared to the PNNL report process is one of the fundamental points of this research. The main
difference asks the question: Can the hydrogen gas produced by the separation+MEC and the
Quench-MEC process make up for the decrease in hydrogen production in the steam reforming
process if the additional natural gas input is minimized? Essentially, the off-gas steam reforming
design does not include a supplemental natural gas stream in the steam reforming process to meet
the hydrogen production requirements within their report.
The PNNL report process utilizes the exhaust vapor of the reformer heating process as
source for heat recovery by various intersecting streams. This process is effectively modeled using

32
a heat exchanger network where each intersecting stream is met by a heat exchanger unit operation.
The PNNL report process can be seen below, Figure 2.5.

33
Figure 2.5. Full hydrogen production process flow diagram from PNNL-23053 (Jones et al., 2013)

34
The PNNL report process flow diagram shows six streams intersecting the exhaust vent
beginning with Stream 721 intersecting the vent and leaving as Stream 723. Second, a stream
leaves a pre-reformer reactor (R-660) intersects the vent, and leaves as Stream 662. Third, a stream
leaves a hydro-desulfurization reactor (R-610) mixed with steam then intersects the vent, and
leaves as Stream 656. Fourth, Stream 730 enters the process, intersects the vent, and leaves prior
to being split. Fifth, Stream 651 intersects the vent and leaves entering the hydro-desulfurization
reactor. Finally, a compressed air stream from Stream 610 intersects the vent and leaves as Stream
611.
The hydro-desulfurization and pre-reforming unit operations found in the PNNL report are
omitted from the natural gas and off-gas steam reforming simulation designs as reactor coking
issues are beyond the scope of this research. Additionally, these operations are negligible as far
as overall hydrogen production comparison is concerned. The pre-reformer converts C₂+
compounds (ethane, propane, etc.) into methane prior to entering the main reformer while the
hydro-desulfurization reactor removes poisonous sulfur from the incoming off-gas streams.
Because of the absence of these reactors, the heat exchangers preceding the pre-reformer and
hydro-desulfurization reactors found in the PNNL report are also omitted from the simulations as
pre-heating is no longer necessary. PSA is used in the PNNL report as a final separation of
hydrogen from CO₂ and other unreacted products from reforming and was designed for 85%
hydrogen recovery. Remaining products are recycled back to the combustor to meet demands.
This process is modeled as a flash drum to achieve the same separation since the PSA unit
operation is not found in Aspen Plus V8.8.

35
CHAPTER 3
MICROBIAL ELECTROLYSIS
3.1 Biorefinery Feed to MEC
Condensation or quenching of the pyrolysis vapors results in production of multiple
streams or fractions. One or more of these streams contain water at high concentrations making
them primarily aqueous phase streams. These streams are not ideal for hydrotreatment and
production of biofuels because they contain large amount of water-soluble organic compounds
such as short chain fatty acids, anhydrosugars, furanic compounds, ketones and other carbonyl
compounds, which do not convert well into hydrocarbon products. In some cases, these
compounds can condense and form coke resulting in catalyst inactivation issues (Ortiz-toral,
2008). Thus, it may be beneficial to separate these compounds and not use them for fuel
production. Such streams are suitable for MEC since bioanode can convert the water soluble
organic acids into electrons and generate hydrogen in cathode. Some compounds may be
recalcitrant or inhibitory, but majority of them are suitable for conversion in bioanode. This was
demonstrated by Lewis et al., recently (Lewis et al., 2015; Lewis & Borole, 2016). The aqueous
stream thus forms a primary stream for production of hydrogen in the MEC.
In a lab setting, there are many things to consider when developing the MEC. Typically,
system design, biological, and operating parameters are the focus for development of the biological
catalyst needed for MEC anode (Borole et al, 2011). Many of these parameters have been
investigated by Lewis and others demonstrating the ability of a biocatalyst to convert the aqueous
phase into hydrogen effectively (Borole & Lewis, 2017; Lewis & Borole, 2016). In this chapter,
a mass and energy balance is conducted for the MEC unit operation, assuming the target
productivity and efficiency. Results from work conducted by Lewis and Borole suggest that such

36
performance can be achieved in the near future with further research (Borole & Lewis, 2017; Lewis
et al., 2017) Determination of the theoretical amount of hydrogen produced by a MEC was
calculated using the decomposition reaction chemistry of organic matter as seen in the equation
below.
𝐶𝑥𝐻𝑦𝑂𝑧 → 𝐶𝑂2 + 𝐻+ + 𝑒− (Equation 3.1a)
2𝐶𝐻2𝑂 → 2𝐶𝑂2 + 4𝐻+ + 4𝑒− (Equation 3.1b)
The organic content of BOAP can be described by chemical oxygen demand (COD), which
is represented as CH2O. Equation 3.1b shows the stoichiometry for anode reaction considering
BOAP as COD. The PNNL report establishes a basis of 2000 metric tons per day of biomass
feedstock. Through a simulated fast pyrolysis model, a set of water-soluble and water-insoluble
bio-oil compounds were predicted and model compounds were used to represent the product
stream. The aqueous phase served as the feedstock for the MEC
Figure 3.1. Model compounds representing bio-oil (Jones et al., 2013)
37
The water-soluble products of pyrolysis are separated and identified as bio-oil aqueous
phase (BOAP). The separation process is described in detail in Chapter 4. The aqueous phase is
usually very concentrated and needs to be diluted to lower the concentration of phenols and furans
below 1 g/L to minimize inhibition and avoid fermentation limitations (Zeng, Borole, &
Pavlostathis, 2015, 2016a, 2016b; Zeng et al, 2017). At lower concentrations, they can also serve
as substrates within the MEC (Lewis et al. 2017).
3.2 The Hydrogen Need of the Biorefinery
Within the biorefinery, hydrogen gas is required for upgrading bio-oil and hydrocracking.
In the PNNL report, the source for all hydrogen production comes from steam reforming. The
MEC serves to provide a supplemental source of hydrogen and replaces any loss due to
minimization of natural gas. Thus, determining the decrease in hydrogen production by
minimizing supplemental natural gas was informative as to exactly how much hydrogen needed to
be produced by the MEC.
In the PNNL process, a total of 9,841 lb/hr of hydrogen is needed for upgrading and
hydrogenating bio-oil. The hydrotreating process requires nearly 9 times as much hydrogen gas
(8,846 lb/hr) compared to the hydrocracking process (995 lb/hr). A mass balance was conducted
to determine the total hydrogen requirement and its production in MEC.
3.3 MEC Conversion Model
To calculate the maximum theoretical amount of hydrogen that can be produced, the
composition and mass flow rate of organic matter fed to the MEC (BOAP) must be known and

38
then converted to a mass flow rate of hydrogen using stoichiometry with appropriate conversion
efficiencies and degradation limits. See example calculation below.
[𝑔 𝐶𝑥𝐻𝑦𝑂𝑧
𝑑𝑎𝑦] × [
𝑚𝑜𝑙
𝑔 𝐶𝑥𝐻𝑦𝑂𝑧] × [
𝑒−
𝑚𝑜𝑙 𝐶𝑥𝐻𝑦𝑂𝑧] × [
𝑚𝑜𝑙 𝐻2
2 𝑒− ] × [𝑔 𝐻2
𝑚𝑜𝑙] = [
𝑔 𝐻2
𝑑𝑎𝑦]
𝐶𝑥𝐻𝑦𝑂𝑧
(Equation 2)
The hydrogen production rate required to replace natural gas is used to determine the
minimum anode reactor volume of the MEC to achieve this production considering the desired
target hydrogen production rate of the MEC (20 L/L-day) as mentioned before in Chapter 1. It is
important to make a note on the “hydrogen production rates” used in this study. Total production
rate as well as specific production rates are used for describing hydrogen production in the MEC
and in the biorefinery. Hydrogen production rates for MECs are usually represented as specific
rates with respect to volume, in the units of L/L-day or m³/m³-day; this implies the liters of
hydrogen produced per liter of anode volume per day. Hydrogen production for a process in the
biorefinery, in this case steam reforming or the MEC generating additional hydrogen, is typically
represented in a mass (lb/hr, g/day) or volumetric flow rate (m³/day, L/day). The following
equation relates the rates described above.
[𝐿 𝐻2
𝑑𝑎𝑦] × [
𝐿 𝑎𝑛𝑜𝑑𝑒·𝑑𝑎𝑦
20 𝐿 𝐻2] = [𝐿 𝑎𝑛𝑜𝑑𝑒] (Equation 3)
3.3.1 Effect of Feedstock Composition on Hydrogen Production
If the production rate of hydrogen is known, the amount of BOAP required to produce the
hydrogen can be estimated. In this case, for a 2,000 ton per day biorefinery, the hydrogen
production rate using MEC needs to be 1,7231,216 lb/hr. The method to determine the amount of

39
feedstock required is described here. The BOAP substrate contains several classes of compounds.
These compounds are modeled using specific model compounds shown in Table 3.1. The first
step is to develop the stoichiometry for the conversion reaction. This is based on the half reaction
shown in Equation 3.1. The other half reaction, which occurs at the cathode, consists of two moles
of protons reacting with two moles of electrons generating hydrogen molecule (Equation 3.4).
4𝐻+ + 4𝑒− → 2𝐻2 (Equation 3.4)
The results of this calculation are shown in Appendix Table A1. The proportion of each
class of compound is necessary to calculate the total hydrogen production. In this example, the
substrate distribution is based on PNNL report. The stream generated after pyrolysis vapor
quenching in column 2 is used as the feedstock for MEC. The mass flow rate of BOAP to the
MEC ultimately is the variable that dictates the amount of hydrogen produced. The summation of
the hydrogen production rates of each individual component of the BOAP is used to determine the
total hydrogen produced. See example calculation below.
[𝑔 𝐻2
𝑑𝑎𝑦]
𝐶𝑥𝐻𝑦𝑂𝑧
× [𝑚𝑜𝑙
𝑔 𝐻2] × [
22.4 𝐿 𝐻2
𝑚𝑜𝑙] × [
1
𝐿 𝑎𝑛𝑜𝑑𝑒] × [𝜂] = [
𝐿 𝐻2
𝐿 𝑎𝑛𝑜𝑑𝑒∙𝑑𝑎𝑦]
𝐶𝑥𝐻𝑦𝑂𝑧
(Equation 4)
20𝐿 𝐻2
𝐿∙𝑑𝑎𝑦= ∑ [
𝐿 𝐻2
𝐿 𝑎𝑛𝑜𝑑𝑒∙𝑑𝑎𝑦]
𝐶𝑥𝐻𝑦𝑂𝑧
𝑁1 (Equation 5)
3.3.2 Effect of Efficiency on Hydrogen Production
The second parameter to be applied for determining production of hydrogen is the process
efficiency. This consists of three components: biodegradability, anode Coulombic efficiency and
cathode conversion efficiency. Total efficiency (ƞ) is representative of the three efficiencies. An

40
example of target efficiencies is given below, however, a range of efficiencies were evaluated to
determine practical feasibility. A baseline biodegradability of 70% was assumed, the anode
Coulombic efficiency was assumed to be 75%, and the cathode conversion efficiency was assumed
to be 85%. The total efficiency, using these individual efficiencies, comes out to be 44.6%. These
efficiencies are partly based on the results obtained experimentally by Lewis et al., at low OLRs (
Borole & Lewis, 2017; Lewis et al., 2015). However, the data had to be further extrapolated to
higher flow rates and additional assumptions were made regarding the technological advances in
MEC technology. In Equation 5, N represents the number of BOAP compounds being converted
to hydrogen. The model was developed in Excel and the total hydrogen production was determined
for a given set of feedstock and efficiency conditions.
3.4. Techno-Economic Analysis Model
In addition to the MEC, a few other supporting unit operations are needed for separation
of the effluent from the anode and its recycle and reuse to enable a continuous process. A process
model was developed in Aspen Plus using all the accessories needed. The supporting unit
operations are shown in Figure 3.2. The anode effluent contains carbon dioxide generated during
the exoelectrogenic conversion process as described by equation 3.1. The bio-oil organic
compounds dissolved in the aqueous phase are represented by a generic formula for chemical
oxygen demand (COD), which is easier to measure for the BOAP stream (Tomasini et al., 2014;
Lewis et al., 2017).
Carbon dioxide is the primary dissolved gaseous component, which needs to be separated
post-MEC. Thus, one of the operations in the MEC system is a gas separator or a degassing unit.
A splitter is included in the anode stream to allow separation into two fractions, so part of the

41
aqueous stream is bled off, while the major portion of the aqueous stream is recycled. A
recirculation tank is included for equilibration of liquid streams coming from recycle and the
separator. This tank also serves as a pH monitoring and control point for the liquid entering the
MEC. A filtration unit is included to remove particulate biomass in the MEC effluent, resulting
from sloughing of the biofilm and growth of planktonic cells in the MEC. The hydrogen produced
at the cathode is essentially the only product gas, although methane can also be generated in MEC
anode and then transferred to the cathode. Presence of methane in the gas stream is not considered
a problem for in-house biorefinery utilization of the gas stream; therefore, no further purification
of the cathode gas stream is included. It is expected to contain nitrogen, which will be used in the
cathode periodically during maintenance, etc. as well as during start-up to make the cathode
anaerobic. A gas compressor is included in the process flow diagram for compression of the
gaseous product for storage and subsequent use.
Figure 3.2. Process flow diagram for hydrogen production from biorefinery stream using
microbial electrolysis.

42
3.4.1 Electrochemical Control System
In addition to the hydraulic control of the MEC system shown in Figure 3.2, an
electrochemical control system is needed to manage the electrical operation of the MEC. This
primarily includes devices for potential control of the MEC and to enable efficient power
management. Either a potentiostat or a power source is needed to supply the necessary voltage for
operation of the MEC. The system needs to supply between 0.6 to 1.2 volts of electrical energy to
the MEC. The electrical and hydraulic connections for a large-scale hydrogen production system
will be determined by the characteristics of the liquid feedstock and the electrochemical losses of
the specific system, however, in most cases, a stack of MECs is expected to be connected in series
or parallel. The design case considered here assumes an average capital cost of $2000/m3 for the
MEC, which may be either parallel plate or tubular configuration arranged in a stack. A sensitivity
analysis is conducted to understand the effect of MEC capital costs. The electrical system includes
the cost of power transformer, rectifier and power installations necessary to control the complete
MEC system, similar to that used by Escapa et al. (Escapa et al., 2012).
3.4.2 MEC Operation and Performance Specifications
A number of process parameters need to be controlled for optimal operation and
performance of an MEC. Table 3.2 lists a range of values for important parameters related to MEC
operation. Applied voltage, organic loading rate, flow rate/hydraulic retention time and pH are the
key parameters considered in this study. The organic loading rate (OLR) is the g COD fed into
the reactor per liter of reactor per day. Typical OLRs used in MEC investigations are in the range
of 1-5 g/L-day, however, higher OLR up to 20 g/L-day is considered here, since high loading rates

43
will be necessary to achieve practical productivities of hydrogen. Furthermore carrying this
parameter is possible which will allow examination of the effects of OLR on the economic
feasibility. Such higher OLRs have been investigated recently by Lewis et al., for conversion of
biorefinery streams in MEC (Borole & Lewis, 2017; Lewis & Borole, 2016). Typical hydraulic
retention time (HRT) for MECs range from several minutes to hours (Gil-Carrera et al., 2013;
Lewis & Borole, 2016), however, lower retention time and higher flow rates have certain
advantages in terms of the current densities generated in the bioanode (Pham et al., 2008).
For complex organic material such as that present in biorefinery streams, the efficiency of
substrate utilization can make a significant difference in the yield of the MEC. A range of
parameters describing substrate utilization or biodegradability, anode coulombic efficiency and
cathode conversion efficiency are shown in Table 3.2. Overall substrate to hydrogen conversion
efficiency of 30-50% are investigated. A bio-oil aqueous phase COD conversion of up to 75% has
been reported. Likewise, an anode coulombic efficiency in the range 50-80% and a cathode
efficiency in the range of 90-100% has been reported Lewis et al., 2015. Typical hydrogen
productivities for MEC range from 1-3 L-H2/L-reactor-day Logan et al., 2008. Higher
productivities are also considered for investigating economic feasibility, since recent experimental
results have shown a hydrogen productivity of 11.7 L/L-day using switchgrass-derived BOAP
(Borole & Lewis, 2017).

44
Table 3.1 MEC operating and performance parameters
Parameter Value
m³ H₂/day 208,689
H₂ productivity, m³/m³-day 1-20
Current density, A/m² 1-25
Anode CE 62.2 ± 30%
Cathode conversion efficiency (CCE) 80 ± 15%
Substrate loading rate, g/L-day 1-20
Substrate utilization, % 60 ± 30%
3.4.3 Biorefinery Process Analysis
The report used as the baseline biorefinery process converts 2000 tons per day of biomass into
biofuel. The techno-economic feasibility of providing hydrogen to this process via MEC using
bio-oil aqueous phase as the feedstock to replace the natural gas derived hydrogen is the basis of
this analysis. This amounts to 208,689 m³/day (1,723 lb/hr) of hydrogen. Thus, the economics of
producing 1,723 lb/hr of hydrogen is assessed here.
Besides the MEC costs, the cost of supporting equipment including pumps, tanks, compressors,
filters, hydrogen storage tanks, etc. were determined using Aspen Plus costing software. Estimates
for the cost of electrochemical equipment needed for MEC operation were based on Escapa et al.
(Escapa et al., 2012). This included power transformers, rectifiers, and other power installations.
A scaling factor based on total MEC volume was used to determine the costs for the biorefinery
process. Costs for sludge removal and disposal were also included using the same method based
on Escapa et al. A 45% indirect cost was applied to the total equipment cost. The operating cost
included labor, maintenance, training, insurance and sludge disposal. The largest component of
the operating cost was the electricity for MEC operation. This was calculated using the current
produced in the MEC and an applied voltage of 0.8 V. Feedstock cost was considered, however,
since the compounds removed by MEC are considered as waste and may carry a negative value,

45
the baseline analysis assumed zero cost for the feedstock. The sensitivity analysis, however,
considered a price ranging from zero to the full cost of the biomass feedstock ($ 85.45/dry ton
biomass) for the feed stream COD used in MEC. For the economic analysis, a 40% equity was
used with an 8% interest for the remaining 60% loan amount. The term for the loan was 10 years.
The estimates calculated are for an nth plant, assuming that the technology is mature and several
plants have been built already and are operating. A working capital of 5% and an income tax rate
of 35% were used. A 7-years modified accelerated cost recovery system (MACRS) depreciation
method was used for the general plant. An on-stream factor of 90% was used. The construction
period was assumed to be 3 years (8% Year 1, 60% Year 2, 32% year 3) with 6 months start-up
period and 50% revenue during start-up period. The assumptions for nth plant estimation were
similar to that used for biorefinery process designs developed previously (Jones et al., 2013). The
mass balance was conducted using Excel and the model for cost estimation was also created in
Excel, using the individual equipment costs derived from Aspen Plus and previously published
information (Escapa et al., 2012).

46
3.5 Results and Discussion
Results from these calculations of the specified BOAP hydrogen production rates can be
seen below in Table 3.1.
Table 3.2. BOAP hydrogen production rates
Aspen Compound Compound
Group
Simulation
Name
Hydrogen rate
(L/L-day)
Crotonic acid Acids CROTO-01 1.50
1,4-Benzenediol Alcohols P-HYD-01 2.76
Hydroxyacetone (Acetol) Ketones ACETO-01 2.80
3-Methoxy-4-Hydroxybenzaldehyde
(Vanillin)
Aldehydes VANIL-01 5.36
Isoeugenol Guaiacols ISOEU-01 2.43
Levoglucosan Low MW sugars LEVOG-01 0.80
Cellobiose High MW sugars CELLO-01 4.31 Total 19.97
Based on these calculations, replacing 100% of the make-up natural gas for steam
reforming to satisfy hydrogen production demands for the biorefinery requires a BOAP mass flow
rate of 23,057 lb/hr. Additionally, a total efficiency of roughly 44.6% must be achieved by the
MEC to achieve a production the desired hydrogen production rate for economic feasibility.
Based on the comparison of results between the natural gas and off-gas steam reforming
simulations, the amount of hydrogen produced from natural gas is 1,723 lb/hr. Thus, this is the
amount of hydrogen the MEC must produce to meet the demands of the biorefinery.
These calculations were carried out using Excel while a model for the MEC process to
generate hydrogen along with the necessary peripheral unit operations was simulated in Aspen
Plus. The two models serve different purposes for the scope of this study. The Excel modeled
MEC provides a reactor volume based on a desired hydrogen production rate of 20 L/L-day,

47
current estimated MEC price calculations, and component chemistry (Borole, 2015; Sleutels et al.,
2012). The Aspen modeled MEC acts as a simulated placeholder for the integration of a MEC in
the context of a full biorefinery and is modeled as a stoichiometric reactor. Furthermore, the Excel
model provides more accurate costing information as Aspen cannot simulate the many unique
aspects of a MEC. However, the Aspen model does allow for the consideration of the upstream
and downstream unit operations that would be necessary within the context of biorefinery
integration. From the Excel model, the Aspen model can be designed such that the exact amount
of BOAP is portioned to the MEC to achieve a hydrogen production rate of 20 L/L-day and provide
sufficient make-up hydrogen for the minimization of natural gas in SMR. Due to this, the MEC
Aspen model will be discussed further in Chapter 4, as it is a downstream process of bio-oil
separation.
3.5.1 Mass Balance for Hydrogen Production
A feasibility analysis is conducted for integration of microbial electrolysis unit operation
into a biorefinery generating hydrocarbon fuels from lignocellulosic biomass. A process design
report generated by PNNL is considered as the baseline biorefinery process. To meet the hydrogen
demand of the biorefinery process, a total hydrogen supply of 44.5 MMscf/day is required. In the
process modelled by PNNL, this is partly supported by the biomass-derived off-gas and partly by
external natural gas. The analysis conducted here targets hydrogen production from bio-oil
aqueous phase rich in carbonyl compounds such as carboxylic acids, ketones, aldehydes as well as
furanic compounds present in the quench stream from second column used to cool pyrolysis vapors
(Jones et al., 2013). This is amended with a small fraction of the quench stream from first column

48
to achieve a target rate of hydrogen generation of 1,723 lb/hr. Ultimately, the remaining
compounds are either recycled back to the quench system or sent to hydrodeoxygenation.
Figure 3.3. Detailed flow sheet of the hydrogen production system integrated with the
quench columns
The major portion of the quench stream from column 1 (bio-oil) is used for production of
hydrocarbon fuels. A detailed flowsheet of the hydrogen production system integrated with the
quench columns is shown in Figure 3.3. The mixture used for hydrogen production is termed as
bio-oil aqueous phase, since it is a dilute aqueous phase containing water-soluble components of
bio-oil. The hydrogen production rate factors in the inefficiencies of the MEC and the associated
unit operations to derive the total substrate needed. A substrate to hydrogen conversion efficiency,
i.e., hydrogen recovery of 45 % is used. This includes the anode Coulombic efficiency (CE) and
the cathode conversion efficiency (CCE). A range of efficiencies are considered as stated in Table
3.1, however, a CE of 75% and a CCE of 85% are assumed as tentative targets. Additionally, a
baseline biodegradability of 70% is used. Thus, to achieve the target hydrogen production rate, an
organic loading rate of 8.02 g/L-day is needed.

49
Since the BOAP stream contains some inhibitory compounds, controlling the feed
concentration of BOAP in the MEC influent is necessary. This is achieved via utilization of a
recirculation loop for the MEC system (Figure 3.2). The PNNL biorefinery process design already
consists of two recirculation loops, one for the Quench column 1 and the other for Quench column
2. The latter has negligible amount of phenolic compounds. Use of this stream as the feed to the
MEC allows utilization of the carbonyl compounds present in this stream for hydrogen production.
Additionally, supplementation of a portion of the recycle stream from Quench column 1 into this
stream enables the necessary carbon to be delivered to the MEC for hydrogen production. The
resulting concentration of the phenolic compounds in the combined stream is about 1.2 g/L. The
concentration of mixed phenols at which inhibition occurs has been reported previously and
increases with concentration above 0.8 g/L (Zeng et al., 2016). Thus, a 5.0% dilution is necessary
to minimize inhibition. This was done by increasing the flow of the recycle loop by 5.0%, enabling
inclusion of the MEC system in this recycle loop.
3.5.2 MEC Process Cost Estimation
Based on the integration of the MEC in the biorefinery flow sheet, the additional cost of
the complete MEC system was derived. The cost of the quench columns is not included in this
analysis, since it is already part of the process design used to generate biofuel. Table 3.3 shows
the capital costs associated with the MEC system.
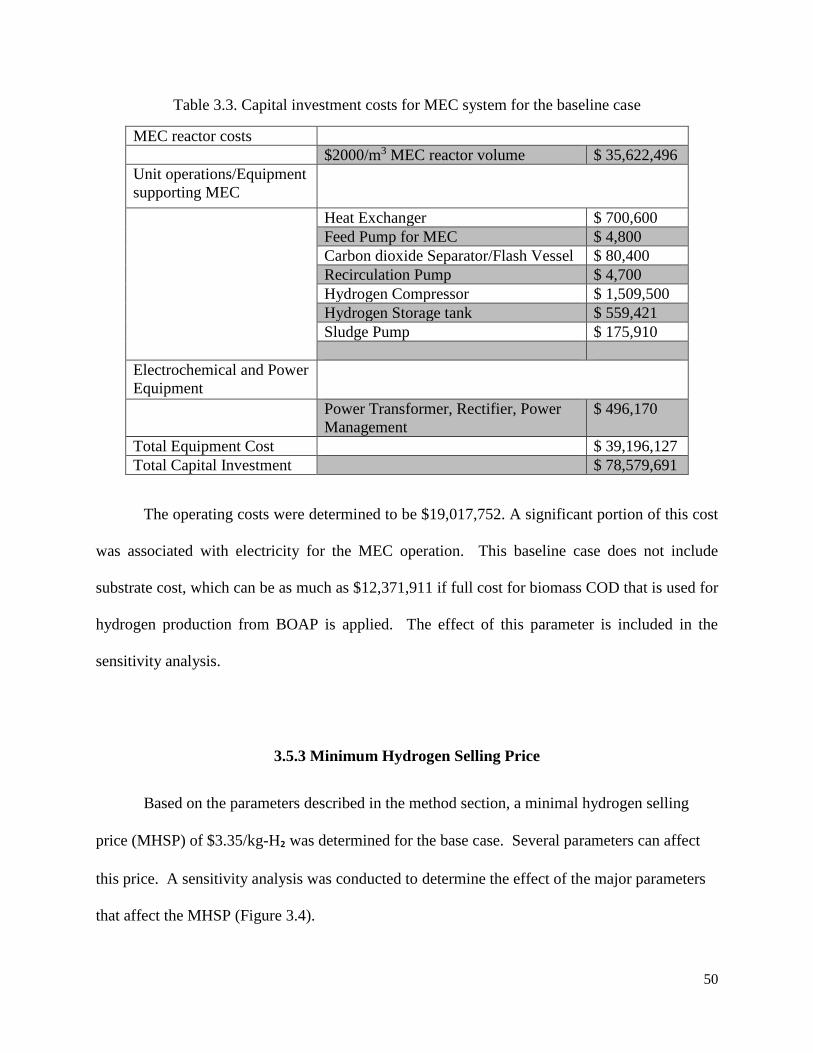
50
Table 3.3. Capital investment costs for MEC system for the baseline case
MEC reactor costs
$2000/m3 MEC reactor volume $ 35,622,496
Unit operations/Equipment
supporting MEC
Heat Exchanger $ 700,600
Feed Pump for MEC $ 4,800
Carbon dioxide Separator/Flash Vessel $ 80,400
Recirculation Pump $ 4,700
Hydrogen Compressor $ 1,509,500
Hydrogen Storage tank $ 559,421
Sludge Pump $ 175,910
Electrochemical and Power
Equipment
Power Transformer, Rectifier, Power
Management
$ 496,170
Total Equipment Cost $ 39,196,127
Total Capital Investment $ 78,579,691
The operating costs were determined to be $19,017,752. A significant portion of this cost
was associated with electricity for the MEC operation. This baseline case does not include
substrate cost, which can be as much as $12,371,911 if full cost for biomass COD that is used for
hydrogen production from BOAP is applied. The effect of this parameter is included in the
sensitivity analysis.
3.5.3 Minimum Hydrogen Selling Price
Based on the parameters described in the method section, a minimal hydrogen selling
price (MHSP) of $3.35/kg-H₂ was determined for the base case. Several parameters can affect
this price. A sensitivity analysis was conducted to determine the effect of the major parameters
that affect the MHSP (Figure 3.4).

51
Figure 3.4 Sensitivity analysis for minimum hydrogen selling price
The MEC was designed to produce 208,689 m³-H₂/day (make-up hydrogen) with a
hydrogen productivity of 20 L/L-day. At these demands, a maximum current density of 44.61 A/m²
can be achieved at maximum efficiency; however, based on the practical limitations previously
stated regarding biodegradability, Coulombic efficiency, and cathode conversion efficiency, a
current density of 20 A/m² is attainable.
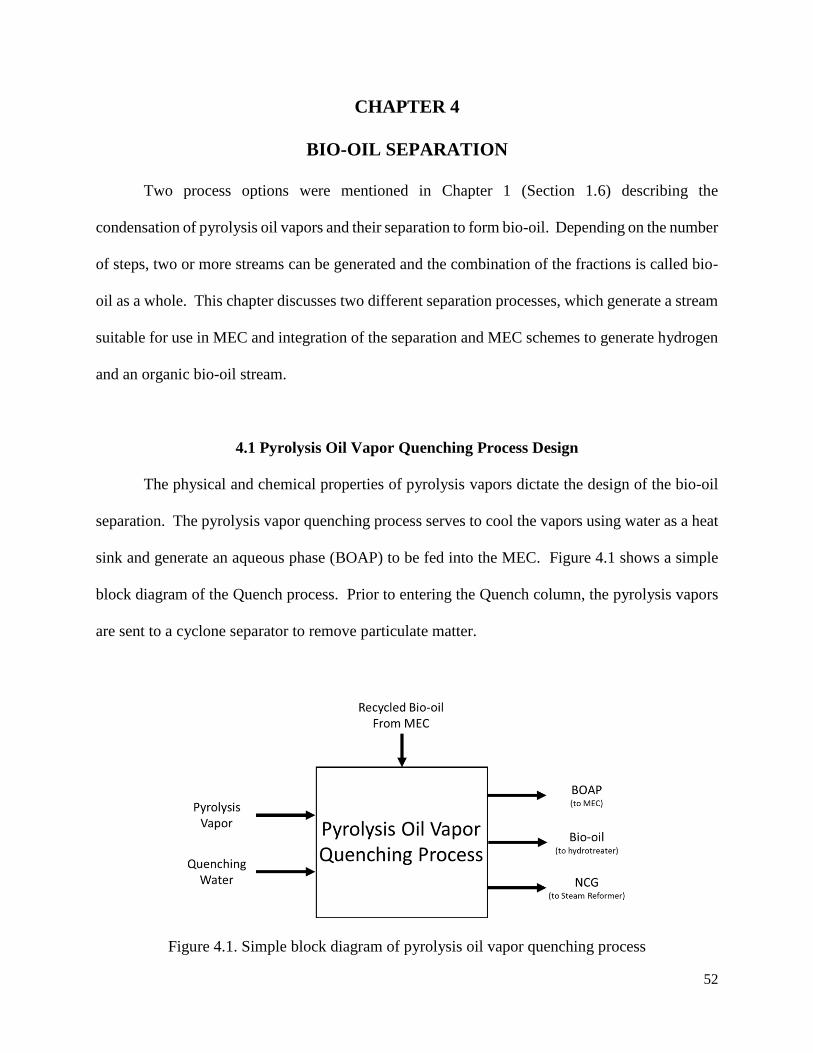
52
CHAPTER 4
BIO-OIL SEPARATION
Two process options were mentioned in Chapter 1 (Section 1.6) describing the
condensation of pyrolysis oil vapors and their separation to form bio-oil. Depending on the number
of steps, two or more streams can be generated and the combination of the fractions is called bio-
oil as a whole. This chapter discusses two different separation processes, which generate a stream
suitable for use in MEC and integration of the separation and MEC schemes to generate hydrogen
and an organic bio-oil stream.
4.1 Pyrolysis Oil Vapor Quenching Process Design
The physical and chemical properties of pyrolysis vapors dictate the design of the bio-oil
separation. The pyrolysis vapor quenching process serves to cool the vapors using water as a heat
sink and generate an aqueous phase (BOAP) to be fed into the MEC. Figure 4.1 shows a simple
block diagram of the Quench process. Prior to entering the Quench column, the pyrolysis vapors
are sent to a cyclone separator to remove particulate matter.
Figure 4.1. Simple block diagram of pyrolysis oil vapor quenching process

53
The quenching process separates the pyrolysis vapor into liquid (bio-oil) and vapor phases
where the vapor is sent to a secondary quench column for further separation. The bio-oil is pumped
into an air-cooled heat exchanger for cooling and then split into three streams: feed to hydrotreater,
feed to MEC, and a recycle stream back to the first quench column. Almost all of the bio-oil is
recycled back to the first quench column so that the entering pyrolysis vapor can be reasonably
condensed given its high temperature (813˚F) and mass flow rate. The vapor sent to the secondary
quench column is separated into remaining bio-oil and NCG (off-gas for steam reforming). All of
this bio-oil is mixed with the bio-oil stream split from the first quench column. A simple process
flow diagram of the of pyrolysis oil vapor quenching can be seen in Figure 4.2 below.
Figure 4.2. Simple process flow diagram of pyrolysis oil vapor quenching
4.2 MEC Aspen Model Process Design
To achieve a phenol and furan compound concentration near 1 g/L, a dilution stream is
mixed with the bio-oil streams from each quench column. This is required do to the inhibitory

54
nature of these compounds as discussed in Chapter 3. The combination of these streams is cooled
to room temperature before entering the MEC reactor. Cooling is crucial since the bio-oil entering
this section of the design is at a temperature too high for the bacteria to make the conversion
efficiently, let alone survive. A simple process flow diagram of the MEC Aspen model can be
seen below in Figure 4.3.
Figure 4.3. Simple process flow diagram of MEC Aspen model
Here, the MEC reactor is placed simply as a means of bio-oil conversion to further assess
its integration into the baseline biorefinery process. It is specifically designed within this
simulation to produce the exact amount of hydrogen needed to make up for natural gas
minimization in steam reforming. The reactor converts components within the incoming bio-oil
stream (crotonic acid, 1,4-benzenediol, acetol, vanillin, isoeugenol, levoglucosan, cellobiose) into
carbon dioxide and hydrogen gas. The MEC reactor is modeled as a stoichiometric reactor
requiring a reaction temperature (86˚F), pressure (14.7 psia), stoichiometry, and fractional
conversion. The fractional conversion of each substrate was set at 45% (total efficiency). From
there, the hydrogen gas is be separated from the remaining unconverted bio-oil via a flash drum.
Meanwhile, 5% of the remaining stream exits as wastewater and the other 95% enters a flash drum
55
separating bio-oil from NCG (to the atmosphere). This remaining unconverted bio-oil stream is
split 9:1 such that the smaller portion is recycled back the MEC and the larger portion is recycled
back to the second quench column. The ratio for the wastewater split is set so that the additional
water added to the system not found in the PNNL report (pyrolysis oil cooling/quenching water)
is removed. The flash drum after the MEC merely functions to simulate the separation of hydrogen
from other products. Within a practical MEC, hydrogen is produced in the cathode, thus it would
already be separated from any non-converted reactants in the anode. The splitter after this flash
drum serves a similar purpose, simulating the removal water from the anode.
4.3 Quench-MEC System Results
Water-soluble bio-oil from the pyrolysis oil vapor quenching process is fed to the simulated
MEC system at flow rate of 23,057 lb/hr. To dilute the isoeugenol (phenolic compound) within
this feed to 1 g/L, a minimum dilution flow rate of 3.4 × 10⁴ lb/hr is required. The simulated
MEC produces 1,768 lb/hr of hydrogen. This value is on target with the hydrogen production
needed for making up for natural gas minimization in steam reforming. As a result of the MEC
recirculation loop and the fractional conversion set in the MEC reactor, 51.6% of unreacted bio-
oil is recycled back to the second quench column.
4.4 Stage Fractionation
4.4.1 Pollard Process Design
The simulated design is based on the fractionating bio-oil recovery system developed at
Iowa State University’s BioCentury Research Farm (Pollard et al., 2012). Their design is based
on many practical assumptions, the most pertinent of which will be discuss here. Firstly, their

56
design was created considering that fast pyrolysis creates vapors and aerosols, where vapors are
assumed to be carbohydrate polymers and aerosols are non-volatile, lignin-derived oligomers.
Essentially, condenser stages were designed to recover vapors based on their dew point
temperatures and electrostatic precipitators (ESP) to recover aerosols, see figure below. Because
of this approach the temperature of the vapor going from condenser to ESP decreases as well as
the bio-oil exiting each respective unit.
Figure 4.4. Bio-oil stage fractionation process flow diagram (Pollard et al., 2012)
Figure 4.1 shows a flow diagram of the bio-oil collection process along with relevant
upstream processes. First, a continuous stream of biomass feedstock (in this case red oak) enters
a gravimetric feeder connected in conjunction with a fluidized bed pyrolyzer. In this section, the
biomass is reduced from the original solid structure matter to a more granular mixture before being
fluidized. At 500˚C, the mixture is fluidized in the fast pyrolysis reactor and purged with nitrogen.
The resulting exit stream is a high temperature pyrolysis vapor, aerosol, and solid mixture. Due
to the catalytic effects solids have on the bio-oil downstream and potential equipment damage

57
(blockage, erosion, etc.), they are removed by a series of two cyclone filters before entering the
fractionation process.
From there, the bio-oil enters the first condenser, a shell-and-tube heat exchanger where
the pyrolysis vapors enter on the tube side and the coolant on the shell side. The coolant water
used in the heat exchanger is fed at 85˚C which allowed the now condensed bio-oil flow by gravity
to the collection pot at the bottom of the condenser and exit as SF1 (Pollard et al., 2012). The
remaining vapor leaves the first condenser at 102˚C and enters the first ESP where aerosols from
pyrolysis and the first heat exchanger are removed. This ESP is operated at 129˚C to prevent
condensation of remaining vapors. The two proceeding heat exchangers and ESP are operated in
such a way to achieve a desired separation.
Theoretically, the “heavy ends” are separated in SF1 and contain most of the oligomeric
compounds. The “middle cuts” come out in SF2 through SF4 and contain most of the phenolic and
furan compounds. The “light oxygenates” come out in SF5 and are also referred to as the aqueous
phase, as this collection contains the highest liquid moisture by weight percent. Additionally,
NCG generated from pyrolysis can be recovered from the final heat exchanger after being
separated from the remaining aerosols in the glass wool filter. Various analysis techniques were
used such as gas chromatography, mass spectroscopy, and many more to determine the
effectiveness of this separation technique. Moisture content, water-soluble content, solids content,
and kinematic viscosity of the bio-oil in each stage fraction were determined.
4.4.2 Stage Fractionation Simulation
A series of water-cooled heat exchangers were implemented to lower the temperature of
the pyrolysis vapor prior to condensing the vapor using five flash drum vessels. To achieve the

58
desired separation of condensed bio-oil in the five stage fractions, the drums were set at flash
temperatures to match the ratio of each component separated as in Pollard. Thus, recovering bio-
oil from stage fraction 1 (SF1) and stage fraction 5 (SF5) to be used downstream in the MEC and
recycled NCG to be used to cool down the pyrolysis vapor entering the SF process was the goal.
Stage fractions 2 through 4, remaining bio-oil, are sent to the hydrotreating section of the
biorefinery to be upgraded. Figure 4.2 show the flow diagram from the simulation.
Figure 4.5. Bio-oil stage fractionation simulation process flow diagram
The pyrolysis vapor (same composition as Quench-MEC pyrolysis vapor stream) enters
the fractionation process at 433.8˚C and 1.22 bar. This stream is progressively cooled using three
heat exchangers before any stage fraction is removed. The coolant for the first heat exchanger is
the intermediate vapor stream between RESEP1 and RESEP 2 (the first and second stage
fractionators, flash drums). The coolant for the second heat exchanger is a recycled NCG stream
from the tail end of the fractionation system. The final heat exchanger before entering the first
fractionator reduces the temperature of the pyrolysis vapor from 353˚C to 140˚C using a water
coolant.

59
The temperatures at which each flash drum is operated within the model is based on
matching the ratio of components within each respective SF stream and the ratio of each respective
SF total determined by Pollard. The temperature at which the modeled condensers are set are
based on dew point temperature. The bio-oil recovery system was designed to operate above the
dew point for acetic acid such that it is absorbed from the gas flow by water condensing in stage
5 (Pollard et al., 2012).
The pyrolysis vapor then enters RESEP1, a fractionator modeled as a flash drum. The
drum is operated at 102˚C and 1.01 bar with a liquid entrainment in the vapor stream of 0.5. SF1
(condensed bio-oil) and S3 (remaining vapor are the resulting streams following the first flash
drum. S3 is then heated by heat exchanger B4 from 102˚C to 129˚C. Within the model program,
B4 essentially closes the loop of the incoming pyrolysis vapor and is referred to as the default
“nesting block” with Aspen Plus.
After this heat exchanger block, the remaining vapor enters RESEP2, which is operated at
102˚C and 1.01 bar with a liquid entrainment in the vapor stream of 0.2. SF2 (condensed bio-oil)
and S5 (remaining vapor) are the resulting streams following this flash drum. S5 is then cooled
from 102˚C to 90˚C before enter RESEP3 and RESEP4. These next two flash drums are operated
at the same temperature, pressure, and liquid entrainment in the vapor stream being 80˚C, 1.01 bar,
and 0. RESEP3 results in SF3 (condensed bio-oil) and S7 (remaining vapor), the latter being fed
into RESEP4 which results in SF4 (condensed bio-oil) and S8 (remaining vapor). S8 is then cooled
from 102˚C to 50˚C before entering the final flash drum RESEP5, operated at 40˚C, 1.01 bar, and
a liquid entrainment in the vapor stream of 0. This final flash drum results in SF5 (condensed bio-
oil) and a NCG stream. The NCG stream is recycle to the front of the bio-oil fractionation system
and is used as a coolant for the second heat exchanger in cooling the pyrolysis vapor stream. 2%

60
of this stream is spilt outand sent to the steam reformation process and the rest is recycled by being
mixed with the initial incoming pyrolysis vapor stream closing the loop. SF5 is mixed with SF1
and a dilution stream then sent to the MEC Component System. This cooled stream is then mixed
with a recycle stream of non-reacted bio-oil and is then pumped into the MEC reactor.
4.5 Comparison of Separation Results with ISU Process
A paper published in December of 2015 used the design from the Pollard paper to explore
the techno-economic feasibility of biofuel, biochemical, and hydrocarbon chemicals product
pathways from a biomass fast pyrolysis biorefinery (W. Hu, 2016). Their work was all simulated
and began with a similar basis as in the PNNL report with a biomass feedstock of 2000 dry metric
tons per day, in this case red oak instead of pinewood. The upstream process, biomass conversion,
prior to bio-oil fractionation is slightly different from the PNNL report and Pollard processes, seen
in Figure 4.4 below.
Figure 4.6. Hu biomass conversion system (W. Hu, 2016)

61
Here, biomass is feed into a chopper then dried in an oven reducing the moisture content
to less than 7 wt.%. A steam generator provides the heat for this process and the pyrolysis reaction
along with fluidizing gas. After being dried out the remaining substance goes through a grinder
and is then fed into the fluidized bed reactor, where fast pyrolysis take place. The product stream
of this process is then fed into a cyclone similar to the PNNL report where the resulting streams
are pyrolysis vapor and char. This leads straight into the bio-oil fractionation process which is
more or less the same as Pollard, see in Figure 4.5 below.
Figure 4.7. Hu bio-oil fractionation system (W. Hu, 2016)
Their process was simulated using Aspen Plus to calculate stage fraction yields. This result
gives insight into how the biomass was being distributed in SF1-SF5, NCG, and char. As
mentioned in Chapter 1, feedstock information from the process comes from the PNNL report.

62
Table 4.1 Flash temperature variation
Stage Temperature (˚C)
Run SF 1 SF 2 SF 3 SF 4 SF 5
1 102 102 80 80 18
2 112 102 80 80 18
3 92 102 80 80 18
4 75 75 60 60 40
5 65 65 60 60 50
6 65 63 60 60 45
7 65 63 60 60 50
8 102 129 77 77 18
A variety of temperature settings for each stage fractionation flash drum was used to both
access the effects of flash temperature on separation and matching ISU bio-oil distribution. See
Table 4.1 above. Run 1 temperatures are those used by ISU for the simulation of the fractionation
process. This run was used as a starting point to evaluate the initial accuracy of our simulation.
Run 5 results showed the closest weight percent distribution for bio-oil in each stage fraction. See
Table 4.2 below.
Table 4.2 Stage fraction bio-oil distribution comparison
Integration of this process into the baseline biorefinery is still being explored. This
includes the appropriate distribution of bio-oil and NCG to the hydrotreating section and the steam
Stage
Fraction
ISU Data
(wt% bio-oil)
Run 5 Data
(wt% bio-oil)
1 20.9% 25.8%
2 25.4% 20.6%
3 3.3% 2.7%
4 8.4% 6.2%
5 42.0% 44.6%

63
reforming. Additionally, integration of this system with the MEC concerning the recycling of non-
converted bio-oil still needs to be accessed.

64
CHAPTER 5
INTEGRATION OF STEAM REFORMING OF HYDROCARBON GASES
WITH BIO-OIL SEPARATION AND MEC
5.1 Bio-oil Separation and Steam Reforming
Within the baseline biorefinery process, oxygen is removed from compounds within the
bio-oil by a reaction called hydrodeoxygenation. The overall process, hydrotreating, is the
upgrading of bio-oil to more infrastructure-compatible fuels (hexane, pentane, etc.). To achieve
this, the bio-oil reacts with compressed hydrogen gas and a catalyst. For this process, bio-oil
separation provides bio-oil and SMR provides hydrogen. Essentially, this process connects the
steam reforming of hydrocarbon gases and bio-oil separation. A simple flow diagram of the
relationship between bio-oil separation, SMR, and hydrotreating can be seen below in Figure 5.1.
Figure 5.1 Simple diagram of the relationship between bio-oil separation, SMR, and
hydrotreating processes

65
With the integration of the MEC to this process, the relationship between steam reforming
and bio-oil separation is altered. The MEC is integrated between bio-oil separation and
hydrotreating; however, bio-oil separation provides NCG to steam reforming. Due to the
portioning of BOAP to the MEC, the amount of this NCG produced is changed.
Figure 5.2 Simple diagram of the relationship between bio-oil separation, MEC, steam
reforming, and hydrotreating processes
5.2 Process Design Change Results
Integration of the steam reforming, bio-oil separation, and MEC simulations with one
another result in an alternative system than what is presented in the PNNL report. By designing
these three processes to fit into the PNNL report process seamlessly, the effects each simulation
has on the other provides a look at how the baseline biorefinery would be altered. Thus far, it has
been made apparent that minimizing natural gas for steam reforming causes various changes in
system output, the most notable being a decrease in hydrogen production.
By integrating the Quench-MEC process with the PNNL process, there is a change in
amount of NCG flow rate produced from quenching pyrolysis vapor. The simulation of this process

66
resulted in an 4.70 % decrease in off-gas portioned to the steam reforming process compared to
the PNNL report (Stream 170). Results show the simulation of this process had little effect on the
hydrogen production rate from the two reforming simulations. There was a 0.080 % reduction in
hydrogen production via natural gas steam reforming (9,818 lb/hr) and a 0.013% reduction in
hydrogen production via off-gas reforming (8,067 lb/hr). Thus, for the natural gas steam reforming
process, hydrogen demand for the plant is still satisfied despite the slight decrease in off-gas to the
reformer and combustor.
Due to the distribution of bio-oil to the MEC after vapor quenching, there is a reduction in
bio-oil fed to the hydrotreating section of the system. 19.5% of the bio-oil from quenching is
utilized as feedstock for the MEC. The split fraction of the bio-oil back to the first quench column
(Stream 138-1) essentially creates a loop of the bio-oil that can be adjusted for the proper flow of
remaining bio-oil to the hydrotreating section.

67
CHAPTER 6
CONCLUSIONS AND RECOMMENDATIONS
6.1 Conclusions
Utilization of BOAP derived from pyrolysis vapor within a biorefinery for the production
of hydrogen gas by means of a MEC has been proposed. By simulating hydrogen production via
natural gas and off-gas steam reforming within the baseline biorefinery a mass and energy balance
was derived. Effects of the minimization of natural gas in steam reforming showed that a hydrogen
production rate of 1,723 lb/hr is required by the MEC to meet total biorefinery demand. A flow
rate of about 23,000 lb/hr of an aqueous bio-oil stream from condensed pyrolysis vapor was
determined through the modeling of a MEC considering practical limitations as a sufficient
substrate for hydrogen production to meet this demand. From a mass and energy balance derived
from the simulation of the integration of a bio-oil separation system and MEC into the baseline
biorefinery a technoeconomic analysis (TEA) was performed to access economic feasibility. TEA
showed that hydrogen can be generated for a minimum hydrogen selling price of $ 3.35/kg-H₂.
These results show the practical derivation of hydrogen production from an aqueous phase bio-oil
stream derived from a biomass source.
Alternative means of bio-oil separation via stage fractionation was additionally proposed.
The integration of this process into the baseline biorefinery process shows potential for specificity
in bio-oil utilization. The process models developed for MEC, steam reforming and pyrolysis
vapor quenching have laid the ground work for further work to understand the effect of MEC on
the overall biorefinery process.

68
6.2 Recommendations
Further work into determining proper separation of BOAP based on the dew point of bio-
oil components could benefit reducing moisture content before hydrodeoxygenation. Effects of
this on bio-oil upgrading could also be explored via a mass and energy balance from the full
simulation of the hydrotreating process. Additionally, the potential NCG recovered from pyrolysis
vapor via stage fractionation could have an effect on the amount fed to steam reforming and as a
result, the total hydrogen production.
The simulation of the hydrocracking and product separation processes could also explore
the effects of the reduction in bio-oil due to MEC integration on the total hydrocarbon fuel
produced by the biorefinery. This could potentially result in the decrease of required heating
and/or cooling utilities for these processes and bio-oil upgrading. The off-gas produced by these
processes would be subject to change and would thus result in a difference in hydrogen production
via steam reforming.
The tradeoff between fuel yield and natural gas requirement in the baseline biorefinery can
be further explored due to the minimization of natural gas to the steam reforming process.
Essentially, this is the benefit of the proposed design. As fuel yield in hydrotreating increases, less
off-gas is produced. Thus, with less off-gas for hydrogen production, more natural gas is need to
meet demands. Though fuel yield is expected to decrease slightly due to the integration of the
MEC, natural gas required to meet biorefinery demands have been minimized and made up for by
the MEC. Furthermore, the full effect of the proposed design could be determined with the
simulation of the entire biorefinery.

69
REFERENCES

70
Ahn, Y., & Logan, B. (2013). Altering anode thickness to improve power production in
microbial fuel cells with different electrode distances. Energy & Fuels, 27, 271–276.
https://doi.org/10.1021/ef3015553
Angenent, L. T., Karim, K., Al-dahhan, M. H., Wrenn, B. A., & Domı, R. (2004). Production of
bioenergy and biochemicals from industrial and agricultural wastewater, 22(9).
https://doi.org/10.1016/j.tibtech.2004.07.001
Borole, A. P. (2010). Microbial fuel cell with improved anode. US Patent 7,695,824.
Borole, A. P. (2015). Microbial Fuel Cells and Microbial Electrolyzers. The Electrochemical
Society Interface, 55–59. https://doi.org/10.1149/2.F04153if
Borole, A. P., Hamilton, C. Y., Vishnivetskaya, T. A., Leak, D., Andras, C., Morrell-Falvey, J.,
… Davison, B. (2009). Integrating engineering design improvements with exoelectrogen
enrichment process to increase power output from microbial fuel cells. Journal of Power
Sources, 191(2), 520–527. https://doi.org/10.1016/j.jpowsour.2009.02.006
Borole, A. P., & Lewis, A. J. (2017). Proton transfer in microbial electrolysis cells. Sustainable
Energy Fuels, 1, 725–736. https://doi.org/10.1039/C7SE00034K
Borole, A. P., & Mielenz, J. R. (2011). Estimating hydrogen production potential in biorefineries
using microbial electrolysis cell technology. International Journal of Hydrogen Energy,
36(22), 14787–14795. https://doi.org/10.1016/j.ijhydene.2011.03.152
Borole, A. P., Ringeisen, B., Wang, Z.-W., Feng, Y., & Kim, B. H. (2011). Electroactive
biofilms: Current status and future research needs. Energy & Environmental Science, 4(12),
4813. https://doi.org/10.1039/c1ee02511b
Cheng, S., & Logan, B. E. (2007). Sustainable and efficient biohydrogen production via
electrohydrogenesis. Proceedings of the National Academy of Sciences, 104(47), 18871–
18873. https://doi.org/10.1073/pnas.0706379104
Daud, S. M. ariam, Kim, B. H. ong, Ghasemi, M., & Daud, W. R. amli W. (2015). Separators
used in microbial electrochemical technologies: Current status and future prospects.
Bioresource Technology, 195, 170–179. https://doi.org/10.1016/j.biortech.2015.06.105
Escapa, A., Gómez, X., Tartakovsky, B., & Morán, A. (2012). Estimating microbial electrolysis
cell (MEC) investment costs in wastewater treatment plants: Case study. International
Journal of Hydrogen Energy. https://doi.org/10.1016/j.ijhydene.2012.09.157
Escapa, A., Mateos, R., Martínez, E. J., & Blanes, J. (2016). Microbial electrolysis cells: An
emerging technology for wastewater treatment and energy recovery. from laboratory to pilot
plant and beyond. Renewable and Sustainable Energy Reviews, 55, 942–956.
https://doi.org/10.1016/j.rser.2015.11.029
Escapa, A., San-Martin, M. I., Mateos, R., & Moran, A. (2015). Scaling-up of membraneless
microbial electrolysis cells (MECs) for domestic wastewater treatment: Bottlenecks and
limitations. Bioresource Technology, 180, 72–78.
https://doi.org/10.1016/j.biortech.2014.12.096
Gil-Carrera, L., Escapa, A., Mehta, P., Santoyo, G., Guiot, S. R., Mor??n, A., & Tartakovsky, B.
(2013). Microbial electrolysis cell scale-up for combined wastewater treatment and
hydrogen production. Bioresource Technology, 130, 584–591.
https://doi.org/10.1016/j.biortech.2012.12.062
Harnisch, F., & Schröder, U. (2010). From MFC to MXC: chemical and biological cathodes and
their potential for microbial bioelectrochemical systems. Chemical Society Reviews, 39(11),
4433. https://doi.org/10.1039/c003068f
Harnisch, F., Schröder, U., Quaas, M., & Scholz, F. (2009). Electrocatalytic and corrosion

71
behaviour of tungsten carbide in near-neutral pH electrolytes. Applied Catalysis B:
Environmental, 87(1–2), 63–69. https://doi.org/10.1016/j.apcatb.2008.08.016
Heidrich, E. S., Edwards, S. R., Dolfing, J., Cotterill, S. E., & Curtis, T. P. (2014). Performance
of a pilot scale microbial electrolysis cell fed on domestic wastewater at ambient
temperatures for a 12month period. Bioresource Technology, 173, 87–95.
https://doi.org/10.1016/j.biortech.2014.09.083
Hu, H., Fan, Y., & Liu, H. (2009). Hydrogen production in single-chamber tubular microbial
electrolysis cells using non-precious-metal catalysts. International Journal of Hydrogen
Energy, 34(20), 8535–8542. https://doi.org/10.1016/j.ijhydene.2009.08.011
Hu, W. (2016). Comparative techno-economic analysis of advanced biofuels, biochemicals, and
hydrocarbon chemicals via the fast pyrolysis platform.
https://doi.org/10.1080/17597269.2015.1118780
Ichihashi, O., Vishnivetskaya, T. A., & Borole, A. P. (2014). High-Performance Bioanode
Development for Fermentable Substrates via Controlled Electroactive Biofilm Growth.
ChemElectroChem, 1(11), 1940–1947. https://doi.org/10.1002/celc.201402206
Imam, T., & Capareda, S. (2012). Characterization of bio-oil, syn-gas and bio-char from
switchgrass pyrolysis at various temperatures. Journal of Analytical and Applied Pyrolysis,
93, 170–177. https://doi.org/10.1016/j.jaap.2011.11.010
Jafary, T., Daud, W. R. W., Ghasemi, M., Kim, B. H., Md Jahim, J., Ismail, M., & Lim, S. S.
(2015). Biocathode in microbial electrolysis cell; Present status and future prospects.
Renewable and Sustainable Energy Reviews, 47, 23–33.
https://doi.org/10.1016/j.rser.2015.03.003
Jeremiasse, A. W. (2009). The use of biocompatible buffers to reduce the concentration
overpotential for hydrogen evolution Adriaan W. Jeremiasse, 43(17), 6–8.
Jones, S., Meyer, P., Snowden-swan, L., Tan, E., Dutta, A., Jacobson, J., & Cafferty, K. (2013).
Process Design and Economics for the Conversion of Lignocellulosic Biomass to
Hydrocarbon Fuels Fast Pyrolysis and Hydrotreating. PNNL Report, PNNL-23053(March),
97. https://doi.org/PNNL - 23053 NREL/TP - 5100 - 61178
Kadier, A., Simayi, Y., Abdeshahian, P., Farhana, N., Chandrasekhar, K., & Sahaid, M. (2016).
REVIEW A comprehensive review of microbial electrolysis cells ( MEC ) reactor designs
and configurations for sustainable hydrogen gas production. Alexandria Engineering
Journal, 55(1), 427–443. https://doi.org/10.1016/j.aej.2015.10.008
Keller, J., & Rabaey, K. (2008). Experiences from MFC pilot plant operation - Microbial Fuel
Cells. In MFC Symposium.
Kundu, A., Sahu, J. N., Redzwan, G., & Hashim, M. A. (2013). An overview of cathode material
and catalysts suitable for generating hydrogen in microbial electrolysis cell. International
Journal of Hydrogen Energy, 38(4), 1745–1757.
https://doi.org/10.1016/j.ijhydene.2012.11.031
Kyazze, G., Popov, A., Dinsdale, R., Esteves, S., Hawkes, F., Premier, G., & Guwy, A. (2010).
Influence of catholyte pH and temperature on hydrogen production from acetate using a two
chamber concentric tubular microbial electrolysis cell. International Journal of Hydrogen
Energy, 35(15), 7716–7722. https://doi.org/10.1016/j.ijhydene.2010.05.036
Lewis, A. J., & Borole, A. P. (2016). Understanding the impact of flow rate and recycle on the
conversion of a complex biorefinery stream using a flow-through microbial electrolysis cell.
Biochemical Engineering Journal, 116, 95–104. https://doi.org/10.1016/j.bej.2016.06.008
Lewis, A. J., Ren, S., Ye, X., Kim, P., Labbe, N., & Borole, A. P. (2015). Hydrogen production

72
from switchgrass via an integrated pyrolysis-microbial electrolysis process. Bioresource
Technology, 195, 231–241. https://doi.org/10.1016/j.biortech.2015.06.085
Liu, H., Grot, S. and Logan, B. E., Liu, H., Grot, S., & Logan, B. E. (2005). E lectrochemically
assisted microbial production of hydrogen from acetate. Environ. Sci. Technol., 39(11),
4317–4320. https://doi.org/10.1021/es050244p
Logan, B. E., Call, D., Cheng, S., Hamelers, H. V. M., Sleutels, T. H. J. A., Jeremiasse, A. W., &
Rozendal, R. A. (2008). Microbial Electrolysis Cells for High Yield Hydrogen Gas
Production from Organic Matter Critical Review Microbial Electrolysis Cells for High
Yield Hydrogen Gas Production from Organic Matter. Environ. Sci. Technol, 42(23), 8630–
8640. https://doi.org/10.1021/es801553z
Logan, B. E., Hamelers, B., Rozendal, R., Schröder, U., Keller, J., Freguia, S., … Rabaey, K.
(2006). Microbial fuel cells: Methodology and technology. Environmental Science and
Technology. https://doi.org/10.1021/es0605016
Lu, L., Hou, D., Fang, Y., Huang, Y., & Ren, Z. J. (2016). Nickel based catalysts for highly
efficient H2 evolution from wastewater in microbial electrolysis cells. Electrochimica Acta,
206, 381–387. https://doi.org/10.1016/j.electacta.2016.04.167
Milne, T., Agblevor, F., Davis, M., Deutch, S., & Johnson, D. (1997). A review of the chemical
composition of fast-pyrolysis oils from biomass. National Renewable Energy Laboratory,
409–424. https://doi.org/10.1016/S0140-6701(98)96619-X
Ortiz-toral, P. J. (2008). Steam Reforming of Bio-Oil: Effect of Bio-Oil Composition and
Stability. Graduate Theses and Dissertations, 3289–3297.
https://doi.org/10.1021/ef200628q
Pannell, T. C., Goud, R. K., Schell, D. J., & Borole, A. P. (2016). Effect of fed-batch vs.
continuous mode of operation on microbial fuel cell performance treating biorefinery
wastewater. Biochemical Engineering Journal, 116, 85–94.
https://doi.org/10.1016/j.bej.2016.04.029
Pham, H. T., Boon, N., Aelterman, P., Clauwaert, P., De Schamphelaire, L., Van Oostveldt, P.,
… Verstraete, W. (2008). High shear enrichment improves the performance of the
anodophilic microbial consortium in a microbial fuel cell. Microbial Biotechnology, 1(6),
487–496. https://doi.org/10.1111/j.1751-7915.2008.00049.x
Pisciotta, J. M., Zaybak, Z., Call, D. F., Nam, J. Y., & Logan, B. E. (2012). Enrichment of
microbial electrolysis cell biocathodes from sediment microbial fuel cell bioanodes. Applied
and Environmental Microbiology, 78(15), 5212–5219. https://doi.org/10.1128/AEM.00480-
12
Pollard, A. S., Rover, M. R., & Brown, R. C. (2012). Characterization of bio-oil recovered as
stage fractions with unique chemical and physical properties. Journal of Analytical and
Applied Pyrolysis. https://doi.org/10.1016/j.jaap.2011.10.007
Ren, L., Siegert, M., Ivanov, I., Pisciotta, J. M., & Logan, B. E. (2013). Treatability studies on
different refinery wastewater samples using high-throughput microbial electrolysis cells
(MECs). Bioresource Technology, 136, 322–328.
https://doi.org/10.1016/j.biortech.2013.03.060
Rozendal, R. A., Hamelers, H. V. M., Rabaey, K., Keller, J., & Buisman, C. J. N. (2008).
Towards practical implementation of bioelectrochemical wastewater treatment. Trends in
Biotechnology. https://doi.org/10.1016/j.tibtech.2008.04.008
Simpson, A. P., & Lutz, A. E. (2007). Exergy analysis of hydrogen production via steam
methane reforming. International Journal of Hydrogen Energy, 32(18), 4811–4820.
73
https://doi.org/10.1016/j.ijhydene.2007.08.025
Sleutels, T. H. J. A., Ter Heijne, A., Buisman, C. J. N., & Hamelers, H. V. M. (2012).
Bioelectrochemical systems: An outlook for practical applications. ChemSusChem, 5(6),
1012–1019. https://doi.org/10.1002/cssc.201100732
Tomasini, D., Cacciola, F., Rigano, F., Sciarrone, D., Donato, P., Beccaria, M., … Mondello, L.
(2014). Complementary analytical liquid chromatography methods for the characterization
of aqueous phase from pyrolysis of lignocellulosic biomasses. Analytical Chemistry, 86(22),
11255–11262. https://doi.org/10.1021/ac5038957
Zeng, X., Borole, A. P., & Pavlostathis, S. G. (2015). Biotransformation of Furanic and Phenolic
Compounds with Hydrogen Gas Production in a Microbial Electrolysis Cell. Environmental
Science & Technology, 49(22), 13667–13675. https://doi.org/10.1021/acs.est.5b02313
Zeng, X., Borole, A. P., & Pavlostathis, S. G. (2016). Inhibitory E ff ect of Furanic and Phenolic
Compounds on Exoelectrogenesis in a Microbial Electrolysis Cell Bioanode.
https://doi.org/10.1021/acs.est.6b01505
Zeng, X., Borole, A. P., & Pavlostathis, S. G. (2016). Inhibitory Effect of Furanic and Phenolic
Compounds on Exoelectrogenesis in a Microbial Electrolysis Cell Bioanode. Environmental
Science & Technology, 50(20), 11357–11365. https://doi.org/10.1021/acs.est.6b01505
Zeng, X., Borole, A. P., & Pavlostathis, S. G. (2016). Performance evaluation of a continuous-
flow bioanode microbial electrolysis cell fed with furanic and phenolic compounds. RSC
Adv., 6(70), 65563–65571. https://doi.org/10.1039/C6RA13735K
Zeng, X., Collins, M. A., Borole, A. P., & Pavlostathis, S. G. (2017). The extent of fermentative
transformation of phenolic compounds in the bioanode controls exoelectrogenic activity in a
microbial electrolysis cell. Water Research, 109, 299–309.
https://doi.org/10.1016/j.watres.2016.11.057

74
APPENDIX

75
Figure A1. Mass and Energy Balance: Hydrogen Production via Steam Reforming w/ Natural Gas

76
Figure A1. continued
170 170+602 250 532 600 601 602 609 610
Mass Flow lb/hr
WATER 45 137 0 0 109 17 92 137 4854
HYDROGEN 4 1789 8899 1001 2117 332 1785 1789 0
OXYGEN 0 0 0 0 0 0 0 0 56268
NITROGEN 0 0 0 0 0 0 0 0 183635
ARGON 0 0 0 0 0 0 0 0 3129
CO 5551 6060 0 0 604 95 509 6060 0
CO2 5231 15450 0 0 12122 1903 10219 15450 114
METHANE 737 5604 0 0 5773 906 4867 5604 0
ETHANE 101 4244 0 0 4914 771 4143 4244 0
PROPANE 2 2448 0 0 2902 456 2446 2448 0
N-BUT-02 0 2458 0 0 2916 458 2458 2458 0
N-PEN-01 0 2237 0 0 2654 417 2237 2237 0
ISOBU-01 0 0 0 0 0 0 0 0 0
ETHYLENE 233 234 0 0 1 0 1 234 0
PROPENE 162 164 0 0 2 0 2 164 0
HYDRO-01 0 18 0 0 21 3 18 18 0
NO2 0 0 0 0 0 0 0 0 0
CROTO-01 2 2 0 0 0 0 0 2 0
VANIL-01 8 8 0 0 0 0 0 8 0
ACETO-01 0 0 0 0 0 0 0 0 0
2-MET-01 0 0 0 0 0 0 0 0 0
PYRID-01 0 0 0 0 0 0 0 0 0
N-HEX-01 0 844 0 0 1001 157 844 844 0
N-DOD-01 0 2 0 0 2 0 2 2 0
3-MET-01 0 150 0 0 178 28 150 150 0
4-MET-01 0 16 0 0 19 3 16 16 0
ETHYL-01 0 93 0 0 110 17 93 93 0
1-MET-01 0 69 0 0 82 13 69 69 0
CYCLO-01 0 241 0 0 286 45 241 241 0
N-BUT-01 0 6 0 0 7 1 6 6 0
BICYC-01 0 1 0 0 1 0 1 1 0
1:3-D-01 0 3 0 0 4 1 3 3 0
O-XYL-01 0 35 0 0 42 7 35 35 0
BENZE-01 0 3 0 0 4 1 3 3 0
4-MET-02 0 0 0 0 0 0 0 0 0
PYREN-01 0 0 0 0 0 0 0 0 0
1:2-D-01 0 0 0 0 0 0 0 0 0
INDAN-01 0 3 0 0 3 0 3 3 0
1:2:3-01 0 0 0 0 0 0 0 0 0
6-HEX-01 0 0 0 0 0 0 0 0 0
2:7-D-01 0 0 0 0 0 0 0 0 0
NAPHT-01 0 0 0 0 0 0 0 0 0
THYMO-01 0 0 0 0 0 0 0 0 0
DIMET-02 0 0 0 0 0 0 0 0 0
Total Flow lbmol/hr 383 2111 4414 497 2049 322 1728 2111 8664
Total Flow lb/hr 12076 42318 8899 1001 35874 5632 30242 42318 248000
Total Flow cuft/hr 110997 318406 99724 11216 315551 49542 266010 64814 3406640
Temperature F 162 244 150 150 258 258 258 687 90
Pressure psia 23 50 293 293 50 50 50 405 15
Vapor Frac 1.00 1.00 1.00 1.00 1.00 1.00 1.00 1.00 1.00
Liquid Frac 0.00 0.00 0.00 0.00 0.00 0.00 0.00 0.00 0.00
Solid Frac 0.00 0.00 0.00 0.00 0.00 0.00 0.00 0.00 0.00
Enthalpy Btu/lbmol -80687 -43130 513 513 -34802 -34802 -34802 -38144 -3196
Enthalpy Btu/lb -2560 -2151 255 255 -1988 -1988 -1988 -1902 -112
Enthalpy Btu/hr 30910000 91033000 2265540 254807 71319000 11197000 60122000 80508000 27692000

77
Figure A1. continued
611 630 650 651 662 667 671 672 672-1
Mass Flow lb/hr
WATER 4854 41567 0 137 97843 64791 64791 48133 48133
HYDROGEN 0 0 0 1789 1789 9783 9783 11647 11647
OXYGEN 56268 4985 0 0 0 0 0 0 0
NITROGEN 183635 183749 114 114 114 114 114 114 114
ARGON 3129 3129 0 0 0 0 0 0 0
CO 0 0 0 6060 6060 32608 32608 6708 6708
CO2 114 110868 54 15504 15504 35025 35025 75719 75719
METHANE 0 0 6149 11753 11753 4683 4683 4683 4683
ETHANE 0 0 405 4649 4649 0 0 0 0
PROPANE 0 0 180 2628 2628 0 0 0 0
N-BUT-02 0 0 47 2505 2505 0 0 0 0
N-PEN-01 0 0 6 2243 2243 0 0 0 0
ISOBU-01 0 0 36 36 36 0 0 0 0
ETHYLENE 0 0 0 234 234 0 0 0 0
PROPENE 0 0 0 164 164 0 0 0 0
HYDRO-01 0 21 0 18 18 18 18 18 18
NO2 0 0 0 0 0 0 0 0 0
CROTO-01 0 0 0 2 2 0 0 0 0
VANIL-01 0 0 0 8 8 0 0 0 0
ACETO-01 0 0 0 0 0 0 0 0 0
2-MET-01 0 0 6 6 6 0 0 0 0
PYRID-01 0 0 0 0 0 0 0 0 0
N-HEX-01 0 0 0 844 844 0 0 0 0
N-DOD-01 0 0 0 2 2 0 0 0 0
3-MET-01 0 0 0 150 150 0 0 0 0
4-MET-01 0 0 0 16 16 0 0 0 0
ETHYL-01 0 0 0 93 93 0 0 0 0
1-MET-01 0 0 0 69 69 0 0 0 0
CYCLO-01 0 0 0 241 241 0 0 0 0
N-BUT-01 0 0 0 6 6 0 0 0 0
BICYC-01 0 0 0 1 1 0 0 0 0
1:3-D-01 0 0 0 3 3 0 0 0 0
O-XYL-01 0 0 0 35 35 0 0 0 0
BENZE-01 0 0 0 3 3 0 0 0 0
4-MET-02 0 0 0 0 0 0 0 0 0
PYREN-01 0 0 0 0 0 0 0 0 0
1:2-D-01 0 0 0 0 0 0 0 0 0
INDAN-01 0 0 0 3 3 0 0 0 0
1:2:3-01 0 0 0 0 0 0 0 0 0
6-HEX-01 0 0 0 0 0 0 0 0 0
2:7-D-01 0 0 0 0 0 0 0 0 0
NAPHT-01 0 0 0 0 0 0 0 0 0
THYMO-01 0 0 0 0 0 0 0 0 0
DIMET-02 0 0 0 0 0 0 0 0 0
Total Flow lbmol/hr 8664 11621 408 2518 7942 10706 10706 10706 10706
Total Flow lb/hr 248000 344319 6997 49315 147021 147021 147021 147021 147021
Total Flow cuft/hr 3186360 7699000 5160 69301 321537 742776 350190 435794 403945
Temperature F 140 528 60 594 1110 1562 500 675 593
Pressure psia 18 16 415 415 415 314 314 300 300
Vapor Frac 1.00 1.00 1.00 1.00 1.00 1.00 1.00 1.00 1.00
Liquid Frac 0.00 0.00 0.00 0.00 0.00 0.00 0.00 0.00 0.00
Solid Frac 0.00 0.00 0.00 0.00 0.00 0.00 0.00 0.00 0.00
Enthalpy Btu/lbmol -2846 -53753 -32882 -37292 -74632 -41222 -50342 -50332 -51018
Enthalpy Btu/lb -99 -1814 -1916 -1904 -4032 -3002 -3666 -3665 -3715
Enthalpy Btu/hr 24661000 624630000 13407000 93915000 592720000 441310000 538950000 538850000 546190000

78
Figure A1. continued
672-2 680 681 682 690 706 721 723 730
Mass Flow lb/hr
WATER 48133 1714 46419 1714 0 203000 144380 144380 225650
HYDROGEN 11647 11647 0 1747 9900 0 0 0 0
OXYGEN 0 0 0 0 0 0 0 0 0
NITROGEN 114 114 0 114 0 0 0 0 0
ARGON 0 0 0 0 0 0 0 0 0
CO 6708 6708 0 6708 0 0 0 0 0
CO2 75719 75703 16 75703 0 0 0 0 0
METHANE 4683 4683 0 4683 0 0 0 0 0
ETHANE 0 0 0 0 0 0 0 0 0
PROPANE 0 0 0 0 0 0 0 0 0
N-BUT-02 0 0 0 0 0 0 0 0 0
N-PEN-01 0 0 0 0 0 0 0 0 0
ISOBU-01 0 0 0 0 0 0 0 0 0
ETHYLENE 0 0 0 0 0 0 0 0 0
PROPENE 0 0 0 0 0 0 0 0 0
HYDRO-01 18 18 0 18 0 0 0 0 0
NO2 0 0 0 0 0 0 0 0 0
CROTO-01 0 0 0 0 0 0 0 0 0
VANIL-01 0 0 0 0 0 0 0 0 0
ACETO-01 0 0 0 0 0 0 0 0 0
2-MET-01 0 0 0 0 0 0 0 0 0
PYRID-01 0 0 0 0 0 0 0 0 0
N-HEX-01 0 0 0 0 0 0 0 0 0
N-DOD-01 0 0 0 0 0 0 0 0 0
3-MET-01 0 0 0 0 0 0 0 0 0
4-MET-01 0 0 0 0 0 0 0 0 0
ETHYL-01 0 0 0 0 0 0 0 0 0
1-MET-01 0 0 0 0 0 0 0 0 0
CYCLO-01 0 0 0 0 0 0 0 0 0
N-BUT-01 0 0 0 0 0 0 0 0 0
BICYC-01 0 0 0 0 0 0 0 0 0
1:3-D-01 0 0 0 0 0 0 0 0 0
O-XYL-01 0 0 0 0 0 0 0 0 0
BENZE-01 0 0 0 0 0 0 0 0 0
4-MET-02 0 0 0 0 0 0 0 0 0
PYREN-01 0 0 0 0 0 0 0 0 0
1:2-D-01 0 0 0 0 0 0 0 0 0
INDAN-01 0 0 0 0 0 0 0 0 0
1:2:3-01 0 0 0 0 0 0 0 0 0
6-HEX-01 0 0 0 0 0 0 0 0 0
2:7-D-01 0 0 0 0 0 0 0 0 0
NAPHT-01 0 0 0 0 0 0 0 0 0
THYMO-01 0 0 0 0 0 0 0 0 0
DIMET-02 0 0 0 0 0 0 0 0 0
Total Flow lbmol/hr 10706 8129 2577 3218 4911 11268 8014 8014 12525
Total Flow lb/hr 147021 100587 46435 90687 9900 203000 144380 144380 225650
Total Flow cuft/hr 229190 182175 1015 69064 110940 4766 4158 64167 160999
Temperature F 250 150 150 150 150 283 496 496 499
Pressure psia 298 293 293 293 293 685 675 675 675
Vapor Frac 0.83 1.00 0.00 0.98 1.00 0.00 0.00 0.61 1.00
Liquid Frac 0.17 0.00 1.00 0.02 0.00 1.00 1.00 0.39 0.00
Solid Frac 0.00 0.00 0.00 0.00 0.00 0.00 0.00 0.00 0.00
Enthalpy Btu/lbmol -56760 -39051 -122670 -99811 513 -119860 -114900 -106700 -101440
Enthalpy Btu/lb -4133 -3156 -6808 -3542 255 -6653 -6378 -5923 -5631
Enthalpy Btu/hr 607660000 317440000 316110000 321180000 2520350 1350600000 920850000 855160000 1270600000

79
Figure A1. continued
733 743 752 752-0 790 791 LIQUID S3 S6
Mass Flow lb/hr
WATER 127944 203000 203000 203000 29700 29700 0 97706 41567
HYDROGEN 0 0 0 0 0 0 0 0 0
OXYGEN 0 0 0 0 0 0 0 0 4985
NITROGEN 0 0 0 0 0 0 0 0 183749
ARGON 0 0 0 0 0 0 0 0 3129
CO 0 0 0 0 0 0 0 0 0
CO2 0 0 0 0 0 0 0 0 110868
METHANE 0 0 0 0 0 0 0 0 0
ETHANE 0 0 0 0 0 0 0 0 0
PROPANE 0 0 0 0 0 0 0 0 0
N-BUT-02 0 0 0 0 0 0 0 0 0
N-PEN-01 0 0 0 0 0 0 0 0 0
ISOBU-01 0 0 0 0 0 0 0 0 0
ETHYLENE 0 0 0 0 0 0 0 0 0
PROPENE 0 0 0 0 0 0 0 0 0
HYDRO-01 0 0 0 0 0 0 0 0 21
NO2 0 0 0 0 0 0 0 0 0
CROTO-01 0 0 0 0 0 0 0 0 0
VANIL-01 0 0 0 0 0 0 0 0 0
ACETO-01 0 0 0 0 0 0 0 0 0
2-MET-01 0 0 0 0 0 0 0 0 0
PYRID-01 0 0 0 0 0 0 0 0 0
N-HEX-01 0 0 0 0 0 0 0 0 0
N-DOD-01 0 0 0 0 0 0 0 0 0
3-MET-01 0 0 0 0 0 0 0 0 0
4-MET-01 0 0 0 0 0 0 0 0 0
ETHYL-01 0 0 0 0 0 0 0 0 0
1-MET-01 0 0 0 0 0 0 0 0 0
CYCLO-01 0 0 0 0 0 0 0 0 0
N-BUT-01 0 0 0 0 0 0 0 0 0
BICYC-01 0 0 0 0 0 0 0 0 0
1:3-D-01 0 0 0 0 0 0 0 0 0
O-XYL-01 0 0 0 0 0 0 0 0 0
BENZE-01 0 0 0 0 0 0 0 0 0
4-MET-02 0 0 0 0 0 0 0 0 0
PYREN-01 0 0 0 0 0 0 0 0 0
1:2-D-01 0 0 0 0 0 0 0 0 0
INDAN-01 0 0 0 0 0 0 0 0 0
1:2:3-01 0 0 0 0 0 0 0 0 0
6-HEX-01 0 0 0 0 0 0 0 0 0
2:7-D-01 0 0 0 0 0 0 0 0 0
NAPHT-01 0 0 0 0 0 0 0 0 0
THYMO-01 0 0 0 0 0 0 0 0 0
DIMET-02 0 0 0 0 0 0 0 0 0
Total Flow lbmol/hr 7102 11268 11268 11268 1649 1649 0 5424 11621
Total Flow lb/hr 127944 203000 203000 203000 29700 29700 0 97706 344319
Total Flow cuft/hr 127673 76606 5233 5381 21191 705 0 97499 18790700
Temperature F 750 498 402 430 499 300 750 1800
Pressure psia 675 685 685 685 675 675 300 675 15
Vapor Frac 1.00 0.52 0.00 0.00 1.00 0.00 1.00 1.00
Liquid Frac 0.00 0.48 1.00 1.00 0.00 1.00 0.00 0.00
Solid Frac 0.00 0.00 0.00 0.00 0.00 0.00 0.00 0.00
Enthalpy Btu/lbmol -98889 -107900 -117210 -116560 -101440 -119490 -98889 -42214
Enthalpy Btu/lb -5489 -5989 -6506 -6470 -5631 -6633 -5489 -1425
Enthalpy Btu/hr 702310000 1215800000 1320800000 1313500000 167230000 196990000 #VALUE! 536330000 490540000

80
Figure A1. continued
S10 S12 S14 S15 S18 S22 S25
Mass Flow lb/hr
WATER 97843 41567 225650 41567 41567 41567 4854
HYDROGEN 1789 0 0 0 0 0 0
OXYGEN 0 4985 0 4985 4985 4985 56268
NITROGEN 114 183749 0 183749 183749 183749 183635
ARGON 0 3129 0 3129 3129 3129 3129
CO 6060 0 0 0 0 0 0
CO2 15504 110868 0 110868 110868 110868 114
METHANE 11753 0 0 0 0 0 0
ETHANE 4649 0 0 0 0 0 0
PROPANE 2628 0 0 0 0 0 0
N-BUT-02 2505 0 0 0 0 0 0
N-PEN-01 2243 0 0 0 0 0 0
ISOBU-01 36 0 0 0 0 0 0
ETHYLENE 234 0 0 0 0 0 0
PROPENE 164 0 0 0 0 0 0
HYDRO-01 18 21 0 21 21 21 0
NO2 0 0 0 0 0 0 0
CROTO-01 2 0 0 0 0 0 0
VANIL-01 8 0 0 0 0 0 0
ACETO-01 0 0 0 0 0 0 0
2-MET-01 6 0 0 0 0 0 0
PYRID-01 0 0 0 0 0 0 0
N-HEX-01 844 0 0 0 0 0 0
N-DOD-01 2 0 0 0 0 0 0
3-MET-01 150 0 0 0 0 0 0
4-MET-01 16 0 0 0 0 0 0
ETHYL-01 93 0 0 0 0 0 0
1-MET-01 69 0 0 0 0 0 0
CYCLO-01 241 0 0 0 0 0 0
N-BUT-01 6 0 0 0 0 0 0
BICYC-01 1 0 0 0 0 0 0
1:3-D-01 3 0 0 0 0 0 0
O-XYL-01 35 0 0 0 0 0 0
BENZE-01 3 0 0 0 0 0 0
4-MET-02 0 0 0 0 0 0 0
PYREN-01 0 0 0 0 0 0 0
1:2-D-01 0 0 0 0 0 0 0
INDAN-01 3 0 0 0 0 0 0
1:2:3-01 0 0 0 0 0 0 0
6-HEX-01 0 0 0 0 0 0 0
2:7-D-01 0 0 0 0 0 0 0
NAPHT-01 0 0 0 0 0 0 0
THYMO-01 0 0 0 0 0 0 0
DIMET-02 0 0 0 0 0 0 0
Total Flow lbmol/hr 7942 11621 12525 11621 11621 11621 8664
Total Flow lb/hr 147021 344319 225650 344319 344319 344319 248000
Total Flow cuft/hr 226775 8120330 225172 16000700 13541100 8036490 3102030
Temperature F 671 517 750 1464 1169 507 124
Pressure psia 415 15 675 15 15 15 18
Vapor Frac 1.00 1.00 1.00 1.00 1.00 1.00 1.00
Liquid Frac 0.00 0.00 0.00 0.00 0.00 0.00 0.00
Solid Frac 0.00 0.00 0.00 0.00 0.00 0.00 0.00
Enthalpy Btu/lbmol -79357 -53843 -98889 -45443 -48190 -53926 -2957
Enthalpy Btu/lb -4287 -1817 -5489 -1534 -1626 -1820 -103
Enthalpy Btu/hr 630240000 625690000 1238600000 528070000 560000000 626650000 25622000

81
Figure A2. Mass and Energy Balance: Hydrogen Production via Steam Reforming Minimized Natural Gas

82
Figure A2. continued
170 170+602 250 532 600 601 602 609 610
Mass Flow lb/hr
WATER 45 137 0 0 109 17 92 137 4854
HYDROGEN 4 1789 7350 827 2117 332 1785 1789 0
OXYGEN 0 0 0 0 0 0 0 0 56268
NITROGEN 0 0 0 0 0 0 0 0 183635
ARGON 0 0 0 0 0 0 0 0 3129
CO 5551 6060 0 0 604 95 509 6060 0
CO2 5231 15450 0 0 12122 1903 10219 15450 114
METHANE 737 5604 0 0 5773 906 4867 5604 0
ETHANE 101 4244 0 0 4914 771 4143 4244 0
PROPANE 2 2448 0 0 2902 456 2446 2448 0
N-BUT-02 0 2458 0 0 2916 458 2458 2458 0
N-PEN-01 0 2237 0 0 2654 417 2237 2237 0
ISOBU-01 0 0 0 0 0 0 0 0 0
ETHYLENE 233 234 0 0 1 0 1 234 0
PROPENE 162 164 0 0 2 0 2 164 0
HYDRO-01 0 18 0 0 21 3 18 18 0
NO2 0 0 0 0 0 0 0 0 0
CROTO-01 2 2 0 0 0 0 0 2 0
VANIL-01 8 8 0 0 0 0 0 8 0
ACETO-01 0 0 0 0 0 0 0 0 0
2-MET-01 0 0 0 0 0 0 0 0 0
PYRID-01 0 0 0 0 0 0 0 0 0
N-HEX-01 0 844 0 0 1001 157 844 844 0
N-DOD-01 0 2 0 0 2 0 2 2 0
3-MET-01 0 150 0 0 178 28 150 150 0
4-MET-01 0 16 0 0 19 3 16 16 0
ETHYL-01 0 93 0 0 110 17 93 93 0
1-MET-01 0 69 0 0 82 13 69 69 0
CYCLO-01 0 241 0 0 286 45 241 241 0
N-BUT-01 0 6 0 0 7 1 6 6 0
BICYC-01 0 1 0 0 1 0 1 1 0
1:3-D-01 0 3 0 0 4 1 3 3 0
O-XYL-01 0 35 0 0 42 7 35 35 0
BENZE-01 0 3 0 0 4 1 3 3 0
4-MET-02 0 0 0 0 0 0 0 0 0
PYREN-01 0 0 0 0 0 0 0 0 0
1:2-D-01 0 0 0 0 0 0 0 0 0
INDAN-01 0 3 0 0 3 0 3 3 0
1:2:3-01 0 0 0 0 0 0 0 0 0
6-HEX-01 0 0 0 0 0 0 0 0 0
2:7-D-01 0 0 0 0 0 0 0 0 0
NAPHT-01 0 0 0 0 0 0 0 0 0
THYMO-01 0 0 0 0 0 0 0 0 0
DIMET-02 0 0 0 0 0 0 0 0 0
Total Flow lbmol/hr 383 2111 3646 410 2049 322 1728 2111 8664
Total Flow lb/hr 12076 42318 7350 827 35874 5632 30242 42318 248000
Total Flow cuft/hr 110997 318406 82361 9263 315551 49542 266010 64814 3406640
Temperature F 162 244 150 150 258 258 258 687 90
Pressure psia 23 50 293 293 50 50 50 405 15
Vapor Frac 1.00 1.00 1.00 1.00 1.00 1.00 1.00 1.00 1.00
Liquid Frac 0.00 0.00 0.00 0.00 0.00 0.00 0.00 0.00 0.00
Solid Frac 0.00 0.00 0.00 0.00 0.00 0.00 0.00 0.00 0.00
Enthalpy Btu/lbmol -80687 -43130 513 513 -34802 -34802 -34802 -38144 -3196
Enthalpy Btu/lb -2560 -2151 255 255 -1988 -1988 -1988 -1902 -112
Enthalpy Btu/hr 30910000 91033000 1871090 210442 71319000 11197000 60122000 80508000 27692000

83
Figure A2. continued
611 630 662 667 671 672 672-1 672-2 680
Mass Flow lb/hr
WATER 4854 33192 97843 69943 69943 56627 56627 56627 1408
HYDROGEN 0 0 1789 8129 8129 9619 9619 9619 9619
OXYGEN 56268 18336 0 0 0 0 0 0 0
NITROGEN 183635 183635 0 0 0 0 0 0 0
ARGON 3129 3129 0 0 0 0 0 0 0
CO 0 0 6060 24903 24903 4198 4198 4198 4198
CO2 114 91928 15450 34731 34731 67262 67262 67262 67241
METHANE 0 0 5604 2301 2301 2301 2301 2301 2301
ETHANE 0 0 4244 0 0 0 0 0 0
PROPANE 0 0 2448 0 0 0 0 0 0
N-BUT-02 0 0 2458 0 0 0 0 0 0
N-PEN-01 0 0 2237 0 0 0 0 0 0
ISOBU-01 0 0 0 0 0 0 0 0 0
ETHYLENE 0 0 234 0 0 0 0 0 0
PROPENE 0 0 164 0 0 0 0 0 0
HYDRO-01 0 21 18 18 18 18 18 18 18
NO2 0 0 0 0 0 0 0 0 0
CROTO-01 0 0 2 0 0 0 0 0 0
VANIL-01 0 0 8 0 0 0 0 0 0
ACETO-01 0 0 0 0 0 0 0 0 0
2-MET-01 0 0 0 0 0 0 0 0 0
PYRID-01 0 0 0 0 0 0 0 0 0
N-HEX-01 0 0 844 0 0 0 0 0 0
N-DOD-01 0 0 2 0 0 0 0 0 0
3-MET-01 0 0 150 0 0 0 0 0 0
4-MET-01 0 0 16 0 0 0 0 0 0
ETHYL-01 0 0 93 0 0 0 0 0 0
1-MET-01 0 0 69 0 0 0 0 0 0
CYCLO-01 0 0 241 0 0 0 0 0 0
N-BUT-01 0 0 6 0 0 0 0 0 0
BICYC-01 0 0 1 0 0 0 0 0 0
1:3-D-01 0 0 3 0 0 0 0 0 0
O-XYL-01 0 0 35 0 0 0 0 0 0
BENZE-01 0 0 3 0 0 0 0 0 0
4-MET-02 0 0 0 0 0 0 0 0 0
PYREN-01 0 0 0 0 0 0 0 0 0
1:2-D-01 0 0 0 0 0 0 0 0 0
INDAN-01 0 0 3 0 0 0 0 0 0
1:2:3-01 0 0 0 0 0 0 0 0 0
6-HEX-01 0 0 0 0 0 0 0 0 0
2:7-D-01 0 0 0 0 0 0 0 0 0
NAPHT-01 0 0 0 0 0 0 0 0 0
THYMO-01 0 0 0 0 0 0 0 0 0
DIMET-02 0 0 0 0 0 0 0 0 0
Total Flow lbmol/hr 8664 11138 7534 9737 9737 9737 9737 9737 6672
Total Flow lb/hr 248000 330241 140024 140024 140024 140024 140024 140024 84785
Total Flow cuft/hr 3186360 7378350 312266 675362 317286 395508 363715 188437 149444
Temperature F 140 528 1110 1562 500 675 586 250 150
Pressure psia 18 16 405 314 314 300 300 298 293
Vapor Frac 1.00 1.00 1.00 1.00 1.00 1.00 1.00 0.75 1.00
Liquid Frac 0.00 0.00 0.00 0.00 0.00 0.00 0.00 0.25 0.00
Solid Frac 0.00 0.00 0.00 0.00 0.00 0.00 0.00 0.00 0.00
Enthalpy Btu/lbmol -2846 -45415 -77627 -47569 -56771 -56571 -57325 -64463 -41203
Enthalpy Btu/lb -99 -1532 -4177 -3308 -3948 -3934 -3986 -4483 -3242
Enthalpy Btu/hr 24661000 505850000 584860000 463180000 552780000 550840000 558180000 627690000 274890000

84
Figure A2. continued
681 682 690 706 721 723 730 733 743
Mass Flow lb/hr
WATER 55219 1408 0 203000 144380 144380 225650 127944 203000
HYDROGEN 0 1443 8176 0 0 0 0 0 0
OXYGEN 0 0 0 0 0 0 0 0 0
NITROGEN 0 0 0 0 0 0 0 0 0
ARGON 0 0 0 0 0 0 0 0 0
CO 0 4198 0 0 0 0 0 0 0
CO2 20 67241 0 0 0 0 0 0 0
METHANE 0 2301 0 0 0 0 0 0 0
ETHANE 0 0 0 0 0 0 0 0 0
PROPANE 0 0 0 0 0 0 0 0 0
N-BUT-02 0 0 0 0 0 0 0 0 0
N-PEN-01 0 0 0 0 0 0 0 0 0
ISOBU-01 0 0 0 0 0 0 0 0 0
ETHYLENE 0 0 0 0 0 0 0 0 0
PROPENE 0 0 0 0 0 0 0 0 0
HYDRO-01 0 18 0 0 0 0 0 0 0
NO2 0 0 0 0 0 0 0 0 0
CROTO-01 0 0 0 0 0 0 0 0 0
VANIL-01 0 0 0 0 0 0 0 0 0
ACETO-01 0 0 0 0 0 0 0 0 0
2-MET-01 0 0 0 0 0 0 0 0 0
PYRID-01 0 0 0 0 0 0 0 0 0
N-HEX-01 0 0 0 0 0 0 0 0 0
N-DOD-01 0 0 0 0 0 0 0 0 0
3-MET-01 0 0 0 0 0 0 0 0 0
4-MET-01 0 0 0 0 0 0 0 0 0
ETHYL-01 0 0 0 0 0 0 0 0 0
1-MET-01 0 0 0 0 0 0 0 0 0
CYCLO-01 0 0 0 0 0 0 0 0 0
N-BUT-01 0 0 0 0 0 0 0 0 0
BICYC-01 0 0 0 0 0 0 0 0 0
1:3-D-01 0 0 0 0 0 0 0 0 0
O-XYL-01 0 0 0 0 0 0 0 0 0
BENZE-01 0 0 0 0 0 0 0 0 0
4-MET-02 0 0 0 0 0 0 0 0 0
PYREN-01 0 0 0 0 0 0 0 0 0
1:2-D-01 0 0 0 0 0 0 0 0 0
INDAN-01 0 0 0 0 0 0 0 0 0
1:2:3-01 0 0 0 0 0 0 0 0 0
6-HEX-01 0 0 0 0 0 0 0 0 0
2:7-D-01 0 0 0 0 0 0 0 0 0
NAPHT-01 0 0 0 0 0 0 0 0 0
THYMO-01 0 0 0 0 0 0 0 0 0
DIMET-02 0 0 0 0 0 0 0 0 0
Total Flow lbmol/hr 3066 2616 4056 11268 8014 8014 12525 7102 11268
Total Flow lb/hr 55239 76609 8176 203000 144380 144380 225650 127944 203000
Total Flow cuft/hr 1207 55966 91624 4766 4158 61673 160999 127673 69352
Temperature F 150 150 150 283 496 496 499 750 498
Pressure psia 293 293 293 685 675 675 675 675 685
Vapor Frac 0.00 0.98 1.00 0.00 0.00 0.58 1.00 1.00 0.47
Liquid Frac 1.00 0.02 0.00 1.00 1.00 0.42 0.00 0.00 0.53
Solid Frac 0.00 0.00 0.00 0.00 0.00 0.00 0.00 0.00 0.00
Enthalpy Btu/lbmol -122670 -106280 513 -119860 -114900 -107040 -101440 -98889 -108610
Enthalpy Btu/lb -6808 -3629 255 -6653 -6378 -5942 -5631 -5489 -6029
Enthalpy Btu/hr 376050000 277990000 2081530 1350600000 920850000 857890000 1270600000 702310000 1223900000

85
Figure A2. continued
752 752-0 790 791 LIQUID S3 S6 S10 S12
Mass Flow lb/hr
WATER 203000 203000 29700 29700 0 97706 33192 97843 33192
HYDROGEN 0 0 0 0 0 0 0 1789 0
OXYGEN 0 0 0 0 0 0 18336 0 18336
NITROGEN 0 0 0 0 0 0 183635 0 183635
ARGON 0 0 0 0 0 0 3129 0 3129
CO 0 0 0 0 0 0 0 6060 0
CO2 0 0 0 0 0 0 91928 15450 91928
METHANE 0 0 0 0 0 0 0 5604 0
ETHANE 0 0 0 0 0 0 0 4244 0
PROPANE 0 0 0 0 0 0 0 2448 0
N-BUT-02 0 0 0 0 0 0 0 2458 0
N-PEN-01 0 0 0 0 0 0 0 2237 0
ISOBU-01 0 0 0 0 0 0 0 0 0
ETHYLENE 0 0 0 0 0 0 0 234 0
PROPENE 0 0 0 0 0 0 0 164 0
HYDRO-01 0 0 0 0 0 0 21 18 21
NO2 0 0 0 0 0 0 0 0 0
CROTO-01 0 0 0 0 0 0 0 2 0
VANIL-01 0 0 0 0 0 0 0 8 0
ACETO-01 0 0 0 0 0 0 0 0 0
2-MET-01 0 0 0 0 0 0 0 0 0
PYRID-01 0 0 0 0 0 0 0 0 0
N-HEX-01 0 0 0 0 0 0 0 844 0
N-DOD-01 0 0 0 0 0 0 0 2 0
3-MET-01 0 0 0 0 0 0 0 150 0
4-MET-01 0 0 0 0 0 0 0 16 0
ETHYL-01 0 0 0 0 0 0 0 93 0
1-MET-01 0 0 0 0 0 0 0 69 0
CYCLO-01 0 0 0 0 0 0 0 241 0
N-BUT-01 0 0 0 0 0 0 0 6 0
BICYC-01 0 0 0 0 0 0 0 1 0
1:3-D-01 0 0 0 0 0 0 0 3 0
O-XYL-01 0 0 0 0 0 0 0 35 0
BENZE-01 0 0 0 0 0 0 0 3 0
4-MET-02 0 0 0 0 0 0 0 0 0
PYREN-01 0 0 0 0 0 0 0 0 0
1:2-D-01 0 0 0 0 0 0 0 0 0
INDAN-01 0 0 0 0 0 0 0 3 0
1:2:3-01 0 0 0 0 0 0 0 0 0
6-HEX-01 0 0 0 0 0 0 0 0 0
2:7-D-01 0 0 0 0 0 0 0 0 0
NAPHT-01 0 0 0 0 0 0 0 0 0
THYMO-01 0 0 0 0 0 0 0 0 0
DIMET-02 0 0 0 0 0 0 0 0 0
Total Flow lbmol/hr 11268 11268 1649 1649 0 5424 11138 7534 11138
Total Flow lb/hr 203000 203000 29700 29700 0 97706 330241 140024 330241
Total Flow cuft/hr 5233 5381 21191 705 0 97499 18011200 227895 7784160
Temperature F 402 430 499 300 750 1800 708 517
Pressure psia 685 685 675 675 300 675 15 405 15
Vapor Frac 0.00 0.00 1.00 0.00 1.00 1.00 1.00 1.00
Liquid Frac 1.00 1.00 0.00 1.00 0.00 0.00 0.00 0.00
Solid Frac 0.00 0.00 0.00 0.00 0.00 0.00 0.00 0.00
Enthalpy Btu/lbmol -117210 -116560 -101440 -119490 -98889 -34112 -81872 -45502
Enthalpy Btu/lb -6506 -6470 -5631 -6633 -5489 -1151 -4405 -1535
Enthalpy Btu/hr 1320800000 1313500000 167230000 196990000 #VALUE! 536330000 379950000 616840000 506820000
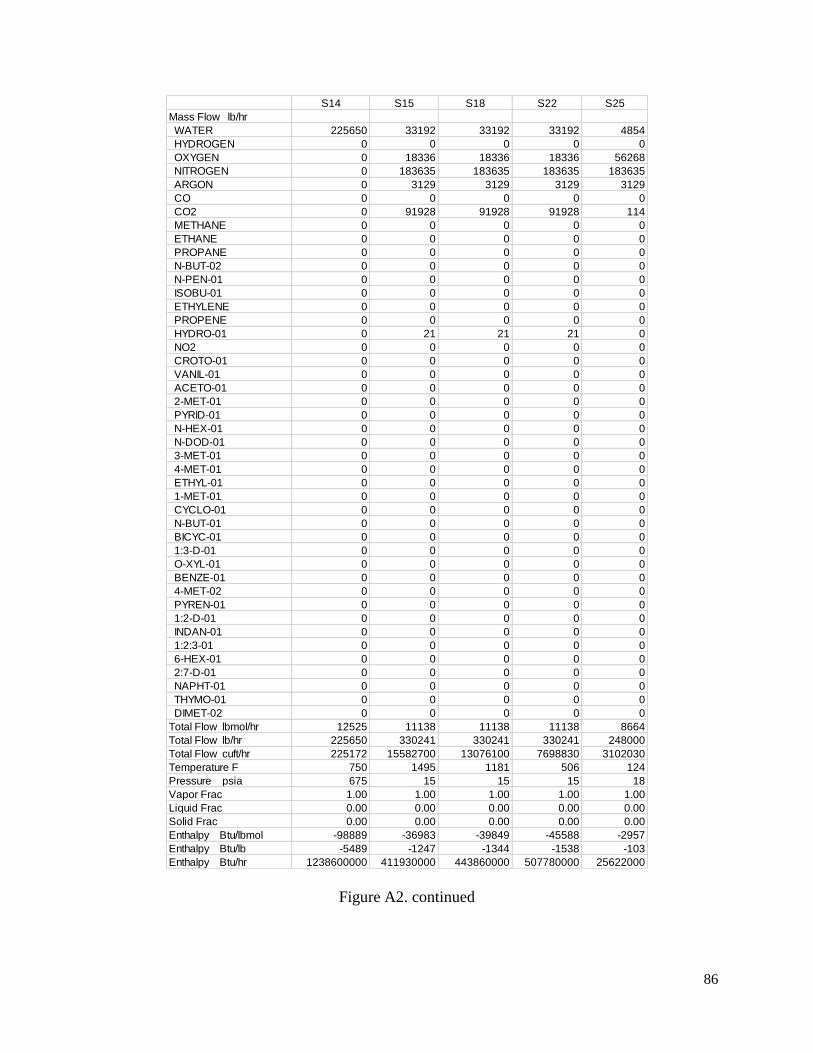
86
Figure A2. continued
S14 S15 S18 S22 S25
Mass Flow lb/hr
WATER 225650 33192 33192 33192 4854
HYDROGEN 0 0 0 0 0
OXYGEN 0 18336 18336 18336 56268
NITROGEN 0 183635 183635 183635 183635
ARGON 0 3129 3129 3129 3129
CO 0 0 0 0 0
CO2 0 91928 91928 91928 114
METHANE 0 0 0 0 0
ETHANE 0 0 0 0 0
PROPANE 0 0 0 0 0
N-BUT-02 0 0 0 0 0
N-PEN-01 0 0 0 0 0
ISOBU-01 0 0 0 0 0
ETHYLENE 0 0 0 0 0
PROPENE 0 0 0 0 0
HYDRO-01 0 21 21 21 0
NO2 0 0 0 0 0
CROTO-01 0 0 0 0 0
VANIL-01 0 0 0 0 0
ACETO-01 0 0 0 0 0
2-MET-01 0 0 0 0 0
PYRID-01 0 0 0 0 0
N-HEX-01 0 0 0 0 0
N-DOD-01 0 0 0 0 0
3-MET-01 0 0 0 0 0
4-MET-01 0 0 0 0 0
ETHYL-01 0 0 0 0 0
1-MET-01 0 0 0 0 0
CYCLO-01 0 0 0 0 0
N-BUT-01 0 0 0 0 0
BICYC-01 0 0 0 0 0
1:3-D-01 0 0 0 0 0
O-XYL-01 0 0 0 0 0
BENZE-01 0 0 0 0 0
4-MET-02 0 0 0 0 0
PYREN-01 0 0 0 0 0
1:2-D-01 0 0 0 0 0
INDAN-01 0 0 0 0 0
1:2:3-01 0 0 0 0 0
6-HEX-01 0 0 0 0 0
2:7-D-01 0 0 0 0 0
NAPHT-01 0 0 0 0 0
THYMO-01 0 0 0 0 0
DIMET-02 0 0 0 0 0
Total Flow lbmol/hr 12525 11138 11138 11138 8664
Total Flow lb/hr 225650 330241 330241 330241 248000
Total Flow cuft/hr 225172 15582700 13076100 7698830 3102030
Temperature F 750 1495 1181 506 124
Pressure psia 675 15 15 15 18
Vapor Frac 1.00 1.00 1.00 1.00 1.00
Liquid Frac 0.00 0.00 0.00 0.00 0.00
Solid Frac 0.00 0.00 0.00 0.00 0.00
Enthalpy Btu/lbmol -98889 -36983 -39849 -45588 -2957
Enthalpy Btu/lb -5489 -1247 -1344 -1538 -103
Enthalpy Btu/hr 1238600000 411930000 443860000 507780000 25622000

87
Figure A3. Mass and Energy Balance: Pyrolysis Oil Vapor Quenching and MEC
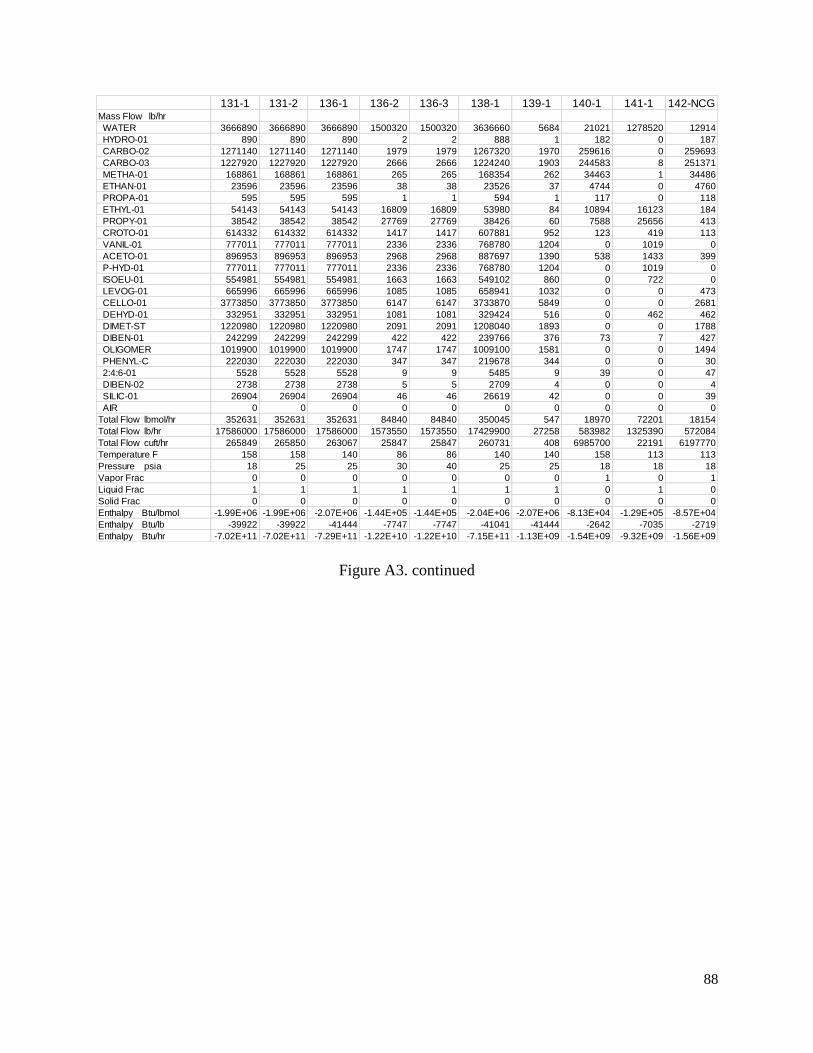
88
Figure A3. continued
131-1 131-2 136-1 136-2 136-3 138-1 139-1 140-1 141-1 142-NCGMass Flow lb/hr
WATER 3666890 3666890 3666890 1500320 1500320 3636660 5684 21021 1278520 12914
HYDRO-01 890 890 890 2 2 888 1 182 0 187
CARBO-02 1271140 1271140 1271140 1979 1979 1267320 1970 259616 0 259693
CARBO-03 1227920 1227920 1227920 2666 2666 1224240 1903 244583 8 251371
METHA-01 168861 168861 168861 265 265 168354 262 34463 1 34486
ETHAN-01 23596 23596 23596 38 38 23526 37 4744 0 4760
PROPA-01 595 595 595 1 1 594 1 117 0 118
ETHYL-01 54143 54143 54143 16809 16809 53980 84 10894 16123 184
PROPY-01 38542 38542 38542 27769 27769 38426 60 7588 25656 413
CROTO-01 614332 614332 614332 1417 1417 607881 952 123 419 113
VANIL-01 777011 777011 777011 2336 2336 768780 1204 0 1019 0
ACETO-01 896953 896953 896953 2968 2968 887697 1390 538 1433 399
P-HYD-01 777011 777011 777011 2336 2336 768780 1204 0 1019 0
ISOEU-01 554981 554981 554981 1663 1663 549102 860 0 722 0
LEVOG-01 665996 665996 665996 1085 1085 658941 1032 0 0 473
CELLO-01 3773850 3773850 3773850 6147 6147 3733870 5849 0 0 2681
DEHYD-01 332951 332951 332951 1081 1081 329424 516 0 462 462
DIMET-ST 1220980 1220980 1220980 2091 2091 1208040 1893 0 0 1788
DIBEN-01 242299 242299 242299 422 422 239766 376 73 7 427
OLIGOMER 1019900 1019900 1019900 1747 1747 1009100 1581 0 0 1494
PHENYL-C 222030 222030 222030 347 347 219678 344 0 0 30
2:4:6-01 5528 5528 5528 9 9 5485 9 39 0 47
DIBEN-02 2738 2738 2738 5 5 2709 4 0 0 4
SILIC-01 26904 26904 26904 46 46 26619 42 0 0 39
AIR 0 0 0 0 0 0 0 0 0 0
Total Flow lbmol/hr 352631 352631 352631 84840 84840 350045 547 18970 72201 18154
Total Flow lb/hr 17586000 17586000 17586000 1573550 1573550 17429900 27258 583982 1325390 572084
Total Flow cuft/hr 265849 265850 263067 25847 25847 260731 408 6985700 22191 6197770
Temperature F 158 158 140 86 86 140 140 158 113 113
Pressure psia 18 25 25 30 40 25 25 18 18 18
Vapor Frac 0 0 0 0 0 0 0 1 0 1
Liquid Frac 1 1 1 1 1 1 1 0 1 0
Solid Frac 0 0 0 0 0 0 0 0 0 0
Enthalpy Btu/lbmol -1.99E+06 -1.99E+06 -2.07E+06 -1.44E+05 -1.44E+05 -2.04E+06 -2.07E+06 -8.13E+04 -1.29E+05 -8.57E+04
Enthalpy Btu/lb -39922 -39922 -41444 -7747 -7747 -41041 -41444 -2642 -7035 -2719
Enthalpy Btu/hr -7.02E+11 -7.02E+11 -7.29E+11 -1.22E+10 -1.22E+10 -7.15E+11 -1.13E+09 -1.54E+09 -9.32E+09 -1.56E+09

89
Figure A3. continued
145 145-1 146 146-1 151 801 802 ATM COMP-H2 DILUTE
Mass Flow lb/hr
WATER 1278520 1500320 1270410 1270410 5317 1 1 0 1380 74957
HYDRO-01 0 2 5 5 1 0 0 0 1769 0
CARBO-02 0 1979 77 77 1843 0 0 0 1889 0
CARBO-03 8 2666 6796 6796 1780 0 0 0 12538 0
METHA-01 1 265 24 24 245 0 0 0 238 0
ETHAN-01 0 38 16 16 34 0 0 0 19 0
PROPA-01 0 1 1 1 1 0 0 0 0 0
ETHYL-01 16123 16809 5414 5414 79 0 0 0 10618 0
PROPY-01 25656 27769 18480 18480 56 0 0 0 6239 0
CROTO-01 419 1417 410 410 891 0 0 0 245 0
VANIL-01 1019 2336 1019 1019 1127 0 0 0 0 0
ACETO-01 1433 2968 1294 1294 1301 0 0 0 0 0
P-HYD-01 1019 2336 1019 1019 1127 0 0 0 0 0
ISOEU-01 722 1663 722 722 805 0 0 0 3 0
LEVOG-01 0 1085 473 473 966 0 0 0 0 0
CELLO-01 0 6147 2681 2681 5472 0 0 0 0 0
DEHYD-01 462 1081 924 924 483 0 0 0 0 0
DIMET-ST 0 2091 1788 1788 1770 0 0 0 0 0
DIBEN-01 7 422 361 361 351 0 0 0 0 0
OLIGOMER 0 1747 1494 1494 1479 0 0 0 0 0
PHENYL-C 0 347 30 30 322 0 0 0 0 0
2:4:6-01 0 9 8 8 8 0 0 0 0 0
DIBEN-02 0 5 4 4 4 0 0 0 0 0
SILIC-01 0 46 39 39 39 0 0 0 0 0
AIR 0 0 0 0 0 0 0 0 0 0
Total Flow lbmol/hr 72201 84840 71384 71384 511 0 0 0 1851 4161
Total Flow lb/hr 1325390 1573550 1313490 1313490 25500 1 1 0 34939 74957
Total Flow cuft/hr 22191 26433 21430 21430 381 0 0 1 305686 1232
Temperature F 113 124 86 86 140 70 84 86 94 113
Pressure psia 35 30 30 30 25 20 20 15 36 18
Vapor Frac 0 0 0 0 0 0 0 1 1 0
Liquid Frac 1 1 1 1 1 1 1 0 0 1
Solid Frac 0 0 0 0 0 0 0 0 0 0
Enthalpy Btu/lbmol -1.29E+05 -1.42E+05 -1.32E+05 -1.32E+05 -2.07E+06 -1.23E+05 -1.23E+05 -2.56E+04 -2.42E+04 -1.22E+05
Enthalpy Btu/lb -7035 -7631 -7161 -7161 -41444 -6825 -6812 -1354 -1283 -6783
Enthalpy Btu/hr -9.32E+09 -1.20E+10 -9.41E+09 -9.41E+09 -1.06E+09 -6.83E+03 -6.81E+03 -8.21E+01 -4.48E+07 -5.08E+08

90
Figure A3. continued
MEC-H2 PYRO-VAP QNCH-H2O RECYCLE1RECYCLE2 RECYCLE3 RECYCLE4 S1 S11 S16 WW
Mass Flow lb/hr
WATER 1487240 44495 6750 1485860 1411570 1411570 141157 1284200 1380 1411570 74293
HYDRO-01 1774 185 0 6 5 5 1 1 1769 5 0
CARBO-02 1979 263429 0 90 86 86 9 1970 1889 86 5
CARBO-03 20487 248267 0 7948 7551 7551 755 1911 12538 7551 397
METHA-01 265 34970 0 28 26 26 3 263 238 26 1
ETHAN-01 38 4815 0 19 18 18 2 37 19 18 1
PROPA-01 1 119 0 1 1 1 0 1 0 1 0
ETHYL-01 16951 11056 0 6333 6016 6016 602 16207 10618 6016 317
PROPY-01 27854 7704 0 21615 20534 20534 2053 25716 6239 20534 1081
CROTO-01 724 6574 0 479 455 455 46 1372 245 455 24
VANIL-01 1192 8231 0 1192 1132 1132 113 2223 0 1132 60
ACETO-01 1513 9794 0 1513 1438 1438 144 2824 0 1438 76
P-HYD-01 1192 8231 0 1192 1132 1132 113 2223 0 1132 60
ISOEU-01 848 5879 0 845 803 803 80 1582 3 803 42
LEVOG-01 553 7055 0 553 526 526 53 1032 0 526 28
CELLO-01 3135 39977 0 3135 2978 2978 298 5849 0 2978 157
DEHYD-01 1081 3527 0 1081 1027 1027 103 978 0 1027 54
DIMET-ST 2091 12934 0 2091 1987 1987 199 1893 0 1987 105
DIBEN-01 422 2606 0 422 401 401 40 382 0 401 21
OLIGOMER 1747 10804 0 1747 1659 1659 166 1581 0 1659 87
PHENYL-C 35 2352 0 35 33 33 3 344 0 33 2
2:4:6-01 9 82 0 9 9 9 1 9 0 9 0
DIBEN-02 5 29 0 5 4 4 0 4 0 4 0
SILIC-01 46 285 0 46 44 44 4 42 0 44 2
AIR 0 0 0 0 0 0 0 0 0 0 0
Total Flow lbmol/hr 85342 21181 375 83490 79316 79316 7932 72747 1851 79316 4175
Total Flow lb/hr 1571190 733400 6750 1536250 1459440 1459440 145944 1352650 34939 1459440 76812
Total Flow cuft/hr 759304 16339600 109 25065 23811 23812 2381 60768 737482 23811 1253
Temperature F 86 813 86 86 86 86 86 126 86 86 86
Pressure psia 15 18 15 15 15 44 30 25 15 15 15
Vapor Frac 0 1 0 0 0 0 0 0 1 0 0
Liquid Frac 1 0 1 1 1 1 1 1 0 1 1
Solid Frac 0 0 0 0 0 0 0 0 0 0 0
Enthalpy Btu/lbmol -1.30E+05 4.33E+05 -1.23E+05 -1.32E+05 -1.32E+05 -1.32E+05 -1.32E+05 -1.44E+05 -2.56E+04 -1.32E+05 -1.32E+05
Enthalpy Btu/lb -7041 12504 -6810 -7161 -7161 -7161 -7161 -7729 -1354 -7161 -7161
Enthalpy Btu/hr -1.11E+10 9.17E+09 -4.60E+07 -1.10E+10 -1.05E+10 -1.05E+10 -1.05E+09 -1.05E+10 -4.73E+07 -1.05E+10 -5.50E+08

91
Table A1. Hydrogen Productivity Calculations
Product ComponentCrotonic acid
(Acids)
1,4-Benzenediol
(Alcohols)
Acetol
(Ketones)
3-Methoxy-4-
Hydroxybenzaldehyde
(Aldehydes)
Isoeugenol
(Guaiacols)
Levoglucosan
(Low MW
sugars)
Cellobiose
(High MW
sugars)
Total
Simulation Name CROTO-01 P-HYD-01 ACETO-01 VANIL-01 ISOEU-01 LEVOG-01 CELLO-01
g/day 15,000,509 24,385,056 30,964,728 24,385,056 17,357,558 11,323,097 64,162,080 187,578,084
e/mole 18 26 14 34 48 24 48
mol wt 86.09 110.11 74.08 74.08 164.20 162.14 342.30
moles /day 174,242 221,461 417,996 329,172 105,710 69,835 187,446 1,505,862
e moles /day 3,136,359 5,757,983 5,851,944 11,191,845 5,074,073 1,676,037 8,997,404
coulombs/day 3.03E+11 5.56E+11 5.65E+11 1.08E+12 4.90E+11 1.62E+11 8.68E+11
Current, A 3,502,449 6,430,080 6,535,010 12,498,208 5,666,342 1,871,672 10,047,622 46,551,383
H2 produced, moles/d 1,568,180 2,878,991 2,925,972 5,595,923 2,537,037 838,019 4,498,702 20,842,823
H2 produced, g/day 3136359.14 5757982.527 5851944.438 11191845.36 5074073.101 1676037.049 8997403.83 41,685,645
Electricity needed, W 3,502,449 6,430,080 6,535,010 12,498,208 5,666,342 1,871,672 10,047,622 46,551,383
Hydrogen Produced, L/d 35,127,222 64,489,404 65,541,778 125,348,668 56,829,619 18,771,615 100,770,923 466,879,229
Biodegradability, %
Coulombic Efficiency, %
Cathode Conversion
Efficiency (CCE), %
H2 produced, moles/d 699,800 1,284,750 1,305,715 2,497,180 1,132,153 373,966 2,007,546 9,301,110
Electricity needed, V
Electricity needed, W 1,103,272 2,025,475 2,058,528 3,936,936 1,784,898 589,577 3,165,001 14,663,686
Hydrogen Produced, L/d 15,675,523 28,778,397 29,248,018 55,936,843 25,360,217 8,376,833 44,969,024 208,344,856
Hydrogen rate, L/L-day 1.502 2.758 2.803 5.361 2.430 0.803 4.310 19.97
0.6
100%
efficiency
49%
efficiency
0.70
0.75
0.85

92
VITA
Christian Wilson was born in Marion, Indiana on May 7, 1993. He attended high school
at the Hume-Fogg Academic Magnet High School in Nashville, Tennessee and graduated with
honors in May, 2011. He attended the University of Tennessee at Knoxville and received a
Bachelor of Science degree in Chemical and Biomolecular Engineering in May, 2015. He then
continued his education in the same department in seeking a Master of Science degree.