simulating genco bidding strategies in electricity markets
TRANSCRIPT

Argonne National Laboratory is managed by The University of Chicagofor the U.S. Department of Energy
Simulating GenCo Bidding Strategies in Electricity Markets with an Agent-Based Model
Prakash R. Thimmapuram, Audun Botterud, Malo Yamakado
Argonne National Laboratory
Argonne, IL USA

2
Outline
Background– Market Power Analysis in Restructured Electricity Markets– Agent-Based Modeling and Simulation (ABMS)– Pricing Mechanisms and Congestion Management
Electricity Market Complex Adaptive Systems (EMCAS)– Agent Representation– GenCo Bidding Strategies
11-Node Case Study– Assumptions– Locational Marginal Pricing (LMP) vs. Counter-Trading (SMP)– Results
Conclusions and Future Work

3
Outline
Background– Market Power Analysis in Restructured Electricity Markets– Agent-Based Modeling and Simulation (ABMS)– Pricing Mechanisms and Congestion Management
Electricity Market Complex Adaptive Systems (EMCAS)– Agent Representation– GenCo Bidding Strategies
11-Node Case Study– Assumptions– Locational Marginal Pricing (LMP) vs. Counter-Trading (SMP)– Results
Conclusions and Future Work

4
Market Power Analysis in Electricity Markets
Market Power Indicators– Herfindahl-Hirschman Index (HHI)– Lerner Index– Pivotal Supplier Index
Equilibrium models– Cournot– Bertrand– Supply function
Several simplifying assumptions often necessary– Physical laws (e.g. transmission network, inter-temporal constraints)– Market rules (bid format, multiple markets, congestion, settlements
etc.)

5
Agent-Based Modeling and Simulation (ABMS)
ABMS uses sets of agents and a framework for simulating their decisions and interactions
An agent – is a software representation of a decision-making unit– is a self-directed (autonomous) object with specific individual traits– typically exhibits bounded rationality under limited information
Agent framework allows agents to interact in complex, dynamic ways
ABMS is well suited for analyzing decentralized decision-making in restructured electricity markets

6
Some Agent-Based Models of Electricity Markets
In most applications of ABMS the electricity market is simulated as a repeated game– Emergent behavior and convergence– Nash equilibrium
Several theoretical applications on hypothetical test power systems/markets– Nicolaisen et al. (2001)– Krause et al. (2004)– Ernst et al. (2004)
ABMS has been used to model the NETA electricity market in England and Wales– Bower and Bunn (2001)– Bunn and Oliveira (2001, 2003)
7
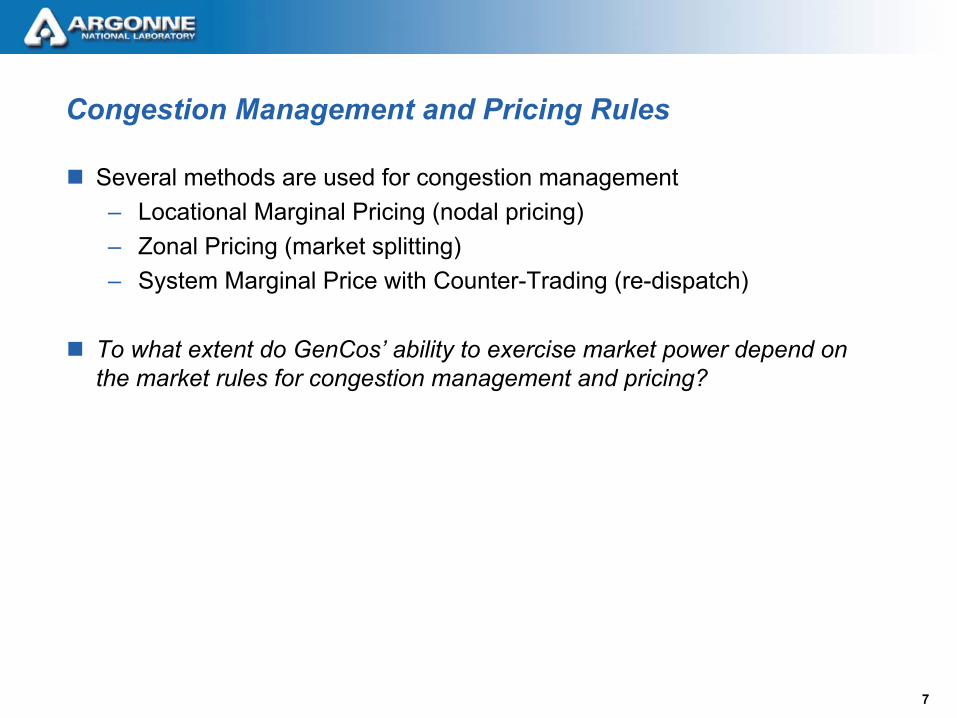
Congestion Management and Pricing Rules
Several methods are used for congestion management– Locational Marginal Pricing (nodal pricing)– Zonal Pricing (market splitting)– System Marginal Price with Counter-Trading (re-dispatch)
To what extent do GenCos’ ability to exercise market power depend on the market rules for congestion management and pricing?

8
Outline
Background– Market Power Analysis in Restructured Electricity Markets– Agent-Based Modeling and Simulation (ABMS)– Pricing Mechanisms and Congestion Management
Electricity Market Complex Adaptive Systems (EMCAS)– Agent Representation– GenCo Bidding Strategies
11-Node Case Study– Assumptions– Locational Marginal Pricing (LMP) vs. Counter-Trading (SMP)– Results
Conclusions and Future Work

9
Electricity Market Complex Adaptive Systems (EMCAS)
The main participants in the electricity market are represented in EMCAS
EElectricity lectricity MMarkets arkets CComplex omplex AAdaptive daptive SSystems (ystems (EMCASEMCAS))
ISO/RTOISO/RTO
DispatchDispatch
Power MarketsPower Markets(Pool, Bilateral,(Pool, Bilateral,and Ancillary)and Ancillary)
SchedulingScheduling SettlementSettlement
RegulatorRegulator
DistributionDistributionCompanyCompany
DistributionDistributionCompanyCompany
DisCosDisCosTransCosTransCosGenCosGenCos
TransmissionTransmissionCompanyCompany
TransmissionTransmissionCompanyCompany
GenerationGenerationCompanyCompany
GenerationGenerationCompanyCompany
DemCosDemCosIndustrialIndustrial
ConsumersConsumers ResidentialResidentialConsumersConsumers
ServiceServiceConsumersConsumers
EElectricity lectricity MMarkets arkets CComplex omplex AAdaptive daptive SSystems (ystems (EMCASEMCAS))
ISO/RTOISO/RTO
DispatchDispatch
Power MarketsPower Markets(Pool, Bilateral,(Pool, Bilateral,and Ancillary)and Ancillary)
SchedulingScheduling SettlementSettlement
ISO/RTOISO/RTO
DispatchDispatch
Power MarketsPower Markets(Pool, Bilateral,(Pool, Bilateral,and Ancillary)and Ancillary)
SchedulingScheduling SettlementSettlement
RegulatorRegulator
DistributionDistributionCompanyCompany
DistributionDistributionCompanyCompany
DisCosDisCosTransCosTransCosGenCosGenCos
TransmissionTransmissionCompanyCompany
TransmissionTransmissionCompanyCompany
GenerationGenerationCompanyCompany
GenerationGenerationCompanyCompany
DemCosDemCosIndustrialIndustrial
ConsumersConsumers ResidentialResidentialConsumersConsumers
ServiceServiceConsumersConsumers

10
Simulated Market Operation in EMCAS
Daily bidding into a pool market
Hourly chronological simulations– Bid-based scheduling (day-ahead) and dispatch (real-time) based on
DC-OPF (stochastic forced generator outages)
Calculation of prices and profits based on “two-settlement system” for all agents in the system– Day-ahead (DA) schedule at DA price– Deviations from DA at real-time (RT) price
EMCAS can simulate the electricity market under different assumptions about agent behavior and market rules, e.g.:– Locational marginal prices (LMP)– Unconstrained system marginal price (SMP) and counter trading
11
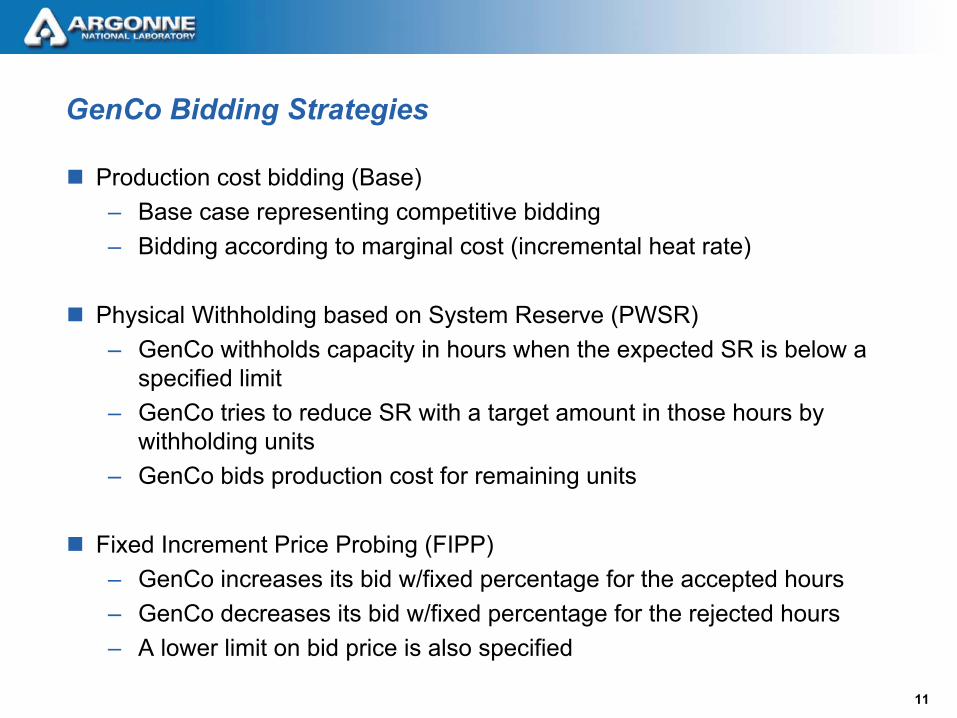
GenCo Bidding Strategies
Production cost bidding (Base)– Base case representing competitive bidding– Bidding according to marginal cost (incremental heat rate)
Physical Withholding based on System Reserve (PWSR)– GenCo withholds capacity in hours when the expected SR is below a
specified limit– GenCo tries to reduce SR with a target amount in those hours by
withholding units– GenCo bids production cost for remaining units
Fixed Increment Price Probing (FIPP)– GenCo increases its bid w/fixed percentage for the accepted hours– GenCo decreases its bid w/fixed percentage for the rejected hours– A lower limit on bid price is also specified

12
Outline
Background– Market Power Analysis in Restructured Electricity Markets– Agent-Based Modeling and Simulation (ABMS)– Pricing Mechanisms and Congestion Management
Electricity Market Complex Adaptive Systems (EMCAS)– Agent Representation– GenCo Bidding Strategies
11-Node Case Study– Assumptions– Locational Marginal Pricing (LMP) vs. Counter-Trading (SMP)– Results
Conclusions and Future Work

13
Assumptions: Network and Plants
11-node network (Christie et al. 2000)– Capacities and reactances
8 GenCos (A-H) with 3 plants each– Base Coal (CO), Combined Cycle
(CC), and Gas Turbine (GT)– Marginal costs from heat rate curves– Forced outages
H
G
A
B&C D&E
F
H
G
A
B&C D&E
FParameter/Plant Unit Base Coal (CO) Comb. Cycle
(CC) Gas Turbine (GT)
Capacity MW 500 250 125 Fuel Coal (BIT) Natural Gas Natural Gas Fuel price $/MMBtu 1.5 5 5 Variable O&M $/MWh 1.75 2.8 8 Fixed O&M $/kWmonth 2.1 0.6 0.7 Start-up time min 720 180 0 Minimum down time min 480 120 0 Warm start-up cost $ 7000 2000 50 Cold start-up cost $ 20000 5000 150

14
Assumptions: Loads
0
1000
2000
3000
4000
5000
6000
7000
1 36 71 106 141 176 211 246 281 316 351 386 421 456 491 526 561 596 631 666 701 736
Hour
Load
[MW
h/h] Total
Load 11Load 01Load 10Load 03Load 04
One month simulation period with hourly loads (inelastic)
Majority of load in node 11

15
Simulated Scenarios
Two sets of market rules simulated– Locational Marginal Prices (LMP) – System Marginal Price (SMP)
• Generators dispatched out of order to relieve congestion receive bid price• Congestion costs socialised
– Two settlement system under both rules
Seven scenarios for each market rule– Base case: all GenCos bid marginal production cost– PWSR: One GenCo (A, G, or H) applies Physical Withholding System
Reserve with CC and GT (30% trigger point, 6% target reduction)– FIPP: One GenCo (A, G, or H) applies Fixed Increment Price Probing with
10% adjustment and lower limit equal to production cost

16
Results: Average Monthly Prices in Base Case
Same price in all nodes under SMP
LMP gives highest price in node 11 and lowest in node 10
– Congestion on the connecting line 18 (50.8 % of the time)
Node 1 Node 2 Node 3 Node 4 Node 6 Node 10 Node 11 SMP (DA) 29.9 29.9 29.9 29.9 29.9 29.9 29.9 SMP (RT) 31.3 31.3 31.3 31.3 31.3 31.3 31.3 LMP (DA) 30.5 31.0 29.8 31.4 31.7 28.1 32.2 LMP (RT) 31.9 32.6 30.9 33.1 33.5 28.5 34.2
H
G
A
B&C D&E
F
H
G
A
B&C D&E
F

17
Results: Hourly Real-Time Prices in Base Case

18
Results: Total GenCo Profits and Consumer Costs (LMP vs SMP)
GenCo profits and consumer costs are higher under LMP– Especially in PWSR A+H, where curtailment occurs
A higher transmission charge might be necessary under SMP– No congestion rent to transmission owner– This is not considered in this analysis
Scenario SMP LMP % Change
Base 19.6 22.6 15.0 PWSR A 23.2 53.4 130.2 PWSR G 23.5 23.7 0.9 PWSR H 22.3 86.1 285.3 FIPP A 23.6 25.9 10.2 FIPP G 21.7 23.5 8.5 FIPP H 25.1 28.1 11.7
Scenario SMP LMP % Change
Base 110.2 115.7 5.0 PWSR A 114.4 154.1 34.8 PWSR G 114.3 116.7 2.1 PWSR H 114.5 224.6 96.2 FIPP A 114.3 119.7 4.7 FIPP G 112.2 116.2 3.6 FIPP H 116.4 126.4 8.6
Total GenCo Profits ($106) Total Consumer Costs ($106)

19
Results: Changes (%) in GenCo Profits Compared to Base Case
Locational differences under both rules, but more pronounced for LMPUnilateral market power occurs under both SMP and LMP– Most frequent under FIPP strategies
SMP
LMP
Scenario A B C D E F G HPWSR A 19.6 17.5 20.1 18.2 17.1 20.2 14.2 19.7PWSR G 19.9 19.2 22.4 19.6 18.3 24.6 13.8 22.1PWSR H 14.9 12 14.4 17 15.6 13.1 -1.3 25.8FIPP A 32.2 17.9 20.3 18 16.7 26.2 13.5 20.4FIPP G 9.8 8.1 9.7 8.5 7.9 14.5 15.9 11FIPP H 27.8 20.6 24.8 26.6 24.3 28.4 20.2 54.1
Scenario A B C D E F G HPWSR A 51.1 162.1 180.7 126.0 124.3 179.4 12.4 181.3PWSR G 3.3 3.9 4.5 8.8 6.8 2.1 15.0 1.0PWSR H 315.8 340.8 361.3 235.3 229.7 301.6 -53.8 361.0FIPP A 22.1 13.8 15.2 13.5 12.0 19.8 6.8 15.5FIPP G 3.0 1.3 1.7 6.2 5.4 0.7 25.8 -0.7FIPP H 22.2 30.9 35.6 0.5 -1.4 69.1 -54.3 55.2

20
Results: Changes (%) in Consumer Costs Compared to Base Case
Cost increase dependent on location under LMPLarge difference between SMP and LMP in cases with curtailment
Scenario Load 1 Load 3 Load 4 Load 10 Load 11 Total PWSR A 26.7 27.8 36.2 2.8 39.8 33.2 PWSR G 1.5 1.5 0.8 2.7 0.4 0.9 PWSR H 49.1 50.8 75.1 -10.9 125.3 94.1 FIPP A 3.1 3.2 3.6 1.8 3.8 3.4 FIPP G 1.1 1.2 0.3 2.5 -0.1 0.4 FIPP H 3.2 3.3 10.5 -11.4 14.4 9.3
SMP
LMP
Scenario Load 1 Load 3 Load 4 Load 10 Load 11PWSR A 4.0 4.1 3.9 3.7 3.7PWSR G 3.9 4.0 3.8 3.6 3.7PWSR H 4.3 4.3 4.1 3.9 3.8FIPP A 3.9 4.0 3.8 3.6 3.7FIPP G 1.9 1.9 1.8 1.7 1.8FIPP H 6.0 6.1 5.8 5.4 5.6

21
Discussion of Case Study Results
Market power can be exercised under both SMP and LMP– All three GenCos are able to manipulate prices and increase profits– Unilateral market power occurs more frequently with the simulated
price probing strategy (FIPP)– Higher impact on consumer costs of market power under LMP
scheme, locational price signals amplified– SMP and counter-trading reduce impact of market power, but do not
have correct locational price signals
Location is important, especially under LMP scheme– GenCo H has the best location (load pocket)– GenCo G benefits the least
Traditional market power indices are inadequate for electricity markets– HHI is 1250 in the simulated market

22
Outline
Background– Market Power Analysis in Restructured Electricity Markets– Agent-Based Modeling and Simulation (ABMS)– Pricing Mechanisms and Congestion Management
Electricity Market Complex Adaptive Systems (EMCAS)– Agent Representation– GenCo Bidding Strategies
11-Node Case Study– Assumptions– Locational Marginal Pricing (LMP) vs. Counter-Trading (SMP)– Results
Conclusions and Future Work

23
Conclusions and Future Work
Advantages of using ABMS for market power analysis– Detailed representation of physical system– Detailed representation of market rules and settlements– More realistic market behavior than equilibrium models
Some challenges with ABMS– Difficult to draw general conclusions– Complex results (often necessary to run a high number of simulations)
Possible extensions– Other congestion management mechanisms– Demand-side response/bidding– Bilateral contracts– Investments – Other strategies (learning and adaptation)– Simulate market as a repeated game– Real-world applications (US, Europe, Asia, Latin America, etc)