simulating aerosol--radiation--cloud feedbacks over e
TRANSCRIPT
ACPD14, 26085–26125, 2014
Simulating aerosol–radiation–cloud
feedbacks over E.China under severe
haze conditions
B. Zhang et al.
Title Page
Abstract Introduction
Conclusions References
Tables Figures
J I
J I
Back Close
Full Screen / Esc
Printer-friendly Version
Interactive Discussion
Discussion
Paper
|D
iscussionP
aper|
Discussion
Paper
|D
iscussionP
aper|
Atmos. Chem. Phys. Discuss., 14, 26085–26125, 2014www.atmos-chem-phys-discuss.net/14/26085/2014/doi:10.5194/acpd-14-26085-2014© Author(s) 2014. CC Attribution 3.0 License.
This discussion paper is/has been under review for the journal Atmospheric Chemistryand Physics (ACP). Please refer to the corresponding final paper in ACP if available.
Simulating aerosol–radiation–cloudfeedbacks on meteorology and air qualityover eastern China under severe hazeconditions in winterB. Zhang1,2, Y. X. Wang1,3, and J. M. Hao2
1Ministry of Education Key Laboratory for Earth System Modeling, Center for Earth SystemScience, Institute for Global Change Studies, Tsinghua University, Beijing, 100084, China2School of Environment, Tsinghua University, Beijing, 100084, China3Department of Atmospheric Sciences, Texas A&M University, College Station, TX, 77843,USA
Received: 21 September 2014 – Accepted: 29 September 2014 – Published: 17 October 2014
Correspondence to: Y. X. Wang ([email protected])
Published by Copernicus Publications on behalf of the European Geosciences Union.
26085
ACPD14, 26085–26125, 2014
Simulating aerosol–radiation–cloud
feedbacks over E.China under severe
haze conditions
B. Zhang et al.
Title Page
Abstract Introduction
Conclusions References
Tables Figures
J I
J I
Back Close
Full Screen / Esc
Printer-friendly Version
Interactive Discussion
Discussion
Paper
|D
iscussionP
aper|
Discussion
Paper
|D
iscussionP
aper|
Abstract
The aerosol–radiation–cloud feedbacks on meteorology and air quality over easternChina under severe winter haze conditions during January 2013 are simulated usingthe fully coupled on-line Weather Research and Forecasting/Chemistry (WRF-Chem)model. Three simulation scenarios including different aerosol configurations are under-5
taken to distinguish the impact of aerosol radiative (direct and semi-direct) and indirecteffects on meteorological variables and air quality. Simulated spatial and temporal vari-ations of PM2.5 are generally consistent with surface observations, with a mean bias of−18.9 µg m−3 (−15.0 %) averaged over 71 big cities in China. Comparisons betweendifferent scenarios reveal that aerosol radiative effects (direct effect and semi-direct10
effects) result in reductions of downward shortwave flux at the surface, 2 m tempera-ture, 10 m wind speed and planetary boundary layer (PBL) height by up to 84.0 W m−2,3.2 ◦C, 0.8 m s−1, and 268 m, respectively. The simulated impact of the aerosol indirecteffects is comparatively smaller. Through reducing the PBL height and wind speeds,the aerosol effects lead to increases in surface concentrations of primary pollutants15
(CO and SO2) and PM2.5. The aerosol feedbacks on secondary pollutants such as sur-face ozone and PM2.5 mass concentrations show some spatial variations. Surface O3mixing ratio is reduced by up to 6.9 ppb due to reduced incoming solar radiation andlower temperature. Comparisons of model results with observations show that inclu-sion of aerosol feedbacks in the model significantly improves model’s performances in20
simulating meteorological variables and improves simulations of PM2.5 temporal dis-tributions over the North China Plain, the Yangtze River Delta, the Pearl River Delta,and Central China. Although the aerosol–radiation–cloud feedbacks on aerosol massconcentrations are subject to uncertainties, this work demonstrates the significanceof aerosol–radiation–cloud feedbacks for real-time air quality forecasting under haze25
conditions.
26086
ACPD14, 26085–26125, 2014
Simulating aerosol–radiation–cloud
feedbacks over E.China under severe
haze conditions
B. Zhang et al.
Title Page
Abstract Introduction
Conclusions References
Tables Figures
J I
J I
Back Close
Full Screen / Esc
Printer-friendly Version
Interactive Discussion
Discussion
Paper
|D
iscussionP
aper|
Discussion
Paper
|D
iscussionP
aper|
1 Introduction
Atmospheric aerosols are known to play a key role in the earth climate system. Theyabsorb and scatter incoming solar radiation, referred to as direct effect (Hansen et al.,1997). They also alter cloud properties by serving as cloud condensation nuclei (CCN),which is known as indirect effect (Albrecht, 1989; Twomey, 1977; Rosenfeld et al.,5
2008). Absorbing aerosols in and under the cloud may also burn out the cloud (semi-direct effect) (Charlson and Pilat, 1969). It is of increasing interests to understand andquantify the complex impacts of aerosols on meteorology and air quality. The coupled“on-line” meteorology-air quality strategy with aerosol feedbacks is essential for real-time air quality forecasting using 3-D models. Negligence of aerosol feedbacks may10
lead to poor performance of the next hour’s meteorology and air quality forecasting,especially for high aerosol loading regions (Grell and Baklanov, 2011; Zhang et al.,2012).
Models simulating aerosol direct, indirect, and semi-direct effects on meteorologyand chemistry need to couple aerosols with physical and chemical processes. The15
chemistry version of Weather Research and Forecasting (WRF-Chem) model (Grellet al., 2005) is a state-of-the-art meso-scale “on-line” atmospheric model, in whichthe chemical processes and meteorology are simulated simultaneously. This designmakes WRF-Chem capable of simulating aerosol feedbacks on various atmosphericprocesses. Several studies employing WRF-Chem reveal that aerosols reduce down-20
ward solar radiation reaching the ground, inhibit convections, reduce the PBL, andmake the lower atmosphere more stable (Fan et al., 2008; Forkel et al., 2012; Zhanget al., 2010;). WRF-Chem results also indicate that aerosols can modify atmosphericcirculation systems, resulting in changes in monsoon strength, precipitation distribu-tion, and mid-latitude cyclones (Zhao et al., 2011, 2012).25
In January 2013, several severe and long-lasting haze episodes appeared in easternChina (Fig. 1). Monthly mean mass concentrations of fine particulate matters (PM2.5)exceeded 200 µg m−3 in some cities in North China Plain. Meteorological conditions
26087

ACPD14, 26085–26125, 2014
Simulating aerosol–radiation–cloud
feedbacks over E.China under severe
haze conditions
B. Zhang et al.
Title Page
Abstract Introduction
Conclusions References
Tables Figures
J I
J I
Back Close
Full Screen / Esc
Printer-friendly Version
Interactive Discussion
Discussion
Paper
|D
iscussionP
aper|
Discussion
Paper
|D
iscussionP
aper|
and chemical components of PM2.5 during this month have been investigated by a num-ber of studies in order to understand the chemical characteristics and formation mech-anism of severe winter haze episodes (Bi et al., 2014; Che et al., 2014; Huang et al.,2014; Sun et al., 2014; L. T. Wang et al., 2014; Y. S. Wang et al., 2014; Y. X. Wang et al.,2014; Z. F. Wang et al., 2014; J. K. Zhang et al., 2014). Meanwhile, such high levels of5
PM concentrations are expected to exert impacts on meteorological conditions throughthe aerosol–radiation–cloud interactions. Few current air quality forecasting systemsfor China include aerosol-meteorology interactions. The significance of this effect andthe extent to which it feedbacks on air quality remains to be uncertain and needs tobe quantified for better forecasting air quality in China in the future (Wang et al., 2013;10
Y. Zhang et al., 2014; Z. F. Wang et al., 2014).In this work, the fully coupled “on-line” WRF-Chem model is employed to simulate the
complex interactions between aerosols and meteorology and to characterize and quan-tify the influences of aerosol feedbacks on meteorology and air quality under severewinter haze conditions in January 2013 over eastern China. The aerosol direct, indirect15
and semi-direct effects are all included in the WRF-Chem simulation and analyzed sep-arately. The WRF-Chem model configuration, scenarios setup, and observation dataare described in Sect. 2. Section 3 evaluates the model in simulating meteorology andair quality. In Sect. 4, the aerosol feedbacks on meteorology and air quality are ana-lyzed and discussed. Section 5 investigates the effects of including aerosol feedbacks20
in the model to the model’s performances. The concluding remarks are given in Sect. 6.
2 Model and observations description
2.1 WRF-Chem model and scenarios setup
The WRF model is a state-of-the-art meso-scale non-hydrostatic model, and allowsfor many different choices for physical parameterizations (http://www.wrf-model.org/).25
WRF-Chem is a chemical version of WRF that simultaneously simulates meteorological
26088
ACPD14, 26085–26125, 2014
Simulating aerosol–radiation–cloud
feedbacks over E.China under severe
haze conditions
B. Zhang et al.
Title Page
Abstract Introduction
Conclusions References
Tables Figures
J I
J I
Back Close
Full Screen / Esc
Printer-friendly Version
Interactive Discussion
Discussion
Paper
|D
iscussionP
aper|
Discussion
Paper
|D
iscussionP
aper|
and chemical components. The version 3.3 of WRF-Chem released on 6 April 2011 isused in this study. A more detailed description of the model can be found in previousstudies (Grell et al., 2005; Fast et al., 2006; Chapman et al., 2009).
The main physical options selected in this study include the Goddard shortwaveradiation scheme coupled with aerosol direct effects (Chou et al., 1998), the Rapid5
Radiative Transfer Model (RRTM) longwave radiation scheme (Mlawer et al., 1997),the Noah Land Surface Model (Chen and Dudhia, 2001), the Yonsei University (YSU)boundary layer scheme (Hong et al., 2006), the Lin microphysics scheme coupled withaerosol indirect effects (Lin et al., 1983), and the Grell–Devenyi cumulus parameteri-zation scheme (Grell and Dévényi, 2002).10
The Carbon Bond Mechanism version Z (CBMZ) (Zaveri and Peters, 1999) is usedas gas-phase chemistry scheme. The Model for Simulating Aerosol Interactions andChemistry (MOSAIC) (Zaveri et al., 2008) is applied as aerosol module. MOSAIC simu-lates aerosol species such as sulfate, methanesulfonate, nitrate, ammonium, chloride,carbonate, sodium, calcium, black carbon (BC), organic carbon (OC), and other un-15
specified inorganic matters (OIN). Secondary organic aerosols are not included in theversion of MOSAIC used in this study. MOSAIC in WRF-Chem uses a sectional ap-proach to represent particle size distribution. In this study, four size bins (0.039–0.156,0.156–0.625, 0.625–2.5, 2.5–10.0 µm dry diameter) are employed, and aerosols areassumed to be internally mixed within each bin.20
The simulated time period is the whole month of January 2013. Figure 1 illustratesthe model domain, which covers eastern China (19–51◦ N, 96–132◦ E) and has a hor-izontal resolution of 27km×27km. There are 28 vertical levels extending from thesurface to 50 hPa. The initial and boundary conditions for WRF are provided by the6 hourly 1◦ ×1◦ National Centers for Environmental Prediction (NCEP) Final Analysis25
(FNL). Chemical boundary conditions are provided by MOZART simulations (Emmonset al., 2010). In the initial spin-up process, the model is run with NCEP meteorologicaland MOZART chemical conditions for 48 h. The model’s meteorology is re-initializedevery five days based on NCEP, while chemistry adopts the previous state.
26089
ACPD14, 26085–26125, 2014
Simulating aerosol–radiation–cloud
feedbacks over E.China under severe
haze conditions
B. Zhang et al.
Title Page
Abstract Introduction
Conclusions References
Tables Figures
J I
J I
Back Close
Full Screen / Esc
Printer-friendly Version
Interactive Discussion
Discussion
Paper
|D
iscussionP
aper|
Discussion
Paper
|D
iscussionP
aper|
In order to investigate the impact of aerosol feedbacks on meteorology and air qual-ity, three WRF-Chem simulation scenarios are performed and compared. The first isthe baseline scenario (BASE), including all aerosol effects on meteorology (i.e., di-rect, indirect, and semi-direct). The second scenario (RAD) focuses on the radiativeeffects by excluding aerosol indirect effects from the BASE scenario. The third scenario5
(EMP) does not contain any aerosol effects on meteorology. Other than the differencesin aerosols effects, the three scenarios are identical in input data (e.g., emissions,boundary conditions, etc) and model setups. The difference between BASE and EMP(BASE−EMP) is used to investigate the impact of total aerosol feedbacks, while thedifference between BASE and RAD (BASE−RAD) and that between RAD and EMP10
(RAD−EMP) represents the influence of aerosol indirect effects and radiative (bothdirect and semi-direct) effects, respectively. Table 1 summaries the characteristics ofthe three scenarios.
2.2 Emissions
Anthropogenic emissions are taken from the Multi-resolution Emission Inventory of15
China (MEIC) (http://www.meicmodel.org/), which provides emissions of sulfur diox-ide (SO2), nitrogen oxides (NOx), carbon monoxide (CO), ammonia (NH3), BC, OC,PM10, PM2.5, and non-methane volatile organic compounds (NMVOCs) for China forthe year 2010. NOx emissions contain 90 % of NO2 and 10 % of NO by mole fraction.PM emissions are assumed to be split into 20 % in nuclei mode and 80 % in accumu-20
lation mode.Biogenic emissions are calculated on-line in the model based on the Model of Emis-
sions of Gases and Aerosols from Nature (MEGAN) inventory (Guenther et al., 2006).Dust is included in the simulations, while sea salt or dimethylsulfide (DMS) are not, andtheir impacts are expected to be small over eastern China in winter.25
26090
ACPD14, 26085–26125, 2014
Simulating aerosol–radiation–cloud
feedbacks over E.China under severe
haze conditions
B. Zhang et al.
Title Page
Abstract Introduction
Conclusions References
Tables Figures
J I
J I
Back Close
Full Screen / Esc
Printer-friendly Version
Interactive Discussion
Discussion
Paper
|D
iscussionP
aper|
Discussion
Paper
|D
iscussionP
aper|
2.3 Observations
The simulation results are compared with meteorological and chemical observations.Daily meteorological observations at 523 stations are obtained from the National Cli-mate Data Center (NCDC) of China Meteorological Administration (CMA), including2 m temperature, 2 m relative humidity (RH), and 10 m wind speed. The radiosonde5
profiles at 20 stations are provided by the department of atmospheric science in Uni-versity of Wyoming (http://weather.uwyo.edu/upperair/sounding.html).
The real-time hourly near surface PM2.5 mass concentrations are obtained fromChina National Environmental Monitoring Center (CNEMC). The observation data werereleased since January 2013, including SO2, NO2, CO, Ozone (O3), PM10 and PM2.510
in 74 big cities in China. This database allows for a spatially extensive evaluation of airquality simulations by atmospheric models.
3 Model evaluations
Accurate representation of meteorology and aerosols distributions in the model pro-vides the foundations of quantifying aerosol feedbacks. Therefore, in this section, the15
model performances are evaluated by comparing model results with surface and ra-diosonde observations. If not otherwise specified, the model results presented in thissection are from BASE scenario, which represents the most comprehensive realizationof different processes in the model. It should be noted that systematic differences mayresult from the comparison between grid-mean values and point measurements, since20
a model grid covers an area of 729 km2 (27km×27km).
3.1 Meteorology
Meteorology strongly affects formations, transportations, and eliminations of atmo-spheric aerosols. The selected near surface meteorological variables are 2 m temper-ature, 2 m relative humidity, and 10 m wind speed. Vertical profiles of temperature, rel-25
26091

ACPD14, 26085–26125, 2014
Simulating aerosol–radiation–cloud
feedbacks over E.China under severe
haze conditions
B. Zhang et al.
Title Page
Abstract Introduction
Conclusions References
Tables Figures
J I
J I
Back Close
Full Screen / Esc
Printer-friendly Version
Interactive Discussion
Discussion
Paper
|D
iscussionP
aper|
Discussion
Paper
|D
iscussionP
aper|
ative humidity and wind speed are also compared. Figure 2 shows the time series ofobserved and simulated daily mean meteorological variables, with the statistical sum-mary of the comparisons shown in Table 2. The model reproduces temporal variationsof meteorological variables.
The statistical indices used here are mean observation (MEAN OBS), mean simula-5
tion (MEAN SIM), correlation coefficient (Corr. R), mean bias (MB), normalized meanbias (NMB), and root mean square error (RMSE). The definitions of these indices aregiven in the Appendix. The model reproduces 2 m temperature with a correlation of0.97 and a cold bias of −1.0 ◦C, mainly due to underestimation in the first 9 days of themonth. Relative humidity is simulated with a correlation of 0.47 and a negligible mean10
bias. The 10 m wind speed is systematically overestimated by the model by 105 %. Thishigh positive bias in wind speed is also reported by several other studies using WRF-Chem (Matsui et al., 2009; Molders et al., 2012; Tuccella et al., 2012; Zhang et al.,2010).
Air pollution is influenced not only by surface meteorology, but also by vertical pat-15
terns of meteorological variables. In Fig. 3, the monthly mean vertical profiles of simu-lated meteorological variables are compared with sounding observations at 00:00 and12:00 UTC. Generally, the model captures vertical variations of meteorological vari-ables. The model well reproduces vertical variations of temperature with a small bias.The model underestimates relative humidity below 650 hPa and overestimates it in the20
upper levels. Wind speeds are overestimated in the lower atmosphere and underesti-mated in the upper atmosphere. The errors in meteorology may have influences on theaccuracies of simulating processes of aerosol formation, transportation and deposition.Overall, the evaluations presented here suggest that the model adequately simulatesthe spatial and temporal variations of meteorological variables of significant relevance25
to air quality.
26092
ACPD14, 26085–26125, 2014
Simulating aerosol–radiation–cloud
feedbacks over E.China under severe
haze conditions
B. Zhang et al.
Title Page
Abstract Introduction
Conclusions References
Tables Figures
J I
J I
Back Close
Full Screen / Esc
Printer-friendly Version
Interactive Discussion
Discussion
Paper
|D
iscussionP
aper|
Discussion
Paper
|D
iscussionP
aper|
3.2 PM2.5
We first evaluate the spatial distributions of simulated monthly mean PM2.5 massconcentrations by comparing model results with observations at 71 big cities in themodel domain in January 2013. As shown in Fig. 4, the model well captures the spa-tial patterns of PM2.5 during the month, including high levels of PM2.5 over southern5
Hebei, Henan, Hubei Province, Sichuan Basin and three big cities (Harbin, Changchun,Shenyang) in Northeast China. The North China Plain (NCP), Central China (CC) area,and Sichuan Basin have the highest monthly mean PM2.5 mass concentrations. PM2.5pollution is more severe over the Yangtze River Delta (YRD) than that over the PearlRiver Delta (PRD).10
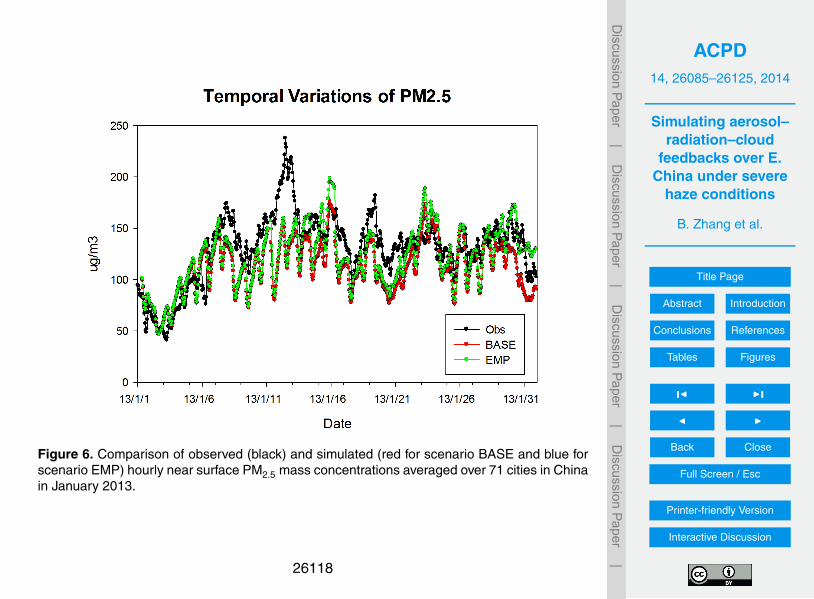
Figure 5 presents the scatter plots of observed and simulated monthly mean PM2.5mass concentrations at 71 cities. The model has a low bias ranging from 25 to 70 %for cities with monthly mean PM2.5 exceeding 200 µg m−3. The observed and simulatedtime-series of hourly surface PM2.5 averaged over all the cities are compared in Fig. 6.The model simulates hourly PM2.5 with a temporal correlation of 0.67, and underesti-15
mates monthly mean PM2.5 mass concentrations by 18.9 µg m−3 (15.0 %). The modelgenerally reproduces the observed temporal variations of PM2.5.
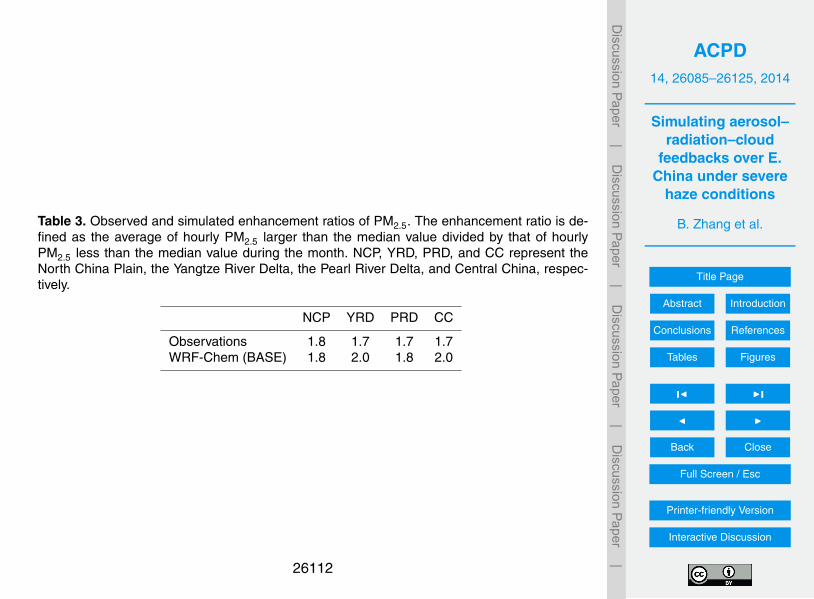
The enhancement ratio is employed to further evaluate the model’s performancesin simulating PM2.5 temporal variations in different regions. The enhancement ratio isdefined as the average of hourly PM2.5 mass concentrations exceeding the median20
divided by that less than the median, representing changes of PM2.5 from clean to pol-luted situations. As shown in Table 3, observed enhancement ratios are around 1.7 overNCP, YRD, PRD and CC. The simulated enhancement ratios range from 1.8 to 2.0 overthe four regions, which are close to observations. Since changes of hourly emissions isnot considered in this study, PM2.5 enhancements mainly result from worsened meteo-25
rological conditions and more productions of secondary aerosols. The consistencies ofsimulated enhancement ratios with observed ones indicate the WRF-Chem model has
26093

ACPD14, 26085–26125, 2014
Simulating aerosol–radiation–cloud
feedbacks over E.China under severe
haze conditions
B. Zhang et al.
Title Page
Abstract Introduction
Conclusions References
Tables Figures
J I
J I
Back Close
Full Screen / Esc
Printer-friendly Version
Interactive Discussion
Discussion
Paper
|D
iscussionP
aper|
Discussion
Paper
|D
iscussionP
aper|
some success in simulating changes of aerosol related meteorological and chemicalprocesses from clean to polluted situations.
However, the model fails to capture the extremely high values of PM2.5 during thehaze episodes in January 2013, for example, January 13–15 and January 18–20. Bothpositive and negative bias exists in simulated hourly PM2.5. The model’s underestima-5
tion during severe winter haze episodes is consistent with previous studies (Liu et al.,2010; L. T. Wang et al., 2014; Y. X. Wang et al., 2014; Zhou et al., 2014). Possiblereasons for this underestimation are: (1) bias in simulating meteorological conditionsduring haze episodes, (2) uncertainties in emissions, (3) missing secondary organicaerosols in the MOSAIC mechanism; and (4) lack of formation mechanisms of sec-10
ondary inorganic aerosols, like heterogeneous oxidation of SO2 on the surface of par-ticulate matters (Harris et al., 2013). By adjusting SO2 and NOx emissions accordingto surface observations and parameterizing the heterogeneous oxidation of SO2 ondeliquesced aerosols in GEOS-Chem model, Y. X. Wang et al. (2014) reported im-provements of simulated PM2.5 spatial distribution and an increase of 120 % in sulfate15
fraction in PM2.5.
4 Aerosol feedbacks on meteorology and air quality
As seen in the previous section, the WRF-Chem model has shown some success insimulating meteorology and PM2.5. Therefore, in this section, we aim to characterizeand quantify the aerosol feedbacks on meteorology and air quality by comparing the20
three different scenarios described in Sect. 2.In addition to different setups of the aerosol–radiation–cloud feedbacks, differences
among the three scenarios can also result from model noise, such as errors in nu-merical computation and disturbances from discrete updating initial and boundary con-ditions. The Student’s t test is employed to identify statistically significant differences25
between the scenarios. We only present and discuss aerosol-induced changes of me-teorological and chemical variables which exceed 95 % confidence interval.
26094

ACPD14, 26085–26125, 2014
Simulating aerosol–radiation–cloud
feedbacks over E.China under severe
haze conditions
B. Zhang et al.
Title Page
Abstract Introduction
Conclusions References
Tables Figures
J I
J I
Back Close
Full Screen / Esc
Printer-friendly Version
Interactive Discussion
Discussion
Paper
|D
iscussionP
aper|
Discussion
Paper
|D
iscussionP
aper|
4.1 Feedbacks on meteorology
The evolution of atmospheric aerosols is strongly influenced by meteorological vari-ables, such as solar radiation, air temperature, and wind speed, etc. Figure 7 illus-trates aerosol impacts on downward shortwave flux at the ground, 2 m temperature,10 m wind speed and PBL height over eastern China in January 2013. Downward5
shortwave flux at the ground is strongly influenced by the existence of atmosphericaerosols, especially over high aerosol-loading regions. Aerosols affect shortwave ra-diation reaching the ground in two ways. First, particles scatter and absorb incomingsolar radiation directly, resulting in surface dimming. Second, in-cloud particles changecloud lifetime and albedo, thus causing variations of shortwave radiation at the ground10
surface. As in Fig. 7a, the downward shortwave flux at the ground is reduced overvast areas of eastern China by up to −84.0 W m−2, which mainly results from aerosolradiative effects (Fig. 7b). By employing ground-based measurements, aerosol opti-cal and radiative properties over NCP during January 2013 were characterized in Biet al. (2014) and Che et al. (2014). They reported strong negative aerosol direct radia-15
tive forcing at the surface (with maximum daily mean exceeding −200.0 W m−2), whichour finding is consistent with. Forkel et al. (2012) simulated aerosol direct and indirecteffects over Europe, where aerosol concentrations were relatively low (PM2.5 = 10–20 µg m−3), and suggested that the aerosol indirect effects dominated in aerosol feed-backs on downward shortwave flux at the ground. Different from Forkel et al. (2012), we20
find that aerosol indirect effects have little influence on the downward shortwave flux atthe ground (not shown here). This may be explained that cloud is not so important inwinter over the continent.
When the downward shortwave flux at the ground is decreased due to aerosol inter-ception, near surface energy fluxes are suppressed, leading to a weaker convection.25
Near surface air is heated mainly by longwave radiation emitted from the ground. Inthat case, when shortwave flux at the ground is decreased, less longwave radiationis emitted from the surface and thus the near surface air is cooled. Due to a weaker
26095

ACPD14, 26085–26125, 2014
Simulating aerosol–radiation–cloud
feedbacks over E.China under severe
haze conditions
B. Zhang et al.
Title Page
Abstract Introduction
Conclusions References
Tables Figures
J I
J I
Back Close
Full Screen / Esc
Printer-friendly Version
Interactive Discussion
Discussion
Paper
|D
iscussionP
aper|
Discussion
Paper
|D
iscussionP
aper|
convection resulted from less shortwave radiation reaching the ground, 2 m tempera-ture is reduced by up to 3.2 ◦C, 10 m wind speed is reduced by up to 0.8 m s−1, andPBL height is also reduced by up to 268 m, as shown in Fig. 7c, e and g, respectively.Meteorological variables such as air temperature, wind speed, and PBL height couldalso be influenced by other factors like land surface properties (Zhang et al., 2010),5
other than solar radiations. So that changes of these variables, especially wind speed,are less significant than solar radiation. However, the spatial patterns of changes ofthese variables are consistent with that of downward shortwave flux, which indicatesthat a more stable lower atmosphere resulting from less shortwave radiation plays animportant role in aerosol feedbacks. The aerosol indirect effects during severe haze10
episode are found to be not significant in altering solar radiation, temperature, windspeed or PBL height over eastern China, which is not shown here. Overall, the nearsurface atmosphere is more stable when aerosol feedback is considered in the model,which is conductive for pollution accumulation.
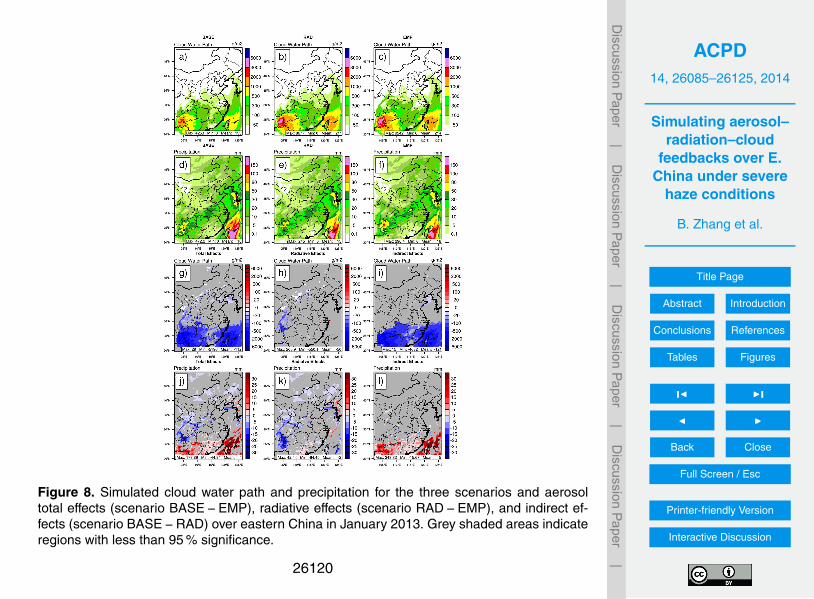
The amount of precipitation is low in January for most regions in China (Wang and15
Zhou, 2005). Cloud and precipitation formations mainly occur over areas in the southand over the ocean (Fig. 8a and d). In this month, the changes of cloud and precipita-tion due to aerosol radiative effects are not significant (Fig. 8h). Aerosol indirect effectsdirectly alter cloud properties such as effective radius, cloud lifetime, and precipitationrate. As shown in Fig. 8i, aerosol indirect effects play a much more significant role in20
changing cloud properties. Cloud water path is greatly reduced by up to 5.7 kg m−2 overthe junction of Yunnan and Guizhou Province and ocean around Taiwan. The reduc-tion over these relatively clean areas may be explained by the lower particle numberconcentrations in the BASE scenario than the default droplet number mixing ratio of1.0×106 kg−1 in scenarios without aerosol indirect effect. Reduced cloud droplet num-25
ber results in accelerating auto-conversion to rain droplets. Thus, simulated monthlyprecipitation is increased by almost 100 % over these areas (Fig. 8j). Similar resultsare found when we replace the Lin microphysics scheme by the two-moment Morri-son scheme (Morrison et al., 2009). Previous model assessments also showed that
26096
ACPD14, 26085–26125, 2014
Simulating aerosol–radiation–cloud
feedbacks over E.China under severe
haze conditions
B. Zhang et al.
Title Page
Abstract Introduction
Conclusions References
Tables Figures
J I
J I
Back Close
Full Screen / Esc
Printer-friendly Version
Interactive Discussion
Discussion
Paper
|D
iscussionP
aper|
Discussion
Paper
|D
iscussionP
aper|
the inclusion of aerosol indirect effect reduced cloud water content over South Pacificocean and made model simulations match better with aircraft observations (Yang et al.,2011). The relatively small precipitation, as well as small changes of precipitation dueto aerosol feedbacks over the most parts of the domain, suggests that precipitation hasa minor effect on near surface aerosols in January 2013.5
4.2 Feedbacks on air quality
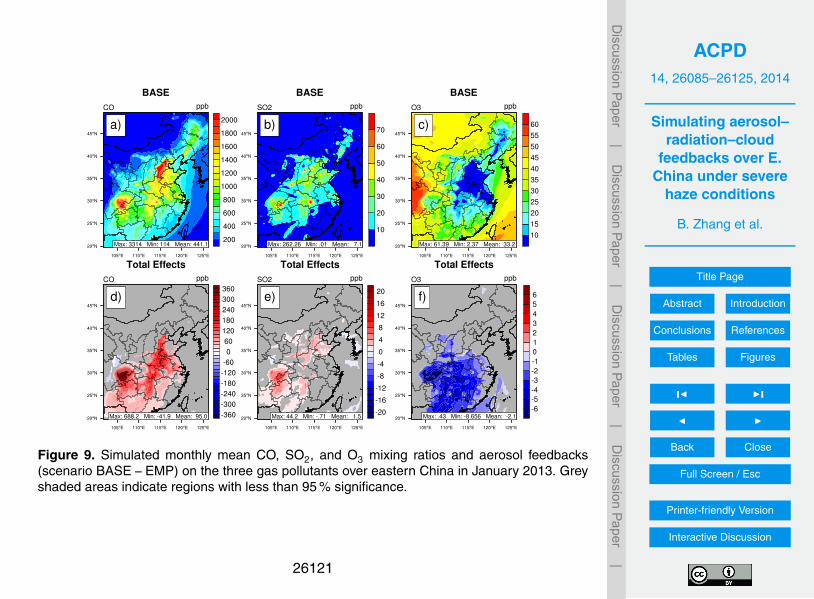
Through moderating meteorological variables, aerosols exert feedbacks on air quality.Figure 9 shows spatial distributions of CO, SO2, and O3 and aerosol feedbacks onthe three gas pollutants in January 2013. Spatial patterns of CO and SO2 are sim-ilar with that of PM2.5, indicating similar sources of these pollutants. The near sur-10
face CO and SO2 concentrations are increased when aerosol feedbacks are included.CO is enhanced by up to 446 ppb, while SO2 is increased by as much as 28 ppb.Large increases of CO and SO2 are found over areas with high aerosol loading. Thisphenomenon may mainly result from lower PBL and a more stable atmosphere nearthe surface due to aerosol radiative effects, as discussed in Sect. 3.2. We also found15
aerosol indirect effects do not have significant influence on gas pollutants.The formation of O3 is directly related to solar radiation and temperature in regions
with sufficient NOx and VOCs. The lower air temperature and reduced incoming solarradiation as a result of aerosols radiative effects lead to reduced photolysis rate of NO2and consequently reduce O3 concentrations. The largest suppression of surface ozone20
by aerosols is found to be up to −6.9 ppb in the warmer southern China. Changesin northern China are relatively small. These findings are similar to those in Zhanget al. (2010) and Forkel et al. (2012).
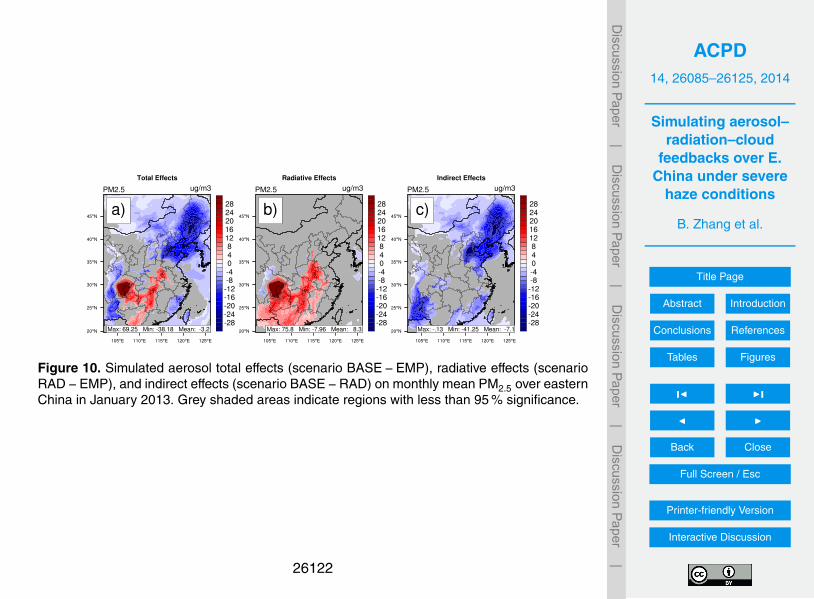
The aerosol–radiation–cloud feedbacks on near surface aerosol mass concentra-tions are illustrated in Fig. 10. As shown in Fig. 10a, both increases and decreases25
of PM2.5 are found in the domain. Enhanced PM2.5 mass concentrations are simulatedover Henan, Hubei, Guangxi Province, and Sichuan Basin with the maximum enhance-ment of 69.3 µg m−3. Reduction in PM2.5 as much as −38.2 µg m−3 are simulated over
26097
ACPD14, 26085–26125, 2014
Simulating aerosol–radiation–cloud
feedbacks over E.China under severe
haze conditions
B. Zhang et al.
Title Page
Abstract Introduction
Conclusions References
Tables Figures
J I
J I
Back Close
Full Screen / Esc
Printer-friendly Version
Interactive Discussion
Discussion
Paper
|D
iscussionP
aper|
Discussion
Paper
|D
iscussionP
aper|
Bohai Sea surrounding area, Northeast China and the conjunction area of Yunnan,Guangxi, and Guizhou Province (Southwest China).
In order to better understand mechanisms of how PM2.5 respond to aerosol feed-backs, aerosol effects are divided into aerosol radiative effects (Fig. 10b) and indirecteffects (Fig. 10c). PM2.5 can be influenced by changes in various atmospheric pro-5
cesses due to aerosol radiative effects. For example, lower temperature may suppressthe formation of sulfate, and reduced solar radiation may inhibit the oxidations of pre-cursors of secondary aerosols. Among the various changes in atmospheric processes,the reduced PBL height and the stabilized lower atmosphere is the most important.From Fig. 11b, we can see that PM2.5 is greatly increased by aerosol radiative effects10
over the region where solar radiation and PBL height are significantly reduced duringwinter haze (Fig. 7a and g). The mechanism involved is that aerosol radiative effectsstabilize the lower atmosphere and suppress the dilution and ventilation of PM, whichis the same situation for primary gas pollutants.
The comparison between Fig. 10a and c indicates that aerosol indirect effects are15
the main reason of the suppression of PM2.5. The reduction of PM2.5 in WRF-Chemsimulations with aerosol indirect effects mainly comes from two aspects. First, onceaerosol indirect effects are included in the model, the cloud droplet number is basedon simulated atmospheric aerosol number other than prescribed in scenarios withoutindirect effects. This coding strategy allows interstitial air-borne aerosols to become20
cloud-borne aerosols after activation. Therefore, air-borne aerosols are reduced insimulations including aerosol indirect effects, especially over cloudy regions like south-western China (Fig. 8a). Second, in the simulations including aerosol indirect effects,a more comprehensive in- and below-cloud aerosol wet removal module following themethod of Easter et al. (2004) is employed, while in the simulations without aerosol25
indirect effects, this module is not activated. In this aerosol wet removal mechanism,the removal processes are assumed to be irreversible, and aerosol re-suspension isnot considered, even when precipitation is weak. This leads to a stronger removal ofatmospheric aerosols when including aerosol indirect effects. It should be noted that
26098

ACPD14, 26085–26125, 2014
Simulating aerosol–radiation–cloud
feedbacks over E.China under severe
haze conditions
B. Zhang et al.
Title Page
Abstract Introduction
Conclusions References
Tables Figures
J I
J I
Back Close
Full Screen / Esc
Printer-friendly Version
Interactive Discussion
Discussion
Paper
|D
iscussionP
aper|
Discussion
Paper
|D
iscussionP
aper|
in this work, the enhancement of aerosol wet removal process, when including aerosolindirect effects in the model, mainly results from WRF-Chem model configurations, notfrom aerosol-induced changes in cloud properties or precipitation.
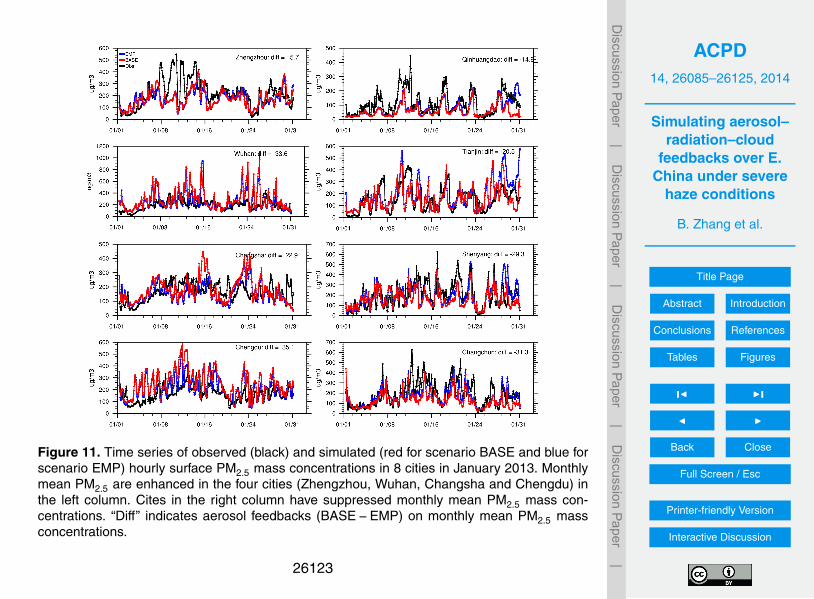
The above discussion is based on model results temporally averaged during thewhole month. In order to better understand PM2.5 variations on a day to day basis, 45
cities with significant PM2.5 enhancements and 4 cities with significant PM2.5 reduc-tions are selected. Figure 11 shows the time series of observed and simulated hourlysurface PM2.5 mass concentrations in the selected 8 cities in January 2013. The fourcites with increasing monthly mean PM2.5 due to aerosol feedbacks are Zhengzhou,Wuhan, Changsha, and Chengdu. Major enhancements of PM2.5 are simulated when10
PM2.5 levels are high, for example, during the period of 15–17 January The changesin PM2.5 has a moderate negative correlation with the changes in PBL height (corre-lations coefficient ≈ −0.3) at the four cites, suggesting that the PM2.5 enhancementis partly caused by decreased PBL height in these regions. Suppressions of PM2.5 inQinhuangdao, Tianjin, Shenyang, and Changchun, which are the four cities with de-15
creased monthly mean PM2.5, mainly happen in the last 5 days of the month (26–31January).
In summary, aerosol radiative effects reduce the downward shortwave flux at theground, decrease near surface temperature and wind speed, and further weaken con-vection, all leading to a more stable lower atmosphere. In a more stable lower atmo-20
sphere due to aerosol radiative effects, primary gas pollutants (CO and SO2) and PM2.5are enhanced, while O3 is decreased because of less incoming solar radiation andlower temperatures. PM2.5 are suppressed when aerosol indirect effects are included,mainly due to the transition from air-borne aerosol to cloud-borne aerosol and the acti-vation of a more comprehensive aerosol wet removal module. The underestimations at25
the higher end indicate that some key mechanisms are missing in the model, especiallythe productions of secondary aerosols.
26099
ACPD14, 26085–26125, 2014
Simulating aerosol–radiation–cloud
feedbacks over E.China under severe
haze conditions
B. Zhang et al.
Title Page
Abstract Introduction
Conclusions References
Tables Figures
J I
J I
Back Close
Full Screen / Esc
Printer-friendly Version
Interactive Discussion
Discussion
Paper
|D
iscussionP
aper|
Discussion
Paper
|D
iscussionP
aper|
5 Effects of including aerosol feedbacks on model’s performances
In previous sections, the model results are evaluated, and the aerosol feedbacks onmeteorology and air quality are characterized and quantified. Atmospheric aerosolsduring severe winter haze episodes bring along changes of incoming solar radiation,near surface temperature, PBL height and lower atmosphere stability, which is dis-5
cussed in Sect. 4. Furthermore, these changes of meteorological variables increase ordecrease near surface PM2.5 concentrations through direct or indirect influences. Forexample, reductions of PBL height and stabilized lower atmosphere increase near sur-face PM2.5 concentrations, while lower temperature inhibits productions of secondaryaerosols. Therefore, whether or not inclusions of aerosol feedbacks in the model im-10
proves model’s performances in simulating severe winter haze episodes is not obviousand need to be investigated.
In this section we address the question whether including aerosol feedbacks withinthe model improves model’s performances in simulating severe haze episodes. Modelresults from the BASE (with all aerosol feedbacks) and EMP (without any aerosol feed-15
backs) scenarios are compared with observations to evaluate which scenario is moreconsistent with reality.
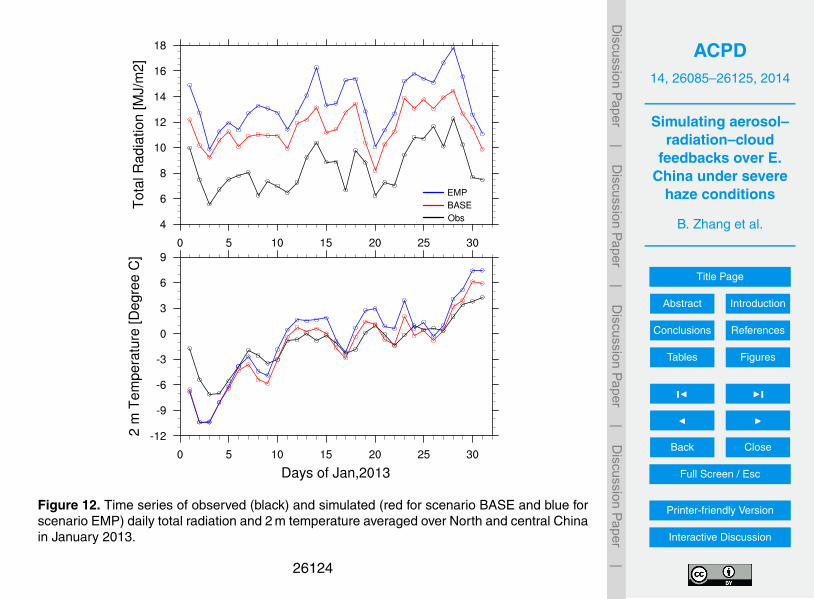
As an example to shown the extent to which simulated meteorological variables areaffected by including aerosol feedbacks, Fig. 12 compares downward shortwave radi-ation at the ground and temperature between the BASE and EMP scenario over NCP,20
where PM2.5 pollution is most severe in January 2013. Both scenarios have a highbias in daily total shortwave radiation at the ground, mainly due to the overestimationof maximum shortwave radiation at noon (Z. F. Wang et al., 2014). However, the in-clusion of aerosol feedbacks leads to a 22 % reduction of the normalized mean bias.The model prediction of 2 m temperature is also improved in the scenario with aerosol25
feedbacks during haze episodes, such like 12–15 and 19–24 January. These findingsare consistent with the results in Z. F. Wang et al. (2014), indicating the importance
26100

ACPD14, 26085–26125, 2014
Simulating aerosol–radiation–cloud
feedbacks over E.China under severe
haze conditions
B. Zhang et al.
Title Page
Abstract Introduction
Conclusions References
Tables Figures
J I
J I
Back Close
Full Screen / Esc
Printer-friendly Version
Interactive Discussion
Discussion
Paper
|D
iscussionP
aper|
Discussion
Paper
|D
iscussionP
aper|
of including aerosol feedbacks in simulating meteorology under high aerosol loadingconditions.
Figures 5 and 6 compare simulated PM2.5 over 71 big cities in January 2013 in BASEand EMP scenarios averaged temporally and spatially, respectively. However, no sig-nificant improvements are found when aerosol feedbacks are included, partially due5
to the missing of smaller scale temporal and spatial information averaging. So we fur-ther investigate the model’s performances in simulating PM2.5 over several importantregions. Box plots of monthly mean PM2.5 mass concentrations in January 2013 overNCP, YRD, PRD and CC are displayed in Fig. 12. Over all the four areas, the medianvalues of hourly PM2.5 are underestimated in scenario EMP, in which aerosol feed-10
backs are excluded. Biases of the median values in EMP scenario are −29.1, −16.8,−10.7, −5.3 % over NCP, YRD, PRD, and CC, respectively. Simulations of hourly PM2.5mass concentration distributions are improved when aerosol feedbacks are included inBASE scenario in two aspects. First, biases of the median values are reduced to −22.0,−12.0, −6.7, +2.6 % over NCP, YRD, PRD, and CC, respectively. Second, the distribu-15
tion of middle 50 % (ranging from 25th percentile to 75th percentile) hourly PM2.5 massconcentrations is more consistent with observations than without aerosol feedbacksin the model. We also find an positive feedback for PM2.5. That is, aerosols increasePM2.5 through meteorological and chemical processes.
Overall in this section, we demonstrate the significance of including aerosol feed-20
backs in the model. Inclusions of aerosol feedbacks in the model reproduce aerosoleffects on solar radiation and temperature. Thus, biases of simulated meteorology arereduced. Though reactions of PM2.5 to aerosol feedbacks are complex, inclusions ofaerosol feedbacks improves model’s performances to some extent in simulating PM2.5in winter haze conditions.25
26101
ACPD14, 26085–26125, 2014
Simulating aerosol–radiation–cloud
feedbacks over E.China under severe
haze conditions
B. Zhang et al.
Title Page
Abstract Introduction
Conclusions References
Tables Figures
J I
J I
Back Close
Full Screen / Esc
Printer-friendly Version
Interactive Discussion
Discussion
Paper
|D
iscussionP
aper|
Discussion
Paper
|D
iscussionP
aper|
6 Conclusions
In this work, the fully coupled on-line WRF-Chem model is applied to investigateaerosol–radiation–cloud feedbacks on meteorology and air quality over eastern Chinain January 2013, in which month China experienced the most severe haze pollutionin history. Three simulation scenarios including different aerosol configurations are un-5
dertaken and compared.Results in the baseline simulation show that the model well captures temporal and
vertical variations of meteorological variables, except for overestimating lower atmo-sphere wind speed which is a common issue for the WRF-Chem model. The modelreproduces spatial distribution of monthly mean PM2.5 mass concentration, with high10
aerosol concentrations over southern Hebei, Henan, Hubei Province, Sichuan Basinand three big cities (Harbin, Changchun, Shenyang) in Northeast China. Monthly meanPM2.5 averaged over 71 big cities is underestimated by 15 %. The model tends to un-derestimate PM2.5 at the high ends, which is a common problem models are facingwith in simulating haze conditions. Further studies improving model abilities in simulat-15
ing high aerosol pollution are needed.Previous work indicated that the influences on air quality meteorology of aerosol
indirect effects are larger than radiative effects, but this was derived under conditionswith much lower aerosol loadings than those in our study. In this work we find that underwinter haze conditions, aerosol radiative effects (direct effect and semi-direct effects)20
play a dominant role in modulating downward shortwave flux at the ground surface,lower atmosphere temperature, wind speed and PBL height. These four meteorologicalvariables are reduced by up to 84.0 W m−2, 3.2 ◦C, 0.8 m s−1, and 268 m, respectively.However, aerosol indirect effects are more important than radiative effects in alteringcloud properties and precipitation.25
The lower PBL and smaller wind speed result in increases of near surface CO andSO2 concentrations. Higher aerosol loading reduces solar radiation and temperatureat the surface, which results in a reduction of NO2 photolysis rate and subsequently
26102
ACPD14, 26085–26125, 2014
Simulating aerosol–radiation–cloud
feedbacks over E.China under severe
haze conditions
B. Zhang et al.
Title Page
Abstract Introduction
Conclusions References
Tables Figures
J I
J I
Back Close
Full Screen / Esc
Printer-friendly Version
Interactive Discussion
Discussion
Paper
|D
iscussionP
aper|
Discussion
Paper
|D
iscussionP
aper|
a reduction in a reduction of O3 mixing ratios by up to 6.9 ppb. The aerosol feedbackson PM2.5 concentrations exhibit large spatial variations. Both increases and decreasesof PM2.5 are found in the domain. The enhancements of PM2.5 over Henan, HubeiProvince, and Sichuan Basin by up to 17.8 µg m−3 are mainly due to large reductionof PBL height in these areas. The suppressions of PM2.5 over Bohai Sea surrounding5
area, Northeast China, and Southwestern China are resulted from the transition fromair-borne aerosol to cloud-borne aerosol and the activation of a more comprehensiveaerosol wet removal module.
The inclusion of aerosol feedback improves the model’s ability in simulating down-ward shortwave radiation and temperature. Simulations of hourly PM2.5 mass concen-10
tration distributions over NCP, YRD, PRD, and CC, are also improved when aerosolfeedbacks are included. These indicates the importance of involving aerosol–radiation–cloud interactions in modeling air quality meteorology.
There are a number of limitations in this work. The relative coarse grid (27 km), theuncertainty of emission inventory, and the lack of secondary organic matters all con-15
tribute to the uncertainties in simulating aerosols. Also, one month length simulationcould not represent a full view of aerosol–radiation–cloud feedbacks. Better under-standings in the future are expected by applying more comprehensive aerosol treat-ments and a longer time period. Previous studies mainly focus on mechanisms of se-vere winter haze formation. Different from them, this work demonstrates the importance20
of aerosol feedbacks on meteorology and air quality during severe winter haze periods.
Appendix A:
The statistical indices used in this study are defined as following.Mean Bias (MB)
MB = 1/NN∑i=1
(Mi −Oi )25
26103
ACPD14, 26085–26125, 2014
Simulating aerosol–radiation–cloud
feedbacks over E.China under severe
haze conditions
B. Zhang et al.
Title Page
Abstract Introduction
Conclusions References
Tables Figures
J I
J I
Back Close
Full Screen / Esc
Printer-friendly Version
Interactive Discussion
Discussion
Paper
|D
iscussionP
aper|
Discussion
Paper
|D
iscussionP
aper|
Normalized Mean Bias (NMB)
NMB =
∑Ni=1 (Mi −Oi )∑N
i=1Oi
×100%
Correlation Coefficient (Corr. R)
Corr. R =
∑Ni=1
(Mi −M
)(Oi −O
)√∑N
i=1
(Mi −M
)2√∑N
i=1
(Oi −O
)2
Root Mean Square Error (RMSE)5
RMSE =
√1/N
∑N
i=1(Mi −Oi )2
where M = 1/N∑N
i=1Mi , O = 1/N∑N
i=1Oi , M and O are model result and observationfor sample i , respectively. N is the number of samples.
Acknowledgements. This research was supported by the National Key Basic Research Pro-gram of China (2014CB441302), the CAS Strategic Priority Research Program (Grant No.10
XDA05100403), and the Beijing Nova Program (Z121109002512052).
References
Albrecht, B. A.: Aerosols, cloud microphysics, and fractional cloudiness, Science, 245, 1227–1230, 1989.
Bi, J., Huang, J., Hu, Z., Holben, B. N., and Guo, Z.: Investigate the aerosol optical and radiative15
characteristics of heavy haze episodes in Beijing during January of 2013, J. Geophys. Res.-Atmos., 9884–9900, doi:10.1002/2014JD021757, 2014.
26104

ACPD14, 26085–26125, 2014
Simulating aerosol–radiation–cloud
feedbacks over E.China under severe
haze conditions
B. Zhang et al.
Title Page
Abstract Introduction
Conclusions References
Tables Figures
J I
J I
Back Close
Full Screen / Esc
Printer-friendly Version
Interactive Discussion
Discussion
Paper
|D
iscussionP
aper|
Discussion
Paper
|D
iscussionP
aper|
Chapman, E. G., Gustafson Jr., W. I., Easter, R. C., Barnard, J. C., Ghan, S. J., Pekour, M. S.,and Fast, J. D.: Coupling aerosol–cloud–radiative processes in the WRF-Chem model: In-vestigating the radiative impact of elevated point sources, Atmos. Chem. Phys., 9, 945–964,doi:10.5194/acp-9-945-2009, 2009.
Charlson, R. and Pilat, M.: Climate: the influence of aerosols, J. Appl. Meteorol., 8, 1001–1002,5
1969.Che, H., Xia, X., Zhu, J., Li, Z., Dubovik, O., Holben, B., Goloub, P., Chen, H., Estelles, V.,
Cuevas-Agulló, E., Blarel, L., Wang, H., Zhao, H., Zhang, X., Wang, Y., Sun, J., Tao, R.,Zhang, X., and Shi, G.: Column aerosol optical properties and aerosol radiative forcing dur-ing a serious haze-fog month over North China Plain in 2013 based on ground-based sun-10
photometer measurements, Atmos. Chem. Phys., 14, 2125–2138, doi:10.5194/acp-14-2125-2014, 2014.
Chen, F. and Dudhia, J.: Coupling an advanced land surface–hydrology model with the PennState-NCAR MM5 modeling system. Part I: Model implementation and sensitivity, Mon.Weather Rev., 129, 569–585, 2001.15
Chou, M.-D., Suarez, M. J., Ho, C.-H., and Yan, M. M.-H.: Parameterizations forcloud overlapping and shortwave single-scattering properties for use in general cir-culation and cloud ensemble models, J. Climate, 11, 202–214, doi:10.1175/1520-0442(1998)011<0202:PFCOAS>2.0.CO;2, 1998.
Emmons, L. K., Walters, S., Hess, P. G., Lamarque, J.-F., Pfister, G. G., Fillmore, D., Granier, C.,20
Guenther, A., Kinnison, D., Laepple, T., Orlando, J., Tie, X., Tyndall, G., Wiedinmyer, C.,Baughcum, S. L., and Kloster, S.: Description and evaluation of the Model for Ozoneand Related chemical Tracers, version 4 (MOZART-4), Geosci. Model Dev., 3, 43–67,doi:10.5194/gmd-3-43-2010, 2010.
Fan, J., Zhang, R., Tao, W. K., and Mohr, K. I.: Effects of aerosol optical properties on25
deep convective clouds and radiative forcing, J. Geophys. Res.-Atmos., 113, D08209,doi:10.1029/2007JD009257, 2008.
Fast, J. D., Gustafson, W. I., Easter, R. C., Zaveri, R. A., Barnard, J. C., Chapman, E. G.,Grell, G. A., and Peckham, S. E.: Evolution of ozone, particulates, and aerosol direct radiativeforcing in the vicinity of Houston using a fully coupled meteorology–chemistry–aerosol model,30
J. Geophys. Res.-Atmos., 111, D21305, doi:10.1029/2005JD006721, 2006.
26105
ACPD14, 26085–26125, 2014
Simulating aerosol–radiation–cloud
feedbacks over E.China under severe
haze conditions
B. Zhang et al.
Title Page
Abstract Introduction
Conclusions References
Tables Figures
J I
J I
Back Close
Full Screen / Esc
Printer-friendly Version
Interactive Discussion
Discussion
Paper
|D
iscussionP
aper|
Discussion
Paper
|D
iscussionP
aper|
Forkel, R., Werhahn, J., Hansen, A. B., McKeen, S., Peckham, S., Grell, G., and Suppan, P.:Effect of aerosol–radiation feedback on regional air quality – a case study with WRF/Chem,Atmos. Environ., 53, 202–211, 2012.
Grell, G. and Baklanov, A.: Integrated modeling for forecasting weather and airquality: a call for fully coupled approaches, Atmos. Environ., 45, 6845–6851,5
doi:10.1016/j.atmosenv.2011.01.017, 2011.Grell, G. A. and Dévényi, D.: A generalized approach to parameterizing convection combining
ensemble and data assimilation techniques, Geophys. Res. Lett., 29, 38-31–38-34, 2002.Grell, G. A., Peckham, S. E., Schmitz, R., McKeen, S. A., Frost, G., Skamarock, W. C., and
Eder, B.: Fully coupled “online” chemistry within the WRF model, Atmos. Environ., 39, 6957–10
6975, 2005.Guenther, A., Karl, T., Harley, P., Wiedinmyer, C., Palmer, P. I., and Geron, C.: Estimates
of global terrestrial isoprene emissions using MEGAN (Model of Emissions of Gases andAerosols from Nature), Atmos. Chem. Phys., 6, 3181–3210, doi:10.5194/acp-6-3181-2006,2006.15
Hansen, J., Sato, M., and Ruedy, R.: Radiative forcing and climate response, J. Geophys. Res.-Atmos., 102, 6831–6864, 1997.
Harris, E., Sinha, B., van Pinxteren, D., Tilgner, A., Fomba, K. W., Schneider, J., Roth, A.,Gnauk, T., Fahlbusch, B., and Mertes, S.: Enhanced role of transition metal ion catalysisduring in-cloud oxidation of SO2, Science, 340, 727–730, 2013.20
Hong, S.-Y., Noh, Y., and Dudhia, J.: A new vertical diffusion package with an explicit treatmentof entrainment processes, Mon. Weather Rev., 134, 2318–2341, doi:10.1175/MWR3199.1,2006.
Huang, K., Zhuang, G., Wang, Q., Fu, J. S., Lin, Y., Liu, T., Han, L., and Deng, C.: Extreme hazepollution in Beijing during January 2013: chemical characteristics, formation mechanism and25
role of fog processing, Atmos. Chem. Phys. Discuss., 14, 7517–7556, doi:10.5194/acpd-14-7517-2014, 2014.
Lin, Y.-L., Farley, R. D., and Orville, H. D.: Bulk parameterization of the snow field in a cloudmodel, J. Clim. Appl. Meteorol., 22, 1065–1092, 1983.
Liu, X.-H., Zhang, Y., Cheng, S.-H., Xing, J., Zhang, Q., Streets, D. G., Jang, C., Wang, W.-30
X., and Hao, J.-M.: Understanding of regional air pollution over China using CMAQ, Part IPerformance evaluation and seasonal variation, Atmos. Environ., 44, 2415–2426, 2010.
26106
ACPD14, 26085–26125, 2014
Simulating aerosol–radiation–cloud
feedbacks over E.China under severe
haze conditions
B. Zhang et al.
Title Page
Abstract Introduction
Conclusions References
Tables Figures
J I
J I
Back Close
Full Screen / Esc
Printer-friendly Version
Interactive Discussion
Discussion
Paper
|D
iscussionP
aper|
Discussion
Paper
|D
iscussionP
aper|
Matsui, H., Koike, M., Kondo, Y., Takegawa, N., Kita, K., Miyazaki, Y., Hu, M., Chang, S. Y.,Blake, D. R., Fast, J. D., Zaveri, R. A., Streets, D. G., Zhang, Q., and Zhu, T.: Spatial andtemporal variations of aerosols around Beijing in summer 2006: model evaluation and sourceapportionment, J. Geophys. Res.-Atmos., 114, D00G13, doi:10.1029/2008jd010906, 2009.
Mlawer, E. J., Taubman, S. J., Brown, P. D., Iacono, M. J., and Clough, S. A.: Radiative transfer5
for inhomogeneous atmospheres: RRTM, a validated correlated-k model for the longwave,J. Geophys. Res.-Atmos., 102, 16663–16682, 1997.
Molders, N., Tran, H. N. Q., Cahill, C. F., Leelasakultum, K., and Tran, T. T.: Assessment ofWRF/Chem PM2.5 forecasts using mobile and fixed location data from the Fairbanks, Alaskawinter 2008/09 field campaign, Atmos. Pollut. Res., 3, 180–191, doi:10.5094/apr.2012.018,10
2012.Morrison, H., Thompson, G., and Tatarskii, V.: Impact of cloud microphysics on the develop-
ment of trailing stratiform precipitation in a simulated squall line: comparison of one-andtwo-moment schemes, Mon. Weather Rev., 137, 991 C1007, doi:10.1175/2008MWR2556.1,2009.15
Rosenfeld, D., Lohmann, U., Raga, G. B., O’Dowd, C. D., Kulmala, M., Fuzzi, S., Reissell, A.,and Andreae, M. O.: Flood or drought: how do aerosols affect precipitation?, Science, 321,1309–1313, 2008.
Sun, Y., Jiang, Q., Wang, Z., Fu, P., Li, J., Yang, T., and Yin, Y.: Investigation of the sourcesand evolution processes of severe haze pollution in Beijing in January 2013, J. Geophys.20
Res.-Atmos., 119, 4380–4398, doi:10.1002/2014JD021641, 2014.Tuccella, P., Curci, G., Visconti, G., Bessagnet, B., Menut, L., and Park, R. J.: Modeling of
gas and aerosol with WRF/Chem over Europe: evaluation and sensitivity study, J. Geophys.Res.-Atmos., 117, D03303, doi:10.1029/2011jd016302, 2012.
Twomey, S.: The influence of pollution on the shortwave albedo of clouds, J. Atmos. Sci., 34,25
1149–1152, 1977.Wang, H., Zhang, X., Gong, S., and Xue, M.: The simulation study of the interaction between
aerosols and heavy air pollution weather in East China, AIP Conf. Proc., 1527, 499–502,doi:10.1063/1.4803314, 2013.
Wang, L. T., Wei, Z., Yang, J., Zhang, Y., Zhang, F. F., Su, J., Meng, C. C., and Zhang, Q.: The30
2013 severe haze over southern Hebei, China: model evaluation, source apportionment, andpolicy implications, Atmos. Chem. Phys., 14, 3151–3173, doi:10.5194/acp-14-3151-2014,2014.
26107
ACPD14, 26085–26125, 2014
Simulating aerosol–radiation–cloud
feedbacks over E.China under severe
haze conditions
B. Zhang et al.
Title Page
Abstract Introduction
Conclusions References
Tables Figures
J I
J I
Back Close
Full Screen / Esc
Printer-friendly Version
Interactive Discussion
Discussion
Paper
|D
iscussionP
aper|
Discussion
Paper
|D
iscussionP
aper|
Wang, Y. and Zhou, L.: Observed trends in extreme precipitation events in China during 1961–2001 and the associated changes in large-scale circulation, Geophys. Res. Lett., 32, L09707,doi:10.1029/2005GL022574, 2005.
Wang, Y. S., Yao, L., Wang, L., Liu, Z., Ji, D., Tang, G., Zhang, J., Sun, Y., Hu, B., and Xin, J.:Mechanism for the formation of the January 2013 heavy haze pollution episode over central5
and eastern China, Sci. China Ser. D, 1–12, 2014.Wang, Y. X., Zhang, Q., Jiang, J., Zhou, W., Wang, B., He, K., Duan, F., Zhang, Q., Philip, S.,
and Xie, Y.: Enhanced sulfate formation during China’s severe winter haze episode inJan 2013 missing from current models, J. Geophys. Res.-Atmos., 119, 10425–10440,doi:10.1002/2013JD021426, 2014.10
Wang, Z. F., Li, J., Wang, Z., Yang, W., Tang, X., Ge, B., Yan, P., Zhu, L., Chen, X., and Chen, H.:Modeling study of regional severe hazes over mid-eastern China in January 2013 and itsimplications on pollution prevention and control, Sci. China Ser. D, 57, 3–13, 2014.
Yang, Q., Gustafson Jr., W. I., Fast, J. D., Wang, H., Easter, R. C., Morrison, H., Lee, Y.-N.,Chapman, E. G., Spak, S. N., and Mena-Carrasco, M. A.: Assessing regional scale pre-15
dictions of aerosols, marine stratocumulus, and their interactions during VOCALS-REx us-ing WRF-Chem, Atmos. Chem. Phys., 11, 11951–11975, doi:10.5194/acp-11-11951-2011,2011.
Zaveri, R. A. and Peters, L. K.: A new lumped structure photochemical mechanism for large-scale applications, J. Geophys. Res.-Atmos., 104, 30387–30415, 1999.20
Zaveri, R. A., Easter, R. C., Fast, J. D., and Peters, L. K.: Model for simulatingaerosol interactions and chemistry (MOSAIC), J. Geophys. Res.-Atmos., 113, D13204,doi:10.1029/2007JD008782, 2008.
Zhang, J. K., Sun, Y., Liu, Z. R., Ji, D. S., Hu, B., Liu, Q., and Wang, Y. S.: Characterizationof submicron aerosols during a month of serious pollution in Beijing, 2013, Atmos. Chem.25
Phys., 14, 2887–2903, doi:10.5194/acp-14-2887-2014, 2014.Zhang, Y., Wen, X.-Y., and Jang, C.: Simulating chemistry–aerosol–cloud–radiation–climate
feedbacks over the continental US using the online-coupled Weather Research ForecastingModel with chemistry (WRF/Chem), Atmos. Environ., 44, 3568–3582, 2010.
Zhang, Y., Bocquet, M., Mallet, V., Seigneur, C., and Baklanov, A.: Real-time air quality30
forecasting, part I: History, techniques, and current status, Atmos. Environ., 60, 632–655,doi:10.1016/j.atmosenv.2012.06.031, 2012.
26108
ACPD14, 26085–26125, 2014
Simulating aerosol–radiation–cloud
feedbacks over E.China under severe
haze conditions
B. Zhang et al.
Title Page
Abstract Introduction
Conclusions References
Tables Figures
J I
J I
Back Close
Full Screen / Esc
Printer-friendly Version
Interactive Discussion
Discussion
Paper
|D
iscussionP
aper|
Discussion
Paper
|D
iscussionP
aper|
Zhang, Y., Zhang, X., Cai, C., Wang, K., and Wang, L.: Studying aerosol–cloud–climate inter-actions over East Asia using WRF/Chem, in: Air Pollution Modeling and its Application XXIII,Springer, 61–66, 2014.
Zhao, C., Liu, X., Ruby Leung, L., and Hagos, S.: Radiative impact of mineral dust onmonsoon precipitation variability over West Africa, Atmos. Chem. Phys., 11, 1879–1893,5
doi:10.5194/acp-11-1879-2011, 2011.Zhao, C., Liu, X., and Leung, L. R.: Impact of the Desert dust on the summer monsoon system
over Southwestern North America, Atmos. Chem. Phys., 12, 3717–3731, doi:10.5194/acp-12-3717-2012, 2012.
Zhou, G., Yang, F., Geng, F., Xu, J., Yang, X., and Tie, X.: Measuring and modeling aerosol:10
relationship with Haze Events in Shanghai, China, Aerosol Air Qual. Res., 14, 783–792,2014.
26109

ACPD14, 26085–26125, 2014
Simulating aerosol–radiation–cloud
feedbacks over E.China under severe
haze conditions
B. Zhang et al.
Title Page
Abstract Introduction
Conclusions References
Tables Figures
J I
J I
Back Close
Full Screen / Esc
Printer-friendly Version
Interactive Discussion
Discussion
Paper
|D
iscussionP
aper|
Discussion
Paper
|D
iscussionP
aper|
Table 1. Summary of three simulated scenarios.
CASE name Characteristics
BASE With all aerosol feedbacksRAD Only with aerosol direct and semi-direct effectsEMP Without any aerosol feedbacks
26110

ACPD14, 26085–26125, 2014
Simulating aerosol–radiation–cloud
feedbacks over E.China under severe
haze conditions
B. Zhang et al.
Title Page
Abstract Introduction
Conclusions References
Tables Figures
J I
J I
Back Close
Full Screen / Esc
Printer-friendly Version
Interactive Discussion
Discussion
Paper
|D
iscussionP
aper|
Discussion
Paper
|D
iscussionP
aper|
Table 2. Statistical Performance of baseline simulations for meteorology.
T2 RH2 WS10 PM2.5
(◦C) (%) (m s−1) (µg m−3)
N of stations 523 523 523 71Mean OBS −1.8 66 1.9 129.2Mean SIM −2.8 66 3.9 111.5Corr. R 0.96 0.47 0.47 0.67MB −1.0 0 2.0 −18.9NMB −83.3 % < 0.1 % 105 % −15.0 %RMSE 3.4 16 2.7 30.7
26111
ACPD14, 26085–26125, 2014
Simulating aerosol–radiation–cloud
feedbacks over E.China under severe
haze conditions
B. Zhang et al.
Title Page
Abstract Introduction
Conclusions References
Tables Figures
J I
J I
Back Close
Full Screen / Esc
Printer-friendly Version
Interactive Discussion
Discussion
Paper
|D
iscussionP
aper|
Discussion
Paper
|D
iscussionP
aper|
Table 3. Observed and simulated enhancement ratios of PM2.5. The enhancement ratio is de-fined as the average of hourly PM2.5 larger than the median value divided by that of hourlyPM2.5 less than the median value during the month. NCP, YRD, PRD, and CC represent theNorth China Plain, the Yangtze River Delta, the Pearl River Delta, and Central China, respec-tively.
NCP YRD PRD CC
Observations 1.8 1.7 1.7 1.7WRF-Chem (BASE) 1.8 2.0 1.8 2.0
26112

ACPD14, 26085–26125, 2014
Simulating aerosol–radiation–cloud
feedbacks over E.China under severe
haze conditions
B. Zhang et al.
Title Page
Abstract Introduction
Conclusions References
Tables Figures
J I
J I
Back Close
Full Screen / Esc
Printer-friendly Version
Interactive Discussion
Discussion
Paper
|D
iscussionP
aper|
Discussion
Paper
|D
iscussionP
aper|
Figure 1. WRF/Chem modeling domain with grid resolution of 27 km. The domain covers east-ern parts of China. The triangles indicates the location of 523 meteorology stations used forevaluations in this work.
26113

ACPD14, 26085–26125, 2014
Simulating aerosol–radiation–cloud
feedbacks over E.China under severe
haze conditions
B. Zhang et al.
Title Page
Abstract Introduction
Conclusions References
Tables Figures
J I
J I
Back Close
Full Screen / Esc
Printer-friendly Version
Interactive Discussion
Discussion
Paper
|D
iscussionP
aper|
Discussion
Paper
|D
iscussionP
aper|
Figure 2. Time series of observed (black line) and simulated (red line) daily meteorologicalvariables averaged over 523 meteorology stations in January 2013.
26114

ACPD14, 26085–26125, 2014
Simulating aerosol–radiation–cloud
feedbacks over E.China under severe
haze conditions
B. Zhang et al.
Title Page
Abstract Introduction
Conclusions References
Tables Figures
J I
J I
Back Close
Full Screen / Esc
Printer-friendly Version
Interactive Discussion
Discussion
Paper
|D
iscussionP
aper|
Discussion
Paper
|D
iscussionP
aper|
Figure 3. Monthly mean vertical profiles of observed (black line) and simulated (red line) me-teorological variables averaged over 36 meteorology stations.
26115

ACPD14, 26085–26125, 2014
Simulating aerosol–radiation–cloud
feedbacks over E.China under severe
haze conditions
B. Zhang et al.
Title Page
Abstract Introduction
Conclusions References
Tables Figures
J I
J I
Back Close
Full Screen / Esc
Printer-friendly Version
Interactive Discussion
Discussion
Paper
|D
iscussionP
aper|
Discussion
Paper
|D
iscussionP
aper|
Figure 4. Simulated and Observed (circles) monthly mean PM2.5 mass concentration overeastern China in January 2013. The four polygons stands for the North China Plain (NCP)(#1), the Yangtze River Delta (YRD) (#2), the Pearl River Delta (PRD) (#3), and Central China(#4).
26116

ACPD14, 26085–26125, 2014
Simulating aerosol–radiation–cloud
feedbacks over E.China under severe
haze conditions
B. Zhang et al.
Title Page
Abstract Introduction
Conclusions References
Tables Figures
J I
J I
Back Close
Full Screen / Esc
Printer-friendly Version
Interactive Discussion
Discussion
Paper
|D
iscussionP
aper|
Discussion
Paper
|D
iscussionP
aper|
Figure 5. Scatter plots of monthly mean PM2.5 mass concentrations in 71 cities in Jan-uary 2013.
26117
ACPD14, 26085–26125, 2014
Simulating aerosol–radiation–cloud
feedbacks over E.China under severe
haze conditions
B. Zhang et al.
Title Page
Abstract Introduction
Conclusions References
Tables Figures
J I
J I
Back Close
Full Screen / Esc
Printer-friendly Version
Interactive Discussion
Discussion
Paper
|D
iscussionP
aper|
Discussion
Paper
|D
iscussionP
aper|
Figure 6. Comparison of observed (black) and simulated (red for scenario BASE and blue forscenario EMP) hourly near surface PM2.5 mass concentrations averaged over 71 cities in Chinain January 2013.
26118

ACPD14, 26085–26125, 2014
Simulating aerosol–radiation–cloud
feedbacks over E.China under severe
haze conditions
B. Zhang et al.
Title Page
Abstract Introduction
Conclusions References
Tables Figures
J I
J I
Back Close
Full Screen / Esc
Printer-friendly Version
Interactive Discussion
Discussion
Paper
|D
iscussionP
aper|
Discussion
Paper
|D
iscussionP
aper|
Figure 7. Simulated aerosol total effects (scenario BASE−EMP) and radiative effects (scenarioRAD−EMP) on downward short wave flux at ground, 2 m temperature, 10 m wind speed andPBL height in January 2013.The aerosol indirect effects on these four meteorological variablesare not shown here, since the induced changes are not significant according to Student’s t test.Grey shaded areas indicate regions with less than 95 % significance.
26119
ACPD14, 26085–26125, 2014
Simulating aerosol–radiation–cloud
feedbacks over E.China under severe
haze conditions
B. Zhang et al.
Title Page
Abstract Introduction
Conclusions References
Tables Figures
J I
J I
Back Close
Full Screen / Esc
Printer-friendly Version
Interactive Discussion
Discussion
Paper
|D
iscussionP
aper|
Discussion
Paper
|D
iscussionP
aper|
Figure 8. Simulated cloud water path and precipitation for the three scenarios and aerosoltotal effects (scenario BASE−EMP), radiative effects (scenario RAD−EMP), and indirect ef-fects (scenario BASE−RAD) over eastern China in January 2013. Grey shaded areas indicateregions with less than 95 % significance.
26120
ACPD14, 26085–26125, 2014
Simulating aerosol–radiation–cloud
feedbacks over E.China under severe
haze conditions
B. Zhang et al.
Title Page
Abstract Introduction
Conclusions References
Tables Figures
J I
J I
Back Close
Full Screen / Esc
Printer-friendly Version
Interactive Discussion
Discussion
Paper
|D
iscussionP
aper|
Discussion
Paper
|D
iscussionP
aper|
Figure 9. Simulated monthly mean CO, SO2, and O3 mixing ratios and aerosol feedbacks(scenario BASE−EMP) on the three gas pollutants over eastern China in January 2013. Greyshaded areas indicate regions with less than 95 % significance.
26121
ACPD14, 26085–26125, 2014
Simulating aerosol–radiation–cloud
feedbacks over E.China under severe
haze conditions
B. Zhang et al.
Title Page
Abstract Introduction
Conclusions References
Tables Figures
J I
J I
Back Close
Full Screen / Esc
Printer-friendly Version
Interactive Discussion
Discussion
Paper
|D
iscussionP
aper|
Discussion
Paper
|D
iscussionP
aper|
Figure 10. Simulated aerosol total effects (scenario BASE−EMP), radiative effects (scenarioRAD−EMP), and indirect effects (scenario BASE−RAD) on monthly mean PM2.5 over easternChina in January 2013. Grey shaded areas indicate regions with less than 95 % significance.
26122
ACPD14, 26085–26125, 2014
Simulating aerosol–radiation–cloud
feedbacks over E.China under severe
haze conditions
B. Zhang et al.
Title Page
Abstract Introduction
Conclusions References
Tables Figures
J I
J I
Back Close
Full Screen / Esc
Printer-friendly Version
Interactive Discussion
Discussion
Paper
|D
iscussionP
aper|
Discussion
Paper
|D
iscussionP
aper|
Figure 11. Time series of observed (black) and simulated (red for scenario BASE and blue forscenario EMP) hourly surface PM2.5 mass concentrations in 8 cities in January 2013. Monthlymean PM2.5 are enhanced in the four cities (Zhengzhou, Wuhan, Changsha and Chengdu) inthe left column. Cites in the right column have suppressed monthly mean PM2.5 mass con-centrations. “Diff” indicates aerosol feedbacks (BASE−EMP) on monthly mean PM2.5 massconcentrations.
26123
ACPD14, 26085–26125, 2014
Simulating aerosol–radiation–cloud
feedbacks over E.China under severe
haze conditions
B. Zhang et al.
Title Page
Abstract Introduction
Conclusions References
Tables Figures
J I
J I
Back Close
Full Screen / Esc
Printer-friendly Version
Interactive Discussion
Discussion
Paper
|D
iscussionP
aper|
Discussion
Paper
|D
iscussionP
aper|
Figure 12. Time series of observed (black) and simulated (red for scenario BASE and blue forscenario EMP) daily total radiation and 2 m temperature averaged over North and central Chinain January 2013.
26124

ACPD14, 26085–26125, 2014
Simulating aerosol–radiation–cloud
feedbacks over E.China under severe
haze conditions
B. Zhang et al.
Title Page
Abstract Introduction
Conclusions References
Tables Figures
J I
J I
Back Close
Full Screen / Esc
Printer-friendly Version
Interactive Discussion
Discussion
Paper
|D
iscussionP
aper|
Discussion
Paper
|D
iscussionP
aper|
Figure 13. Observed (black) and Simulated (red for scenario BASE and blue for scenario EMP)monthly mean PM2.5 mass concentrations in January 2013 over the North China Plain (NCP),the Yangtze River Delta (YRD), the Pearl River Delta (PRD) and Central China (CC). Thedashed lines indicate the maximum and minimum value. The solid lines in the box indicate themedian value (the central line), the 25th and 75th percentiles.
26125