simulated impacts of el nino/southern oscillation on united states water resources
TRANSCRIPT

ABSTRACT: The El Niño/Southern Oscillation (ENSO) phenomenaalter global weather patterns with consequences for fresh watersupply. ENSO events impact regions and their natural resource sec-tors around the globe. For example, in 1997 and 1998, a strong ElNiño brought warm ocean temperatures, flooding, and record snow-fall to the west coast of the United States. Research on ENSOevents has improved long range climate predictions, affording thepotential to reduce the damage and economic cost of these weatherpatterns. Here, using the Hydrologic Unit Model for the UnitedStates (HUMUS), we simulate the impacts of four types of ENSOstates (Neutral, El Niño, La Niña, and strong El Niño) on waterresources in the conterminous United States. The simulationsshow that La Niña conditions increase water yield across much ofthe country. We find that water yield increases during El Niñoyears across the south while declining in much of the rest of thecountry. However, under strong El Niño conditions, regional wateryields are much higher than Neutral, especially along the WestCoast. Strong El Niño is not simply an amplification of El Niño; itleads to strikingly different patterns of water resource response.(KEY TERMS: modeling; ENSO; climate; water resources impacts.)
Thomson, Allison M., Robert A. Brown, Norman J. Rosenberg, R. César Izaur-ralde, David M. Legler, and Raghavan Srinivasan, 2003. Simulated Impacts of El Niño/Southern Oscillation on United States Water Resources. J. of the Ameri-can Water Resources Association (JAWRA) 39(1):137-148.
INTRODUCTION
The El Niño of 1997 and 1998 was felt stronglyalong the west coast of the United States (U.S.).Exotic tropical fish species traveled north with thewarmer Pacific waters, and strong storms with recordrain and snowfall caused landslides on the west coastand impacted agriculture, recreation, water supplies
and electricity generation (New York Times, 1997,1998; Gaura, 1998; Giesin, 1998; Martin, 1998). ThatEl Niño event prompted a great deal of research intothe causes, severity, and impacts of the El Niño/Southern Oscillation (ENSO) phenomena.
ENSO events originate in a sea surface tempera-ture (SST) anomaly in the eastern tropical PacificOcean. A shift in the atmospheric sea level pressuregradient between Darwin, Australia, and Tahiti,French Polynesia, is associated with these SSTanomalies – a warm SST anomaly leads to an El Niñoevent while a cold anomaly results in a La Niña(sometimes referred to as El Viejo) event. Althoughthey differ greatly in strength, timing, and duration,El Niño and La Niña occur every two to nine years,and usually last for one to two years. Global averagetemperatures are anomalously warm during El Niñoyears, although specific regional impacts vary widely.In general, La Niña results in climate patterns thatare different and sometimes of opposite sign fromthose of El Niño. Over the U.S., El Niño events causethe jet stream to shift southward resulting in warmertemperatures, with the exception of cooler tempera-tures in the Southwest, and variable regional changesin precipitation (Leung et al., 1999; Green et al.,1997). These anomalies in turn affect water resourceavailability through changes in precipitation amount,timing, and intensity, as well as impacts on vegeta-tion growth and evaporative demand.
Streamflow anomalies worldwide have been associ-ated with ENSO events. In Australia, Chiew et al.(1998) found that reduced precipitation and stream-
1Paper No. 02002 of the Journal of the American Water Resources Association. Discussions are open until August 1, 2003.2Respectively, (Thomson, Rosenberg, Izaurralde), Joint Global Change Research Institute (JGCRI), 8400 Baltimore Avenue, Suite 201, Col-
lege Park, Maryland 20740; (Brown) Independent Project Analysis, 44426 Atwater Drive, Suite 100, Ashburn, Virginia 20147; (Legler) Direc-tor, U.S. CLIVAR, 400 Virginia Avenue S.W., Washington, D.C. 20024; and (Srinivasan) Blacklands Research and Extension Center, TexasAgricultural Experiment Station, 720 East Blacklands Road, Temple, Texas 76502 (E-Mail/Thomson: [email protected]).
JOURNAL OF THE AMERICAN WATER RESOURCES ASSOCIATION 137 JAWRA
JOURNAL OF THE AMERICAN WATER RESOURCES ASSOCIATIONFEBRUARY AMERICAN WATER RESOURCES ASSOCIATION 2003
SIMULATED IMPACTS OF EL NINO/SOUTHERN OSCILLATIONON UNITED STATES WATER RESOURCES1
Allison M. Thomson, Robert A. Brown, Norman J. Rosenberg, R. César Izaurralde,David M. Legler, and Raghavan Srinivasan2

flow were linked to El Niño conditions and that information on past impacts could be used to effectstatistically significant improvements in streamflowforecasts. Wooldridge et al. (2001) found that ENSOcaused a strong but nonlinear response of runoff toprecipitation anomalies in Australia. They attributethe nonlinearities to other climatic factors influencedby ENSO, such as rainfall intensity and duration, airtemperature controls on evaporation, and soil andland cover characteristics.
ENSO events significantly affect streamflow in theU.S. (Kahya and Dracup, 1993; Dracup and Kahya,1994) especially along the Gulf Coast, the Northeast,and the Pacific Northwest. In a study of drought con-ditions in the U.S., Piechota and Dracup (1996) foundthat El Niño events generally cause droughts in thePacific Northwest while La Niña brings drought tomuch of the southern U.S. ENSO events stronglyimpact the Pacific Northwest. Consequences for watersupply in that region were examined in detail byLeung et al. (1999) using regional climate and hydrol-ogy models. They found that the higher temperaturesassociated with El Niño increased the proportion ofprecipitation that falls as rain, consequently reducingthe spring snowmelt. This, in combination withreduced winter precipitation, reduces streamflow inthe Columbia River basin. Clark et al. (2001) exam-ined the effects of ENSO events on snowpacks in theColumbia and Colorado River basins. They found asignificant decline in snowpack in the Northwestunder El Niño conditions and an increase under LaNiña conditions; anomalies were of opposite sign inthe Colorado basin. They concluded that informationon ENSO events and their impacts on monthly precip-itation can be used to improve the accuracy of runoffpredictions.
Evidence from the strong Los Niños of 1997 and1998 and 1982 and 1983 indicates that regional tem-perature and precipitation anomalies associated withthe highest SST anomalies differ not only in magni-tude but also in sign from weaker Los Niños. An anal-ysis of the 1997 and 1998 event by the NationalWeather Service noted that the strong Los Niños of1997 and 1998 and 1982 and 1983 produced differentatmospheric circulation anomalies than did the weak-er Los Niños of 1986 and 1987 and 1991 and 1992.This resulted in unexpected impacts; instead of anexpected wet spring in the south and southeast, theregion experienced a severe drought as a dome of highpressure moved farther north from Mexico thanexpected, blocking storm systems (Barnston et al.,1999). A separate study of the 1997 and 1998 El Niñofound that temperature and precipitation anomalieswere a significant amplification of normal El Niño
conditions, and that some temperature and precipita-tion patterns were the opposite in sign of those pre-dicted. In the Pacific Northwest, a wetter than normalspring was expected, but drier than normal conditionsoccurred due to the changed patterns with the strongEl Niño (Smith et al., 1999). In the study reportedhere we simulate the impacts of ENSO events onwater resources across the 48 conterminous U.S., dis-tinguishing between El Niño, strong El Niño, and LaNiña conditions.
MATERIALS AND METHODS
Using 30 years of historical climate data from asingle station in each of the 2,101 “eight-digit” basinsdefined by the U.S. Geological Survey (USGS), we cal-culate monthly mean temperature and precipitationdeviations from the Neutral condition for El Niño,strong El Niño, and La Niña years. With these meanmonthly values we generate a daily weather sequenceand use it to drive the Hydrologic Unit Model of theUnited States (HUMUS) and the Soil Water Assess-ment Tool (SWAT) hydrologic models (Srinivasan etal., 1993). By using these averaged weather records,we can examine ENSO events, their impact on wateryield in distinct hydrological units, and the aggregateregional response.
ENSO Climate Scenarios
We developed scenarios for four different states ofENSO for this study based on a five-month runningmean of spatially averaged SST anomalies over theequatorial eastern Pacific (Meyers et al., 1999). TheJapan Meteorological Agency (JMA) ENSO Index (i)defines El Niño years as six consecutive months(starting in October) of i greater than 0.5˚C. A classifi-cation of strong El Niño is given to years when i wasgreater than 2.0˚C for two or more consecutivemonths between October and March. La Niña isdefined similarly, where i is less than -0.5˚C for sixconsecutive months (starting in October). Neutral isdefined as the index being between plus or minus0.5˚C. The “year” in the context of this work is definedas the October preceding the fall and winter periodthat defines the categorization through the followingSeptember. Of the period from 1960 to 1989, six yearswere classified as El Niño (1963, 1965, 1969, 1976,1986, and 1987); seven as La Niña (1964, 1967, 1970,1971, 1973, 1975, and 1988); and two as strong ElNiño (1972 and 1982). The remaining 15 years wereclassified as Neutral.
JAWRA 138 JOURNAL OF THE AMERICAN WATER RESOURCES ASSOCIATION
THOMSON, BROWN, ROSENBERG, IZAURRALDE, LEGLER, AND SRINIVASAN

Based on historical daily climate records, monthlyclimate statistics were calculated for each month ofeach ENSO year. These included means and distribu-tion characteristics of temperature and precipitation.The stochastic weather generator (WXGEN) (Richard-son and Nicks, 1990) used these monthly statistics foreach ENSO state to simulate 30 years of daily weath-er at a site in each of the 2,101 basins under the aver-age climatic characteristics of a given ENSO scenario.These ENSO scenarios (El Niño, strong El Niño, LaNiña, and Neutral) provided a clear picture of theaverage weather anomalies associated with eachENSO state. These generated climates were used todrive the HUMUS water resources model. It shouldbe noted that the use of average climate for eachENSO state applied over a continuous 30-year cycleignores the effects of changes in ENSO state, forexample from El Niño to a La Niña or Neutral year.This may cause some amplification of the water yieldresults since, for example, a wet year following a wetyear would likely result in higher water yield than awet year following a dry year.
Description of HUMUS/SWAT
HUMUS (Arnold et al, 1999; Srinivasan et al.,1993) is a GIS based modeling system that providesinput to drive SWAT (Arnold et al., 1994, 1998). Forthe study reported here, HUMUS was run at the sub-basin level of 2,101 USGS defined eight-digit hydro-logic unit areas (HUAs). The dominant soil type, landuse, and vegetation in each eight-digit HUA are usedto describe the entire modeling unit. Climate recordsfor each basin are drawn from a single weather sta-tion – that nearest the geographic centroid of thebasin.
SWAT represents the water balance in each basinthrough four storage volumes; snow, soil profile, shal-low aquifer (2-20 m), and deep aquifer (> 20 m).SWAT simulates important hydrologic and relatedbiophysical processes including infiltration, evapo-transpiration (ET), net primary productivity, lateralflow, and percolation. Surface runoff is estimatedusing a modification of the Soil Conservation Servicecurve number method (USDA, 1972). SWAT runs on adaily time step using the weather variables of maxi-mum and minimum temperature, precipitation,humidity, radiation, and windspeed. The output vari-able that most closely represents streamflow is wateryield – the sum of surface and lateral flows from thesoil profile plus ground water flow from the shallowaquifer. For this simulation, we assume naturalstreamflow, which differs from actual (observed)streamflow because it assumes no anthropogenic
influences such as large scale storage in dams ordiversions and withdrawals for industrial, municipal,or agricultural use. While SWAT is capable of simu-lating the impacts of impoundments and diversionson streamflow, the number and complexity of theseacross the nation prohibits their inclusion in this con-tinental scale study.
Model Validation
Previous validations have shown that HUMUSaccurately simulates natural streamflow throughoutthe U.S. at the eight-digit basin scale. SWAT simulat-ed streamflow has been validated against observedhydrologic data for areas ranging in size from a smallwatershed (Arnold and Allen, 1996) to a major waterresource region (Arnold et al., 2000). In the latterwork, SWAT simulated estimates of base flow andrecharge were calibrated with observed streamflow ata gauging station in Alton, Illinois, in the Upper Mis-sissippi basin. After model calibration SWAT monthlystreamflow explained 65 percent of the variance ofobserved monthly data there for the years 1981through 1985. Gerbert et al. (1987) estimated annualnatural streamflow from observations at 5,951 U.S.gauging stations from 1951 through 1980 and thesedata (hereafter USGS estimated) have been used inseveral studies. In a recent study, Brown et al. (2000)compared HUMUS simulated streamflow from the1960 through 1989 weather record to USGS estimatedhistorical streamflow from 1951 through 1980 in the18 major water resource regions (MWRRs) of the con-terminous U.S. reported by Wolock and McCabe(1999). Although reasonable agreement was noted,HUMUS tended to overestimate water yield in irri-gated basins and underestimate it in mountainousregions. Arnold et al. (1999) summarize previous vali-dations of SWAT for a range of hydrologic variablesand locations.
We compare the USGS estimated natural stream-flow values from Gerbert et al. (1987) with HUMUSsimulated natural streamflows at the MWRR scaleand at the modeling scale of eight-digit basins. Wenote that the periods of record in this comparison arenot identical. Our simulations are based on a weatherrecord from 1960 through 1989 and Gerbert et al. esti-mates are from 1951 through 1980. Records of actualstreamflow do exist for the 1960 through 1989 timeperiod, but the available estimates of natural stream-flow are inadequate for our validation needs. The sim-ulated baseline water yields agree well with theUSGS estimated values when aggregated to theMWRR scale (R2 = 0.96). There is greater variation atthe eight-digit basin scale, but agreement between
JOURNAL OF THE AMERICAN WATER RESOURCES ASSOCIATION 139 JAWRA
SIMULATED IMPACTS OF EL NIÑO/SOUTHERN OSCILLATION ON UNITED STATES WATER RESOURCES
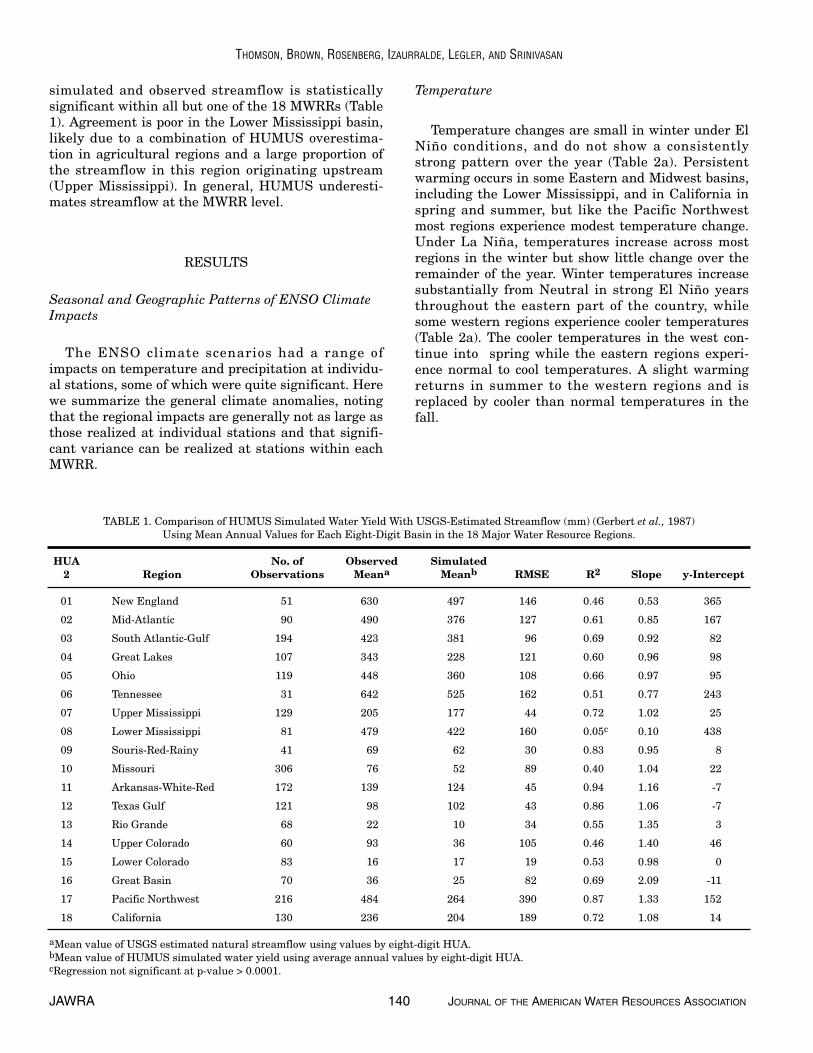
simulated and observed streamflow is statisticallysignificant within all but one of the 18 MWRRs (Table1). Agreement is poor in the Lower Mississippi basin,likely due to a combination of HUMUS overestima-tion in agricultural regions and a large proportion ofthe streamflow in this region originating upstream(Upper Mississippi). In general, HUMUS underesti-mates streamflow at the MWRR level.
RESULTS
Seasonal and Geographic Patterns of ENSO ClimateImpacts
The ENSO climate scenarios had a range ofimpacts on temperature and precipitation at individu-al stations, some of which were quite significant. Herewe summarize the general climate anomalies, notingthat the regional impacts are generally not as large asthose realized at individual stations and that signifi-cant variance can be realized at stations within eachMWRR.
Temperature
Temperature changes are small in winter under ElNiño conditions, and do not show a consistentlystrong pattern over the year (Table 2a). Persistentwarming occurs in some Eastern and Midwest basins,including the Lower Mississippi, and in California inspring and summer, but like the Pacific Northwestmost regions experience modest temperature change.Under La Niña, temperatures increase across mostregions in the winter but show little change over theremainder of the year. Winter temperatures increasesubstantially from Neutral in strong El Niño yearsthroughout the eastern part of the country, whilesome western regions experience cooler temperatures(Table 2a). The cooler temperatures in the west con-tinue into spring while the eastern regions experi-ence normal to cool temperatures. A slight warmingreturns in summer to the western regions and isreplaced by cooler than normal temperatures in thefall.
JAWRA 140 JOURNAL OF THE AMERICAN WATER RESOURCES ASSOCIATION
THOMSON, BROWN, ROSENBERG, IZAURRALDE, LEGLER, AND SRINIVASAN
TABLE 1. Comparison of HUMUS Simulated Water Yield With USGS-Estimated Streamflow (mm) (Gerbert et al., 1987)Using Mean Annual Values for Each Eight-Digit Basin in the 18 Major Water Resource Regions.
HUA No. of Observed Simulated2 Region Observations Meana Meanb RMSE R2 Slope y-Intercept
01 New England 51 630 497 146 0.46 0.53 365
02 Mid-Atlantic 90 490 376 127 0.61 0.85 167
03 South Atlantic-Gulf 194 423 381 96 0.69 0.92 82
04 Great Lakes 107 343 228 121 0.60 0.96 98
05 Ohio 119 448 360 108 0.66 0.97 95
06 Tennessee 31 642 525 162 0.51 0.77 243
07 Upper Mississippi 129 205 177 44 0.72 1.02 25
08 Lower Mississippi 81 479 422 160 0.05c 0.10 438
09 Souris-Red-Rainy 41 69 62 30 0.83 0.95 8
10 Missouri 306 76 52 89 0.40 1.04 22
11 Arkansas-White-Red 172 139 124 45 0.94 1.16 -7
12 Texas Gulf 121 98 102 43 0.86 1.06 -7
13 Rio Grande 68 22 10 34 0.55 1.35 3
14 Upper Colorado 60 93 36 105 0.46 1.40 46
15 Lower Colorado 83 16 17 19 0.53 0.98 0
16 Great Basin 70 36 25 82 0.69 2.09 -11
17 Pacific Northwest 216 484 264 390 0.87 1.33 152
18 California 130 236 204 189 0.72 1.08 14
aMean value of USGS estimated natural streamflow using values by eight-digit HUA.bMean value of HUMUS simulated water yield using average annual values by eight-digit HUA.cRegression not significant at p-value > 0.0001.

Precipitation
Precipitation is reduced in most regions and sea-sons under El Niño conditions (Table 2b). Winter isthe season of greatest precipitation change with less-er declines persisting through the entire year. Thesedeclines are apparent in the western coastal regionsas well as in the Lower Mississippi. In California, thelargest decline in precipitation occurs in spring. Pre-cipitation changes are more variable in La Niñayears, increasing in the east and declining in the westin winter, spring and fall and reversing that patternin the summer. As with temperature, the most persis-tent changes in precipitation occur during strong ElNiño years, increasing significantly over much of thecountry during winter and spring. The Pacific North-west is an exception; precipitation response to strongEl Niño is relatively weak and variable, declining inspring and fall while increasing in winter and sum-mer. Some eastern regions experience a slight dryingin summer, but the wetter than normal conditions inthe west persist year round.
ENSO Impacts on Simulated Seasonal Water Yield
El Niño. In most of the 18 MWRRs and in mostseasons, water yield declines during El Niño years(Table 3). In percentage terms the negative anomaliesare greatest in the Upper Colorado, Great Basin, andCalifornia in winter. Regions experiencing overall per-centage increases in water yield include the SouthAtlantic, Texas, Gulf, and Rio Grande basins.
With El Niño conditions, water yields decline sub-stantially in winter (-40 to -70 mm) in the PacificNorthwest and in Northern California and the OhioValley (Figure 1). In the northeast water yields alsodecline slightly. Water yields increase in winter in thesouth, notably in east Texas and Florida. Greaterthan normal water yield persists through the springwhen increases also occur in the North CentralPlains. The dryness in California and north along theWest Coast persists. A notable drying occurs in springin the mountainous areas of Idaho, where winterwater yields are also lower than normal. Dryness alsopersists through the Ohio Valley and extends to statesto the north and west. Dry conditions persist in the
JOURNAL OF THE AMERICAN WATER RESOURCES ASSOCIATION 141 JAWRA
SIMULATED IMPACTS OF EL NIÑO/SOUTHERN OSCILLATION ON UNITED STATES WATER RESOURCES
TABLE 2a. Seasonal Average Temperature (˚C) at Neutral and Deviation From Neutral for the18 Major Water Resource Regions (EN = El Niño; LN = La Niña; SEN = Strong El Niño).
Fall Winter Spring SummerNeutral EN LN SEN Neutral EN LN SEN Neutral EN LN SEN Neutral EN LN SEN
MWRR T (˚C) Change in T T (˚C) Change in T T (˚C) Change in T T (˚C) Change in T
01 8.7 -6.2 + 5.7 + 18.7 +
02 12.0 -1.6 + ++ 9.8 21.4 +
03 18.6 8.5 - + + 17.7 - 26.0
04 9.1 -6.5 + ++ 6.2 + 19.1 + +
05 12.7 -1.1 + ++ 11.1 + 22.2 + +
06 14.5 2.7 - + + 13.6 - 23.2 -
07 10.0 -7.4 + ++ 8.3 + 21.3 + +
08 18.1 6.6 + + 17.5 - 26.5
09 5.8 - -13.9 + ++ 4.2 + + 18.7 + +
10 9.1 - -5.6 + + + 7.8 - 20.8
11 15.3 - 2.4 + 14.2 - 25.4 -
12 19.9 - 9.0 + 19.4 - 27.8 - -
13 14.5 4.6 + 14.3 + - 23.6
14 8.4 - -4.1 - 6.9 - 19.1
15 16.6 - 6.7 - - - 14.5 - 25.9 - -
16 9.2 - -1.5 - 7.5 - 19.6
17 8.7 -0.5 7.6 17.6
18 14.6 + 7.2 12.0 + + 20.8
Notes: -0.5 < T < 0.5 = No change.-2 < T < -0.5 = -.0.5 < T < 2 = +.T > 2 = ++.

Ohio Valley through the summer and fall and extendto the East Coast during summer. Wetter than normalconditions persist in Texas and Florida. Along theWest Coast, water yields improve in summer butremain below normal. In fall the reductions in yieldintensify in this region.
Strong El Niño. Patterns of the percentagechange in water yield differ markedly under strong ElNiño and El Niño. Under strong El Niño water yieldsincrease in all MWRRs and seasons with the excep-tion of the Pacific Northwest in the fall (Table 3).Generally the percentage of these increases are sub-stantially greater under strong El Niño than in eitherEl Niño or La Niña events.
Along the West Coast, where negative anomaliesprevail in all seasons under El Niño, water yieldunder strong El Niño is above normal in winter,spring and summer, but drying occurs along thenorthern coast in fall (Figure 2). Another strikinganomaly is the dramatic increase in water yield in theMississippi Valley, strongest in winter and spring butevident throughout the year. This positive anomaly
extends to the Southeast and north to the East Coastin spring and, to a lesser extent, in fall. Wetter thannormal conditions persist year round in the South-west and are strongest in spring. One similarity withEl Niño is the appearance of lower than normal wateryields in the mountains of Idaho, especially duringspring. Overall, the geographic distribution, strength,and sign of water yield anomalies under strong ElNiño conditions differ greatly from those under ElNiño.
La Niña. With some exceptions La Niña conditionsare correlated to a general increase, in percentageterms, in water yield across the country. Percentagechanges in winter are smaller and, in many MWRRs,opposite in sign from those of El Niño (Table 3). Thisholds true through the spring and summer with amajor exception in the western regions where wateryields decline throughout the year.
Water yields increase most in winter in the PacificNorthwest and in the Lower and Eastern MississippiValley (Figure 3). Water yield quantities are reducedsignificantly in California and along the Gulf Coast.
JAWRA 142 JOURNAL OF THE AMERICAN WATER RESOURCES ASSOCIATION
THOMSON, BROWN, ROSENBERG, IZAURRALDE, LEGLER, AND SRINIVASAN
TABLE 2b. Seasonal Average Precipitation at Neutral and Percentage Change From Neutral for the18 Major Water Resource Regions (EN = El Niño; LN = La Niña; SEN = Strong El Niño).
Fall Winter Spring SummerNeutral EN LN SEN Neutral EN LN SEN Neutral EN LN SEN Neutral EN LN SEN
MWRR P (mm) % Change in P P (mm) % Change in P P (mm) % Change in P P (mm) % Change in P
01 291 - - 239 - + 246 - ++ 287 -
02 260 + 213 - 255 - ++ 307 -- -
03 272 + + 311 + ++ 321 ++ 404 -
04 232 141 -- + 191 + ++ 265 - - -
05 256 - + - 222 - + 303 - ++ 321 - -
06 301 + 326 - + + 371 - ++ 327 - -
07 216 - + 100 -- ++ 221 ++ 317 - - -
08 321 ++ 328 + + ++ 390 - - ++ 324 -
09 121 - ++ 48 - -- 126 + -- 232 +
10 112 - ++ 48 -- + 159 - + 199 - - --
11 204 + 104 + ++ 231 - - ++ 239 - --
12 245 - + 132 ++ ++ 203 209 - + ++
13 122 - -- - 44 + - ++ 58 -- 141 --
14 93 - -- + 68 -- - 78 -- -- + 78 - ++
15 89 -- ++ 86 -- -- ++ 53 - -- ++ 96 + -
16 76 -- - ++ 73 --- - 81 - -- + 56 + ++
17 188 -- -- 244 -- + + 164 - - 81 + +
18 137 -- + ++ 290 --- -- ++ 149 --- -- ++ 21 + + ++
Notes: -0.5% < T < 0.5% = No change.-20% < P < -5% = -.-50% < P < -20% = --.P < -50% = ---.5% < P < 20% = +.20% < P < 50% = ++.

These general patterns persist in the spring, althoughthe wet anomaly in the Lower Mississippi Valley dis-appears. Water yields decline in spring in the Mis-souri region. Missouri, Iowa, and California alsoremain drier than normal through the summer andfall. The dryness along the Gulf Coast persiststhroughout the year. Positive water yield anomaliesoccur in the Southeast and Ohio Valley through thesummer and fall, while the strong positive anomaliesalong the Pacific coast diminish somewhat.
DISCUSSION AND CONCLUSIONS
Water yield, as simulated by HUMUS, is sensitiveto the climate impacts of ENSO events. Under ElNiño and La Niña conditions the Pacific Northwest,California, the Southeast, and the Corn Belt regionsexperience the greatest impacts. These regions, aswell as the Mississippi Valley, the Northeast, and theGulf and Southeast Coasts are also strongly affectedunder strong El Niño. In general, changes in wateryield follow changes in precipitation for each ENSOstate. The main exception in this study occurs under El Niño conditions in the Pacific Northwest and
California in the spring and summer when vegetativeuse of water is high due to higher than normal tem-peratures; therefore greater than normal precipita-tion results in lower than normal water yield.
Increased water yields are simulated in the Southand Southeast under El Niño, and are amplifiedunder the strong El Niño scenario. These increasesare likely due to the strong, southerly shift of the jetstream and consequent transport of moisture from theGulf of Mexico to the Southern U.S. In the Ohio andUpper Mississippi Valleys, water yield is lower thannormal under El Niño conditions, influenced by anenhanced atmospheric ridge over Southern Canadathat has been observed in El Niño years (Barnston etal., 1999).
Consistent with the findings of Leung et al. (1999)and Clark et al. (2001) we find that winter tempera-ture increases in the Pacific Northwest result in asmaller snowpack and consequently greater winterrunoff and lower than normal spring runoff, an effectmost apparent under El Niño conditions because ofwater yield declines. Barnston et al. (1999) found thatthis mild pattern results from a stronger and morepersistent low pressure center in the Gulf of Alaskaand upper level ridge over the northwest coast ofNorth America. Under La Niña conditions, a high
JOURNAL OF THE AMERICAN WATER RESOURCES ASSOCIATION 143 JAWRA
SIMULATED IMPACTS OF EL NIÑO/SOUTHERN OSCILLATION ON UNITED STATES WATER RESOURCES
TABLE 3. Water Yield Under Neutral Climate and the Percentage Change From Neutral for EN (El Niño), SEN(strong El Niño), and LN (La Niña) Climates for the Major Water Resource Regions of the U.S.
Fall (SON) Winter (DJF) Spring (MAM) Summer (JJA)Neutral EN LN SEN Neutral EN LN SEN Neutral EN LN SEN Neutral EN LN SEN
Region (mm) % Change (mm) % Change (mm) % Change (mm) % Change
New England 122 -4 20 -10 104 -12 42 7 228 -7 31 1 95 -15 41 0
Mid-Atlantic 103 -1 27 1 126 -11 25 2 138 -9 31 1 103 -26 21 7
South Atlantic-Gulf 108 8 28 4 141 7 36 -2 153 4 45 -3 117 0 25 3
Great Lakes 62 -17 23 -5 52 -20 38 11 116 -20 20 8 64 -24 25 -4
Ohio 89 -30 13 8 133 -28 21 12 148 -16 27 1 106 -30 30 -2
Tennessee 140 -7 5 12 200 -9 25 14 205 -13 32 3 146 -16 9 9
Upper Mississippi 54 -43 48 -1 46 -46 62 8 94 -33 45 -3 73 -59 37 -22
Lower Mississippi 98 -2 49 9 149 6 59 16 154 -5 54 -5 86 -4 41 7
Souris-Red-Rainy 9 2 75 9 8 1 64 5 29 -3 12 6 10 -2 66 6
Missouri 14 -26 66 -13 9 -47 73 1 26 -15 61 -27 18 -26 59 -28
Arkansas-White-Red 36 -11 54 14 35 3 62 8 54 -5 56 -8 32 -20 56 8
Texas Gulf 30 6 60 10 28 26 60 8 39 18 55 13 23 5 69 15
Rio Grande 3 13 38 -19 4 8 51 -35 5 -10 54 -49 2 12 56 -24
Upper Colorado 8 -53 60 -71 12 -119 43 -39 24 -85 47 -50 7 -83 61 -52
Lower Colorado 6 -12 77 -180 9 -20 71 -134 10 -35 77 -190 6 -27 74 -135
Great Basin 5 -106 63 -45 12 -210 43 -36 19 -153 49 -77 5 -154 62 -40
Pacific Northwest 74 -51 -14 11 113 -30 17 19 131 -28 5 14 51 -24 18 11
California 51 -89 36 -9 97 -69 38 -24 101 -99 42 -30 47 -76 38 -32

JAWRA 144 JOURNAL OF THE AMERICAN WATER RESOURCES ASSOCIATION
THOMSON, BROWN, ROSENBERG, IZAURRALDE, LEGLER, AND SRINIVASAN
Fig
ure
1. W
ater
Yie
ld (
WY
) C
han
ge F
rom
Neu
tral
for
El N
iño
Con
diti
ons
by S
easo
n.

JOURNAL OF THE AMERICAN WATER RESOURCES ASSOCIATION 145 JAWRA
SIMULATED IMPACTS OF EL NIÑO/SOUTHERN OSCILLATION ON UNITED STATES WATER RESOURCES
Fig
ure
2. W
ater
Yie
ld (
WY
) C
han
ge F
rom
Neu
tral
for
Str
ong
El N
iño
Con
diti
ons
by S
easo
n.

JAWRA 146 JOURNAL OF THE AMERICAN WATER RESOURCES ASSOCIATION
THOMSON, BROWN, ROSENBERG, IZAURRALDE, LEGLER, AND SRINIVASAN
Fig
ure
3. W
ater
Yie
ld (
WY
) C
han
ge F
rom
Neu
tral
for
La
Niñ
a C
ondi
tion
s by
Sea
son
.

pressure center persists in this region and the PacificNorthwest experiences wetter than normal condi-tions, leading to higher than normal water yields(NOAA, 2002).
The impacts of the strong El Niño events are differ-ent, in kind as well as degree, than those that occurunder El Niño. In California, dry under El Niño,water yields increase substantially under strong ElNiño. Also, in the Ohio Valley and Corn Belt regionsthat experience drying under El Niño, water yieldsincrease quite substantially under strong El Niño.These findings are supported by studies of the strongEl Niño of 1997 and 1998 (JMA ENSO Index > 2.0˚C)(Smith et al., 1999), where the weather anomaliesrecorded are reproduced here with the strong El Niñoscenario. These recent observations provide addition-al evidence that Los Niños of differing strength canproduce impacts on water resources and agriculturethat differ not only in quantity but also in sign (Izaur-ralde et al., 1999) and that the distinction we makebetween El Niño and strong El Niño could prove use-ful for improving the accuracy of long term forecasts.Differences in water yield of the sort simulated in thisstudy are significant enough to require that watermanagers take them into account in preparednessplanning. With confidence in the reliability of long-range forecasts of drought or flood conditions, watermanagers and the stakeholders who rely on theirdecisions can take steps to minimize economic dam-age and optimize benefits of ENSO events.
ACKNOWLEDGMENTS
This research was funded by the National Aeronautics andSpace Administration (NASA) (DE-AC06-76RLO1830), the National Oceanic and Atmospheric Administration (NOAA)(NA96AANAG0277) and the Integrated Assessment Program, Bio-logical and Environmental Research (BER), U.S. Department ofEnergy (DE-AC06-76RLO 1830). The authors gratefully acknowl-edge the technical support of the Center for Ocean AtmospherePrediction Studies at the Florida State University and BlacklandsResearch Center at Texas A&M University. We also thank Dr. JeffArnold of the USDA and three anonymous reviewers for advice onthe manuscript.
LITERATURE CITED
Arnold, J. G. and P. M. Allen, 1996. Estimating Hydrologic Budgetsfor Three Illinois Watersheds. Journal of Hydrology 176:57-77.
Arnold, J. G., R. S. Muttiah, R. Srinivasan, and P. M. Allen, 2000.Regional Estimation of Base Flow and Groundwater Rechargein the Upper Mississippi Basin. Journal of Hydrology 227:21-40.
Arnold, J. G, R. Srinivasan, and R. S. Muttiah, 1994. Large-ScaleHydrologic Modeling and Assessment. In: Effects of HumanInduced Changes on Hydrologic Systems, Richard A. Marstonand Victor R. Hasfurther (Editors). AWRA Tech. Publ. Ser. TPS-94-3, Middleburg, Virginia, pp 1-16.
Arnold, J. G., R. Srinivasan, R. S. Muttiah, and P. M. Allen, 1999.Continental Scale Simulation of the Hydrologic Balance. J. ofthe American Water Resources Association (JAWRA) 35(5):1037-1051.
Arnold, J. G., R. Srinivasan, R. S. Muttiah, and J. R. Williams,1998. Large Area Hydrologic Modeling and Assessment, Part I:Model Development. J. of the American Water Resources Associ-ation (JAWRA) 34(1):1-17.
Barnston, A. G., A. Leetmaa, V. E. Kousky, R. E. Livezey, E. O.O’Lenic, H. Van den Dool, J. A. Wagner, and D. A. Unger, 1999.NCEP Forecasts of the El Niño of 1997-98 and Its U.S. Impacts.Bulletin of the American Meteorological Society 80(9):1829-1852.
Brown, Robert A., Norman J. Rosenberg, and R. Cesar Izaurralde,2000. Response of U.S. Regional Water Resources to CO2-Fertil-ization and Hadley Centre Climate Model Projections of Green-house-Forced Climate Change: A Continental Scale SimulationUsing the HUMUS Model. PNNL-13110, Pacific NorthwestNational Laboratory, Richland, Washington, 28 pp.
Chiew, F. H. S., T. C. Piechota, J. A. Dracup, and T. A. McMahon,1998. El Niño/Southern Oscillation and Australian Rainfall,Streamflow and Drought: Links and Potential for Forecasting.Journal of Hydrology 204:138-149.
Clark, M. P., M. C. Serreze, and G. J. McCabe, 2001. HistoricalEffects of El Niño and La Niña Events on the Seasonal Evolu-tion of the Montane Snowpack in the Columbia and ColoradoRiver Basins. Water Resources Research 37(3):741-757.
Dracup, J. A. and E. Kahya, 1994. The Relationships Between U.S.Streamflow and La Niña Events. Water Resources Research30(7):2133-2141.
Gaura, Maria Alicia, 1998. Fungus Menaces Garlic Crop: El NiñoBlamed in Spread of Disease. San Francisco Chronicle, July 23,1998.
Gerbert, W. A., D. J. Graczyk, and W. R. Krug, 1987. Average Annu-al Runoff in the United States, 1951-80. U.S. Geologic Survey,Reston, Virginia.
Giesin, Dan, 1998. Sierra Resorts Still Open, Thanks to El Niño.San Francisco Chronicle, April 17, 1998.
Green, P. M., D. M. Legler, C. J. Miranda, and J. J. O'Brien, 1997.The North American Climate Patterns Associated With the ElNiño-Southern Oscillation. Center for Ocean-Atmosphere Pre-diction Studies, Tallahassee, Florida, 8 pp.
Izaurralde, R. C., N. J. Rosenberg, R. A. Brown, D. M. Legler, M. Tiscareno Lopez, and R. Srinivasan, 1999. Modeled Effects ofModerate and Strong ‘Los Niños’ on Crop Productivity in NorthAmerica. Agricultural and Forest Meteorology 94:259-268.
Kahya, J. A. and E. Dracup, 1993. U.S. Streamflow Patterns inRelation to the El Niño/Southern Oscillation. Water ResourcesResearch 29(8):2491-2503.
Leung, R. L., A. F. Hamlet, D. P. Lettenmaier and A. Kumar, 1999.Simulations of the ENSO Hydroclimate Signals in the PacificNorthwest Columbia River Basin. Bulletin of the AmericanMeteorological Society 80(11):2313-2329.
Martin, Glen, 1998. El Niño’s Gift to Irrigation-Dependent State isa Huge Snowpack. San Francisco Chronicle, April 1, 1998.
Meyers, S. D., J. J. O’Brien, and E. Thelin, 1999. Reconstruction ofMonthly SST in the Tropical Pacific Ocean During 1868-1993Using Adaptive Climate Basis Functions. Monthly WeatherReview 127(7):1599-1612.
NOAA (National Oceanic and Atmospheric Administration), Climate Prediction Center, 2002. The ENSO Cycle. Availableat http://www.nnic.noaa.gov/products/analysis_monitoring/ensocycle/enso_cycle.html. Accessed on January 15, 2002.
The New York Times, 1997. El Niño Heats Waters to Record Highsin West. September 4.
The New York Times, 1998. El Niño Brings Flooding and HighWinds to Coastal California. February 4.
JOURNAL OF THE AMERICAN WATER RESOURCES ASSOCIATION 147 JAWRA
SIMULATED IMPACTS OF EL NIÑO/SOUTHERN OSCILLATION ON UNITED STATES WATER RESOURCES

Piechota, T. C. and J. A. Dracup, 1996. Drought and RegionalHydrologic Variation in the United States: Associations With theEl Niño-Southern Oscillation. Water Resources Research32(5):1359-1373.
Richardson, C. W. and A. D. Nicks, 1990. Weather GeneratorDescription. In: EPIC – Erosion Productivity Impact Calculator.1. Model Documentation, A. N. Sharpley and J. R. Williams(Editors). USDA Technical Bulletin No. 1768, Washington, D.C.
Smith, S. R., D. M. Legler, M. J. Remigio and J. J. O’Brien, 1999.Comparison of 1997-1998 U.S. Temperature and PrecipitationAnomalies to Historical ENSO Warm Phases. Journal of Cli-mate 12(12):3507-3515.
Srinivasan, R., J. G. Arnold, R. S. Muttiah, C. Walker, and P. T.Dyke, 1993. Hydrologic Unit Model for the United States(HUMUS). In: Advances in Hydroscience and Engineering.CCHE, School of Engineering, University of Mississippi, Oxford,Mississippi.
USDA (U.S. Department of Agriculture) Soil Conservation Service,1972. Hydrology Section 4, Chapters 4-10. Government PrintingOffice, Washington, D.C.
Wolock, D. M. and G. J. McCabe, 1999. Explaining Spatial Variabil-ity in Mean Annual Runoff in the Conterminous United States.Climate Research 11:149-159
Wooldridge, S. A., S. W. Franks, and J. D. Kalma, 2001. Hydrologi-cal Implications of the Southern Oscillation: Variability of theRainfall-Runoff Relationship. Hydrological Sciences Journal46(1):73-88.
JAWRA 148 JOURNAL OF THE AMERICAN WATER RESOURCES ASSOCIATION
THOMSON, BROWN, ROSENBERG, IZAURRALDE, LEGLER, AND SRINIVASAN