simulated data for high temperature composite design · simulated data for high temperature...
TRANSCRIPT

Christos C. ChamisGlenn Research Center, Cleveland, Ohio
Galib H. AbumeriQSS Group, Inc., Cleveland, Ohio
Simulated Data for High TemperatureComposite Design
NASA/TM—2006-214111
February 2006
https://ntrs.nasa.gov/search.jsp?R=20060008934 2018-06-19T06:18:35+00:00Z

The NASA STI Program Office . . . in Profile
Since its founding, NASA has been dedicated tothe advancement of aeronautics and spacescience. The NASA Scientific and TechnicalInformation (STI) Program Office plays a key partin helping NASA maintain this important role.
The NASA STI Program Office is operated byLangley Research Center, the Lead Center forNASA’s scientific and technical information. TheNASA STI Program Office provides access to theNASA STI Database, the largest collection ofaeronautical and space science STI in the world.The Program Office is also NASA’s institutionalmechanism for disseminating the results of itsresearch and development activities. These resultsare published by NASA in the NASA STI ReportSeries, which includes the following report types:
• TECHNICAL PUBLICATION. Reports ofcompleted research or a major significantphase of research that present the results ofNASA programs and include extensive dataor theoretical analysis. Includes compilationsof significant scientific and technical data andinformation deemed to be of continuingreference value. NASA’s counterpart of peer-reviewed formal professional papers buthas less stringent limitations on manuscriptlength and extent of graphic presentations.
• TECHNICAL MEMORANDUM. Scientificand technical findings that are preliminary orof specialized interest, e.g., quick releasereports, working papers, and bibliographiesthat contain minimal annotation. Does notcontain extensive analysis.
• CONTRACTOR REPORT. Scientific andtechnical findings by NASA-sponsoredcontractors and grantees.
• CONFERENCE PUBLICATION. Collectedpapers from scientific and technicalconferences, symposia, seminars, or othermeetings sponsored or cosponsored byNASA.
• SPECIAL PUBLICATION. Scientific,technical, or historical information fromNASA programs, projects, and missions,often concerned with subjects havingsubstantial public interest.
• TECHNICAL TRANSLATION. English-language translations of foreign scientificand technical material pertinent to NASA’smission.
Specialized services that complement the STIProgram Office’s diverse offerings includecreating custom thesauri, building customizeddatabases, organizing and publishing researchresults . . . even providing videos.
For more information about the NASA STIProgram Office, see the following:
• Access the NASA STI Program Home Pageat http://www.sti.nasa.gov
• E-mail your question via the Internet [email protected]
• Fax your question to the NASA AccessHelp Desk at 301–621–0134
• Telephone the NASA Access Help Desk at301–621–0390
• Write to: NASA Access Help Desk NASA Center for AeroSpace Information 7121 Standard Drive Hanover, MD 21076

Christos C. ChamisGlenn Research Center, Cleveland, Ohio
Galib H. AbumeriQSS Group, Inc., Cleveland, Ohio
Simulated Data for High TemperatureComposite Design
NASA/TM—2006-214111
February 2006
National Aeronautics andSpace Administration
Glenn Research Center

Available from
NASA Center for Aerospace Information7121 Standard DriveHanover, MD 21076
National Technical Information Service5285 Port Royal RoadSpringfield, VA 22100
Available electronically at http://gltrs.grc.nasa.gov
Trade names or manufacturers’ names are used in this report foridentification only. This usage does not constitute an officialendorsement, either expressed or implied, by the National
Aeronautics and Space Administration.

NASA/TM—2006-214111 1
Simulated Data for High Temperature Composite Design
Christos C. Chamis National Aeronautics and Space Administration
Glenn Research Center Cleveland, Ohio 44135
Galib H. Abumeri QSS Group, Inc.
Cleveland, Ohio 44135
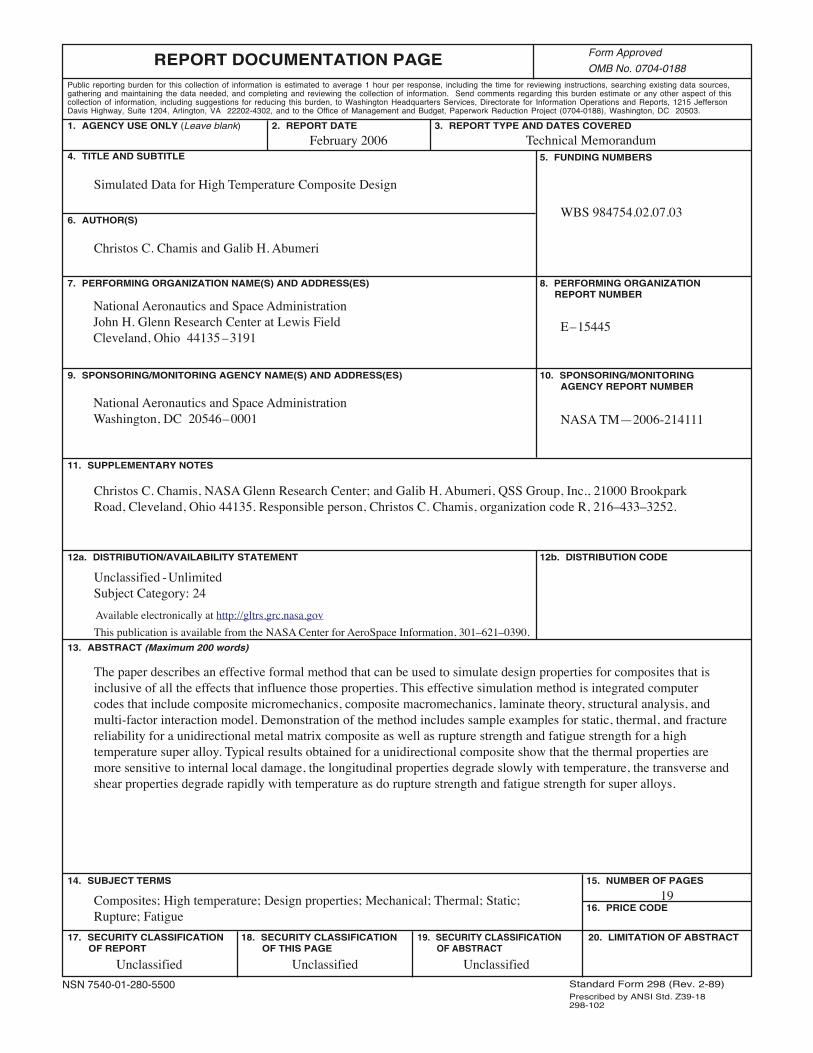
Abstract The paper describes an effective formal method that can be used to simulate design properties for
composites that is inclusive of all the effects that influence those properties. This effective simulation method is integrated computer codes that include composite micromechanics, composite macromechanics, laminate theory, structural analysis, and multi-factor interaction model. Demonstration of the method includes sample examples for static, thermal, and fracture reliability for a unidirectional metal matrix composite as well as rupture strength and fatigue strength for a high temperature super alloy. Typical results obtained for a unidirectional composite show that the thermal properties are more sensitive to internal local damage, the longitudinal properties degrade slowly with temperature, the transverse and shear properties degrade rapidly with temperature as do rupture strength and fatigue strength for super alloys.
Introduction As candidate materials for advanced high temperature aerospace structures, metal matrix composites
(MMCs) have been the subject of considerable interest and extensive research. With concurrent advances in processing, fabrication, and experimental mechanics, MMCs will increasingly be used as structural materials for advanced propulsion systems. The extreme temperatures and stresses of these propulsion systems create a hostile environment for the composite to withstand. Therefore, the analysis and design of these materials are critically important and require the use of mathematical models to predict thermal and mechanical behavior. One such model is the computer code METCAN (METal matrix Composite ANalyzer, reference 1) developed at NASA Glenn Research Center.
This paper presents the mechanical and thermal properties of a unidirectional composite from silicon carbide (SiC)/titanium (Ti6) MMC as computationally simulated by METCAN from constituents properties as described subsequently. It provides results for one fiber volume ratio at a range of temperatures in graphical form. These plots include stress-strain, elastic and shear moduli, Poisson’s ratio, thermal expansion, and thermal conductivity. Similar information can be readily generated for: 1) other loading condition, 2) other composites, and 3) other service conditions. A list of symbols used is included in the appendix where a short table of conversion factors from customary units to SI units is also included.
Background METCAN has the capability to predict many aspects of high temperature MMCs by using room
temperature constituent properties. METCAN’s integrated approach is illustrated in figure 1 as a cyclic arrangement that defines the computational methodology for each load increment. As can be seen from the figure, this predictive capability consists of several computational modules encompassing the material nonlinear behavior (bottom), composite mechanics (sides), and the finite element analysis of structural components (top). Material nonlinearity is treated at the constituent level, where the current material model, namely the Multi-Factor Interaction Model (MFIM), figure 2, describes a time-temperature-stress

NASA/TM—2006-214111 2
NASA/TM—2006-214111 3
dependence of a constituent’s mechanical and thermal properties at any point in its material history (ref. 2). Characteristic properties of the composite are calculated from the instantaneous constituent properties using composite mechanics. This synthesis results in a point description of equivalent pseudo-homogeneous properties for the composite.
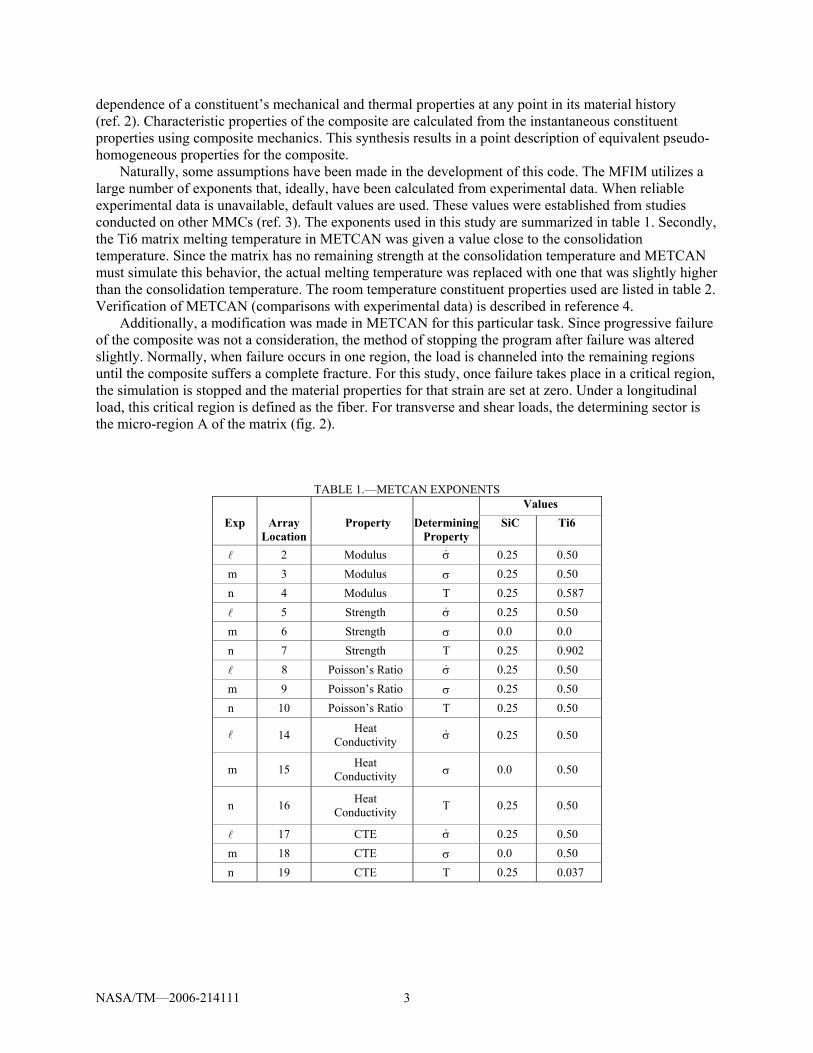
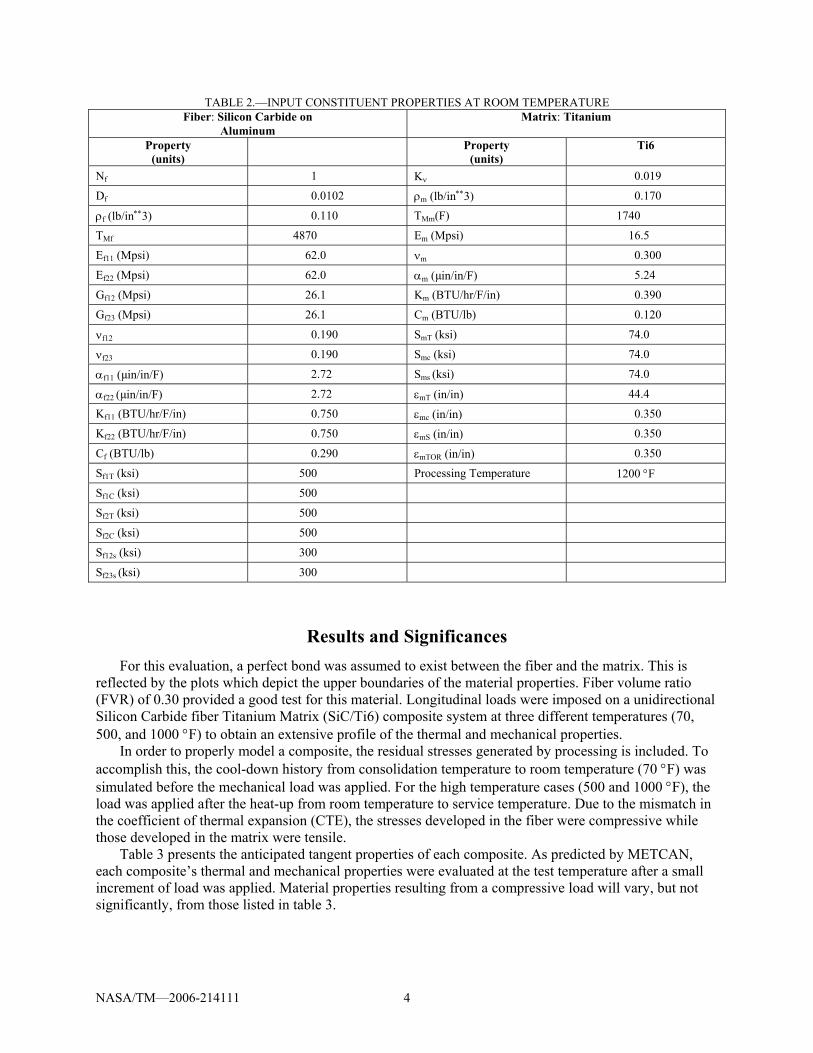
Naturally, some assumptions have been made in the development of this code. The MFIM utilizes a large number of exponents that, ideally, have been calculated from experimental data. When reliable experimental data is unavailable, default values are used. These values were established from studies conducted on other MMCs (ref. 3). The exponents used in this study are summarized in table 1. Secondly, the Ti6 matrix melting temperature in METCAN was given a value close to the consolidation temperature. Since the matrix has no remaining strength at the consolidation temperature and METCAN must simulate this behavior, the actual melting temperature was replaced with one that was slightly higher than the consolidation temperature. The room temperature constituent properties used are listed in table 2. Verification of METCAN (comparisons with experimental data) is described in reference 4.
Additionally, a modification was made in METCAN for this particular task. Since progressive failure of the composite was not a consideration, the method of stopping the program after failure was altered slightly. Normally, when failure occurs in one region, the load is channeled into the remaining regions until the composite suffers a complete fracture. For this study, once failure takes place in a critical region, the simulation is stopped and the material properties for that strain are set at zero. Under a longitudinal load, this critical region is defined as the fiber. For transverse and shear loads, the determining sector is the micro-region A of the matrix (fig. 2).
TABLE 1.—METCAN EXPONENTS Values
Exp Array Location
Property DeterminingProperty
SiC Ti6
2 Modulus σ 0.25 0.50 m 3 Modulus σ 0.25 0.50 n 4 Modulus T 0.25 0.587 5 Strength σ 0.25 0.50
m 6 Strength σ 0.0 0.0 n 7 Strength T 0.25 0.902 8 Poisson’s Ratio σ 0.25 0.50
m 9 Poisson’s Ratio σ 0.25 0.50 n 10 Poisson’s Ratio T 0.25 0.50
14 Heat Conductivity σ 0.25 0.50
m 15 Heat Conductivity σ 0.0 0.50
n 16 Heat Conductivity T 0.25 0.50
17 CTE σ 0.25 0.50 m 18 CTE σ 0.0 0.50 n 19 CTE T 0.25 0.037
NASA/TM—2006-214111 4
TABLE 2.—INPUT CONSTITUENT PROPERTIES AT ROOM TEMPERATURE Fiber: Silicon Carbide on
Aluminum Matrix: Titanium
Property (units)
Property (units)
Ti6
Nf 1 Kν 0.019
Df 0.0102 ρm (lb/in∗∗3) 0.170
ρf (lb/in∗∗3) 0.110 TMm(F) 1740
TMf 4870 Em (Mpsi) 16.5
Ef11 (Mpsi) 62.0 νm 0.300
Ef22 (Mpsi) 62.0 αm ( in/in/F) 5.24
Gf12 (Mpsi) 26.1 Km (BTU/hr/F/in) 0.390
Gf23 (Mpsi) 26.1 Cm (BTU/lb) 0.120
νf12 0.190 SmT (ksi) 74.0
νf23 0.190 Smc (ksi) 74.0
αf11 ( in/in/F) 2.72 Sms (ksi) 74.0
αf22 ( in/in/F) 2.72 εmT (in/in) 44.4
Kf11 (BTU/hr/F/in) 0.750 εmc (in/in) 0.350
Kf22 (BTU/hr/F/in) 0.750 εmS (in/in) 0.350
Cf (BTU/lb) 0.290 εmTOR (in/in) 0.350
Sf1T (ksi) 500 Processing Temperature 1200 °F Sf1C (ksi) 500
Sf2T (ksi) 500
Sf2C (ksi) 500
Sf12s (ksi) 300
Sf23s (ksi) 300
Results and Significances For this evaluation, a perfect bond was assumed to exist between the fiber and the matrix. This is
reflected by the plots which depict the upper boundaries of the material properties. Fiber volume ratio (FVR) of 0.30 provided a good test for this material. Longitudinal loads were imposed on a unidirectional Silicon Carbide fiber Titanium Matrix (SiC/Ti6) composite system at three different temperatures (70, 500, and 1000 °F) to obtain an extensive profile of the thermal and mechanical properties.
In order to properly model a composite, the residual stresses generated by processing is included. To accomplish this, the cool-down history from consolidation temperature to room temperature (70 °F) was simulated before the mechanical load was applied. For the high temperature cases (500 and 1000 °F), the load was applied after the heat-up from room temperature to service temperature. Due to the mismatch in the coefficient of thermal expansion (CTE), the stresses developed in the fiber were compressive while those developed in the matrix were tensile.
Table 3 presents the anticipated tangent properties of each composite. As predicted by METCAN, each composite’s thermal and mechanical properties were evaluated at the test temperature after a small increment of load was applied. Material properties resulting from a compressive load will vary, but not significantly, from those listed in table 3.

NASA/TM—2006-214111 5
TABLE 3.—ANTICIPATED INITIAL THERMAL AND MECHANICAL PROPERTIES OF A UNIDIRECTIONAL COMPOSITE (0.30 FVR SiC/Ti6)
Temperature in °F Property Units
70 500 1000 α111 ppm/F 4.577 4.389 4.205 α122 ppm/F 5.571 5.245 5.003 α133 ppm/F 5.571 5.245 5.003 C1 BTU/lb 0.157 0.157 0.157
K111 BTU/F-hr*in 0.585 0.619 0.706 K122 BTU/F-hr*in 0.572 0.606 0.701 K133 BTU/F-hr*in 0.572 0.606 0.701 E111 Mpsi 26.676 25.606 23.618 E122 Mpsi 17.884 16.410 13.293 K133 Mpsi 17.884 16.410 13.293 G112 Mpsi 8.373 7.052 5.378 G123 Mpsi 7.227 6.750 5.586 G113 Mpsi 8.373 7.052 5.378 S111T Ksi 195.00 180.00 160.00 S111C Ksi 193.05 178.20 158.40 S122T Ksi 64.75 50.75 35.00 S122C Ksi 101.75 74.25 45.00 S112 Ksi 43.75 36.25 23.75 S123 Ksi 43.75 36.25 23.75 S113 Ksi 43.75 36.25 23.75 ν112 in/in 0.255 0.222 0.183 ν1123 in in 0.237 0.215 0.190 ν131 in/in 0.171 0.143 0.103 ρ1 lb/in**3 0.152 0.152 0.152
Note: Properties obtained under initial tensile load. Strengths obtained from respective stress/strain curves.
The plots presented in figures 3 to 10 demonstrate METCAN’s ability to capture the behavior of a metal matrix composite at varying temperatures for one fiber volume ratio. By using these plots as an initial guideline, it becomes clear that the behavior at various fiber volume ratios for different composites can be similarly simulated. It should also become clear that obtaining all this information by test will be time and cost prohibitive.
All the properties in figures 3 to 10 are plotted against longitudinal strain for commonality. The stress strain curve is plotted in figure 3. Note the mild nonlinearity for almost the entire range. Note also the decrease with temperature. The longitudinal modulus is plotted in figure 4. The discontinuities indicate local region (sector A in fig. 2) fractures. It is important to note these discontinuities are imperceptible in the stress-strain plots in figure 3. As can be seen, the modulus decreases continuously and exhibits an abrupt drop near composite fracture which occurs as a result of fiber fractures.

NASA/TM—2006-214111 6
A comparable plot for the transverse modulus is shown in figure 5. Note the insensitivity of the transverse modulus with respect to longitudinal strain. The interpretation for this is that transverse local damage (cracks) has negligible effect on the transverse modulus when a unidirectional composite is loaded along the longitudinal (fiber) direction. Similarly for the in-plane shear modulus, Gℓ12 plotted versus longitudinal strain εℓ11 in figure 6. However, this is not the case when the composite is loaded in the transverse or in-plane shear.

NASA/TM—2006-214111 7
The in-plane major Poisson’s ratio νℓ12 is plotted versus εℓ11 in figure 7. As can be observed, νℓ12 is not sensitive to εℓ11 which is comparable to Eℓ22 and Gℓ12 and for the same reasons that were mentioned. A different situation arises when the through-the-thickness νℓ32 is plotted versus εℓ11. The results are displayed in figure 8. Note that the magnitude increases continuously with discontinuous “jumps” in the region 0.3≤εℓ11≤0.5. These discontinuous jumps coincide with those in the longitudinal modulus in figure 4. Note also the rapid increase near the fracture region and almost instantaneous drop at fracture.

NASA/TM—2006-214111 8
The reasons for this behavior are the same as previously mentioned. The conclusion from this discussion is that local directional damage may be present that may be detected by some properties and may be insensitive to others. The graphical results described thus far demonstrate that generalizations should be avoided when interpreting test results from these complex composites tested at high temperatures.

NASA/TM—2006-214111 9
The longitudinal thermal expansion coefficient αℓ11 is plotted versus longitudinal strain in figure 9. The curves increase nonlinearly up to the local longitudinal damage exhibited by the instantaneous discontinuity drop. Thereafter remain insensitive till fracture. The important point to be made from the results in figure 9 is that longitudinal thermal expansion monitoring during loading may be a sensitive test to identify local damage in these types of composites. Comparable results for longitudinal thermal conductivity Kℓ11 are shown in figure 10. The behavior for Kℓ11 is more pronounced than that for αℓ11. However, the interpretation and point to be made are similar to those made for αℓ11.
Time dependent (rupture strength) behavior can be simulated by activating the time factor in the MFIM, which is the last term in the MFIM in figure 2. The combined thermal time effects can be simulated by activating the temperature and time factors (first and last terms, figure 2) simultaneously. The combined results obtained for a monolithic super alloy are shown in figure 11. Also, two experimental available points are plotted for comparison. The important point to be noted is that information for preliminary designs or early assessments can be generated for emerging or projected materials for specific applications. Comparable information can be generated for fatigue endurance. This is obtained by activating the mechanical fatigue factor (sixth term) in the equation in figure 2. These results are plotted in figure 12. Note the relatively rapid drop at small cyclic ratios and the leveling as the cyclic ratio increases. Fatigue resistance for composites has been also evaluated as reported in references 5 and 6. Probabilistic fatigue in composites is described in references 7 and 8.

NASA/TM—2006-214111 10

NASA/TM—2006-214111 11
The major observations from the above discussion are that: (1) The highest laminate strength is along
the fiber direction; (2) The room temperature laminate transverse and shear strengths decrease substantially with temperature. The decreases are about 18 percent for the longitudinal tensile strength and about 55 percent for the transverse and shear strengths. Of lesser significance are the observations that: (1) The thermal expansion coefficient and the thermal conductivity indicate abrupt changes in regions where one or both constituents failed. These sharp drops correspond to a somewhat imperceptible change in the slope of the stress-strain plot in figure 3.
Concluding Remarks The evaluation presents simulated (METCAN generated) results at temperatures of 70, 500, and
1000 °F for SiC/Ti6 at a fiber volume ratio of 0.30. It includes the following: (1) Table of Anticipated Thermal and Mechanical Properties, (2) Stress-Strain Curves, (3) Thermal Conductivities, (4) Thermal Expansions, (5) Elastic and Shear Moduli, and (6) Poisson’s Ratios. It also includes simulated results for stress rupture and fatigue resistance of a high temperature super alloy. It is noted that the method is general and applicable to all types of composites, loading conditions, and service environments.
Some general trends are: • The highest ultimate tensile strength (UTS) is along the fiber. The room temperature transverse and
shear strengths are roughly one third and one fourth, respectively, of the longitudinal UTS. Temperature causes these two strengths to degrade by approximately 55 percent while the longitudinal strength degrades by only 18 percent.
• Some of the curves for the coefficient of thermal expansion (CTE α) and thermal conductivity (K) indicate abrupt changes in regions where one or both of the constituents failed. These sharp drops
NASA/TM—2006-214111 12
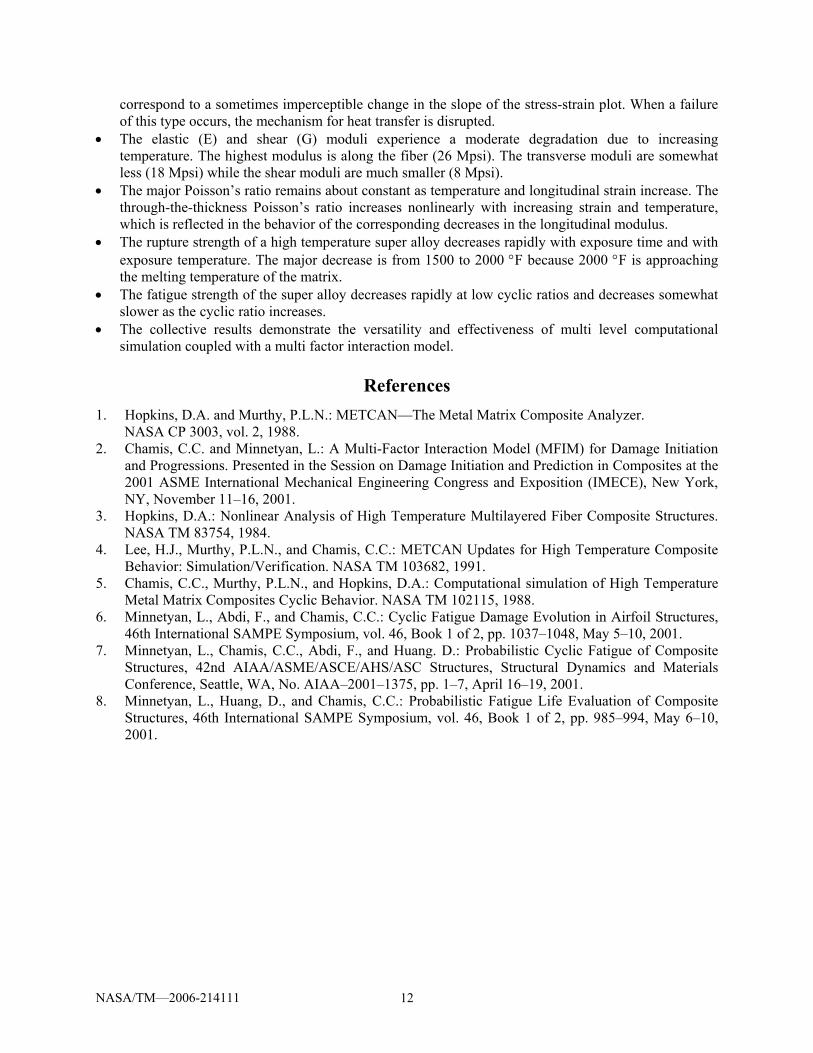
correspond to a sometimes imperceptible change in the slope of the stress-strain plot. When a failure of this type occurs, the mechanism for heat transfer is disrupted.
• The elastic (E) and shear (G) moduli experience a moderate degradation due to increasing temperature. The highest modulus is along the fiber (26 Mpsi). The transverse moduli are somewhat less (18 Mpsi) while the shear moduli are much smaller (8 Mpsi).
• The major Poisson’s ratio remains about constant as temperature and longitudinal strain increase. The through-the-thickness Poisson’s ratio increases nonlinearly with increasing strain and temperature, which is reflected in the behavior of the corresponding decreases in the longitudinal modulus.
• The rupture strength of a high temperature super alloy decreases rapidly with exposure time and with exposure temperature. The major decrease is from 1500 to 2000 °F because 2000 °F is approaching the melting temperature of the matrix.
• The fatigue strength of the super alloy decreases rapidly at low cyclic ratios and decreases somewhat slower as the cyclic ratio increases.
• The collective results demonstrate the versatility and effectiveness of multi level computational simulation coupled with a multi factor interaction model.
References 1. Hopkins, D.A. and Murthy, P.L.N.: METCAN—The Metal Matrix Composite Analyzer.
NASA CP 3003, vol. 2, 1988. 2. Chamis, C.C. and Minnetyan, L.: A Multi-Factor Interaction Model (MFIM) for Damage Initiation
and Progressions. Presented in the Session on Damage Initiation and Prediction in Composites at the 2001 ASME International Mechanical Engineering Congress and Exposition (IMECE), New York, NY, November 11–16, 2001.
3. Hopkins, D.A.: Nonlinear Analysis of High Temperature Multilayered Fiber Composite Structures. NASA TM 83754, 1984.
4. Lee, H.J., Murthy, P.L.N., and Chamis, C.C.: METCAN Updates for High Temperature Composite Behavior: Simulation/Verification. NASA TM 103682, 1991.
5. Chamis, C.C., Murthy, P.L.N., and Hopkins, D.A.: Computational simulation of High Temperature Metal Matrix Composites Cyclic Behavior. NASA TM 102115, 1988.
6. Minnetyan, L., Abdi, F., and Chamis, C.C.: Cyclic Fatigue Damage Evolution in Airfoil Structures, 46th International SAMPE Symposium, vol. 46, Book 1 of 2, pp. 1037–1048, May 5–10, 2001.
7. Minnetyan, L., Chamis, C.C., Abdi, F., and Huang. D.: Probabilistic Cyclic Fatigue of Composite Structures, 42nd AIAA/ASME/ASCE/AHS/ASC Structures, Structural Dynamics and Materials Conference, Seattle, WA, No. AIAA–2001–1375, pp. 1–7, April 16–19, 2001.
8. Minnetyan, L., Huang, D., and Chamis, C.C.: Probabilistic Fatigue Life Evaluation of Composite Structures, 46th International SAMPE Symposium, vol. 46, Book 1 of 2, pp. 985–994, May 6–10, 2001.

NASA/TM—2006-214111 13
Appendix—Symbols List C = Heat Capacity (BTU/Ib) E = Normal Modulus (Mpsi) G = Shear Modulus (Mpsi) K = Thermal Conductivity (BTU/°F*hr*in) S = Strength (Ksi) α = Coefficient of Thermal Expansion (ppm/°F) ε = Strain (in/in %) ν = Poisson’s Ratio (in/in) ρ = Density (lb/in3)
Subscripts
= L Ply Related Quantity T, C = Tension, Compression 1,2,3 = Material Coordinate System Axes
CONVERSION FACTORS
Property English Units Multiply By SI Units
Modulus, (G&E)
Mpsi 6.89 GPa
Strength, (S)
Ksi 6.89 MPa
Thermal Conductivity,(K)
BTU/°F*hr*in 6.94 W/m-°K
Heat Capacity, (C)
BTU/Ib 2.326 kJ/Kg
CTE, (α)
ppm/°F 1.8×10⁻⁶ mm/mm K
Density, (ρ)
lb/in3 27.7 g/cm3
This publication is available from the NASA Center for AeroSpace Information, 301–621–0390.
REPORT DOCUMENTATION PAGE
2. REPORT DATE
19. SECURITY CLASSIFICATION OF ABSTRACT
18. SECURITY CLASSIFICATION OF THIS PAGE
Public reporting burden for this collection of information is estimated to average 1 hour per response, including the time for reviewing instructions, searching existing data sources,gathering and maintaining the data needed, and completing and reviewing the collection of information. Send comments regarding this burden estimate or any other aspect of thiscollection of information, including suggestions for reducing this burden, to Washington Headquarters Services, Directorate for Information Operations and Reports, 1215 JeffersonDavis Highway, Suite 1204, Arlington, VA 22202-4302, and to the Office of Management and Budget, Paperwork Reduction Project (0704-0188), Washington, DC 20503.
NSN 7540-01-280-5500 Standard Form 298 (Rev. 2-89)Prescribed by ANSI Std. Z39-18298-102
Form Approved
OMB No. 0704-0188
12b. DISTRIBUTION CODE
8. PERFORMING ORGANIZATION REPORT NUMBER
5. FUNDING NUMBERS
3. REPORT TYPE AND DATES COVERED
4. TITLE AND SUBTITLE
6. AUTHOR(S)
7. PERFORMING ORGANIZATION NAME(S) AND ADDRESS(ES)
11. SUPPLEMENTARY NOTES
12a. DISTRIBUTION/AVAILABILITY STATEMENT
13. ABSTRACT (Maximum 200 words)
14. SUBJECT TERMS
17. SECURITY CLASSIFICATION OF REPORT
16. PRICE CODE
15. NUMBER OF PAGES
20. LIMITATION OF ABSTRACT
Unclassified Unclassified
Technical Memorandum
Unclassified
National Aeronautics and Space AdministrationJohn H. Glenn Research Center at Lewis FieldCleveland, Ohio 44135–3191
1. AGENCY USE ONLY (Leave blank)
10. SPONSORING/MONITORING AGENCY REPORT NUMBER
9. SPONSORING/MONITORING AGENCY NAME(S) AND ADDRESS(ES)
National Aeronautics and Space AdministrationWashington, DC 20546–0001
Available electronically at http://gltrs.grc.nasa.gov
February 2006
NASA TM—2006-214111
E–15445
WBS 984754.02.07.03
19
Simulated Data for High Temperature Composite Design
Christos C. Chamis and Galib H. Abumeri
Composites; High temperature; Design properties; Mechanical; Thermal; Static;Rupture; Fatigue
Unclassified -UnlimitedSubject Category: 24
Christos C. Chamis, NASA Glenn Research Center; and Galib H. Abumeri, QSS Group, Inc., 21000 BrookparkRoad, Cleveland, Ohio 44135. Responsible person, Christos C. Chamis, organization code R, 216–433–3252.
The paper describes an effective formal method that can be used to simulate design properties for composites that isinclusive of all the effects that influence those properties. This effective simulation method is integrated computercodes that include composite micromechanics, composite macromechanics, laminate theory, structural analysis, andmulti-factor interaction model. Demonstration of the method includes sample examples for static, thermal, and fracturereliability for a unidirectional metal matrix composite as well as rupture strength and fatigue strength for a hightemperature super alloy. Typical results obtained for a unidirectional composite show that the thermal properties aremore sensitive to internal local damage, the longitudinal properties degrade slowly with temperature, the transverse andshear properties degrade rapidly with temperature as do rupture strength and fatigue strength for super alloys.

