sims 247 information visualization and presentation marti hearst march 15, 2002
Post on 21-Dec-2015
216 views
TRANSCRIPT

SIMS 247SIMS 247Information Visualization Information Visualization
and Presentation and Presentation
Marti HearstMarti Hearst
March 15, 2002March 15, 2002

OutlineOutline
• Why Text is ToughWhy Text is Tough
• Visualizing Concept SpacesVisualizing Concept Spaces– Clusters
– Category Hierarchies
• Visualizing Query SpecificationsVisualizing Query Specifications
• Visualizing Retrieval ResultsVisualizing Retrieval Results
• Usability Study Meta-AnalysisUsability Study Meta-Analysis
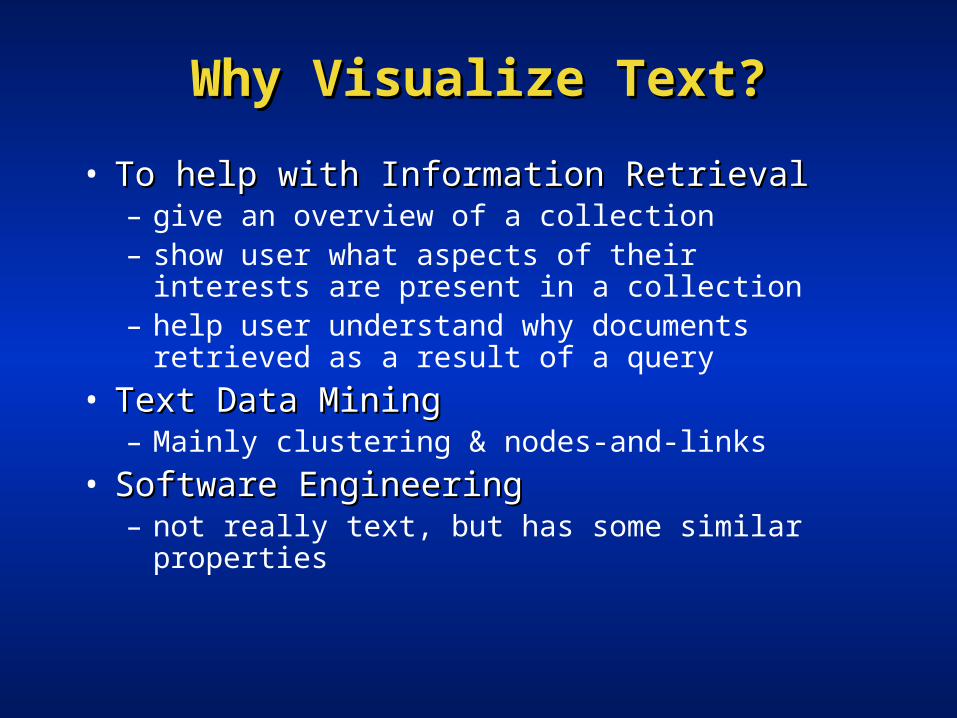
Why Visualize Text?Why Visualize Text?
• To help with Information RetrievalTo help with Information Retrieval– give an overview of a collection– show user what aspects of their interests are
present in a collection– help user understand why documents
retrieved as a result of a query
• Text Data MiningText Data Mining– Mainly clustering & nodes-and-links
• Software EngineeringSoftware Engineering– not really text, but has some similar
properties

Why Text is ToughWhy Text is Tough
• Text is Text is notnot pre-attentive pre-attentive• Text consists of abstract conceptsText consists of abstract concepts
– which are difficult to visualize
• Text represents similar concepts in many Text represents similar concepts in many different waysdifferent ways– space ship, flying saucer, UFO, figment of imagination
• Text has very high dimensionalityText has very high dimensionality– Tens or hundreds of thousands of features– Many subsets can be combined together

Why Text is ToughWhy Text is Tough
The Dog.

Why Text is ToughWhy Text is Tough
The Dog.
The dog cavorts.
The dog cavorted.

Why Text is ToughWhy Text is Tough
The man.
The man walks.

Why Text is ToughWhy Text is Tough
The man walks the cavorting dog.
So far, we can sort of show this in pictures.

Why Text is ToughWhy Text is Tough
As the man walks the cavorting dog, thoughtsarrive unbidden of the previous spring, so unlikethis one, in which walking was marching anddogs were baleful sentinals outside unjust halls.
How do we visualize this?
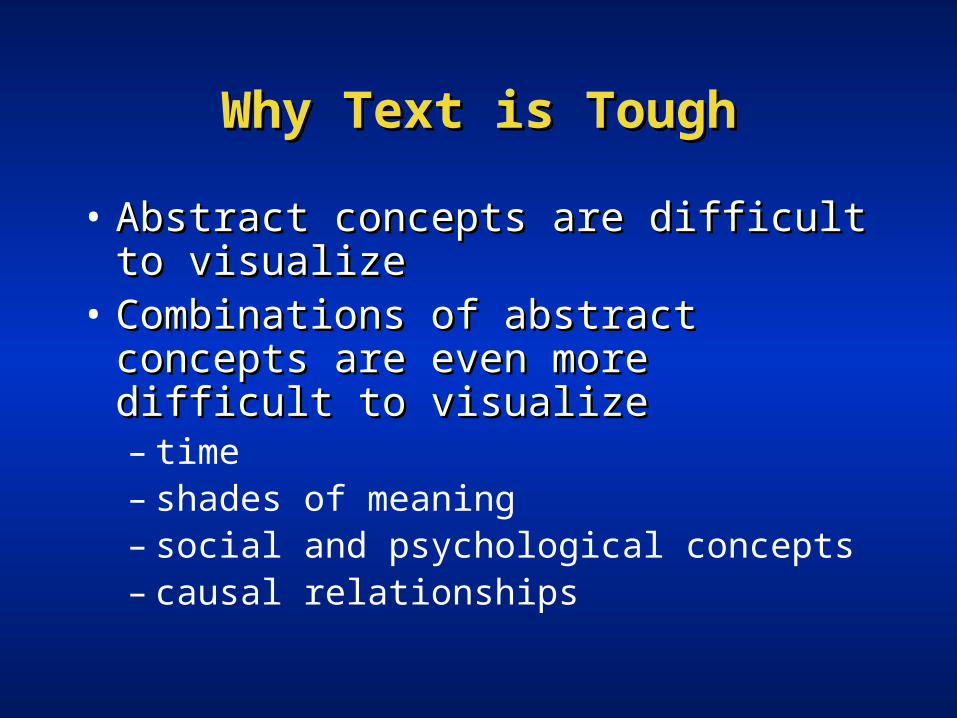
Why Text is ToughWhy Text is Tough
• Abstract concepts are difficult to Abstract concepts are difficult to visualizevisualize
• Combinations of abstract concepts Combinations of abstract concepts are even more difficult to visualizeare even more difficult to visualize– time– shades of meaning– social and psychological concepts– causal relationships

Why Text is ToughWhy Text is Tough
• Language only hints at meaningLanguage only hints at meaning• Most meaning of text lies within our Most meaning of text lies within our
minds and common understandingminds and common understanding– “How much is that doggy in the window?”
• how much: social system of barter and trade (not the size of the dog)
• “doggy” implies childlike, plaintive, probably cannot do the purchasing on their own
• “in the window” implies behind a store window, not really inside a window, requires notion of window shopping

Why Text is ToughWhy Text is Tough
• General categories have no standard General categories have no standard ordering (nominal data)ordering (nominal data)
• Categorization of documents by single Categorization of documents by single topics misses important distinctionstopics misses important distinctions
• Consider an article aboutConsider an article about– NAFTA– The effects of NAFTA on truck manufacture– The effects of NAFTA on productivity of
truck manufacture in the neighboring cities of El Paso and Juarez

Why Text is ToughWhy Text is Tough
• Other issues about languageOther issues about language– ambiguous (many different meanings
for the same words and phrases)– different combinations imply different
meanings

Why Text is EasyWhy Text is Easy
• Text is highly redundantText is highly redundant– When you have lots of it– Pretty much any simple technique can pull
out phrases that seem to characterize a document
• Instant summary:Instant summary:– Extract the most frequent words from a text– Remove the most common English words

Guess the TextGuess the Text
478 said478 said233 god233 god201 father201 father187 land187 land181 jacob181 jacob160 son160 son157 joseph157 joseph134 abraham134 abraham121 earth121 earth119 man119 man118 behold118 behold113 years113 years104 wife104 wife101 name101 name94 pharaoh94 pharaoh

Text Collection OverviewsText Collection Overviews
• How can we show an overview of the How can we show an overview of the contents of a text collection?contents of a text collection?– Show info external to the docs
• e.g., date, author, source, number of inlinks• does not show what they are about
– Show the meanings or topics in the docs• a list of titles• results of clustering words or documents• organize according to categories (next time)

Clustering for Collection OverviewsClustering for Collection Overviews– Scatter/Gather
• show main themes as groups of text summaries
– Scatter Plots• show docs as points; closeness indicates
nearness in cluster space• show main themes of docs as visual clumps or
mountains
– Kohonen Feature maps• show main themes as adjacent polygons
– BEAD• show main themes as links within a force-
directed placement network

Clustering for Collection OverviewsClustering for Collection Overviews
• Two main stepsTwo main steps– cluster the documents according to
the words they have in common– map the cluster representation onto a
(interactive) 2D or 3D representation

Text ClusteringText Clustering
• Finds overall similarities among Finds overall similarities among groups of documentsgroups of documents
• Finds overall similarities among Finds overall similarities among groups of tokensgroups of tokens
• Picks out some themes, ignores Picks out some themes, ignores othersothers

Sca
tter
/Gat
her
Sca
tter
/Gat
her

S/G Example: query on “star”S/G Example: query on “star”
Encyclopedia textEncyclopedia text14 sports14 sports
8 symbols8 symbols 47 film, tv47 film, tv 68 film, tv (p)68 film, tv (p) 7 music 7 music97 astrophysics97 astrophysics 67 astronomy(p)67 astronomy(p) 12 steller phenomena12 steller phenomena 10 flora/fauna10 flora/fauna 49 galaxies, stars 49 galaxies, stars
29 constellations29 constellations 7 miscelleneous7 miscelleneous
Clustering and Clustering and re-clusteringre-clustering is entirely automated is entirely automated

Scatter/GatherScatter/GatherCutting, Pedersen, Tukey & Karger 92, 93, Hearst & Pedersen 95Cutting, Pedersen, Tukey & Karger 92, 93, Hearst & Pedersen 95
• How it worksHow it works– Cluster sets of documents into general “themes”, like a table of contents – Display the contents of the clusters by showing topical terms and typical titles– User chooses subsets of the clusters and re-clusters the documents within – Resulting new groups have different “themes”
• Originally used to give collection overviewOriginally used to give collection overview• Evidence suggests more appropriate for displaying retrieval results in Evidence suggests more appropriate for displaying retrieval results in
contextcontext• Appearing (sort-of) in commercial systemsAppearing (sort-of) in commercial systems

Northern Light Web Search: Started Northern Light Web Search: Started out with clustering. Then integrated out with clustering. Then integrated
with categories. Now does not do web with categories. Now does not do web search and uses only categories.search and uses only categories.

Teoma: appears to combine Teoma: appears to combine categories and clusterscategories and clusters

Sca
tter
Plo
t of
Clu
ster
sS
catt
er P
lot
of C
lust
ers
(Ch
en e
t al
. 97)
(Ch
en e
t al
. 97)

BEAD (Chalmers 97)BEAD (Chalmers 97)

BE
AD
(C
hal
mer
s 96
)B
EA
D (
Ch
alm
ers
96)
An example layout produced by Bead, seen in overview,of 831 bibliography entries. The dimensionality (the number of unique words in the set) is 6925. A search for ‘cscw or collaborative’ shows the pattern of occurrences coloured dark blue, mostly to the right. The central rectangle is the visualizer’s motion control.

Example: ThemescapesExample: Themescapes(Wise et al. 95)(Wise et al. 95)
Themescapes (Wise et al. 95)

Clustering for Collection OverviewsClustering for Collection Overviews
• Since text has tens of thousands of Since text has tens of thousands of featuresfeatures– the mapping to 2D loses a
tremendous amount of information– only very coarse themes are detected

Galaxy of NewsRennison 95

Galaxy of NewsRennison 95

Koh
onen
Fea
ture
Map
sK
ohon
en F
eatu
re M
aps
(Lin
92,
Ch
en e
t al
. 97)
(Lin
92,
Ch
en e
t al
. 97)
(594 docs)

Study of Kohonen Feature MapsStudy of Kohonen Feature Maps
• H. Chen, A. Houston, R. Sewell, and B. H. Chen, A. Houston, R. Sewell, and B. Schatz, Schatz, JASIS 49(7)JASIS 49(7)
• Comparison: Kohonen Map and YahooComparison: Kohonen Map and Yahoo• Task:Task:
– “Window shop” for interesting home page– Repeat with other interface
• Results:Results:– Starting with map could repeat in Yahoo
(8/11)– Starting with Yahoo unable to repeat in map
(2/14)

How Useful is Collection Cluster How Useful is Collection Cluster Visualization for Search?Visualization for Search?
Three studies find negative Three studies find negative resultsresults

Study 1Study 1• Kleiboemer, Lazear, and Pedersen. Tailoring a retrieval system Kleiboemer, Lazear, and Pedersen. Tailoring a retrieval system
for naive users. In Proc. of the 5th Annual Symposium on for naive users. In Proc. of the 5th Annual Symposium on
Document Analysis and Information Retrieval,Document Analysis and Information Retrieval, 19961996
• This study comparedThis study compared– a system with 2D graphical clusters– a system with 3D graphical clusters– a system that shows textual clusters
• Novice usersNovice users• Only textual clusters were helpful (and Only textual clusters were helpful (and
they were difficult to use well)they were difficult to use well)

Study 2: Kohonen Feature MapsStudy 2: Kohonen Feature Maps
• H. Chen, A. Houston, R. Sewell, and B. Schatz, H. Chen, A. Houston, R. Sewell, and B. Schatz, JASIS 49(7)JASIS 49(7)
• Comparison: Kohonen Map and YahooComparison: Kohonen Map and Yahoo• Task:Task:
– “Window shop” for interesting home page– Repeat with other interface
• Results:Results:– Starting with map could repeat in Yahoo (8/11)– Starting with Yahoo unable to repeat in map
(2/14)

Study 2 (cont.)Study 2 (cont.)
• Participants liked:Participants liked:– Correspondence of region size to #
documents– Overview (but also wanted zoom)– Ease of jumping from one topic to
another – Multiple routes to topics– Use of category and subcategory labels

Study 2 (cont.)Study 2 (cont.)
• Participants wanted:Participants wanted:– hierarchical organization– other ordering of concepts (alphabetical)– integration of browsing and search– correspondence of color to meaning – more meaningful labels– labels at same level of abstraction– fit more labels in the given space– combined keyword and category search– multiple category assignment (sports+entertain)

Study 3: NIRVEStudy 3: NIRVE• NIRVE Interface by Cugini et al. 96. Each rectangle is a cluster. Larger clusters NIRVE Interface by Cugini et al. 96. Each rectangle is a cluster. Larger clusters
closer to the “pole”. Similar clusters near one another. Opening a cluster closer to the “pole”. Similar clusters near one another. Opening a cluster causes a projection that shows the titles.causes a projection that shows the titles.

Study 3Study 3• Visualization of search results: a comparative evaluation of text, 2D, Visualization of search results: a comparative evaluation of text, 2D,
and 3D interfaces Sebrechts, Cugini, Laskowski, Vasilakis and Miller, and 3D interfaces Sebrechts, Cugini, Laskowski, Vasilakis and Miller, Proceedings of SIGIR 99, Berkeley, CA, 1999.Proceedings of SIGIR 99, Berkeley, CA, 1999.
• This study comparedThis study compared::
– 3D graphical clusters– 2D graphical clusters– textual clusters
• 15 participants, between-subject design15 participants, between-subject design• TasksTasks
– Locate a particular document– Locate and mark a particular document– Locate a previously marked document– Locate all clusters that discuss some topic– List more frequently represented topics

Study 3Study 3• Results (time to locate targets)Results (time to locate targets)
– Text clusters fastest– 2D next– 3D last– With practice (6 sessions) 2D neared text results; 3D still slower– Computer experts were just as fast with 3D
• Certain tasks equally fast with 2D & textCertain tasks equally fast with 2D & text– Find particular cluster– Find an already-marked document
• But anything involving text (e.g., find title) much faster with But anything involving text (e.g., find title) much faster with text.text.– Spatial location rotated, so users lost context
• Helpful viz featuresHelpful viz features– Color coding (helped text too)– Relative vertical locations

Visualizing ClustersVisualizing Clusters
• Huge 2D maps may be inappropriate Huge 2D maps may be inappropriate focus for information retrieval focus for information retrieval – cannot see what the documents are about– space is difficult to browse for IR purposes– (tough to visualize abstract concepts)
• Perhaps more suited for pattern Perhaps more suited for pattern discovery and gist-like overviewsdiscovery and gist-like overviews

Co-Citation AnalysisCo-Citation Analysis• Has been around since the 50’s. Has been around since the 50’s. (Small, (Small,
Garfield, White & McCain)Garfield, White & McCain)
• Used to identify core sets ofUsed to identify core sets of– authors, journals, articles for particular fields – Not for general search
• Main Idea:Main Idea:– Find pairs of papers that cite third papers– Look for commonalitieis
• A nice demonstration by Eugene Garfield at: – http://165.123.33.33/eugene_garfield/papers/mapsciworld.html

Co-citation analysis Co-citation analysis (From Garfield 98)(From Garfield 98)

Co-citation analysis Co-citation analysis (From Garfield 98)(From Garfield 98)

Co-citation analysis Co-citation analysis (From Garfield 98)(From Garfield 98)
Category CombinationsCategory Combinations
Let’s show categories instead of Let’s show categories instead of clustersclusters

DynaCat DynaCat (Pratt, Hearst, & Fagan 99)(Pratt, Hearst, & Fagan 99)

DynaCat DynaCat (Pratt 97)(Pratt 97)
• Decide on important question types Decide on important question types in an advancein an advance– What are the adverse effects of drug D?– What is the prognosis for treatment T?
• Make use of MeSH categoriesMake use of MeSH categories• Retain only those types of categories Retain only those types of categories
known to be useful for this type of known to be useful for this type of query.query.

DynaCat StudyDynaCat Study
• DesignDesign– Three queries– 24 cancer patients– Compared three interfaces
• ranked list, clusters, categories
• ResultsResults– Participants strongly preferred categories– Participants found more answers using
categories– Participants took same amount of time with
all three interfaces

HiBrowseHiBrowse

Category CombinationsCategory Combinations
• HiBrowse Problem: HiBrowse Problem: – Search is not integrated with
browsing of categories– Only see the subset of categories
selected (and the corresponding number of documents)

MultiTrees MultiTrees (Furnas & Zacks ’94)(Furnas & Zacks ’94)

Images from finance.yahoo.com
Cat-a-Cone:Cat-a-Cone:Multiple Simultaneous CategoriesMultiple Simultaneous Categories
• Key Ideas:Key Ideas:– Separate documents from category
labels– Show both simultaneously
• Link the two for iterative feedbackLink the two for iterative feedback• Distinguish between:Distinguish between:
– Searching for Documents vs.– Searching for Categories

Cat-a-Cone InterfaceCat-a-Cone Interface

Images from finance.yahoo.com
Cat-a-ConeCat-a-Cone
• Catacomb: Catacomb: (definition 2b, online Websters)“A complex set of interrelated things”
• Makes use of earlier PARC work on Makes use of earlier PARC work on 3D+animation:3D+animation:Rooms Henderson and Card 86IV: Cone Tree Robertson, Card, Mackinlay 93Web Book Card, Robertson, York 96

Images from finance.yahoo.com
Collection
Retrieved Documents
searchsearch
CategoryHierarch
y
browsebrowsequery terms

Images from finance.yahoo.com
ConeTree for Category LabelsConeTree for Category Labels
• Browse/explore category hierarchyBrowse/explore category hierarchy– by search on label names– by growing/shrinking subtrees– by spinning subtrees
• AffordancesAffordances– learn meaning via ancestors, siblings– disambiguate meanings– all cats simultaneously viewable

Images from finance.yahoo.com
Virtual Book for Result SetsVirtual Book for Result Sets
– Categories on Page (Retrieved Document) linked to Categories in Tree
– Flipping through Book Pages causes some Subtrees to Expand and Contract
– Most Subtrees remain unchanged
– Book can be Stored for later Re-Use

Images from finance.yahoo.com
Improvements over Standard Category Improvements over Standard Category InterfacesInterfaces
Integrate category selection with Integrate category selection with viewing of categories viewing of categories
Show all categories + context Show all categories + context Show relationship of retrieved Show relationship of retrieved
documents to the category structuredocuments to the category structure But … do users understand and like But … do users understand and like
the 3D?the 3D?

The FLAMENCO ProjectThe FLAMENCO Project
• Basic idea similar to Cat-a-ConeBasic idea similar to Cat-a-Cone• But use familiar HTML interaction But use familiar HTML interaction
to achieve similar goalsto achieve similar goals• Usability results are very strong for Usability results are very strong for
users who care about the users who care about the collection.collection.

Query SpecificationQuery Specification

Command-Based Query SpecificationCommand-Based Query Specification
• command attribute value connector …command attribute value connector …
– find pa shneiderman and tw user#
• What are the attribute names?What are the attribute names?• What are the command names?What are the command names?• What are allowable values?What are allowable values?

Form-Based Query Specification (Altavista)Form-Based Query Specification (Altavista)

Form-Based Query Specification (Melvyl)Form-Based Query Specification (Melvyl)

Form-based Query Specification (Infoseek)Form-based Query Specification (Infoseek)

Dir
ect
Man
i pu
lati
on S
pec
.D
irec
t M
anip
ul a
tion
Sp
ec.
VQ
UE
RY
(J o
nes
98)
VQ
UE
RY
(Jo
nes
98)

Menu-based Query SpecificationMenu-based Query Specification(Young & Shneiderman 93)(Young & Shneiderman 93)
ContextContext

Putting Results in ContextPutting Results in Context• Visualizations of Query Term DistributionVisualizations of Query Term Distribution
– KWIC, TileBars, SeeSoft• Visualizing Shared Subsets of Query TermsVisualizing Shared Subsets of Query Terms
– InfoCrystal, VIBE, Lattice Views
• Table of Contents as ContextTable of Contents as Context– Superbook, Cha-Cha, DynaCat
• Organizing Results with TablesOrganizing Results with Tables– Envision, SenseMaker
• Using HyperlinksUsing Hyperlinks– WebCutter

Putting Results in ContextPutting Results in Context
• Interfaces should Interfaces should – give hints about the roles terms play in
the collection– give hints about what will happen if
various terms are combined– show explicitly why documents are
retrieved in response to the query– summarize compactly the subset of
interest

KWIC (Keyword in Context)KWIC (Keyword in Context)• An old standard, ignored until recently by An old standard, ignored until recently by
internet search enginesinternet search engines– used in some intranet engines, e.g., Cha-Cha

Display of Retrieval ResultsDisplay of Retrieval Results
Goal: minimize time/effort for Goal: minimize time/effort for deciding which documents to deciding which documents to examine in detailexamine in detail
Idea: show the roles of the query Idea: show the roles of the query terms in the retrieved documents, terms in the retrieved documents, making use of document structuremaking use of document structure

TileBarsTileBars
Graphical Representation of Term Graphical Representation of Term Distribution and OverlapDistribution and Overlap
Simultaneously Indicate:Simultaneously Indicate:– relative document length– query term frequencies– query term distributions– query term overlap

Query terms:
What roles do they play in retrieved documents?
DBMS (Database Systems)
Reliability
Mainly about both DBMS & reliability
Mainly about DBMS, discusses reliability
Mainly about, say, banking, with a subtopic discussion on DBMS/Reliability
Mainly about high-tech layoffs
ExampleExample


Exploiting Visual PropertiesExploiting Visual Properties
– Variation in gray scale saturation imposes a universal, perceptual order (Bertin et al. ‘83)
– Varying shades of gray show varying quantities better than color (Tufte ‘83)
– Differences in shading should align with the values being presented (Kosslyn et al. ‘83)
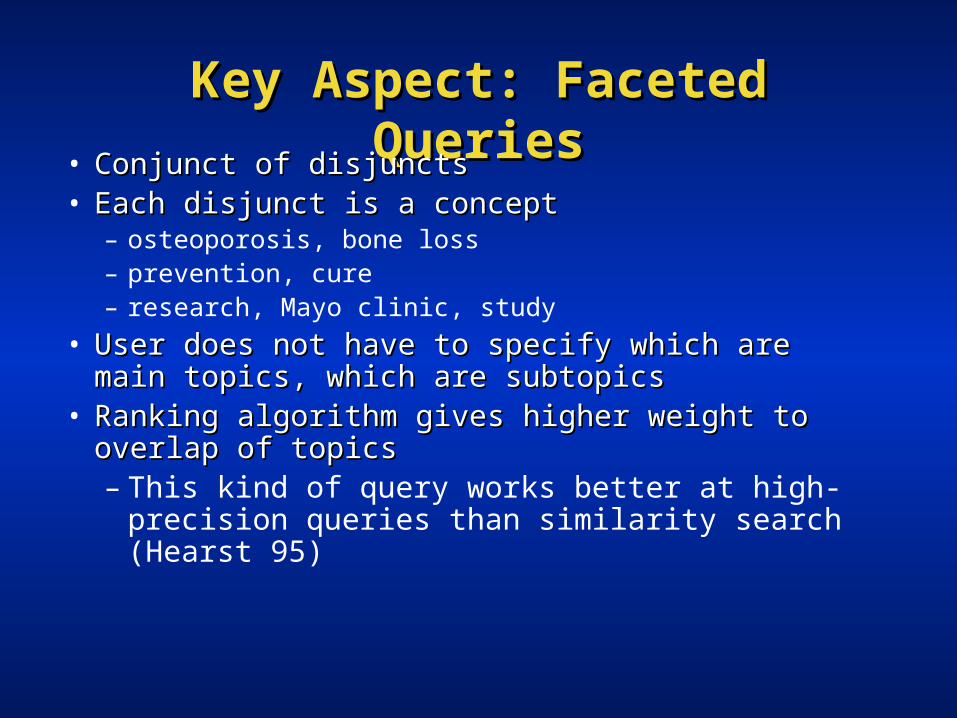
Key Aspect: Faceted QueriesKey Aspect: Faceted Queries• Conjunct of disjunctsConjunct of disjuncts• Each disjunct is a conceptEach disjunct is a concept
– osteoporosis, bone loss– prevention, cure– research, Mayo clinic, study
• User does not have to specify which are main User does not have to specify which are main topics, which are subtopicstopics, which are subtopics
• Ranking algorithm gives higher weight to overlap Ranking algorithm gives higher weight to overlap of topicsof topics– This kind of query works better at high-
precision queries than similarity search (Hearst 95)

TileBars SummaryTileBars Summary
Preliminary User StudiesPreliminary User Studies users understand them
find them helpful in some situations, but probably slower than just reading titles
sometimes terms need to be disambiguated

SeeSoft: Showing Text Content using a linear representation and SeeSoft: Showing Text Content using a linear representation and brushing and linking (Eick & Wills 95)brushing and linking (Eick & Wills 95)

Query Term SubsetsQuery Term Subsets
Show which subsets of query Show which subsets of query terms occur in which subsets terms occur in which subsets of documents occurs in which of documents occurs in which subsets of retrieved subsets of retrieved documentsdocuments

Term Occurrences in Results SetsTerm Occurrences in Results Sets
Show how often each query term Show how often each query term occurs in retrieved documentsoccurs in retrieved documents– VIBE (Korfhage ‘91)– InfoCrystal (Spoerri ‘94)– Problems:
• can’t see overlap of terms within docs• quantities not represented graphically• more than 4 terms hard to handle• no help in selecting terms to begin
with

InfoCrystal InfoCrystal (Spoerri 94)(Spoerri 94)

VIBE VIBE (Olson et al. 93, Korfhage 93)(Olson et al. 93, Korfhage 93)

Term Occurrences in Results SetsTerm Occurrences in Results Sets
– Problems: • can’t see overlap of terms within
docs• quantities not represented
graphically• more than 4 terms hard to handle• no help in selecting terms to begin
with

DLITE DLITE (Cousins 97)(Cousins 97)
• Supporting the Information Seeking Supporting the Information Seeking ProcessProcess– UI to a digital library
• Direct manipulation interface Direct manipulation interface • Workcenter approachWorkcenter approach
– experts create workcenters– lots of tools for one task – contents persistent

Slide by Shankar Raman
DLITE DLITE (Cousins 97)(Cousins 97)• Drag and Drop interfaceDrag and Drop interface• Reify queries, sources, retrieval resultsReify queries, sources, retrieval results• Animation to keep track of activityAnimation to keep track of activity

IR Infovis Meta-Analysis IR Infovis Meta-Analysis (Chen & Yu ’00)(Chen & Yu ’00)
• GoalGoal– Find invariant underlying relations suggested
collectively by empirical findings from many different studies
• ProcedureProcedure– Examine the literature of empirical infoviz studies
• 35 studies between 1991 and 2000• 27 focused on information retrieval tasks• But due to wide differences in the conduct of the studies
and the reporting of statistics, could use only 6 studies
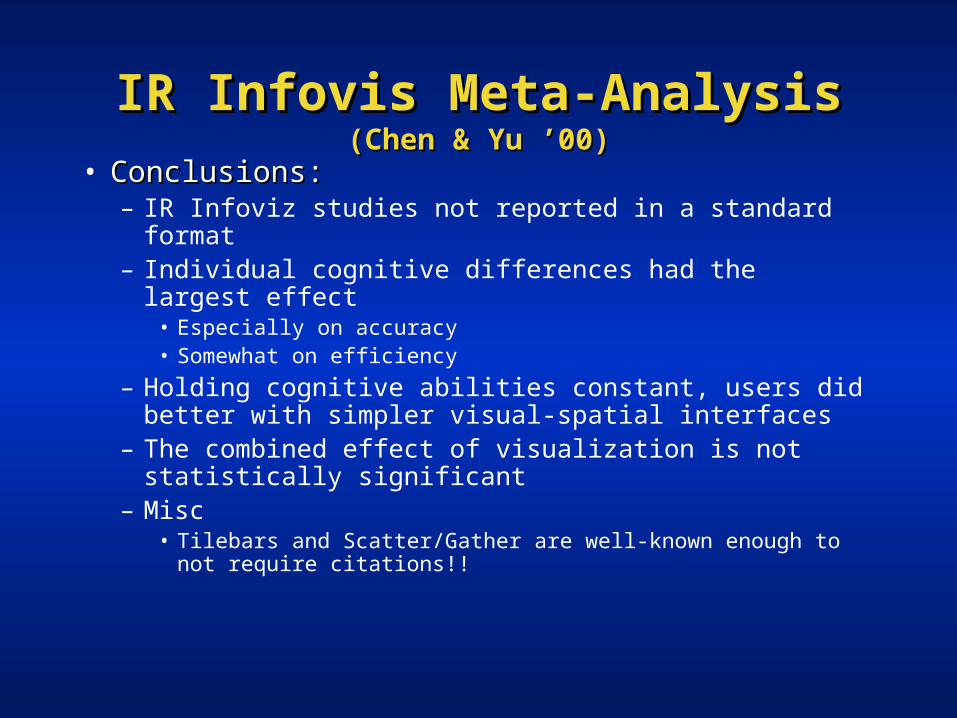
IR Infovis Meta-Analysis IR Infovis Meta-Analysis (Chen & Yu ’00)(Chen & Yu ’00)
• Conclusions:Conclusions:– IR Infoviz studies not reported in a standard format– Individual cognitive differences had the largest
effect• Especially on accuracy• Somewhat on efficiency
– Holding cognitive abilities constant, users did better with simpler visual-spatial interfaces
– The combined effect of visualization is not statistically significant
– Misc• Tilebars and Scatter/Gather are well-known enough to not
require citations!!