simplified mechanical model to estimate the seismic vulnerability...
TRANSCRIPT
Simplified mechanical model to estimate the seismic
vulnerability of heritage unreinforced masonry buildings
DIMITRIOS VAMVATSIKOS1, and STAVROULA J. PANTAZOPOULOU
2
1 School of Civil Engineering, National Technical University of Athens, Greece,
[email protected] 2 Department of Civil and Environmental Engineering, University of Cyprus, Nicosia 1678, Cyprus/ on
leave of absence from DUTh, Greece, [email protected]
SUMMARY
Traditional or historic masonry structures occur in large populations throughout the
world, particularly in preserved historical city clusters. Being non-engineered and
ageing these structures are in urgent need of assessment and seismic
repair/rehabilitation. But traditional masonry presents important challenges to
computational modeling, owing to complexity of structural system, material
inhomogeneity and contact interactions that collectively can only be addressed
through detailed 3D nonlinear representation. In this paper, a simple, performance
assessment model is developed in order to address the need for preliminary
assessment tools for this class of structures. The objective is to be able to rapidly
identify buildings that are at higher risk in the event of a significant earthquake,
potentially justifying a second round of more detailed evaluation. The proposed model
defines the characteristics of a Single Degree of Freedom representation of the
building, formulating consistent 3D shape functions to approximate its fundamental
mode of vibration considering both in-plane and out-plane wall bending as a result of
insufficient diaphragm action. Parametric expressions for the dynamic properties are
derived in terms of the important geometric, material, and system characteristics, and
are used to express local demand from global estimates. Acceptance criteria are
established both in terms of deformation and strength indices to guide retrofit. An
application example of the proposed assessment methodology is included, to
demonstrate the ability of the model to reproduce the essential features of traditional
masonry buildings under seismic action.
KEY WORDS: earthquake; masonry building; simplified model; fragility; static
pushover.
1. Introduction
A large number of historical buildings used as traditional family dwellings in the
Balkans are almost exclusively of unreinforced masonry (URM) occasionally laced by
timber tiers; this structural system is known from ancient times as Opus Craticium.
The resistance of URM to lateral loads is primarily imparted by interface friction
between interlocking stones, supported due to the overbearing gravity loads. The
origin of this construction archetype dates back to pre-Minoan times, continues
through classical antiquity and the roman times (Vitruvius 27-23 BC), and has
survived in abundance throughout the Balkan region primarily in historical/traditional
structures dating to the pre-World War II period. Basic characteristics of this type of
construction are (a) the relatively large area ratio of exterior and interior walls which
may be either reinforced with timber ties (referred to as tiers) or entirely unreinforced,
and (b) the relatively flexible diaphragms.
Post-earthquake reconnaissance reports in S. Europe, record modes of failure in
URM buildings typified by diagonal cracking of wall piers, out of plane bending and
detachment of piers and dissembling of corner masonry blocks. These are usually
owing to the combined absence of diaphragm action, insufficient tying of horizontal
to vertical member of the structure and the cumulative implications of poor
maintenance and long term phenomena (creep, ageing, corrosion/erosion and soil
settlement) [Vintzileou et al. 2007, Simsir et al. 2004, Ceci et al. (2010), Günay and
Mosalam (2010)]. Additional problems are associated with the inherent brittleness of
unreinforced masonry, occasionally poor workmanship, large self-weight of the
structural materials used (including stone roof-tiles) and lack of any design for
seismic resistance apart from the empirical traditional practices of the era of
construction.
Design and assessment of load-bearing unreinforced masonry structures until
recently was not regulated by any established Code of practice. With the introduction
of design standards for masonry (EC6, 1989), an outstanding issue regarding high-
seismicity regions is the assessment of structural adequacy of existing historical or
traditional buildings. From an engineering perspective among existing structures
traditional constructions stand out as a special category because: (a) their lateral load
resisting system is vague and undefined, (b) they often combine load carrying and
secondary components, whereas factors such as ageing, corrosion/depletion of the
stone binder and of the timber ties, as well as human intervention, further degrade
their seismic resistance.
Due to their heritage significance, rehabilitation of traditional structures is
regulated by International Treaties requiring compatibility and reversibility of the
intervention [ICOMOS, 1964]. Thus, there is a need for development of uniform
methods for seismic assessment and rehabilitation, specifically tailored to the
structural system and performance criteria that represent this class of structures. A
most difficult issue in this regard is establishing generalized rules for quantifying the
seismic vulnerability of traditional structures, firstly due to their great variability of
form, but also owing to the different extents of degradation and human intervention
they have endured over the years.
On a scale of complexity of application, rapid visual screening and detailed finite
element simulation of historical buildings represent the two most remote ends in the
spectrum of methods used today for the purposes of seismic assessment of structures.
Rapid screening based on visual observation can only assess the condition of the
structure and possible damages. Detailed F.E. solutions are fraught with uncertainty
with regards to the mechanical behavior of the materials, the extent of damage, and
the actual state of interaction that occurs at the interfaces of different materials (e.g.
timber and mortar or stones, soil with masonry, etc.). For the needs of seismic
assessment (EC8-III 2005), traditional heritage buildings qualify under knowledge
level I (KL-I): for KL-I, owing to the limited information about material properties
and the structural system, the code discourages the use of nonlinear modeling and
analysis, but rather, requires the use of simple procedures requiring relatively little
computational effort that is comparable to the limited information available. In this
case, nonlinear models may be used primarily in order to guide the development, and
to corroborate and support the development of simple procedures (see for example the
results from a research project PERPETUATE which uses such a nonlinear approach
for assessment of cultural heritage buildings with stiff diaphragms, Lagomarsino and
Cattari, 2015). However, when shell element modeling is required to model the load
bearing walls (this is the case where the building has flexible diaphragms, or poor
connectivity between diaphragms and perimeter walls) introducing material
nonlinearity in the form of softening and brittleness to represent the unreinforced
masonry is practically impossible: the analysis becomes ill-conditioned in the absence
of the stabilizing influence of reinforcement, even from the occurrence of the minutest
crack (Pantazopoulou 2013). This paper presents such a simplified procedure intended to be used as a first order
assessment tool of the seismic resistance of stone-masonry traditional houses of box-
type with flexible diaphragms. The method is formulated using an equivalent SDOF
representation of the building’s dynamic response. Both demand and supply in the
critical locations of the structure needed for evaluation of the acceptance criteria are
established in closed-form, in terms of deformation measures, through transformation
of global response quantities to local measures. Transformation was based on the
shape of fundamental mode of spatial vibration of the structure which was
approximated in this study by a 3-dimensional shape function, derived consistently
with the boundary conditions of the building. Acceptance criteria are established both
in terms of deformation and strength indices. An application example of the proposed
assessment methodology is included, to demonstrate the ability of the model to
reproduce the essential features of traditional masonry buildings under seismic action.
2. Mechanical Model
2.1. Extending the concepts of Pushover Analysis
The framework of seismic assessment methodologies for steel and concrete structures
that has been developed in the past twenty years forms the natural background for
development of similar methods geared towards masonry structures. The commonest
and most palatable of the available options are nonlinear static approaches where the
structure is considered in its fundamental mode of vibration through the Equivalent
Single Degree of Freedom (ESDOF) idealization (EC 8-I (2004)). The associated
resistance (static pushover) curve is obtained by considering load patterns that follow
the height-wise profile of the translational mode.
However, a significant difference between steel or concrete frames and URM
structures exists, that complicates direct extension of the established procedures to
masonry buildings: Frame structures are mostly lumped systems with stiff
diaphragms, whereas URM buildings (at least the types considered in the present
paper) have distributed mass and stiffness with typically flexible diaphragms. The
consequence of this characteristic is that the fundamental mode of vibration engages a
disproportionately low fraction of the building mass, well below the 75% cutoff value
for mass participation which is a pre-requisite for the application of the simple
ESDOF-based methods.
The alternative option of multimodal pushover analysis (Chopra & Goel 2002) can
only be realistically applied with finite element models. In most cases the effort
required to obtain dependable results coupled with the degree of uncertainty regarding
the actual model properties render this approach beyond the scope of practical
assessment of URM structures. Equivalent frame models (Lagomarsino et al. 2013)
can be useful in reproducing modes of failure that depend on in-plane strength and
stiffness of wall elements, but they are particularly suited to buildings with stiff
diaphragms; some types of traditional buildings such as those considered here are
particularly susceptible to out-of-plane action owing to flexible diaphragms.
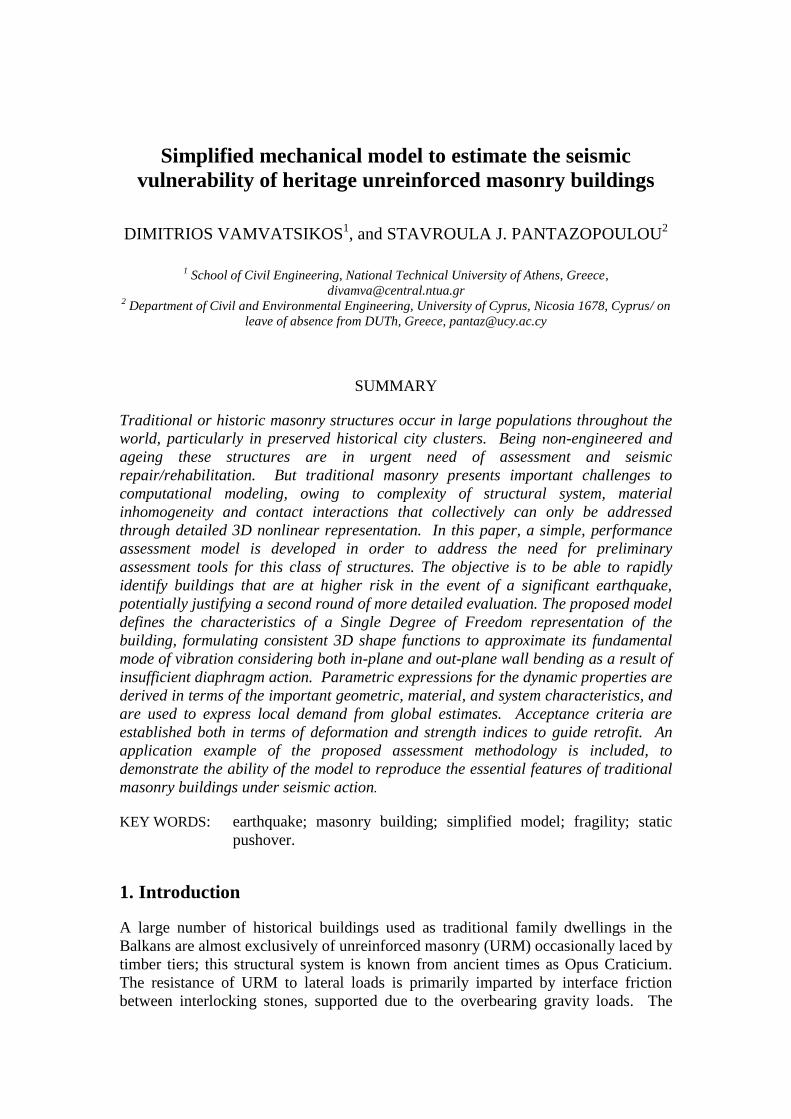
Figure 1. (a) Typical example of timber laced stone-masonry dwelling (b) Idealized
Building Model (box) (c) Variation of total translational accelerations along building height.
In order to extend the concepts of classical pushover analysis to masonry structures
the translational displacement shape is required, Φ(x,y,z), which is assumed by the
structure at the peak of its dynamic response to horizontal ground motion. Through
this shape it is also possible to identify and localize the likely points of concentration
of anticipated damage from the resulting distribution of deformation implicit in
Φ(x,y,z), while at the same time identifying (a) locations where lack of stiffness may
occur and (b) the relative significance of possible mass or stiffness discontinuities.
The shape of lateral translation, Φ(x,y,z), at the peak of earthquake response, most
likely comprises contributions of several modes and mechanisms of deformation, and
must necessarily engage a significant fraction of the system’s mass during vibration as
usually occurs with a random motion such as the ground excitation. In the present
study, in order to establish its form, the structure is subjected to a horizontal
gravitational field that acts in the direction of the earthquake considered. This
approach is based on the observation that pointwise throughout the structure, the
earthquake loading p(x,y,z,t) is proportional to the system’s mass, m(x,y,z), as follows:
g/)t,z,y,x(u)z,y,x(w)t,z,y,x(u)z,y,x(m)t,z,y,x(p totdtot (1)
where, wd(x,y,z) is the associated value of the weight, totu the distribution of total
acceleration throughout the structure and g the acceleration of gravity; this starts from
the value of peak ground acceleration, groundu , at ground level, and increases to the
total acceleration of the system at the crest of the roof, uuu groundtot , where u is the
relative displacement of the structure with reference to its base support. At peak
response, the distribution of total accelerations in Eq. (1) follows a trapezoidal-like
distribution, as illustrated in Fig. 1c, starting from the ground acceleration magnitude
at the support, to the amplified value at the crest. . From Eq. (1) it follows that the
earthquake forces have the same spatial distribution as the mass, naturally increasing
with height along with the lateral acceleration. To simplify the calculations, the
x
y
z

increase in intensity owing to the height-wise variation of accelerations is neglected in
the remainder of this discussion. Instead, a uniform average acceleration pattern
along the height of the structure is assumed (shown by a dashed line in Fig. 1c).
The resulting lateral displacement of the structure, ud(x,y,z), owing to the
application of the point-wise value of the weight in the direction of seismic action, has
the advantage of satisfying all the essential and natural boundary conditions of the
structural vibration problem. For example, the restoring forces that resist the applied
gravitational field in the direction of the earthquake satisfy the associated dynamic
equilibrium equation since:
g/)t,z,y,x(u)z,y,x(m)z,y,x(uk tot (2)
and,
g)z,y,x(m)z,y,x(w)z,y,x(uk dd (3)
It has been shown that the translational shape of vibration, obtained by normalizing
the shape of ud as Φ(x,y,z) = ud(x,y,z)/ud,max, results in a mass participation factor in
the direction of earthquake action, in the range of 90% or more (Pardalopoulos et al.
2013). This procedure has the practical advantage that it enables the use of the
familiar features of classical shell analysis software that are used routinely for gravity
load analysis of distributed mass systems with the sole input modification over
conventional gravity load analysis being the direction of acting gravitational field
selected by the user.
Using the translational shape of vibration, the natural frequency of vibration of the
system may be approximated with sufficient accuracy using the Rayleigh quotient as
follows:
dum
dum
gd
d
2
2 (4)
Seismic demands may be determined in terms of total acceleration and displacement
of the associated SDOF system (EC8-I (2004) or ASCE-41/06 (2007)). Interestingly
the design lateral forces (seismic demand and supply) for load-bearing unreinforced
masonry structures, VSd and VRd, both depend on the distribution of mass of the URM
building (the force demand increases with the system’s mass, whereas the frictional
resistance at any horizontal plane of sliding increases with the overbearing weight of
the structure which is also proportional to the mass (Tastani et al. 2009). For example,
higher gravity loads attract a higher seismic base shear (greater mass), but the lateral
shear resistance of the walls also increases through enhanced friction. Thus the two
terms in the design inequality, VSd < VRd, interact, to the extent that structural safety
may only be assessed for a specific seismic hazard spectrum. In light of the
complexity and uncertainties involved in the problem, determination of the
performance point for a given ground motion is estimated based on elastic analysis,
making allowance for ductility by moderating the force demands and magnifying the
displacement demands. To further simplify the process, the important step of the
calculation of the shape of translational vibration, (x,y,z), and the associated
characteristics of an equivalent single degree of freedom (ESDOF) approximation of
the load-bearing masonry structure are estimated through simplifying assumptions so
as to obtain closed form solutions that may provide the basis for easily applicable
assessment tools. The derivations are listed in the following sections.
a
b
x
y
Seismic loading
n1
n2
n3 n4
n5
z
Η
Ν(z
q(z)
x
t
ni: plan dimension of openings
(a) (b)
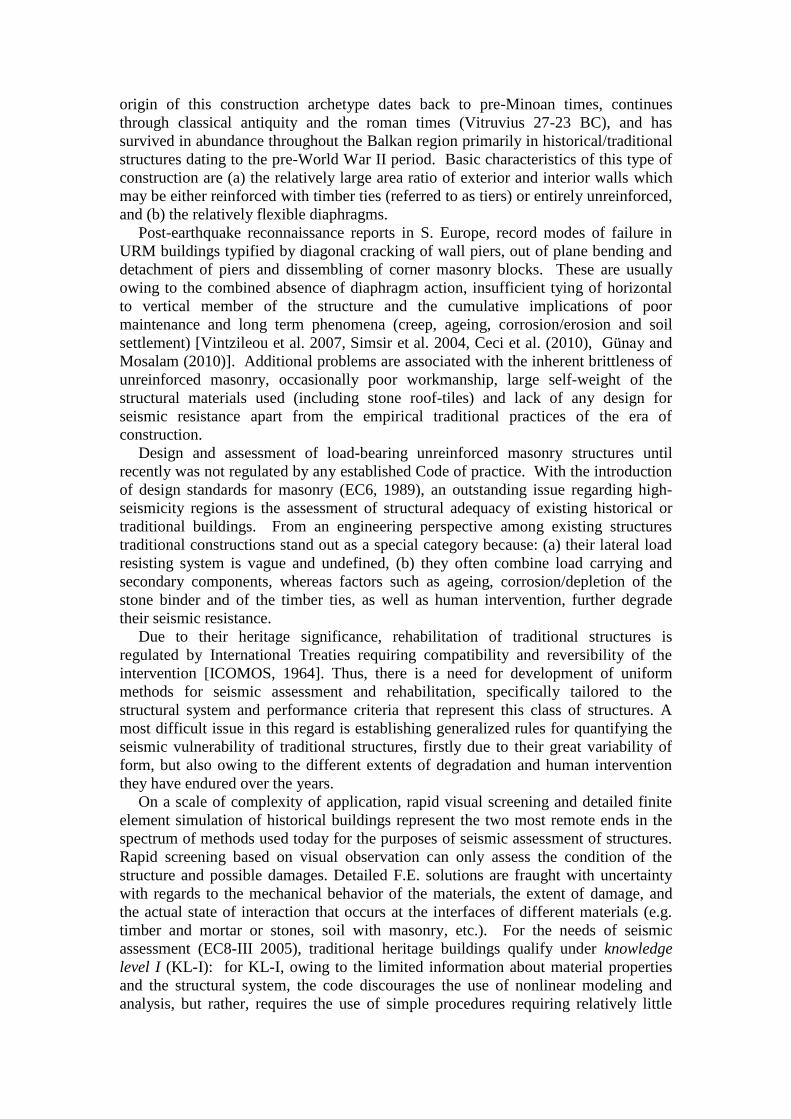
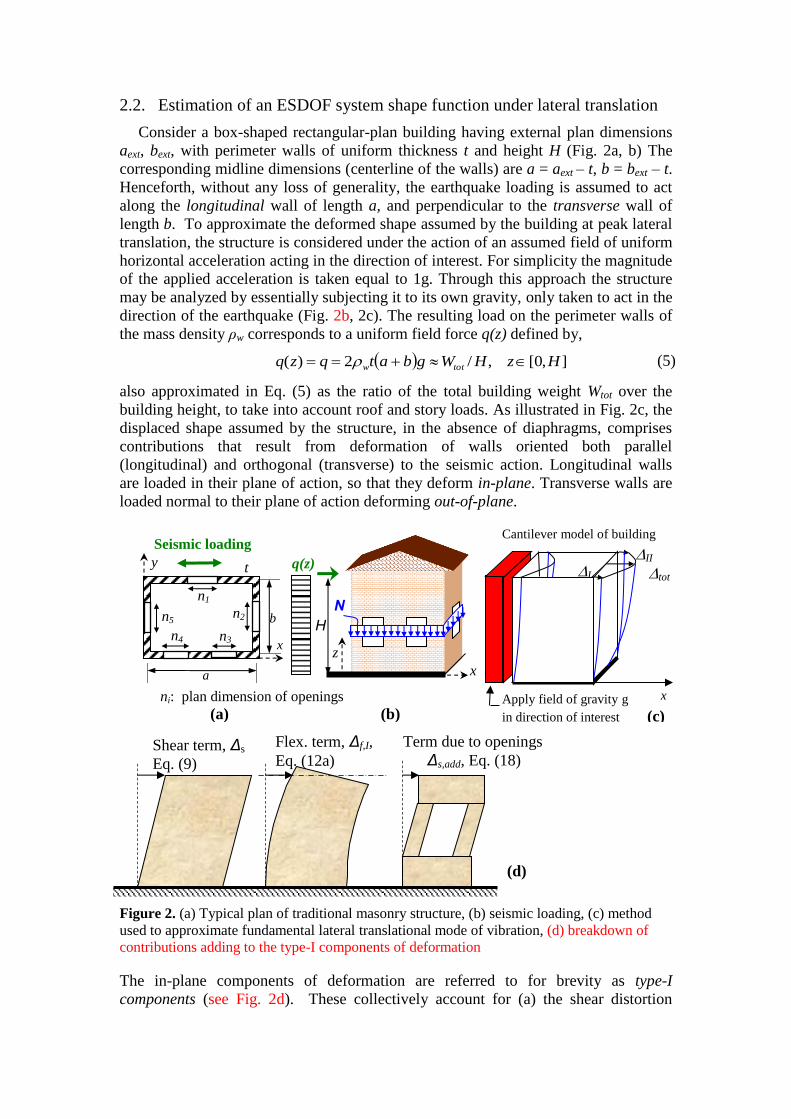
2.2. Estimation of an ESDOF system shape function under lateral translation
Consider a box-shaped rectangular-plan building having external plan dimensions
aext, bext, with perimeter walls of uniform thickness t and height H (Fig. 2a, b) The
corresponding midline dimensions (centerline of the walls) are a = aext – t, b = bext – t.
Henceforth, without any loss of generality, the earthquake loading is assumed to act
along the longitudinal wall of length a, and perpendicular to the transverse wall of
length b. To approximate the deformed shape assumed by the building at peak lateral
translation, the structure is considered under the action of an assumed field of uniform
horizontal acceleration acting in the direction of interest. For simplicity the magnitude
of the applied acceleration is taken equal to 1g. Through this approach the structure
may be analyzed by essentially subjecting it to its own gravity, only taken to act in the
direction of the earthquake (Fig. 2b, 2c). The resulting load on the perimeter walls of
the mass density ρw corresponds to a uniform field force q(z) defined by,
],0[,/2)( HzHWgbatqzq totw (5)
also approximated in Eq. (5) as the ratio of the total building weight Wtot over the
building height, to take into account roof and story loads. As illustrated in Fig. 2c, the
displaced shape assumed by the structure, in the absence of diaphragms, comprises
contributions that result from deformation of walls oriented both parallel
(longitudinal) and orthogonal (transverse) to the seismic action. Longitudinal walls
are loaded in their plane of action, so that they deform in-plane. Transverse walls are
loaded normal to their plane of action deforming out-of-plane.
Figure 2. (a) Typical plan of traditional masonry structure, (b) seismic loading, (c) method
used to approximate fundamental lateral translational mode of vibration, (d) breakdown of
contributions adding to the type-I components of deformation
The in-plane components of deformation are referred to for brevity as type-I
components (see Fig. 2d). These collectively account for (a) the shear distortion
Apply field of gravity g
in direction of interest (c)
x
Cantilever model of building
tot
II I
Shear term, Δs
Eq. (9)
Flex. term, Δf,I,
Eq. (12a)
Term due to openings
Δs,add, Eq. (18)
(d)

occurring in walls parallel to the load, (b) the flexural drift caused in the structure by
the overturning moment of the distributed lateral pressure, and (c) the amplification of
lateral distortion at the level of openings due to the increased lateral compliance of the
structure at that level. The value of the type-I components only depends upon the
vertical coordinate z, but not on the in-plan coordinates x or y.
The out-of-plane components primarily comprise lateral deflections of the
transversal walls bending about their weak axis and they are referred to in the
remainder as type-II components. Their magnitude represents relative displacements
of points in the building plan – i.e., within the horizontal plane and it depends on all
vertical and horizontal coordinates, x, y and z. The effect of diaphragms becomes a
factor on the flexure-only terms of the deformation (i.e., type I and II components),
modulating their contribution to the total.
These contributions are combined to define the building’s deformation at any
point. Of particular interest is the peak lateral translation (usually at some point in the
roof), as it will be used to normalize the displacement profile so as to determine a
shape, (x,y,z). The point where the displacement shape after normalization is equal
to 1.0 defines the control node of the structure, in pushover terms. In symmetric
structures this usually occurs at the midcrest of a transverse wall that is bending out of
plane (see Figure 2c). Estimating the displacement of the control node for a given
level of loading is the goal of the following subsections.
2.2.1 In-Plane Contributions to Lateral Translation: Type I components
The shear and flexural contributions to the Type-I deflection, denoted by ΔI in Fig. 2c,
for walls parallel to the earthquake action, as depicted schematically in Fig. 2d, are
evaluated in detail in this section. If the building is seen as a cantilever structure fixed
at ground level and free at the roof, having a box-type cross section defined by the
building plan, then the walls parallel to the direction of the load serve as the web of
the cantilever. At any level z from the fixed end, the shear force V(z) and associated
shear strain γs(z) along the building height in the web become:
zHqqzV
H
z
d)()( (6)
wwww
sGA
zHq
AG
)z(V)z(
(7)
where Gw is the effective shear modulus of the wall. (Gw may be obtained from tests
in shear panels as the ascending stiffness of the shear stress – shear strain relationship.
It is addressed in detail in Section 2.4; a simplification is to approximate its value as:
Gw≈1000 y,vf , where y,vf is the shear yield-strength of masonry, usually taken equal
to the tensile strength of the material). In the presence of diaphragm action, the wall
shear area is taken equal to their plan area Αw = 2t·(a+b); otherwise it is taken equal to
the area of the walls parallel to the load, i.e. Aw =2t·a. The resulting horizontal
displacement along the loading direction x is,
ww
z
0ss
GA2
zH2qzd)()z(d
(8)
and the maximum displacement due to shear at the top of the walls is
ww
2
ssGA2
qH)H(d (9)
Similarly, the moment M(z) and curvature )(z along the height become:
2d)()(
2zHq
VzM
H
z
(10)
planplan EI
zHq
EI
zMz
2
)()(
2
(11)
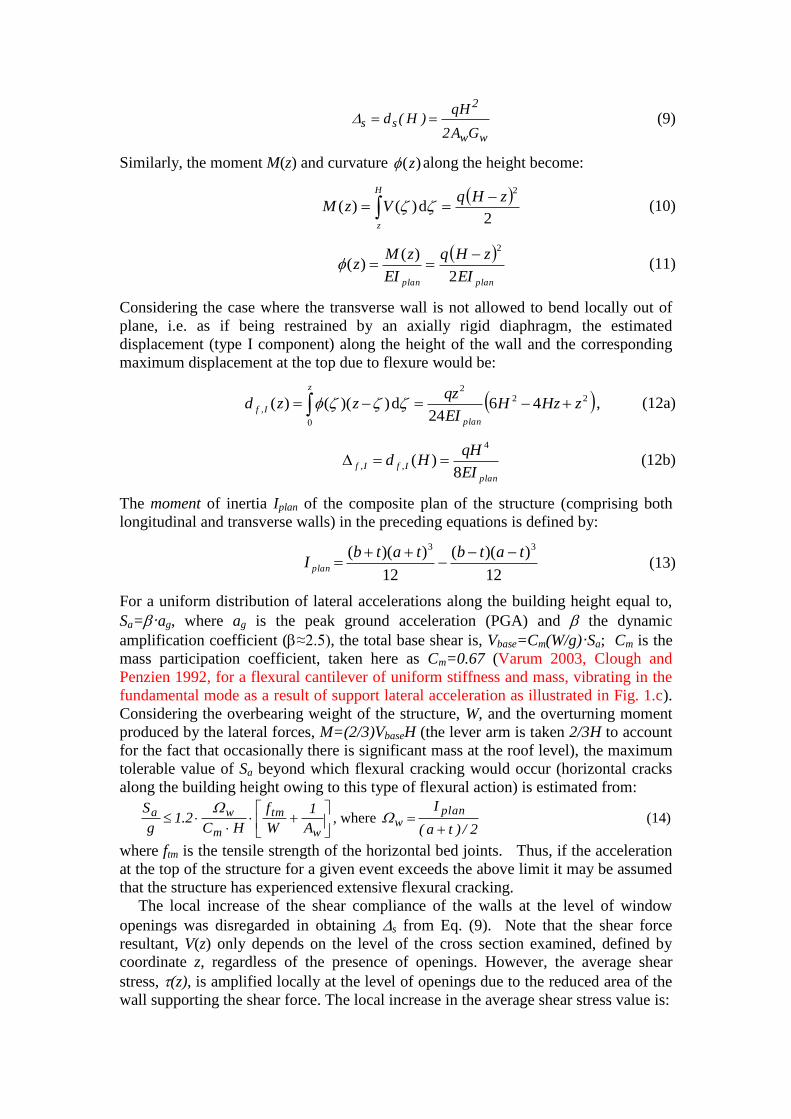
Considering the case where the transverse wall is not allowed to bend locally out of
plane, i.e. as if being restrained by an axially rigid diaphragm, the estimated
displacement (type I component) along the height of the wall and the corresponding
maximum displacement at the top due to flexure would be:
222
0
, 4624
d))(()( zHzHEI
qzzzd
plan
z
If , (12a)
plan
IfIfEI
qHHd
8)(
4
,, (12b)
The moment of inertia Iplan of the composite plan of the structure (comprising both
longitudinal and transverse walls) in the preceding equations is defined by:
12
))((
12
))(( 33 tatbtatbI plan
(13)
For a uniform distribution of lateral accelerations along the building height equal to,
Sa=·ag, where ag is the peak ground acceleration (PGA) and the dynamic
amplification coefficient (≈2.5), the total base shear is, Vbase=Cm(W/g)·Sa; Cm is the
mass participation coefficient, taken here as Cm=0.67 (Varum 2003, Clough and
Penzien 1992, for a flexural cantilever of uniform stiffness and mass, vibrating in the
fundamental mode as a result of support lateral acceleration as illustrated in Fig. 1.c).
Considering the overbearing weight of the structure, W, and the overturning moment
produced by the lateral forces, M=(2/3)VbaseH (the lever arm is taken 2/3H to account
for the fact that occasionally there is significant mass at the roof level), the maximum
tolerable value of Sa beyond which flexural cracking would occur (horizontal cracks
along the building height owing to this type of flexural action) is estimated from:
w
tm
m
wa
A
1
W
f
HC2.1
g
S , where
2/)ta(
I planw
(14)
where ftm is the tensile strength of the horizontal bed joints. Thus, if the acceleration
at the top of the structure for a given event exceeds the above limit it may be assumed
that the structure has experienced extensive flexural cracking.
The local increase of the shear compliance of the walls at the level of window
openings was disregarded in obtaining s from Eq. (9). Note that the shear force
resultant, V(z) only depends on the level of the cross section examined, defined by
coordinate z, regardless of the presence of openings. However, the average shear
stress, (z), is amplified locally at the level of openings due to the reduced area of the
wall supporting the shear force. The local increase in the average shear stress value is:
],[1
)()(
)1(
)()( 21 zzz
p
p
A
zV
A
zV
Ap
zVz
o
o
wwwo
add
(14)
where po is the percentage of the wall plan area Aw (including both longitudinal and
transverse walls) occupied by the openings and z1, z2 are the lower and upper levels of
the opening respectively. The corresponding additional shear strain occurring between
levels z1 and z2 is,
],[,1
)(
1
)()( 21, zzz
p
p
GA
zHq
p
p
GA
zVz
o
o
wwo
o
ww
adds
(15)
which causes an increase in horizontal displacement at every level z ≥ z1:
],[ if ,5.0
1
],[ if ,5.01
d)()(
2112
2111
,,
1 HzzzzHzzpGA
qp
zzzzzHzzpGA
qp
zd
oww
o
oww
o
z
z
addsadds (16)
The added displacement at the top now becomes
1212,, 5.01
)( zzHzzpGA
qpHd
oww
oaddsadds
(17)
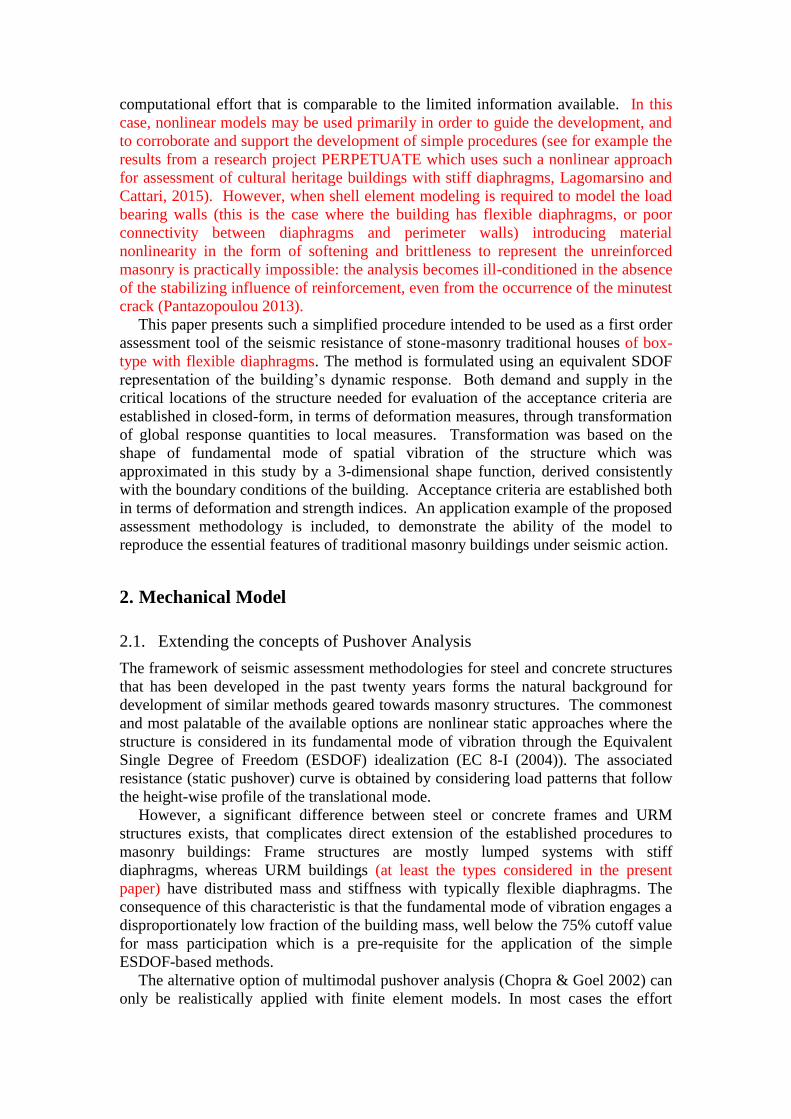
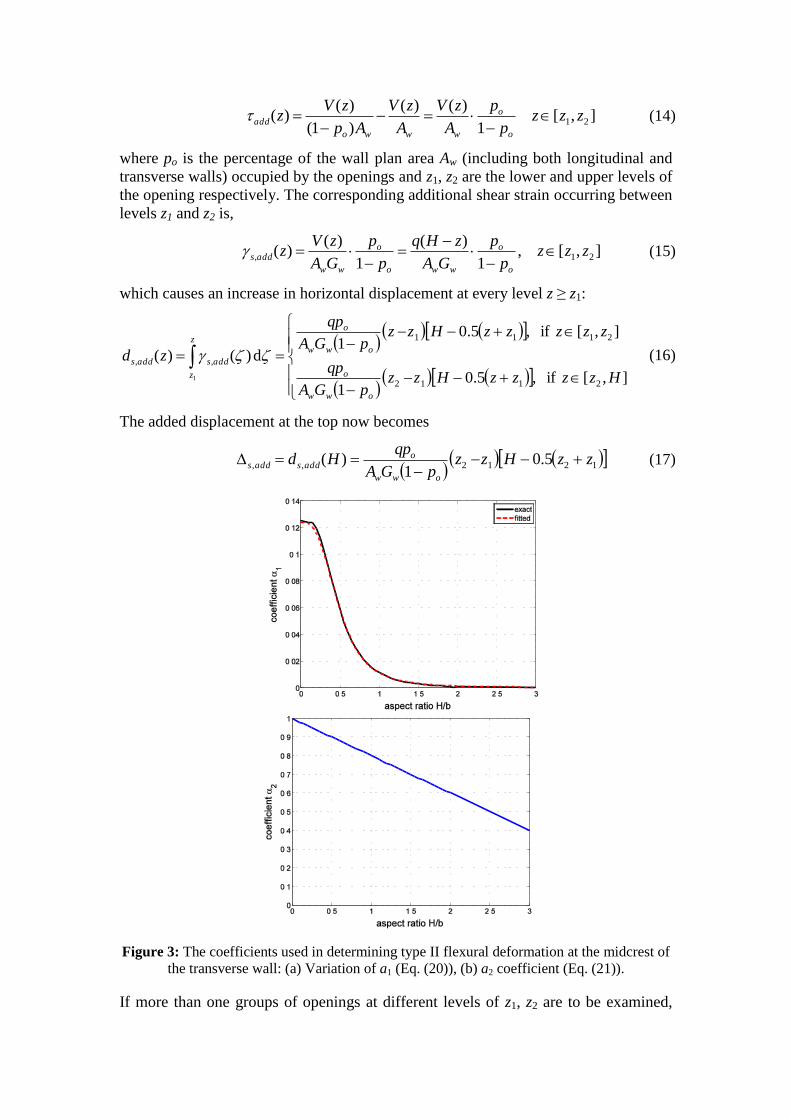
Figure 3: The coefficients used in determining type II flexural deformation at the midcrest of
the transverse wall: (a) Variation of a1 (Eq. (20)), (b) a2 coefficient (Eq. (21)).
If more than one groups of openings at different levels of z1, z2 are to be examined,
further Δs,add terms will need to be added, one for each group.
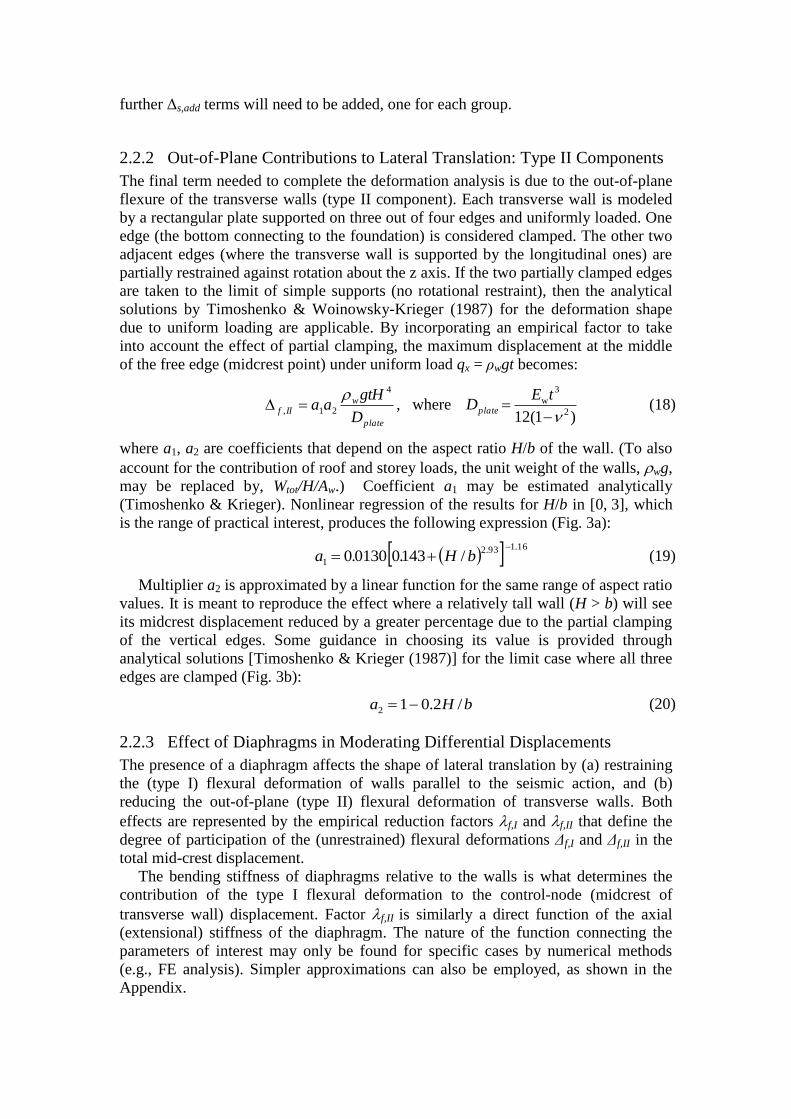
2.2.2 Out-of-Plane Contributions to Lateral Translation: Type II Components
The final term needed to complete the deformation analysis is due to the out-of-plane
flexure of the transverse walls (type II component). Each transverse wall is modeled
by a rectangular plate supported on three out of four edges and uniformly loaded. One
edge (the bottom connecting to the foundation) is considered clamped. The other two
adjacent edges (where the transverse wall is supported by the longitudinal ones) are
partially restrained against rotation about the z axis. If the two partially clamped edges
are taken to the limit of simple supports (no rotational restraint), then the analytical
solutions by Timoshenko & Woinowsky-Krieger (1987) for the deformation shape
due to uniform loading are applicable. By incorporating an empirical factor to take
into account the effect of partial clamping, the maximum displacement at the middle
of the free edge (midcrest point) under uniform load qx = ρwgt becomes:
plate
wIIf
D
gtHaa
4
21,
, where
)1(12 2
3
w
tEDplate (18)
where a1, a2 are coefficients that depend on the aspect ratio H/b of the wall. (To also
account for the contribution of roof and storey loads, the unit weight of the walls, wg,
may be replaced by, Wtot/H/Aw.) Coefficient a1 may be estimated analytically
(Timoshenko & Krieger). Nonlinear regression of the results for H/b in [0, 3], which
is the range of practical interest, produces the following expression (Fig. 3a):
16.1932
1 /143001300
.
bH..a (19)
Multiplier a2 is approximated by a linear function for the same range of aspect ratio
values. It is meant to reproduce the effect where a relatively tall wall (H > b) will see
its midcrest displacement reduced by a greater percentage due to the partial clamping
of the vertical edges. Some guidance in choosing its value is provided through
analytical solutions [Timoshenko & Krieger (1987)] for the limit case where all three
edges are clamped (Fig. 3b):
bHa /2.012 (20)
2.2.3 Effect of Diaphragms in Moderating Differential Displacements
The presence of a diaphragm affects the shape of lateral translation by (a) restraining
the (type I) flexural deformation of walls parallel to the seismic action, and (b)
reducing the out-of-plane (type II) flexural deformation of transverse walls. Both
effects are represented by the empirical reduction factors f,I and f,II that define the
degree of participation of the (unrestrained) flexural deformations Δf,I and Δf,II in the
total mid-crest displacement.
The bending stiffness of diaphragms relative to the walls is what determines the
contribution of the type I flexural deformation to the control-node (midcrest of
transverse wall) displacement. Factor f,II is similarly a direct function of the axial
(extensional) stiffness of the diaphragm. The nature of the function connecting the
parameters of interest may only be found for specific cases by numerical methods
(e.g., FE analysis). Simpler approximations can also be employed, as shown in the
Appendix.
2.3 Total Displacement at Mid-Crest and Translational Mode Shape
The peak lateral displacement is expected to occur at the mid-crest of the transverse
wall owing to the local amplification effected by the out-of-plane bending of
transverse walls unsupported at the crest. Type I displacements prescribe the
translation, in the direction of the earthquake, of the walls parallel to the load and
thus, of the corner supports of the transverse walls. They comprise the shear
deformation of the walls with their openings and the flexural deformation of type I:
IfIfaddssI ,,, (21)
The transverse walls displace out-of-plane (type II deformation) in the direction of the
earthquake. The additional deflection at mid-span relative to their corner supports is:
IIfIIfII ,, (22)
The total mid-crest displacement becomes:
IIfIIfIfIfaddssIIItot ,,,,, (23)
The contribution of each component of deformation to the shape of lateral translation
of the entire structure is obtained by normalizing the terms of the above equation with
the total displacement at mid-crest, Δtot.: the resulting normalized displacement
pattern at that point assumes the value of 1.0 and thus, the associated point may serve
as the control node in determining the performance point on the pushover curve of the
structure, from an ESDOF type analysis (ATC 41/06 (2007), EC8-I (2004)). For each
mechanism of deformation the following participation factors in the final shape are
defined:
tot
IIfIf
If
tot
adds
adds
tot
ss
tot
IIfIIf
IIfII
tot
II
,,
,
,
,
,,
, ;;;;
(24)
so that 1)( ,,, IIfIfaddssIII . Each participation factor is used to
scale the respective deformation functions in the total translational shape of peak
response. For type I components the functional forms are defined from Eqs. (8), (12)
and (17), as follows:
22
4
2
,
,
,
,2
,,
463
)()2(
)()()()(
zHzHH
z
l
zd
H
zHz
zzzz
If
adds
adds
addss
IfaddssI
(25)
Note that the last two terms in the right hand side of Eq. (26) are typically dwarfed
by the shear deformation of the wall without openings. To further simplify this
approximation, these two terms are lumped into the first (shear deformation
component) by replacing the participation coefficient s with I in Eq. 25.
2
)2()(
H
zHzz II
(26)
While the neglected contributions may be important locally, amplifying point-wise the
values of strains and curvatures, they are insignificant in estimating the global ESDOF
properties: Typically, δs will account for more than 80% of the total type I
deformation. Thus, Eq. (27) is ideal for practical estimation of the ESDOF system
period and participation factor, whereas Eq. (26) may be used to obtain local
deformation demands.
The type II flexural shape of the wall is a complicated function, which is
represented only in an approximate way. Thus, at any given distance from the base, z,
relative outwards displacements across the width of the building, b, follow a function
that ranges between a sine and a cosine shape, depending on the value of a constant, c:
2/)1(where,
sin1
sin/sin)(,
cp
p
ppbycy c
c
ccIIf (27)
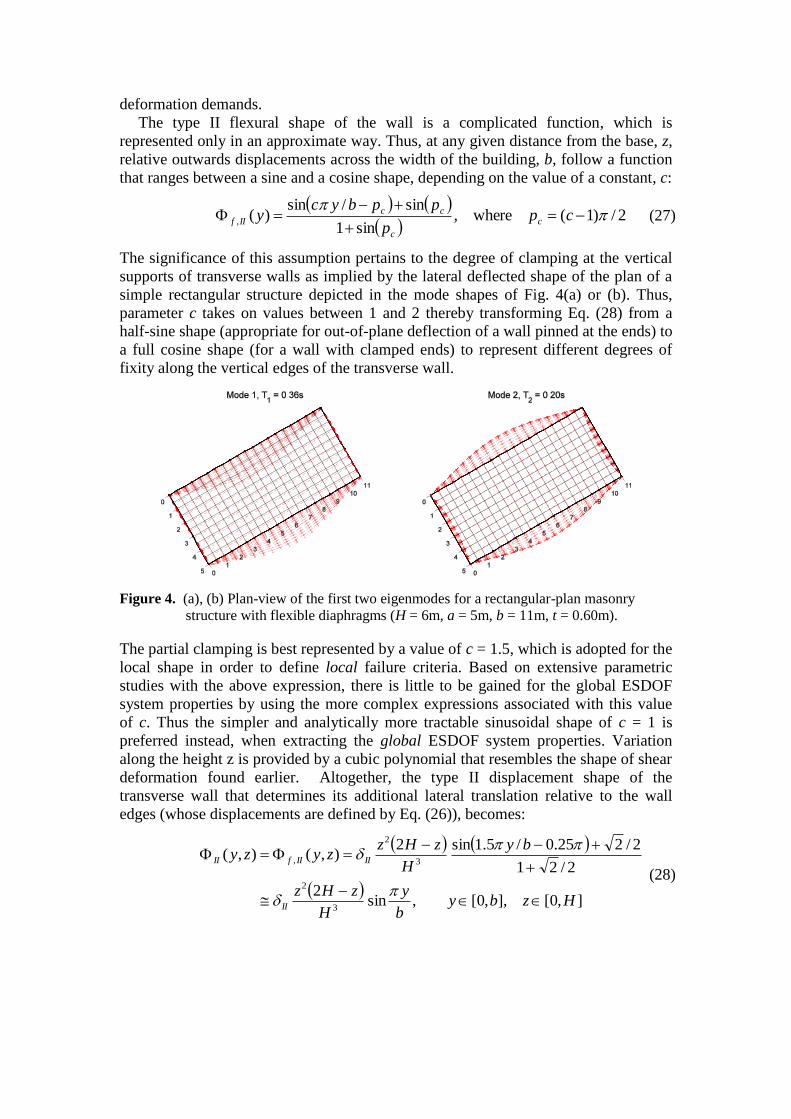
The significance of this assumption pertains to the degree of clamping at the vertical
supports of transverse walls as implied by the lateral deflected shape of the plan of a
simple rectangular structure depicted in the mode shapes of Fig. 4(a) or (b). Thus,
parameter c takes on values between 1 and 2 thereby transforming Eq. (28) from a
half-sine shape (appropriate for out-of-plane deflection of a wall pinned at the ends) to
a full cosine shape (for a wall with clamped ends) to represent different degrees of
fixity along the vertical edges of the transverse wall.
Figure 4. (a), (b) Plan-view of the first two eigenmodes for a rectangular-plan masonry
structure with flexible diaphragms (H = 6m, a = 5m, b = 11m, t = 0.60m).
The partial clamping is best represented by a value of c = 1.5, which is adopted for the
local shape in order to define local failure criteria. Based on extensive parametric
studies with the above expression, there is little to be gained for the global ESDOF
system properties by using the more complex expressions associated with this value
of c. Thus the simpler and analytically more tractable sinusoidal shape of c = 1 is
preferred instead, when extracting the global ESDOF system properties. Variation
along the height z is provided by a cubic polynomial that resembles the shape of shear
deformation found earlier. Altogether, the type II displacement shape of the
transverse wall that determines its additional lateral translation relative to the wall
edges (whose displacements are defined by Eq. (26)), becomes:
],0[],,0[,sin
2
2/21
2/225.0/5.1sin2),(),(
3
2
3
2
,
Hzbyb
y
H
zHz
by
H
zHzzyzy
II
IIIIfII
(28)
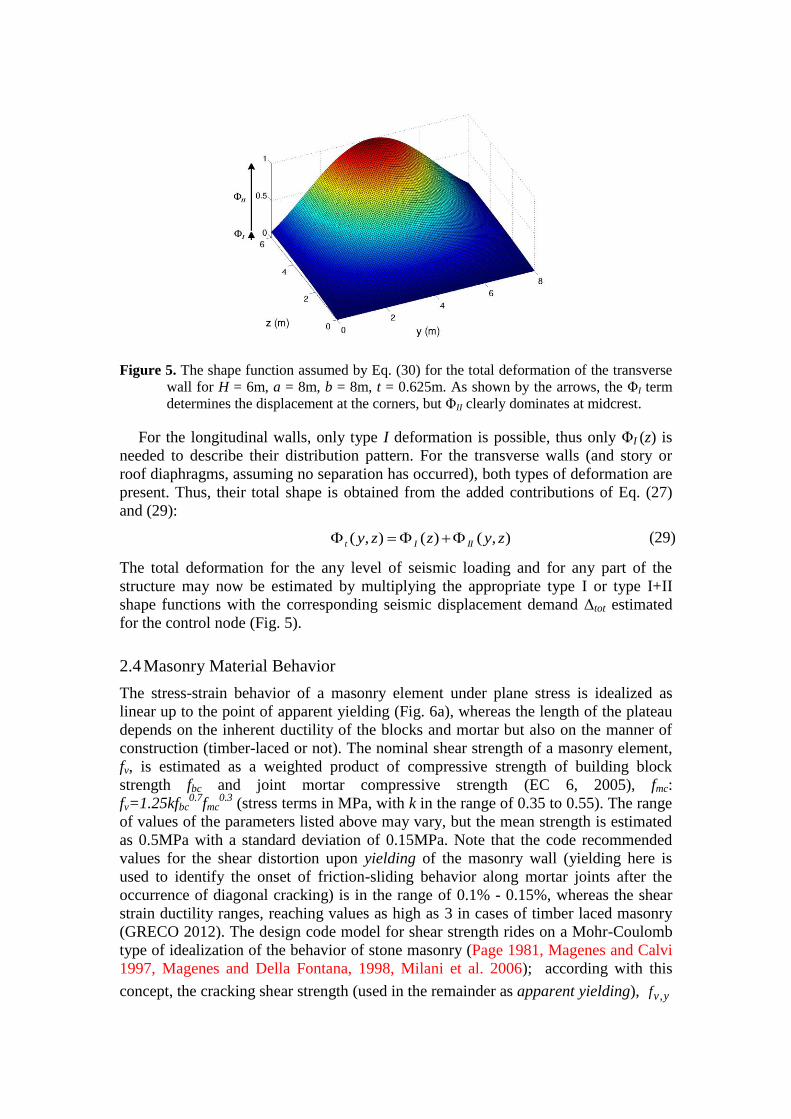
Figure 5. The shape function assumed by Eq. (30) for the total deformation of the transverse
wall for H = 6m, a = 8m, b = 8m, t = 0.625m. As shown by the arrows, the ΦI term
determines the displacement at the corners, but ΦII clearly dominates at midcrest.
For the longitudinal walls, only type I deformation is possible, thus only ΦI (z) is
needed to describe their distribution pattern. For the transverse walls (and story or
roof diaphragms, assuming no separation has occurred), both types of deformation are
present. Thus, their total shape is obtained from the added contributions of Eq. (27)
and (29):
),()(),( zyzzy IIIt (29)
The total deformation for the any level of seismic loading and for any part of the
structure may now be estimated by multiplying the appropriate type I or type I+II
shape functions with the corresponding seismic displacement demand Δtot estimated
for the control node (Fig. 5).
2.4 Masonry Material Behavior
The stress-strain behavior of a masonry element under plane stress is idealized as
linear up to the point of apparent yielding (Fig. 6a), whereas the length of the plateau
depends on the inherent ductility of the blocks and mortar but also on the manner of
construction (timber-laced or not). The nominal shear strength of a masonry element,
fv, is estimated as a weighted product of compressive strength of building block
strength fbc and joint mortar compressive strength (EC 6, 2005), fmc:
fv=1.25kfbc0.7
fmc0.3
(stress terms in MPa, with k in the range of 0.35 to 0.55). The range
of values of the parameters listed above may vary, but the mean strength is estimated
as 0.5MPa with a standard deviation of 0.15MPa. Note that the code recommended
values for the shear distortion upon yielding of the masonry wall (yielding here is
used to identify the onset of friction-sliding behavior along mortar joints after the
occurrence of diagonal cracking) is in the range of 0.1% - 0.15%, whereas the shear
strain ductility ranges, reaching values as high as 3 in cases of timber laced masonry
(GRECO 2012). The design code model for shear strength rides on a Mohr-Coulomb
type of idealization of the behavior of stone masonry (Page 1981, Magenes and Calvi
1997, Magenes and Della Fontana, 1998, Milani et al. 2006); according with this
concept, the cracking shear strength (used in the remainder as apparent yielding), y,vf
, of unreinforced masonry is expressed in terms of the inherent stone-binder cohesion,
σz is the normal compressive stress clamping the potential sliding plane, and μ is the
apparent frictional coefficient.
zby,v cf (30)
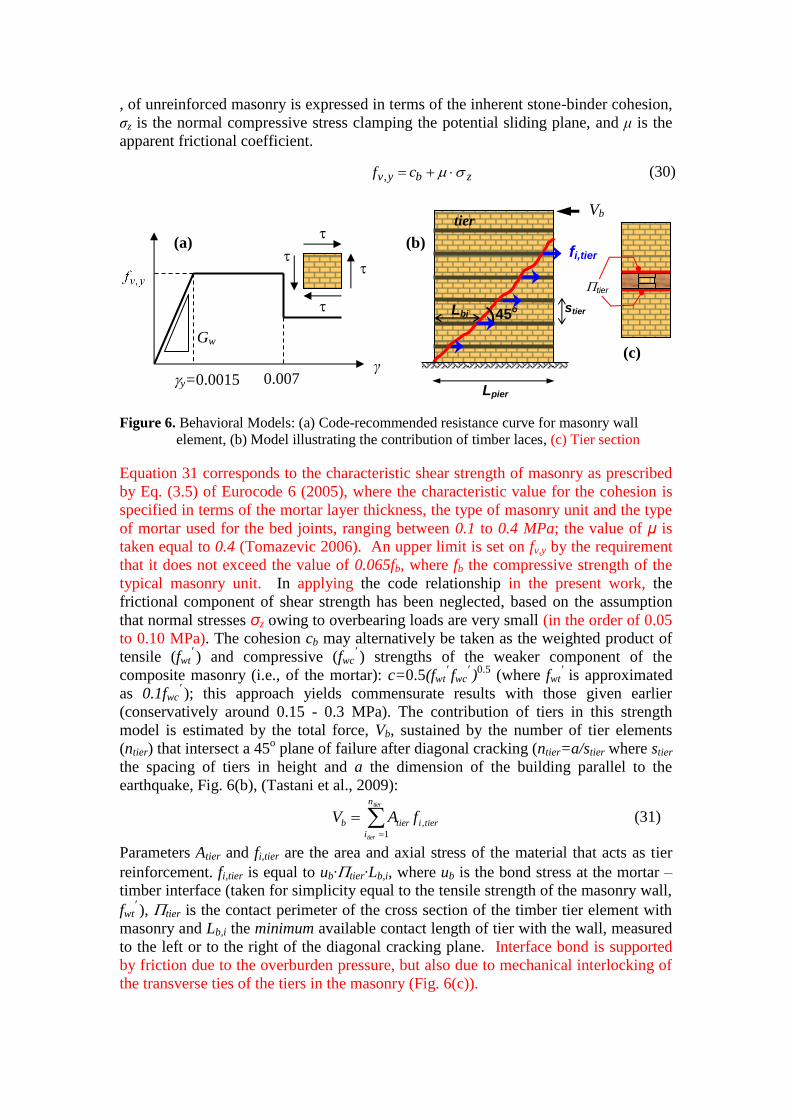
Figure 6. Behavioral Models: (a) Code-recommended resistance curve for masonry wall
element, (b) Model illustrating the contribution of timber laces, (c) Tier section
Equation 31 corresponds to the characteristic shear strength of masonry as prescribed
by Eq. (3.5) of Eurocode 6 (2005), where the characteristic value for the cohesion is
specified in terms of the mortar layer thickness, the type of masonry unit and the type
of mortar used for the bed joints, ranging between 0.1 to 0.4 MPa; the value of μ is
taken equal to 0.4 (Tomazevic 2006). An upper limit is set on fv,y by the requirement
that it does not exceed the value of 0.065fb, where fb the compressive strength of the
typical masonry unit. In applying the code relationship in the present work, the
frictional component of shear strength has been neglected, based on the assumption
that normal stresses σz owing to overbearing loads are very small (in the order of 0.05
to 0.10 MPa). The cohesion cb may alternatively be taken as the weighted product of
tensile (fwt′ ) and compressive (fwc
′ ) strengths of the weaker component of the
composite masonry (i.e., of the mortar): c=0.5(fwt′ fwc
′ )0.5
(where fwt′ is approximated
as 0.1fwc′ ); this approach yields commensurate results with those given earlier
(conservatively around 0.15 - 0.3 MPa). The contribution of tiers in this strength
model is estimated by the total force, Vb, sustained by the number of tier elements
(ntier) that intersect a 45o plane of failure after diagonal cracking (ntier=a/stier where stier
the spacing of tiers in height and a the dimension of the building parallel to the
earthquake, Fig. 6(b), (Tastani et al., 2009):
tier
tier
n
i
tieritierb fAV1
, (31)
Parameters Atier and fi,tier are the area and axial stress of the material that acts as tier
reinforcement. fi,tier is equal to ub∙tier∙Lb,i, where ub is the bond stress at the mortar –
timber interface (taken for simplicity equal to the tensile strength of the masonry wall,
fwt′ ), tier is the contact perimeter of the cross section of the timber tier element with
masonry and Lb,i the minimum available contact length of tier with the wall, measured
to the left or to the right of the diagonal cracking plane. Interface bond is supported
by friction due to the overburden pressure, but also due to mechanical interlocking of
the transverse ties of the tiers in the masonry (Fig. 6(c)).
stier
fi,tier
45ο
tier Vb
tier
Lbi
Lpier
Gw
y=0.0015 0.007
γ
(a) (b)
(c)
2.5 Basic ESDOF system parameters for simple box-type buildings
Deriving the properties of the associated equivalent, or generalized single degree of
freedom system (ESDOF) that represents the overall building behavior in spectral
coordinates has been the motivating objective for this paper. Thus, the definition of
the shape of lateral translation was a necessary intermediate step in the process of
estimation of the essential dynamic properties of the ESDOF, namely, the associated
mass (mobilized by the response shape), period, excitation coefficient and the
corresponding mass participation factor.
The total mass of the system may be found as the sum of the wall masses, the roof
mass mrf and any gravity and service loads present on the Nst building floors (Nst = 1
for a 2-story building). With reference to the building plan of Fig. 2, having a wall
mass density ρw, and typical floor mass mst (comprising a distributed mass of ρrf and
ρst per unit area of roof and floor, respectively, and a live load of q), the total system
mass becomes:
ststrfwtot mNmmm (32)
where, )tb)(ta(g/q.m );tb)(ta(m ;H)ba(tm ststrfrfww 302 .
The generalized mass of the ESDOF is obtained using the translational shape of
vibration as follows (Clough and Penzien 1976):
stN
j
b
j
II
jH b
IIwI
H
w
t
yH
yb
mzyzytzzta
yzzyzymm
1 0
2
0 0
22
0
2
d,dd),(2d)(2
dd),(),(
(33a)
where Η/κj represents the z coordinate where diaphragm j (or equivalently mass mj) is
located. Thus, by analytic integration:
N
j j
II
j
IIII
j
j
j
IIIIIIw
Iw
m
bHtaHtm
12
22
2
2
222
2
412
29308
11210515
16
(34b)
For example, for a typical two story house, where the mid-story is located at mid-
height (at H/2) using m1=mst, κ1=2 and m2=mrf, κ2=1 simplifies the above expression
to:
2222
222
8
12
16
9
2
14
29308
11210515
16
IIIIIIstIIIIIIrf
IIIIIIw
Iw
mm
bHtaHtm
(34c)
The generalized stiffness of the ESDOF system is estimated following the same
concept (Clough and Penzien 1976); the integration is simplified significantly if
Poisson effects in plate bending are neglected:
3
42
3
2II
3w
2Iw
H
0
b
0
2
2II
2
2II
23
w
H
0
2I
w
b1260
H29
Hb45H3
btEtG
H3
a8
zdydz
)z,y(
y
)z,y(
12
tE2zd
zd
)z(dta2GK
(34)
where yy
v,ww /fG is the elastic slope of the shear force – shear strain diagram of
masonry (units of stress). For example, the average shear stress-strain behavior for
common stone masonry walls (without tiers) adopted by Eurocode 8-III (2005) is
depicted in Fig. 6(a). The associated period of the system is calculated from:
K
mT 2 (35)
The earthquake excitation factor, Le representing the degree to which the assumed
shape of translation is excited by the ground motion is defined by:
st
st
N
j j
III
j
j
jIIwIw
N
j
b
j
II
jH b
IIwI
H
w
te
mbHtbaHt
yH
yb
mzyzytzzta
yzzyzymL
12
1 00 00
212
3
5
3
4
d,dd),(2d)(2
dd),(),(
(36)
For the special case of the two story house examined previously:
II
IstII
IrfIIwIwe mmbHtbaHtL4
32
3
5
3
4 (37)
Furthermore, the effective mass mobilized by the deflected shape, m* and the
associated participation factor Γ may now be estimated as (Clough and Penzien,
1976):
m
L*m,
m
L2
ee (38)
Based on the above calculations, the generalized effective mass for the translational
shape considered is found to be in the order of 45-65% depending on the building
dimensions; its magnitude underlines the fundamental difference between lumped
systems (where the usual value is well over 75% of total mass) from the distributed
mass systems such as the one examined herein. The larger the values of a and H are,
as compared to b, the higher the effective mass. Since the critical direction of ground
excitation for a rectangular building is when it strikes orthogonal to the longer wall, it
may be said that in general ab , thus, the effective mass will generally be low. Still,
the proposed displacement pattern actually represents a much higher percentage of the
system’s response, as the next significant mode has practically the same period, only
the out-of-plane walls bend in opposite directions (as illustrated in Fig. 4). Thus, the
proposed shape sufficiently assesses the system behavior and it enables rapid
transformation from global to localized seismic demands, and relatively accurate
calculations on the seismic vulnerability of a large group of similar buildings. Note
that the above expressions can be easily modified to incorporate additional structural
components contributing to the mass and stiffness of the structure. For example,
interior walls oriented in the direction of the earthquake contribute to mass and
stiffness while reducing the unsupported length of transverse walls (their contribution
is added on to that of the parallel exterior walls by increasing proportionately the
equivalent wall thickness and subdividing the transverse span to b/2 in both the mass
and stiffness calculations). Interior walls oriented orthogonal to the earthquake
contribute to the mass in the same manner as the other transverse walls (i.e., their
contribution is accounted for by increasing proportionately the equivalent transverse
wall thickness in the mass equations only).
2.6 Performance Evaluation via Nonlinear Static Procedures
The seismic performance of the masonry structure may be evaluated using any
nonlinear static procedure, e.g. as specified in EC8-I [2005].The corresponding
control node displacement Dtarget is,
)(4
)( 12
2
1target TSCT
TSCD da
(39)
using either the associated demand in spectral acceleration Sa(T) or spectral
displacement Sd(T) at period T. C1 is the inelastic displacement ratio at a strength
reduction factor of q (or R), defined as C1= μd /R, where μd is the ductility demand and
y,base
a*
V
)T(SmqR
(40)
where Vbase,y is the yield base shear (see following section). Expressions for C1 are
widely available in the literature, e.g., C1 = 0.5 (R2+1)/R for short-periods according to
Veletsos and Newmark (Chopra 1995). The displacement demand throughout the
structure is obtained from Dtarget· Φt (x,y,z); spatial derivatives of this result provide
the local deformation demands (shear distortion angles, relative drift ratios, curvature
of walls in out-of-plane bending). In the following sections these values are then
compared with the corresponding deformation capacities to assess the potential for
failure.
2.7 Capacity curve definition
The response of the structure to a constant horizontal acceleration (pushover load for
distributed parameter systems) is idealized by an elastic perfectly plastic capacity
curve that terminates at a displacement capacity of u (blue line in Fig. 7). Thus, only
two points of base shear versus roof drift are needed to define the structural behavior,
namely nominal yield and ultimate failure. Obviously, several aspects of masonry
behaviour are neglected, e.g., the influence of cracking development that introduces a
gradual reduction of stiffness in the ascending branch up to yield, and any residual
strength that may be available after the ultimate displacement is reached (red curve in
Fig. 7). Still, the above assumptions are considered acceptable in view of the
considerable uncertainty surrounding masonry.
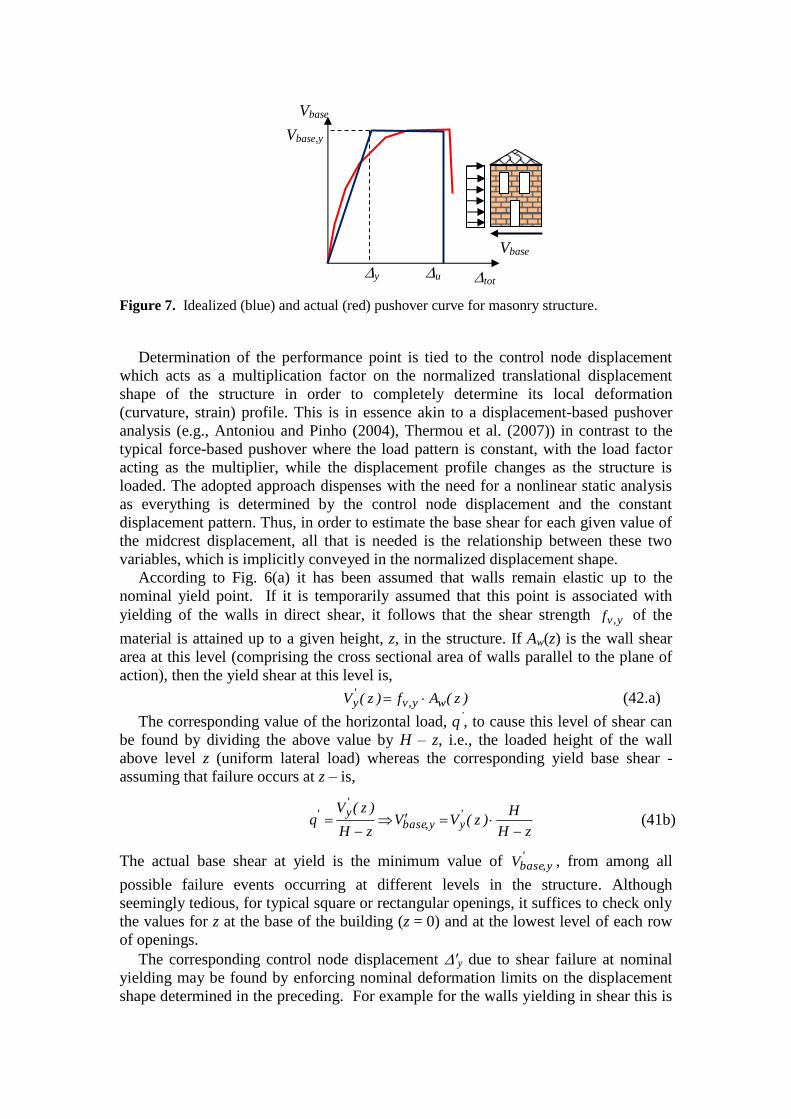
Figure 7. Idealized (blue) and actual (red) pushover curve for masonry structure.
Determination of the performance point is tied to the control node displacement
which acts as a multiplication factor on the normalized translational displacement
shape of the structure in order to completely determine its local deformation
(curvature, strain) profile. This is in essence akin to a displacement-based pushover
analysis (e.g., Antoniou and Pinho (2004), Thermou et al. (2007)) in contrast to the
typical force-based pushover where the load pattern is constant, with the load factor
acting as the multiplier, while the displacement profile changes as the structure is
loaded. The adopted approach dispenses with the need for a nonlinear static analysis
as everything is determined by the control node displacement and the constant
displacement pattern. Thus, in order to estimate the base shear for each given value of
the midcrest displacement, all that is needed is the relationship between these two
variables, which is implicitly conveyed in the normalized displacement shape.
According to Fig. 6(a) it has been assumed that walls remain elastic up to the
nominal yield point. If it is temporarily assumed that this point is associated with
yielding of the walls in direct shear, it follows that the shear strength y,vf of the
material is attained up to a given height, z, in the structure. If Aw(z) is the wall shear
area at this level (comprising the cross sectional area of walls parallel to the plane of
action), then the yield shear at this level is,
)z(Af)z(V wy,v'y (42.a)
The corresponding value of the horizontal load, q’, to cause this level of shear can
be found by dividing the above value by H – z, i.e., the loaded height of the wall
above level z (uniform lateral load) whereas the corresponding yield base shear -
assuming that failure occurs at z – is,
zH
H)z(VV
zH
)z(Vq '
yy,base
'y'
(41b)
The actual base shear at yield is the minimum value of 'y,baseV , from among all
possible failure events occurring at different levels in the structure. Although
seemingly tedious, for typical square or rectangular openings, it suffices to check only
the values for z at the base of the building (z = 0) and at the lowest level of each row
of openings.
The corresponding control node displacement ′y due to shear failure at nominal
yielding may be found by enforcing nominal deformation limits on the displacement
shape determined in the preceding. For example for the walls yielding in shear this is
Vbase
Vbase,y
tot y u
Vbase
the top displacement for which the displacement shape results in a critical shear strain
value equal to the milestone number of 0.0015 listed in the horizontal axis of Fig.
6(a). This establishes the baseline elastic behaviour of the structure. If subsequent
checks for “yielding” due to other mechanisms of failure (pertaining to Immediate
Occupancy criteria, e.g., cracking of the transverse walls bending out of plane at
midspan or at the corners) return a lower control node displacement, y, then the yield
base shear Vby is proportionally re-adjusted along this elastic baseline:
)z(VminV y,baseHz0y
yy,base
(42)
The ultimate displacement is determined by Life Safety or Near Collapse criteria.
Several acceptance criteria and associated limit-states may be recalled in assessing
a masonry structure even when response is considered in simple translation as is
proposed in the present study. These may be expressed in terms of force or
displacement/deformation. The objective in each case is to quantify a limiting value of
strain or curvature that may be associated with failure. This limiting value may be
related to control node displacement through the deformation shape which enables
implementation of the demand-to-capacity check. Four main failure scenarios are
presented in the following.
2.7.1 Shear failure of walls
This failure criterion is evaluated by checking the wall shear strain against the limiting
strain of γlim. For this, the shear strain components in type I deformation are
considered (being invariable with the transverse coordinate, y) by the first derivative
of the corresponding displacement shape. Thus, the shear strain at any level z per
meter of control node displacement is
adds
adds
addss
addss
sI
z
H
zH
z
zz
,
,
,2
,
,
)(2
))(()(
(43)
Typically, the additional strain produced by an opening is localized exactly at the
level of the opening (although the additional displacement it creates carries through to
the top, Eq. (26)). Thus, the sum implied above may contain only one or two terms at
each value of z, depending on the openings’ configuration. The minimum value of the
midcrest displacement γ,lim corresponding to the attainment of a critical strain value
of γlim can be estimated as:
)(max ,
lim,
zsI
lim
(44)
The highest values of shear strain occur at the ground level and at the lowest
extremity of each row of openings. Thus, the evaluation of the above equation is
much simplified.
2.7.2 Type II (out-of-plane) failure of transverse walls
In response to type-II deformation of the transverse walls, the limited tensile strength
of masonry leads to cracking and ultimately to failure. To check for this condition, the
curvatures of the transverse wall are estimated using Eq. (30):
232
22
22
225.0/5.1sin2322),(
H
by
H
zH
z
zy IIItzz
(45)
25.0/5.1sin2)22(2
9),( 2
32
2
2
2
byzHz
Hby
zy IItyy (46)
25.0/5.1cos34)22(
3),(3
2
byzHz
bHzy
zy IItzyyz (47)
The principal values of the curvatures 1, 2 may be obtained from standard
coordinate transformation:
22
2,1 )(25.0)(5.0 yzzzyyzzyy (48)
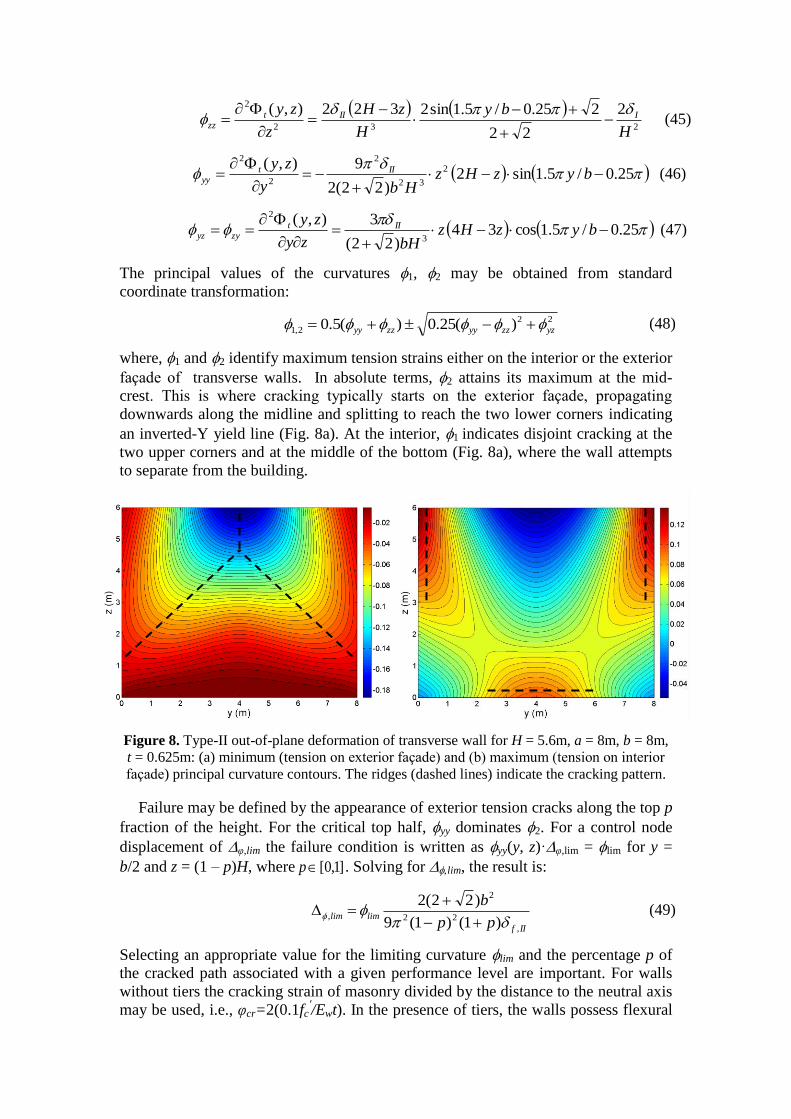
where, 1 and 2 identify maximum tension strains either on the interior or the exterior
façade of transverse walls. In absolute terms, 2 attains its maximum at the mid-
crest. This is where cracking typically starts on the exterior façade, propagating
downwards along the midline and splitting to reach the two lower corners indicating
an inverted-Y yield line (Fig. 8a). At the interior, 1 indicates disjoint cracking at the
two upper corners and at the middle of the bottom (Fig. 8a), where the wall attempts
to separate from the building.
Figure 8. Type-II out-of-plane deformation of transverse wall for H = 5.6m, a = 8m, b = 8m,
t = 0.625m: (a) minimum (tension on exterior façade) and (b) maximum (tension on interior
façade) principal curvature contours. The ridges (dashed lines) indicate the cracking pattern.
Failure may be defined by the appearance of exterior tension cracks along the top p
fraction of the height. For the critical top half, yy dominates 2. For a control node
displacement of φ,lim the failure condition is written as yy(y, z)·φ,lim = lim for y =
b/2 and z = (1 – p)H, where ]1,0[p . Solving for lim, the result is:
IIf
limlimpp
b
,
22
2
,)1()1(9
)22(2
(49)
Selecting an appropriate value for the limiting curvature lim and the percentage p of
the cracked path associated with a given performance level are important. For walls
without tiers the cracking strain of masonry divided by the distance to the neutral axis
may be used, i.e., φcr=2(0.1fc′/Ewt). In the presence of tiers, the walls possess flexural
ductility. Exceeding φcr may still result in cracking, however, actual failure is now
associated with a higher ultimate curvature φu. The influence of any openings on the
transverse wall can be accounted for by appropriately modifying p. For example, if it
is requested that p = 50% of the wall height needs to reach φlim, then the height of any
openings in the top 50% of the transverse wall (especially if close to its midline) can
be used to directly reduce the required p.
2.7.3 Type I flexural failure of walls
The type 1 flexural component of deformation may induce failure of the longitudinal
walls akin to typical beam bending. Their curvature along the vertical direction, using
the more accurate shape proposed, is:
4
2
,2
,
2
4d
)(d
H
zH
z
zIf
If
(50)
This is maximized at ground level (z=0), and equal to 4δf,I /H2. Assuming a typical
linear distribution of strain along the horizontal dimension (length a) of the
longitudinal wall and given a critical strain of εwu, it is requested that no more than a p
percentage of the wall length has exceeded it. This corresponds to a simple limit on
the length of the flexural crack that may appear in the long-wall and it is achieved at a
curvature value of εwu/(pa). As the above estimate of curvature corresponds to a unit
control node displacement, by simple analogy the limiting value of mid-crest
displacement is:
If
wu
If
wulim
pa
H
zz
pa
,
2
2
,
2,4]/d)(max[d
)/(
. (51)
2.7.4 Failure at wall corners
The absolute value of the tension force over a strip of 1m height where the
longitudinal wall is pulled apart from the transverse walls is:
zHzHby
zyIEzN tNII
y
twtNIIf
2)21(8
27),()( 2
33
,
3
0
3
3
,,
(52)
where I = t3*(1m)/12 is the moment of inertia of a 1m wide horizontal strip of the
longitudinal wall deforming out of plane (type II) and N,t is the control node
displacement when this mode of failure controls. Division by the section area of the
strip yields the axial stress that needs to be resisted to prevent cracking, starting from
the top of the building and extending down to the value of z where the limiting tensile
stress fwt is last exceeded. If the length of such a crack is required to remain less than
pH, then, setting z = H (1 − p) and solving for N,t, the value of the associated
displacement at the control node may be estimated:
wt
IIw
tN fpptE
b
)1)(1(9
)21(32232
3
,
(53)
3 Example application
The preceding sections presented a detailed derivation of the underlying mechanics
in support of the proposed simplified method of seismic assessment of simple, box-
type URM buildings. An advantage of the procedure is that the end results are given
in a closed form expression, enabling automation of the necessary calculations in
simple programmable spreadsheets. Application of the methodology is demonstrated
here on a simple unreinforced masonry model structure which was tested under
simulated ground motions on a shake table by Bothara et al. (2009). The building
model was built at a scale of 1:2. The specimen had 0.11m thick masonry walls, a
rectangular floor plan of 2.88m x 1.92m and was a two storey structure with a first
floor height of 1.34m, a second floor of 1.14m and a roof gable rising by 0.815m.
Masonry prisms were tested to obtain the actual material strengths, as follows:
fwc=16.2 MPa, wc,max=0.0035, Ew=6.1GPa, fv,y=0.93MPa (Eq. 33), fwt=0.42 MPa.
Bed joint tensile strength is taken as ftm=0.1MPa. Shear modulus of the homogenized
material Gw, was taken equal to 930MPa (the ratio of an assumed shear strength of
0.93MPa at a cracking shear distortion of 0.1%), whereas the Poisson’s ratio was
taken =0.25. The specific weight w of clay bricks (single brick) was taken 20kN/m3,
whereas for ceramic roof tiles the unit-area weight was taken r=1.5kN/m2 including
roof trusses and sheathing. Additional masses were added at the gable walls, at the
floor level and at the eaves level as follows: (a) for testing in the longitudinal direction
added mass per gable was 0.04 ton, 2.1 ton at the floor level and 2.02 ton at the eaves,
(b) for testing in the transverse direction, 2.1 ton masses at the floor level and an equal
amount at the eaves level respectively. The structure was first tested to a suite of
ground motions in the longitudinal direction scaling the ground motion records to pga
values in the range of 0.2 – 0.8g; testing was repeated by shaking the structure in the
short direction of its plan. In the beginning of the tests recorded fundamental period
values were, Tlong = 0.072 s, Tshort = 0.102 s. By the end of the tests, due to damage
accumulation these values were elongated to Tlong = 0.11 s, Tshort = 0.14 s,
respectively, i.e., an elongation by a factor of 25%. The analytical model presented
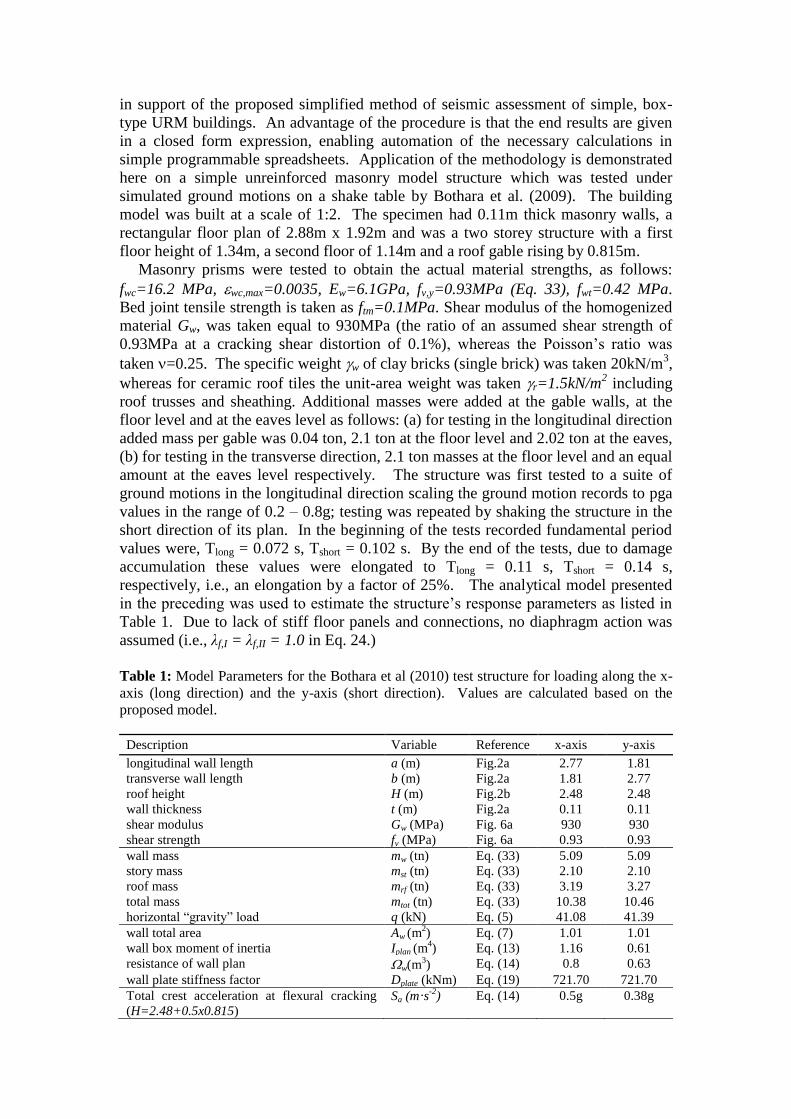
in the preceding was used to estimate the structure’s response parameters as listed in
Table 1. Due to lack of stiff floor panels and connections, no diaphragm action was
assumed (i.e., λf,I = λf,II = 1.0 in Eq. 24.)
Table 1: Model Parameters for the Bothara et al (2010) test structure for loading along the x-
axis (long direction) and the y-axis (short direction). Values are calculated based on the
proposed model.
Description Variable Reference x-axis y-axis
longitudinal wall length a (m) Fig.2a 2.77 1.81
transverse wall length b (m) Fig.2a 1.81 2.77
roof height H (m) Fig.2b 2.48 2.48
wall thickness t (m) Fig.2a 0.11 0.11
shear modulus Gw (MPa) Fig. 6a 930 930
shear strength fv (MPa) Fig. 6a 0.93 0.93
wall mass mw (tn) Eq. (33) 5.09 5.09
story mass mst (tn) Eq. (33) 2.10 2.10
roof mass mrf (tn) Eq. (33) 3.19 3.27
total mass mtot (tn) Eq. (33) 10.38 10.46
horizontal “gravity” load q (kN) Eq. (5) 41.08 41.39
wall total area Aw (m2) Eq. (7) 1.01 1.01
wall box moment of inertia Iplan (m4) Eq. (13) 1.16 0.61
resistance of wall plan w(m3) Eq. (14) 0.8 0.63
wall plate stiffness factor Dplate (kNm) Eq. (19) 721.70 721.70
Total crest acceleration at flexural cracking
(H=2.48+0.5x0.815) Sa (m·s-2
) Eq. (14) 0.5g 0.38g
shear deformation Δs (mm) Eq. (9) 0.135 0.135
flexural deformation (Type I) Δf,I (mm) Eq. (12b) 0.026 0.053
1st floor doors shear deformation Δs,add,1 (mm) Eq. (18) 0.010 0.010
1st floor windows shear deformation Δs,add,2 (mm) Eq. (18) 0.009 0.009
2nd
floor windows shear deformation Δs,add,3 (mm) Eq. (18) 0.002 0.002
flexural deformation (Type II) ΔII (mm) Eq. (19) 0.35 1.454
type 1 deformation participation δI Eq. (25) 0.345 0.127
type 2 deformation participation δΙΙ Eq. (25) 0.655 0.873
ESDOF generalized mass m (tn) Eq. (34c) 3.01 2.50
ESDOF generalized stiffness K (kN/m) Eq. (35) 39892 5386.7
ESDOF period T (sec) Eq. (36) 0.055 0.135
ESDOF earthquake excitation factor Le (tn) Eq. (38) 4.76 4.01
ESDOF effective mass ratio m*/Mtot Eq. (39) 74% 62%
ESDOF participation factor Γ Eq. (39) 1.61 1.60
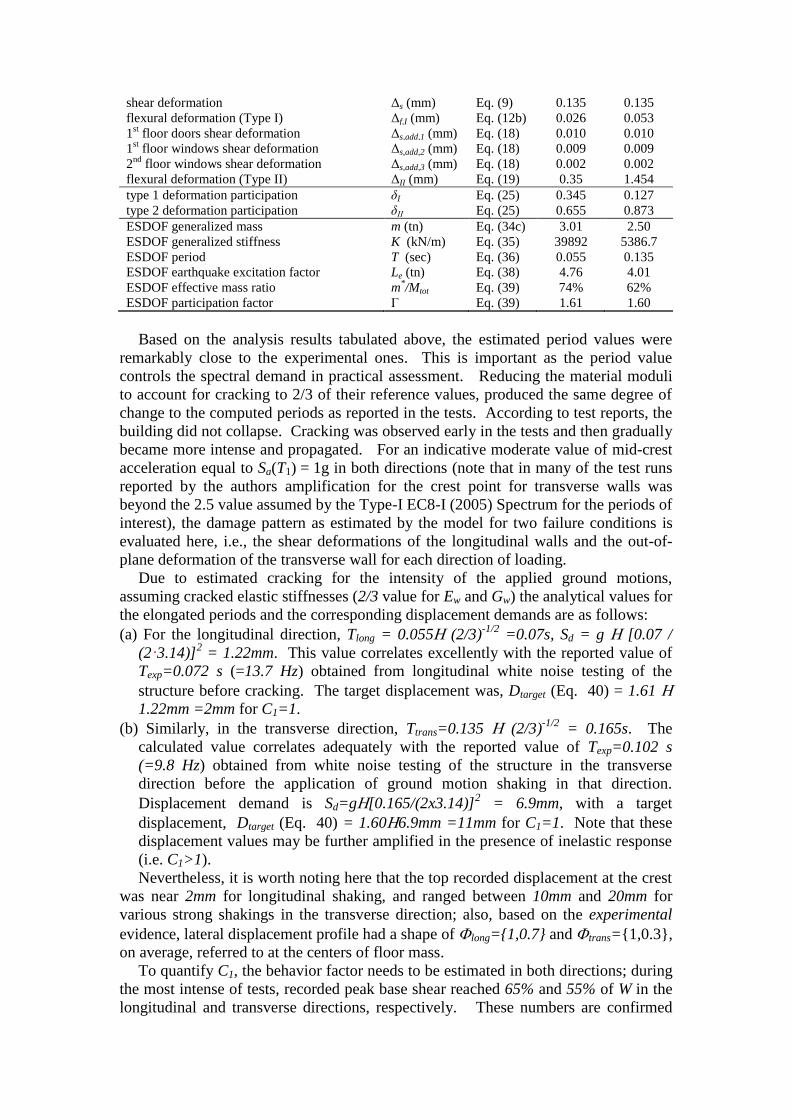
Based on the analysis results tabulated above, the estimated period values were
remarkably close to the experimental ones. This is important as the period value
controls the spectral demand in practical assessment. Reducing the material moduli
to account for cracking to 2/3 of their reference values, produced the same degree of
change to the computed periods as reported in the tests. According to test reports, the
building did not collapse. Cracking was observed early in the tests and then gradually
became more intense and propagated. For an indicative moderate value of mid-crest
acceleration equal to Sa(T1) = 1g in both directions (note that in many of the test runs
reported by the authors amplification for the crest point for transverse walls was
beyond the 2.5 value assumed by the Type-I EC8-I (2005) Spectrum for the periods of
interest), the damage pattern as estimated by the model for two failure conditions is
evaluated here, i.e., the shear deformations of the longitudinal walls and the out-of-
plane deformation of the transverse wall for each direction of loading.
Due to estimated cracking for the intensity of the applied ground motions,
assuming cracked elastic stiffnesses (2/3 value for Ew and Gw) the analytical values for
the elongated periods and the corresponding displacement demands are as follows:
(a) For the longitudinal direction, Tlong = 0.055 (2/3)-1/2
=0.07s, Sd = g [0.07 /
(2·3.14)]2 = 1.22mm. This value correlates excellently with the reported value of
Texp=0.072 s (=13.7 Hz) obtained from longitudinal white noise testing of the
structure before cracking. The target displacement was, Dtarget (Eq. 40) = 1.61
1.22mm =2mm for C1=1.
(b) Similarly, in the transverse direction, Ttrans=0.135 (2/3)-1/2
= 0.165s. The
calculated value correlates adequately with the reported value of Texp=0.102 s
(=9.8 Hz) obtained from white noise testing of the structure in the transverse
direction before the application of ground motion shaking in that direction.
Displacement demand is Sd=g[0.165/(2x3.14)]2 = 6.9mm, with a target
displacement, Dtarget (Eq. 40) = 1.606.9mm =11mm for C1=1. Note that these
displacement values may be further amplified in the presence of inelastic response
(i.e. C1>1).
Nevertheless, it is worth noting here that the top recorded displacement at the crest
was near 2mm for longitudinal shaking, and ranged between 10mm and 20mm for
various strong shakings in the transverse direction; also, based on the experimental
evidence, lateral displacement profile had a shape of long={1,0.7} and trans={1,0.3},
on average, referred to at the centers of floor mass.
To quantify C1, the behavior factor needs to be estimated in both directions; during
the most intense of tests, recorded peak base shear reached 65% and 55% of W in the
longitudinal and transverse directions, respectively. These numbers are confirmed
from the analytical results of Eq. (41) for the total acceleration levels considered,
when the effective participating mass is substituted from the results of Table 1:
Vbaselong
=m*·Sa = 74%mtot·1g =0.74W, and Vbasetrans
=m*·Sa=62%mtot·1g = 0.62W;
(W=104 kN based on the mtot value of Table 1).
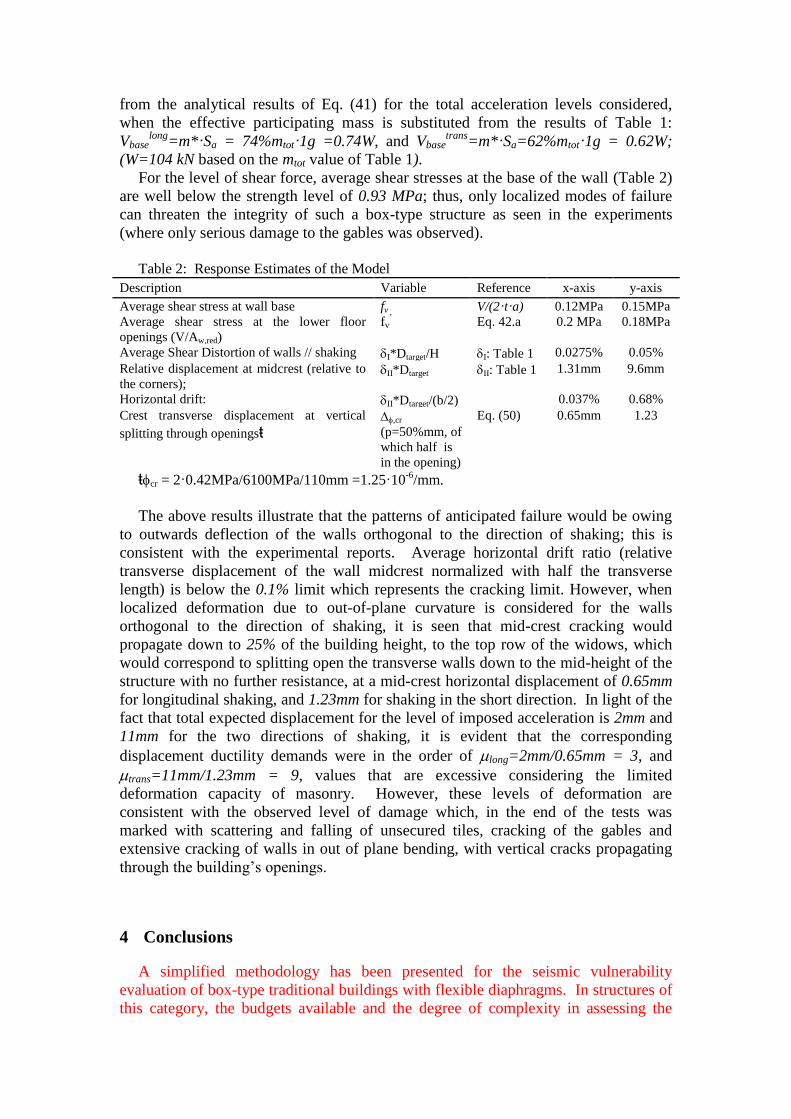
For the level of shear force, average shear stresses at the base of the wall (Table 2)
are well below the strength level of 0.93 MPa; thus, only localized modes of failure
can threaten the integrity of such a box-type structure as seen in the experiments
(where only serious damage to the gables was observed).
Table 2: Response Estimates of the Model
Description Variable Reference x-axis y-axis
Average shear stress at wall base fv V/(2·t·a) 0.12MPa 0.15MPa
Average shear stress at the lower floor
openings (V/Aw,red)
fv’ Eq. 42.a 0.2 MPa 0.18MPa
Average Shear Distortion of walls // shaking I*Dtarget/H I: Table 1 0.0275% 0.05%
Relative displacement at midcrest (relative to
the corners); II*Dtarget II: Table 1 1.31mm 9.6mm
Horizontal drift: II*Dtarget/(b/2) 0.037% 0.68%
Crest transverse displacement at vertical
splitting through openingsŧ ,cr
(p=50%mm, of
which half is
in the opening)
Eq. (50) 0.65mm 1.23
ŧcr = 2·0.42MPa/6100MPa/110mm =1.25·10-6
/mm.
The above results illustrate that the patterns of anticipated failure would be owing
to outwards deflection of the walls orthogonal to the direction of shaking; this is
consistent with the experimental reports. Average horizontal drift ratio (relative
transverse displacement of the wall midcrest normalized with half the transverse
length) is below the 0.1% limit which represents the cracking limit. However, when
localized deformation due to out-of-plane curvature is considered for the walls
orthogonal to the direction of shaking, it is seen that mid-crest cracking would
propagate down to 25% of the building height, to the top row of the widows, which
would correspond to splitting open the transverse walls down to the mid-height of the
structure with no further resistance, at a mid-crest horizontal displacement of 0.65mm
for longitudinal shaking, and 1.23mm for shaking in the short direction. In light of the
fact that total expected displacement for the level of imposed acceleration is 2mm and
11mm for the two directions of shaking, it is evident that the corresponding
displacement ductility demands were in the order of long=2mm/0.65mm = 3, and
trans=11mm/1.23mm = 9, values that are excessive considering the limited
deformation capacity of masonry. However, these levels of deformation are
consistent with the observed level of damage which, in the end of the tests was
marked with scattering and falling of unsecured tiles, cracking of the gables and
extensive cracking of walls in out of plane bending, with vertical cracks propagating
through the building’s openings.
4 Conclusions
A simplified methodology has been presented for the seismic vulnerability
evaluation of box-type traditional buildings with flexible diaphragms. In structures of
this category, the budgets available and the degree of complexity in assessing the
seismic demands and capacities can be disproportionately complex than the level of
knowledge and uncertainty surrounding their condition and properties. The simple
model developed in the present paper may serve as a tool for rapid assessment of a
single building, but also for collective vulnerability evaluation of clusters of such
traditional buildings located in historical settlements. The model reproduces the
global vibration characteristics while also employing a local deformation shape to
allow estimating typical local failures. For the sake of completeness, the detailed
derivation of the underlying mechanics in support of the proposed simplified method
was presented in the paper. Of the total number of analytical expressions, those that
are needed for seismic assessment of simple, box-type URM buildings are listed in the
example case of Table 2. In all cases, no complex structural analysis is needed.
An advantage of the procedure is that the end results are given in closed form
expressions, enabling automation of the necessary calculations in simple
programmable spreadsheets. A disadvantage is that the assumptions made, in order to
simplify the procedures, restrict the applicability of the shape-function used for
derivation of the ESDOF properties to simple box-type buildings with rectangular
floor plan and flexible floor diaphragms. Although internal dividing walls may be
easily incorporated, application of the model to irregular structures is not
recommended. In these cases a detailed linear elastic F.E. analysis under a
gravitational field in the direction of earthquake action may be a more appropriate
way to estimate a shape of lateral translation for the building (Pardalopoulos et al.
(2013)). Similarly, if stiff diaphragms are present, further simplifications may be
possible such as the equivalent frame method (Lagomarsino 2009).
Application of the procedure to an example URM structure with a rectangular floor
plan and flexible diaphragms was included in the paper. A scaled model of the
structure had been tested on a shake table to a variety of excitations in the primary and
secondary directions of its floor plan. To illustrate the simplicity of calculation
possible through the model, the results from essential calculations needed to estimate
translational period, displacement demand, base-shear demand, shear-strength
estimates and localized capacities are also listed. It is shown that the proposed
procedure estimated with very good accuracy the translational periods of the structure
in both directions of action, the magnitude of the demands, the pattern of lateral
displacement distribution and the tendency for out of plane damage. The
requirements for a benchmark presentation of the derivation did not allow for further
expansion into the parametric sensitivities of the model; however, such evaluation
against many more experimental investigations on URM structures will be pre-
requisite to its use for more general fragility curves for this class of structures.
REFERENCES
Antoniou S, Pinho R. Development and verification of a displacement-based adaptive
pushover procedure. Journal of Earthquake Engineering 2004; 8(5):643–661.
Bothara JK, Dhakal RP, Mander JB. Seismic performance of an unreinforced masonry
building: An experimental Investigation. Earthquake Engineering and Structural
Dynamics 2010 39:45–68.
Ceci A.M., Contento A., Fanale L., Galeota D., Gattulli V., Lepidi M., Potenza F. (2010).
“Structural performance of the historic and modern buildings of the University of
L’Aquila during the seismic events of April 2009”, Engineering Structures, DOI:
10.1016/j.engstruct.2009.12.023.
CEN. Eurocode 6: Design of masonry structures, Part 1-1: Common rules for reinforced and
unreinforced masonry structures. Comité Européen de Normalisation, Brussels, 2005.
CEN. Eurocode 8: Design of structures for earthquake resistance, Part 1: General rules,
seismic actions and rules for buildings. Comité Européen de Normalisation, Brussels,
2004.
CEN. Eurocode 8: Design of Structures for Earthquake Resistance, Part 3: Assessment and
retrofitting of Buildings. Comité Européen de Normalisation, Brussels, Brussels, 2005.
Chopra AK, Goel RK. A modal pushover analysis procedure for estimating seismic demands
for buildings, Earthquake Engineering and Structural Dynamics 2002; 31:561–582.
Chopra AK. Dynamics of Structures: Theory and Applications to Earthquake Engineering.
Prentice-Hall: Englewood Cliffs, NJ, 1995.
Clough RW, Penzien J. Dynamics of Structures. Mc Graw Hill: New York, 1975, 1992.
GRECO 2012: Greek Code of Interventions Harmonized with EC8-III (2005), European
Center on the Prevention and Forecasting of Earthquakes and http://ecpfe.oasp.gr.
Günay S., Mosalam K. Structural Engineering Reconnaissance of the April 6, 2009, Abruzzo,
Italy, Earthquake, and Lessons Learned. PEER Report 2010/105, 2010.
ICOMOS. International Charter for the Conservation and Restoration of Monuments and
Sites, Decisions and Resolutions, Document 1. IInd International Congress of the
Architects and Technicians of Historic Monuments, Venice, 1964.
URL http://www.international.icomos.org/charters/venice_e.pdf [accessed 10/Nov/2013]
Lagomarsino, S., (2009), “Evaluation and Verification of Out-of-Plane Mechanisms in
Existing Masonry, Buildings”, Proc. of the Workshop “Eurocode 8 perspectives from the
Italian Standpoint”, Napoli, 3April 2009
Lagomarsino S., A. Penna, A. Galasco, S. Cattari, (2013). “TREMURI program: An
equivalent frame model for the nonlinear seismic analysis of masonry buildings”,
Engineering Structures, 56(2013):1787–1799, Elsevier.
Lagomarsino and Cattari, Perpetuate guidelines for seismic performance-based
assessment of cultural heritage masonry structures, Bull Earthquake Eng,
13(1):13–47, 2015 Magenes, G., Della Fontana, A. “Simplified non-linear seismic analysis of masonry
buildings”, Proc. Of the British Masonry Society, No. 8, October 1998, 190-195
Milani G., Lourenço P.B., Tralli A., Homogenised limit analysis of masonry walls, Part I:
Failure surfaces, Computers & Structures, 84(3-4):166-180, 2006.
Magenes G, Calvi M. In-plane seismic response of brick masonry walls, Earthq Eng Struct
Dyn 26(11):1091-1112, J. Wiley, 1997.
Page A.W. (1981). The biaxial compressive strength of brick masonry. Proceedings of the
Institution of Civil Engineers 71(Part 2), 893–906.
Pantazopoulou, S.J. Analysis Methods for Unreinforced Masonry Heritage Structures and
Monuments”, Electronic Book Commissioned by Organization for Seismic Panning and
Protection of Greece, 2013, ecpfe.oasp.gr/en/node/89.
Papadopoulos ML, Pantazopoulou S.J. Simulation for seismic assessment of traditional
houses in the historical core of the City of Xanthi before and after non-invasive structural
interventions. Proceedings of the COMPDYN2011 Conference, Corfu, Greece, 2011.
Pardalopoulos SJ, Pantazopoulou S.J. Seismic assessment of vintage neoclassical buldings
through simulation. Proceedings of the COMPDYN2011 Conference, Corfu, Greece,
2011.
Simsir CC, Aschheim MA, Abrams DP. Out-of-plane dynamic response of unreinforced
masonry bearing walls attached to flexible diaphragms. Proceedings of the 13th World
Conference on Earthquake Engineering, Vancouver, B.C., 2004.
Tastani S, Papadopoulos M, Pantazopoulou S. Seismic response of traditional masonry
buildings: parametric study and evaluation. Proceedings of the 1st International
Conference on Protection of Historical Buildings, Rome, Italy, 2009.
Thermou G.E., S.J.Pantazopoulou and A.S. Elnashai (2007) “Design methodology for seismic
upgrading of substandard RC structures”, J. of Earthquake Engineering, (Imperial
College Press, World Scientific), 11(4):582 – 606, July 2007.
Timoshenko S, Woinowsky-Krieger S. Theory of Plates and Shells. McGraw-Hill: New York,
1987.
Timoshenko S. Strength of Materials, Part I: Elementary theory and problems, 2nd
edition. D.
Von Nostrand Company: NY, 1940.
Tomazevic Miha. Series on Innovation in structures and construction, Vol. 1:Earthquake-
resistant design of masonry buildings. Imperial College Press: London, UK, 2006.
Varum, H.S.A., Seismic assessment, strengthening and repair of existing buildings, PhD.
Thesis, Universidade de Aveiro, (2003), Portugal, 508 pp.
Vintzileou E, Zagkotsis A, Repapis C, Zeris C. Seismic behaviour of the historical structural
system of the island of Lefkada, Greece. Construction and Building Materials 2007;
21:225–236.
APPENDIX
The contribution of type I and type II flexural deformations of the walls to the global
control node displacement of the system is moderated by two reduction factors, λf,I
and λf,II. The best approach to estimate them would involve finite element simulations,
yet, for the benefit of a simple approach, crude linear approximations may also be
employed as follows.
Let λf,Ι = f (θ), where θ is the ratio of the bending stiffness of the diaphragm over
the bending stiffness of the transverse walls:
HIE
aIE
wallw
diaphc
/
/ (54)
where
beamsperimeter diaphragm if ,12/2
slab diaphragm if ,12/ ,12/
3
3
3
wb
s
diaphwwallbt
btIbtI (55)
A concrete slab of ts thickness is often used as a retrofit measure at each story level,
while a perimeter beam of a uniform cross sectional width bw and depth tb is a
common retrofit measure at the crest. In this context it is assumed that the two
perimeter beams at the crest partially restrain the flexural deformation of the
longitudinal walls. Note that in this case the transverse wall length, b, affects the
resulting values of θ in Eq. (55), while for a slab the term b cancels out. The full
restraining effect corresponding to λf,I = 0 can be represented by a slab with Ec =
25GPa, Ew = 5GPa, H = 3m, tw = 0.6m ts = 0.2m, or a stiffness ratio of θ = 0.2. Then,
an appropriate linear function for λf,I is defined as
0,51max, If (56)
Factor λf,IΙ is a function of the axial (extensional) stiffness of the diaphragm, kd. For
the purposes of a simple approximation, a linear function is assumed, taking on the
value of 1 for kd = 0 (i.e., when the crest boundary is unrestrained in out-of-plane
translation) and 0 when the diaphragm stiffness ratio exceeds a certain critical limit
corresponding to the full restraining action of a concrete slab, set here at 60GN/m
(which corresponds to full support of the crest boundary against out-of-plane
displacement). Then
0,
0GN/m61max,
dIIf
k (57)
To estimate kd a slab can be treated like a deep beam of height “a” and span “b”,
where a, b are the plan dimensions of the structure. By solving this as a Timoshenko
beam that includes both bending and shear deformations (Timoshenko 1940) we find
its midpoint deformation d when subjected to a uniform load of q∙b. Then, a measure
of the slab’s stiffness at the wall midcrest can be obtained as
12/ where,
/)1(41
3843
,23
,
, syslab
yslabc
mid
slabd taIbab
IE
d
qbk
(58)
For a critical rigid slab assumed of ts=0.2m, a = b = 5m, using Ec = 25GPa and ν =
0.25 for concrete we get a value of about 25GN/m. If, instead, a simple perimeter
beam is the highest stiffness element restraining the out-of-plane wall bending, a
simple Bernoulli beam solution (neglecting shear deformation) can be used to find
that two such beams (one on each transverse wall), assumed clamped on both ends,
would have a total midpoint stiffness of
12/ where,3842
3
,3
,
, bybeam
ybeamc
mid
beamd ttIb
IE
d
qbk
. (59)