simplified heat and mass transfer modeling for anna apples...
TRANSCRIPT

International Journal of Food Engineering and Technology 2017; 3(2): 15-27 http://www.sciencepublishinggroup.com/j/ijfet doi: 10.11648/j.ijfet.20170302.12
Simplified Heat and Mass Transfer Modeling for Anna Apples Cold Storage
Ayman Hafez Amer Eissa, Ahmed Hassan Gomaa, Mohamed Abd Elfattah Abd El Maksoud,
Ehab Abd Elazez El Saeidy, Said Fathi El Sisi
Agriculture Engineering Department, Faculty of Agriculture, Menoufia University, Shibin El-Kom, Egypt
Email address:
[email protected] (A. H. A. Eissa), [email protected] (A. H. Gomaa), [email protected] (M. A. E. A. El Maksoud), [email protected] (E. A. E. El Saeidy), [email protected] (S. F. El Sisi))
To cite this article: Ayman Hafez Amer Eissa, Ahmed Hassan Gomaa, Mohamed Abd Elfattah Abd El Maksoud, Ehab Abd Elazez El Saeidy, Said Fathi El Sisi. Simplified Heat and Mass Transfer Modeling for Anna Apples Cold Storage. International Journal of Food Engineering and Technology. Vol. 3, No. 2, 2017, pp. 15-27. doi: 10.11648/j.ijfet.20170302.12
Received: March 20, 2017; Accepted: April 21, 2017; Published: May 19, 2017
Abstract: Uniform storage conditions in cold stores are difficult to attain in practice. All storage facilities have one thing in common, the need for proper humidity control. High product and air temperatures and moistures are often observed in certain positions of a cold room leading to deterioration of food quality and safety. To reduce food losses, it is necessary to understand heat and mass transfers. The aim of this study was control of relative humidity inside cold rooms at 90 and 95% and it compared with other cold room without control of relative humidity to improve the optimum cooling condition and 1°C of all cooling rooms. A simplified model was used for describing and predicted the trend of heat and mass transfer of Anna apples (product and air temperatures and weight losses) at different zones in the cold room. Temperature and velocity of air and apples measurements were carried out inside cold room filled with four apple pallets. The result showed that, Good agreement between the predicted and experimental results was found for both final average Anna apple temperature and weight loss inside cold room.
Keywords: Cold Room, Relative Humidity, Heat Transfer, Mass Transfer, Weight Losses
1. Introduction
Cooling is one of the main techniques used to preserve the postharvest quality of horticultural products. This is due to the widely reported ability of low temperatures to reduce biochemical reactions (such as respiration), retard the growth of microbial organisms and minimize moisture loss [1]. Anna apple (Malusdomestica, Borkh) is a low chilling cultivar spreading in many tropic and subtropics area including Egypt. It is considered as one of the most important commercial cultivars planted in Egypt [2]. The total area of Anna apples in Egypt is about 65140 feddan. The average production yield about 451530 tons/year. The total amount of loses yield of Anna apples about 62736 tons/year by about percentage 13.8% of the total amount of yield [3]. A uniform distribution of temperature and humidity, prevents the formation of hot spots within or between bins, and maybe thereby helps to reduce water loss from the fruit. In addition,
adequate air circulation is essential to reduce the occurrence of fruit shrivel or physiological storage disorders, like scald. In particular, scald incidence can be influenced by the air flow in a room [4]. Control of relative humidity is essential if the maximum storage life of foods is desired. Higher humidity than an optimum value promotes the growth of microorganisms and results in excessive food spoilage or abnormal splitting of some fruits. Lower humidity than optimum results in wilting of fruits and vegetables and damage to the appearance of animal tissues. Also they may cause subordinate economic losses because of a reduction in product weight. Moisture losses of 3 ~ 6% will result in a marked loss in quality of many vegetables [5]. Humidification reduces the vapour pressure difference between water at the 6 surface of the produce and in the air, thus reducing the driving force for evaporation. Deterioration in the appearance of unwrapped meats has been related to the degree of dehydration, which makes the product unattractive to consumers. Use of the fogging system was found to reduce

16 Ayman Hafez Amer Eissa et al.: Simplified Heat and Mass Transfer Modeling for Anna Apples Cold Storage
evaporative weight loss from fruit and vegetables during retail display. It had no significant effect on product temperatures [6]. The effects of an ultrasonic humidification system on unwrapped meat in a chilled retail display cabinet were assessed. Humidification raised the relative humidity of the cabinet air from a mean of 76.7% to just below saturation at 98.8%. This reduced the mean evaporative weight loss from whole samples of meat after 14 h from 1.68% to 0.62% of their initial weight [7]. The air flow represents one of the most important parameters during storage, as it has a crucial influence on the climate in the storage room. An optimal air circulation is important for the efficiency of the refrigeration system, as it helps for the rapid transfer of heat from the stored fruit to the evaporator. This causes a uniform distribution of temperature and humidity, prevents the formation of hot spots within or between the bins and reduces the occurrence of physiological storage disorders, like scald or shrivel of the apples [8]. Temperature and moisture heterogeneity, with non-uniform airflow in cold rooms was observed in several studies. This heterogeneity can lead to a deterioration of food quality and safety. Heat and mass transfer in cold rooms is a complex phenomenon because of the presence of the product (airflow modification, heat of respiration) and the coupling between heat transfer and airflow [9]. Transient heat transfer between product and air often takes place in food process engineering, for example, fruit and vegetables chilled in a cold room, transported in a refrigerated vehicle or stored in a display cabinet. In these processes, the heat transfer phenomenon depends mainly on the air- flow pattern (which in turn is influenced by the room/equipment and loading configuration) and the product properties (thermal conductivity, specific heat, density, etc.) [10]. A simplified model for 2-phase momentum, heat and mass transfer in an empty as well as loaded cool store with agricultural product was established to predict airflow around bins, air and product temperature as well as product weight loss. The model equations were solved and validated by means of experimental data from a pilot cool room. An error of about 20% for velocity magnitude prediction for both the empty and loaded cool store was achieved [11]. The model was capable of predicting the cooling rate of the air as well as the product. Both the heat and moisture transfers are influenced by flow characteristics (such as cooling air temperature and velocity), air properties (viscosity, density, conductivity and specific heat), product properties, shape, dimension and arrangement of the load [12]. Specifically, the objective of our study is to use the simplified heat and mass transfer to predict Average temperature of Anna apples and water loss with air in the room and validate the experimental results.
2. Materials and Methods
2.1. Anna Apple Fruits
The freshly harvested Anna Apple was obtained from private farms in El-Hamam, Matrouh Governorate, Egypt.
The purpose of apple washing is cleaning and sterilization before the processes of transportation and storage. Apples sorted by size and cleaned by immersion in chemical solutions (calcium chloride solution (3-6%) before the cold storage process in cold room.
2.2. Description of the Cold Room
The cold room was 2 m long, 2 m wide and 2 m high (a total volume of 8 m3). Inside the cold room, 4 pallets (packages carton) (0.6 m long, 0.4 m wide and 1.4 m high) were placed. Each pallet was composed of 13 bins (0.6 m long, 0.4 m wide and 0.1 m high) with a vent hole ratio of 36%, each one was filled with 34 apples (Anna variety). The cooling unit, located at the ceiling of the room an slope angle, the dimensions of cooling unit (evaporator) store are 90 cm × 30cm × 30cm and included three axial fans of 20 cm diameter rotating at 680 rpm to distribute the cooled air into the cold store. Dimensions of cold room, cooling unit and Anna apple inside cold room are presented in Figure 1. The geometrical parameters of the computational domain are reported in Table 1.
Figure 1. Dimensions of cold room and cooling unit.
Table 1. Geometrical parameters of the cold room, pallet and package.
Number Dimensions (length × width
× height, in m
Cold room 3 2 × 2 × 2 Pallet 4 0.6 × 0.4 × 1.4 package 13/ pallet 0.6 × 0.4 × 0.1
The compressor was a hermetic type. An electrical motor of 0.735 kW powered the compressor. The condenser was cooled by air. It consists of copper pipes, aluminum plates and an axial type ventilator. The evaporator was made of copper pipes and outside surface covered with aluminum plates. An electrical heater was used to defrost. Sizes of the door of cold storage were 1*2 (h) m. Surfaces of the door were covered same materials of panels.
A compressor was located in the outside of the cold store. An evaporator was put on the ceiling of the cold storage with steel screws. Thermostatic expansion valve was fitted in the
International Journal of Food Engineering and Technology 2017; 3(2): 15-27 17
evaporator inlet and on the high-pressure side of the compressor. A control panel, which includes a thermometer-thermostat, a manometer and a humidity gauge was placed on the front wall of the cold store.
2.3. Measurements
Air temperature, and air velocity of different places in this the cold store were measured to determine spatial distribution of these factors. Ambient temperatures and air velocity were measured in top, medium and bot- tom of the cold store for different storage relative humidity as 90 and 95% and without control in relative humidity (55- 70%) and two different air velocities.
a. Temperatures
Air temperature inside cold storage, core, average and surface temperature of apple and ambient temperature were measured using T- type thermocouples (1 mm diameter, precision± 0.2°C) in one cold room and IC (LM35) sensors were used in other cold rooms. The air temperatures were determined at three levels located at different height: bottom (45cm), medium (90 cm) and top (135cm) inside the cold store and at storage temperatures 1°C, 12 temperature points were measured in each cold room and 1 temperature outside and temperature of evaporator and condenser: 9 products (core, average and surface) and 4 air temperatures.
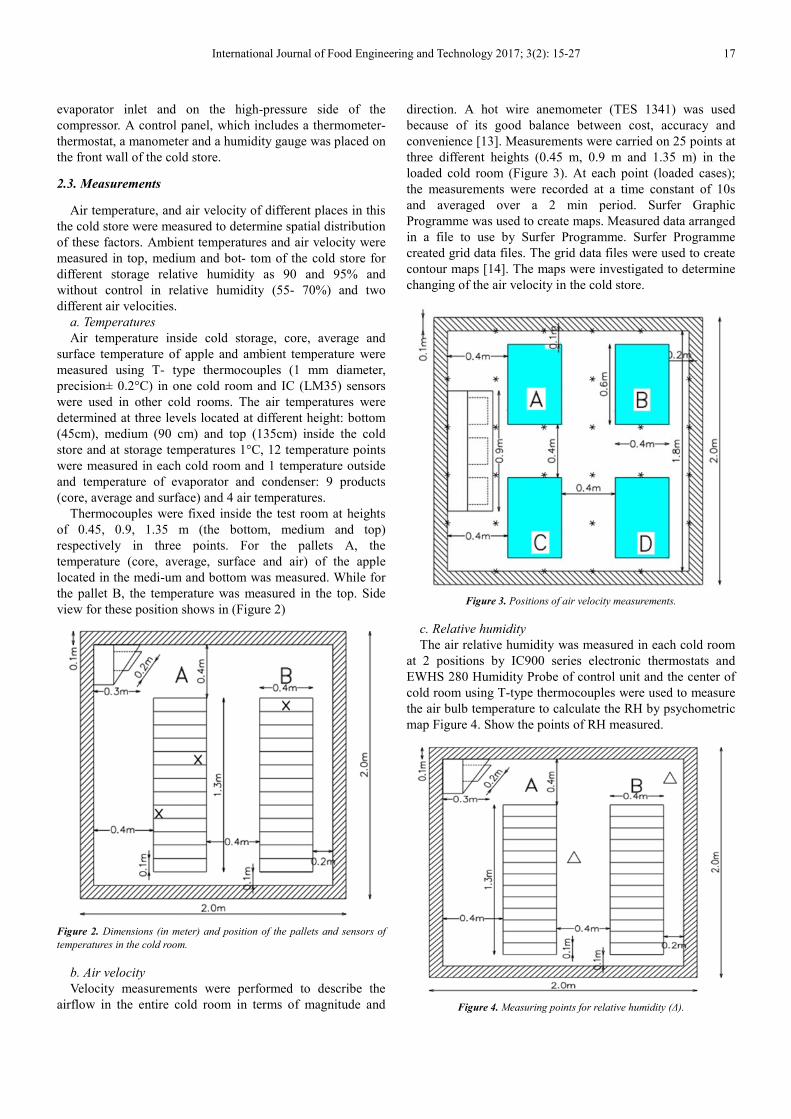
Thermocouples were fixed inside the test room at heights of 0.45, 0.9, 1.35 m (the bottom, medium and top) respectively in three points. For the pallets A, the temperature (core, average, surface and air) of the apple located in the medi-um and bottom was measured. While for the pallet B, the temperature was measured in the top. Side view for these position shows in (Figure 2)
Figure 2. Dimensions (in meter) and position of the pallets and sensors of
temperatures in the cold room.
b. Air velocity
Velocity measurements were performed to describe the airflow in the entire cold room in terms of magnitude and
direction. A hot wire anemometer (TES 1341) was used because of its good balance between cost, accuracy and convenience [13]. Measurements were carried on 25 points at three different heights (0.45 m, 0.9 m and 1.35 m) in the loaded cold room (Figure 3). At each point (loaded cases); the measurements were recorded at a time constant of 10s and averaged over a 2 min period. Surfer Graphic Programme was used to create maps. Measured data arranged in a file to use by Surfer Programme. Surfer Programme created grid data files. The grid data files were used to create contour maps [14]. The maps were investigated to determine changing of the air velocity in the cold store.
Figure 3. Positions of air velocity measurements.
c. Relative humidity
The air relative humidity was measured in each cold room at 2 positions by IC900 series electronic thermostats and EWHS 280 Humidity Probe of control unit and the center of cold room using T-type thermocouples were used to measure the air bulb temperature to calculate the RH by psychometric map Figure 4. Show the points of RH measured.
Figure 4. Measuring points for relative humidity (∆).

18 Ayman Hafez Amer Eissa et al.: Simplified Heat and Mass Transfer Modeling for Anna Apples Cold Storage
d. Weight loss
Measurements were carried out in order to compare the apple weight loss at different positions in the cold room and in subsequent work, to validate a model of quality evolution. The apples weight was measured at 4 different positions in the pallets using a digital balance (GP4102, Germany).
2.4. Simplified Model of Heat Transfer
i. Conduction and convection heat transfer in cold room
The heat transfer Q between the surface of Apple and the surrounding cold air consists of conduction (Qcond) and convection heat transfer (Qconv). When an apple (initial temperature 30°C) was placed in the cold room (thermostat setting temperature 1°C), the product temperature decreased and approached the ambient temperature. This is related to the heat transfer by conduction inside the apple (apple thermal conductivity k) and by convection between the product surface and external air (convective heat transfer hc) Figure 5.
Figure 5. Heat transfer during apple cooling (a) conduction and convection
(b) temperature profile.
Conduction heat transfer is determined from Fourier’s Law of Cooling [15] in the following equation (1) and (2):
Q������� ��� ����� /������
(1)
Q������� � ������ /������
(2)
Where: Q(c-avg) Heat transfer between core and average of apple, W Q (avg-s) Heat transfer between average and surf-ace of
apple, W. Convection heat transfer is determined from Newton's Law
of Cooling [16] in equation (3). Q(S- air) is related to heat transfer between surface of apple and air cooling temperature (W).
Q(S- air) = hc As (Ts – Ta) (3)
A simple model for estimating temperature evolution of regular shaped food product was used to calculate the cooling rate. This model developed by [17] allows the calculation of the average temperature of high moisture food product in equation (4). This author considered that the average temperature of the product can be estimated by the temperature at the position r = 3/4Rp, with Rp the sphere radius.
ρ�C�V� �� ��� A����� !���
"���/�#� $%"��/�#� $%
&'�
(4)
The equation was solved using a fourth-order Rungee Kutta method [18] ODE23s function in Matlab 5.3 software. The thermo-physical properties of apple (Anna variety) are presented in Table 2.
Table 2. Thermo-physical properties of apple (Anna variety) (Bryan et al.,
2011).
Kp Thermal conductivity of apple, W m-1 K-1 0.465 Cp Heat capacity of apple, J kg-1K-1 878 ρp Density of the apple, kg m-3 3580
The calculated temperature is the average temperature of the product whereas measurements were performed at the core and at the surface. To compare the calculated and the measured values, the experimental average temperature also was measured by sensors at the position r = 3/4Rp and Can be sure this experimental average temperature through using equation (5) by [19]:
Tavg = Tc + (Ts-Tc) (3/4)2 (5)
ii. Convection heat transfer coefficient
The convection heat transfer coefficient hc can be estimated by using the Nusselt- Reynolds-Prandtl correlations (Incropera and DeWitt, 1990). The Nusselt number Nu is defined as equation (6):
Nu *��+� (6)
Because the convective heat transfer and convective mass transfer processes are governed by similar mechanisms, Nusselt-Reynolds-Prandtl correlations can be calculated by following Equations (7), (8), (9), (10) and (11).
Nu= 2 + 0.6 Re0.5 Pr0.33 (7)
Pr υ. (8)
/
Rρ (9) υ

International Journal of Food Engineering and Technology 2017; 3(2): 15-27 19
α +�1�2� (10)
Re 56�υ (11)
For the temperature range of -40°C to 120°C (-40°F to 250°F), the viscosity of moist air varies dynamic viscosity of moist air is approximated little from that of dry air [20] Therefore, the by that of dry air at the same temperature by using the following relationship, which was obtained via a least-squares fit of dry air data reported by [20]:
µ = 17.19 + 0.0429 Ta (12)
2.5. Mass Transfer (Weight Loss) Model
The weight loss of food the weight loss of food products is driven by the gradient in water vapour density between the apple skin and the surrounding air. A simple model was given by. A simple model was proposed by [21] in equation (13):
7879 = Kta As (ρ: −ρ:,=) (13)
The mass transfer coefficient kta is then calculated from hc, was obtained from [21] in equation (14):
K�� = *�
Rρ 2���?@)A/� (14)
Where the Lewis number Le is calculated from equation (15):
Le = +�
Rρ 2��C�DE (15)
ρw is related to the saturated vapour pressure Psat (Pa) at apple surface temperature Ts (K) as equations (16) and (17) by [22]:
ρ: = FGAHI��J,�KEL��)�MN.�
(16)
P���,�5PQ = 0.61078exp YZ[.\]^_``��%\_[._a (17)
The expression of ρw,∞ is the same as for ρω by replacing the water activity by the relative humidity (RH) and the saturated vapour pressure Psat (Pa) at cooling air temperature Ta (K) as equations (18), (19) and (20), The thermophysical properties of air are listed in Table 3.
ρ:,= =FGAHIM,�DE
N.� (18)
ρ:,�bP = P���,�bP�T�) NdZee (19)
P���,�bP = 0.61078exp YZ[.\]^_``��%\_[._a (20)
Table 3. Air properties at 1°C [23].
Density 1.29 kg m-3
Ka Thermal conductivity 0.025 W m-1°C-1 Cpa Heat capacity 1004 J kg-1°C-1 Dair Diffusivity of water in air 2.1*10-5 m-2 s-1
3. Results
3.1. Air Velocity Distribution Inside Cold Room
Air velocity distribution is an indicator of ambient temperature and relative humidity of cold store. The experimental air velocity results will be presented firstly because the airflow governs the others physical phenomena. Air velocity distribution maps of the cooling air inside the cold room was obtained from the results as shown in Figure 6, where are showing that there is variability between air velocity values of top, middle and bottom level of the cold store at 680 rpm of cooling unit fans. Variation of the air velocity at the top and bottom of the cold store were less than the medium level of the cold store because the evaporator was placed at ceiling of the cold room but position of the cooling unit fans (evaporator fans) were inclined, where the air was driven by the jet provided by the cooling unit fans (air supply). At the air velocity 680 rpm of evaporator fans speed, maximum air velocity was as 0.84 m/s for medium level located in center of cold room and near the front pallets (A and C), while maximum air velocity at top level was 0.23 m/s located in the front pallets (A and C) and maximum air velocity at bottom level was 0.4 m/s located in the front pallets (A and C) but the minimum air velocity at three level were range from 0 to 0.1 m/s at near of rear pallets (B and D), side walls and the corners.
3.2. Calculated Convective Heat Transfer Coefficient
Table 4, presents the calculated heat transfer coefficients between air and apples of the pallets A (bottom and medium positions) and B (top position). The supply air induced highest air velocity at the medium of A and C pallets (Positions medium) where high convective heat transfer coefficients was calculated 11.15 W m-2 K-1 at 680 rpm of evaporator fans velocity, resp-ets B and D, where low convective heat transfer coefficients was calculated 5.028 W m-2 K-1 at ectively. Lowest convective heat transfer coefficients were observed at the top of the pall-
Table 4. Calculated values of convective heat transfer coefficient (W m-2 K-1)
Position Convective heat transfer coefficient (W m-2 K-1)
V1 (velocity 680 rpm of evaporator fans)
bottom 6.725 - 8.903 Medium 9.66 - 11.15 top 5.028 - 6.918
680 rpm of evaporator fans speed, respectively where the lowest velocities were measured.
Rρ

20 Ayman Hafez Amer Eissa et al.: Simplified Heat and Mass Transfer Modeling for Anna Apples Cold Storage
Figure 6. Maps of air velocity distribution in the experimental cold storage at 680 rpm of cooling unit fans.

International Journal of Food Engineering and Technology 2017; 3(2): 15-27 21
3.3. Cooling Rate of Anna Apple During Cold Storage
The measured and simulated average temperatures of Anna apple in the bottom, medium of pallet A and top of pallet B at relative humidity 90% are plotted in Figure 7. It can be observed that the initial temperature of the apple inside cold room (apple core temperature) was 29.5°C at different positions. Experimental data and simulated results of bottom, medium and top are compared. The most rapid cooling rate of apple is observed with medium in pallet A which is located in the zone where the cold air velocity is highest. A slower cooling rate of apples is found for the bottom in pallet A and top in pallet B. The simulated average apple temperature decreased from 21.2 to 3°C, 21.8 to 2.1°C and 23.4 to 3.1°C at bottom and medium from pallet A and top from pallet B, respectively. The half cooling time corresponds to the time required to reduce the temperature of the apple halfway between its initial temperature and its final one (at the end of the cooling process). Short half-cooling times was less than 6.2 hours correspond to apples at the medium of the pallet A, while long half cooling times was 8 hours to apples at the top of the pallet B. It can be observed that the averaged apple temperature predicts a quicker cooling rate and a lower temperature for position medium of pallet A more than other two positions (bottom in pallet A and top from pallet B). Finally, the medium of the cold room was subjected to the fresher and cooler air with higher velocity, which is why the product temperature reduced from the positions top and bottom. Figure 8, represents the differences between the measured and the predicted values of the Average Anna apple temperature during the simulation periods for different
positions (bottom, medium and top) at cooling air velocity (680 rpm of evaporator fans) and RH 90%. The maximum differences between measured and predicted temperature profile are 1.5°C for bottom in pallet A, while it is 1.4 and 1.4°C for medium in pallet A and top in pallet B. This situation can be ascribed to different reasons, such as cooling air velocity variations and heat infiltration during cooling period which was not considered in this model.
Experiment and predicted average temperatures of Anna apple in the bottom, medium of pallet A and top of pallet B at relative humidity 95% and without control of relative humidity (55-70%) are shown in Figure 9. and Figure 10. It can be noted that the initial temperature of Anna apple inside cold room (apple core temperature) was from 29 to 30°C at different positions. The predicted average apple temperature decreased from 23.2 to 2°C, 22 to 1.8°C and 23.4 to 2.9°C and from 21.4 to 2.2°C, 20.4 to 2.9°C and 23.7 to 2.9°C at bottom, medium for pallet A and top for pallet B at RH 95% and without control of RH (55-70%), respectively. While measured average apple temperature decreased from 21.9 to 1.9°C, 21.2 to 2°C and 23.8 to 3.1°C and from 21.4 to 2.2°C, 20.4 to 2.2°C and 23.7 to 2.9°C at bottom, medium for pallet A and top for pallet B at RH 95% and without control of RH (55-70%), respectively. Half cooling times were 5, 4.8 and 6.6 hours and 8, 7 and 11 hours correspond to Anna apples at bottom and medium from pallet A and top from pallet B at RH 95% and without control of RH (55-70%), respectively. Finally, the medium position of the cold room was subjected to the fresher and cooler air with higher velocity so it achieved by high cooling rate for Anna apples.

22 Ayman Hafez Amer Eissa et al.: Simplified Heat and Mass Transfer Modeling for Anna Apples Cold Storage
Figure 7. Comparison between the experimental average apple temperature and the calculated value of simplified model at air velocity (680 rpm) and the RH
90%.
Figure 8. Residuals of the measured and the predicted values of the Average apple temperature at velocity 680 rpm of evaporator fans and RH 90%.

International Journal of Food Engineering and Technology 2017; 3(2): 15-27 23
Figure 9. Comparison between the experimental average apple temperature and the calculated value of simplified model at air velocity (680 rpm) at the RH
95%.

24 Ayman Hafez Amer Eissa et al.: Simplified Heat and Mass Transfer Modeling for Anna Apples Cold Storage
Figure 10. Comparison between the experimental average apple temperature and the calculated value of simplified model at air velocity (680 rpm) and
without control of the RH (55-70%).
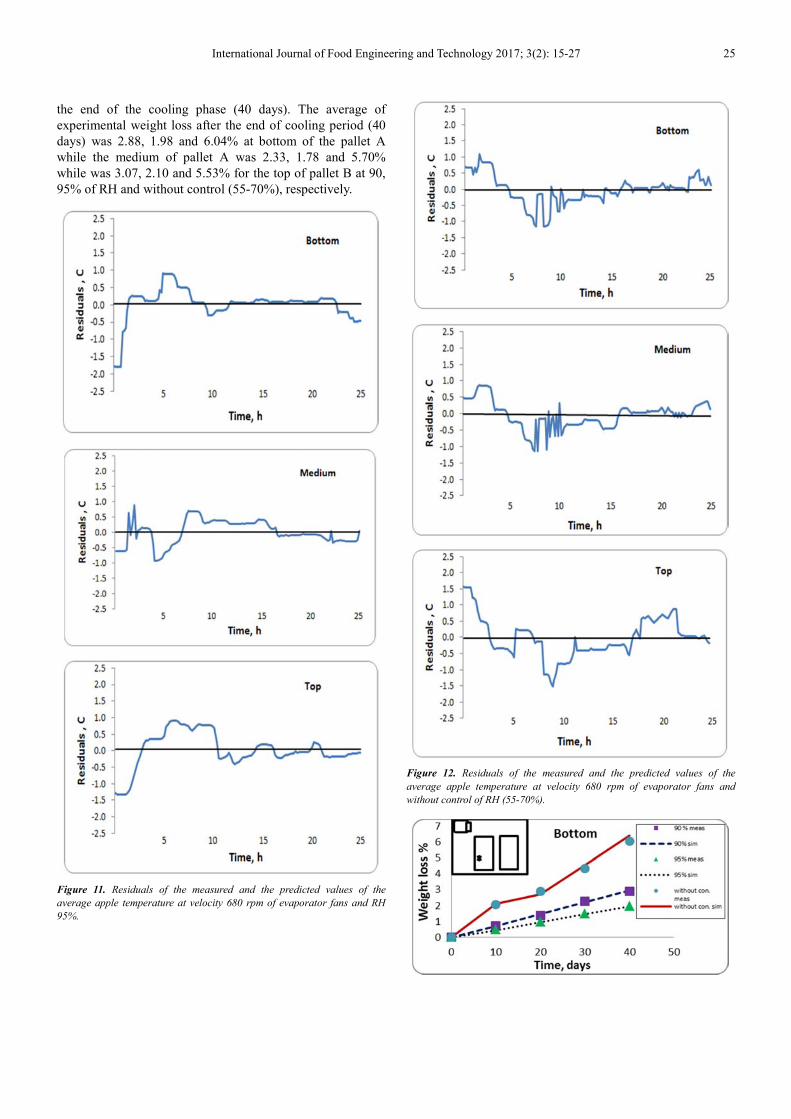
Figure 11 and Figure 12 represent the differences between the measured and the predicted values of the Average Anna apple temperature during the simulation periods for different positions (bottom, medium and top) at cooling air velocity (680 rpm) at RH 95% and without control of RH (55-70%). The maximum differences between measured and predicted temperature profile are 1.8°C, 0.9 and 1.3°C and 1.1°C, 1.2 and 1.6°C for bottom, medium in pallet A and top in pallet B at RH 95% and without control of RH (55-70%), respectively.
3.4. Weight Loss Model of Anna Apple During Cold
Storage
Figure 13, show the comparison between the experimental and predicted weight losses of Anna apples (in percentage) at the bottom, medium of the pallet A and top of the pallet B for a relative humidity of (90, 95%) are compared with that corresponding to without control of RH (55-70%) at 1°C of cooling air (Thermostat). the weight loss has a quasi-linear relationship with time up to 40 days for every parameter of storage. The experimental and simulated results are in good agreement: weight losses of the top pallet B are higher than other two positions at the pallet A. This can mainly be explained by the fact that the top of pallet B is exposed to higher temperature as mentioned previously. In addition to, weight loss at without control of relative humidity (55-
70%) is the highest. This is may be air on the cold room is slightly less humid which induced a slightly higher saturation pressure of water in apples than saturation pressure of water in cooling air. Indeed, the weight loss of Anna apple is driven by the gradient in water vapour density between the apple skin and the surrounding air. This explains why the weight loss is higher at the top pallet B.
Water loss is the main cause of deterioration because it results not only in direct quantitative losses but also because it has a negative impact on the product’s quality, namely on its appearance (wilting and shrivelling), texture (loss of crispness and juiciness) and nutrient content. The maximum weight loss (%) of about 5.53% was observed experimentally at top of the pallet B while the predicted value is 5.76% at without control of relative humidity (55-70%) after 40 days preservation in the cold room. In spite of the model simplification, the weight loss prediction is acceptable. The minimum weight loss of about 1.74% was observed experimentally at medium of the pallet A while the predicted value is 1.64% at 95% of RH. The weight loss reduction is likely due to two phenomena: the reduction in physiolog- ical activity, as evidenced by the decrease in the respiration rate and the vapor pressure deficit between the produce and the surrounding air as the pressure increased [24].
The weight loss (%) of Anna apple after 40 days was extrapolated based on the weight loss rate every 10 days until
International Journal of Food Engineering and Technology 2017; 3(2): 15-27 25
the end of the cooling phase (40 days). The average of experimental weight loss after the end of cooling period (40 days) was 2.88, 1.98 and 6.04% at bottom of the pallet A while the medium of pallet A was 2.33, 1.78 and 5.70% while was 3.07, 2.10 and 5.53% for the top of pallet B at 90, 95% of RH and without control (55-70%), respectively.
Figure 11. Residuals of the measured and the predicted values of the
average apple temperature at velocity 680 rpm of evaporator fans and RH
95%.
Figure 12. Residuals of the measured and the predicted values of the
average apple temperature at velocity 680 rpm of evaporator fans and
without control of RH (55-70%).

26 Ayman Hafez Amer Eissa et al.: Simplified Heat and Mass Transfer Modeling for Anna Apples Cold Storage
Figure 13. Measured and calculated weight losses of apples at the bottom,
medium and top positions during 40 days of storage at 680 rpm of cooling
unit fans.
4. Conclusion
The experimental investigation was carried out in a cold room filled with four apple pallets. Also, experimental cold store was used to determine spatial distribution of the air velocity. The understanding of heat and mass transfer at different positions in the cold room was achieved by explanation the measured values of air velocity, temperatures (air and product), weight loss and calculated convective heat transfer coefficient. The calculation of product cooling rate was conducted using the simplified model and was in agreement with measured data. The weight loss could also be calculated by a simple model by Gwanpua, et al. (2012). Generally the physical properties (product cooling, air and product temperature and weight loss) can be explained by the simplified air velocity pattern. Finally, the result showed that, Good agreement between the predicted and experimental data for heat and mass transfer.
Nomenclature
As Apple surface area, m2 Re Reynolds number aw Water activity of the apple Rp Apple radius, m Cp Specific heat of apple, J Kg-1°C-1 RH Relative humidity,% Cpa Specific heat of air cooling, J Kg-1°C-1 t Time, s d Diameter of apple, m Ta Air cooling temperature, °C Dair The diffusivity of water in air, m2 s-1 Tavg Apple average temperature, °C hc Convection heat transfer coefficient, Wm-2 K-1 Ts Apple surface temperature, °C ka Thermal conductivity of air W m-1 k-1 Tc Apple core temperature, °C kp Thermal conductivity of apple, W m-1 K-1 u∞ Air velocity, m s-1 kta Moisture transfer coefficient of the apple skin, m Vp Apple volume, m3 m Weight loss, Kgwater Density of air inside of the refrigerator, kg m-3 MH2O Molar mass of water, kg mol-1 (= 0.018) ρg,= Vapour density of the surrounding air, kgwater m
-3 Nu Nusselt number ρg Vapour density of the apple surface, kgwater m
-3 Pr Prandtl number ρp Density of the apple, kg/m3 Psat,air Saturated vapour pressure at air cooling temperature, Pa µ Dynamic viscosity of air, 10-6Ns m-2
Psat,surf Saturated vapour pressure at apple surface temperature, Pa Kinematic viscosity of air, m2 s-1
Q Heat transfer, W α Thermal diffusivity of apple, m2 s-1
R Universal gas constant, 8.314 J mol-1 K-1
References
[1] Arin, S and S. Akdemir (2004) Spatial variabilty of ambient temperature, relative humidity and air velocity in a cold store. Journal of Central European Agriculture, 4 (2): 253-257.
[2] Gobara, A. A., F. F. Ahmed and M. S. El-Shammaa (2001). Effect of varying N. K. and Mg application ratio on productivity of Banaty grapevines. The fifth Arabian Horticulture conf. Ismallia Egypt, March 24-28 pp. 83-90.
[3] FAO (1990). The production of Anna Apples in Egypt. Food and Agriculture Organization.
[4] Hellickson, M. L and R. A. Baskins (2003). Visual documentation of air flow patterns in a controlled atmosphere storage. Acta Hort. 600: 173-179.
[5] Karel, M and D. B. Lund (2003). Physical principles of food preservation (2nd ed.). (p. 252). New York: CRC Press.
[6] Brown, T., Corry, J. E. L and S. J. James (2004). Humidification of chilled fruit and vegetables on retail display using an ultrasonic fogging system with water/air ozonation. International Journal of Refrigeration, 27, 862–868.
[7] Brown, T., J. E. L. Corry and A. E. Judith (2007). Humidification of unwrapped chilled meat on retail display using an ultrasonic fogging system. Meat Science, 77: 670–677.
Rρ
υ

International Journal of Food Engineering and Technology 2017; 3(2): 15-27 27
[8] Kittemann, D., Neuwald, D. A., Streif., J. G. Rux., M. Linke and M. Geyer (2015). Studies on the optimization of air flows in apple storage rooms. Acta Hort. 1071: 603-608.
[9] Duret, S., H. M. Hoang., D. Flick and O. Laguerre (2014). Experimental characterization of airflow, heat and mass transfer in a cold room filled with food products. International journal of refrigeration. 46: 17-25.
[10] Hong-Minh, H., S. Duret., D. Flick and O. Laguerre (2015). Preliminary study of airflow and heat transfer in a cold room filled with apple pallets: Comparison between two modeling approaches and experimental results. Applied Thermal Engineering. 76: 367-381.
[11] Nahor, H. B., M. L. Hoang., P. Verboven., M. Baelmans and B. M. Nicola (2005). CFD model of the airflow, heat and mass transfer in cool stores. International Journal of Refrigeration 28, 368–380.
[12] Mirade, P. S and J. D. Daudin (2006). Computational fluid dynamics prediction and validation of gas circulation in a cheese ripening room.
[13] Melikov, A. K., Z. Popiolek., M. C. G. Silva., I. Care and T. Sefker (2007). Accuracy limitations for low-velocity measurements and draft assessment in rooms. HVAC Res. 13: 971-986.
[14] Akdemir, B., Blackmore, S (2001). Yield mapping preparation techniques, Agricultural Machinery National Turkey. Symposium, 46-57. Mechanical Engineering Chamber, Mersin, Turkey.
[15] Laguerre, O., S. Duret., H. M. Hoang., L. Guillier and D. Flick (2015). Simplified heat transfer modeling in a cold room filled with food products. Journal of Food Engineering 149: 78–86.
[16] Incropera, F. P., and D. P. DeWitt (1990). Fundamentals of Heat and Mass Transfer. New York: John Wiley and Sons.
[17] Van der Sman, R. G. M (2003). Simple model for estimating heat and mass transfer in regular-shaped foods. J. Food Eng. 60: 383-390.
[18] Gerald, C and P. O. Wheatley (1999) Applied Numerical Analysis, Addison-Wesley, Reading MA, 4th Edition.
[19] Bryan, R. B., M. Anil and A. F. Brian (2011). Bulk Refrigeration of Fruits and Vegetables Part I: Theoretical Considerations of Heat and Mass Transfer, HVAC&R Research, 2 (2): 122-134.
[20] ASHRAE (1993). ASHRAE Handbook—Fundamentals. Atlanta: ASHRAE.
[21] Gwanpua, S. G., B. E. Verlinden., M. L. A. T. M. Hertog., I. Bulens., B. Van de Poel., J. Van Impe., B. M. Nicolaï and A. H. Geeraerd (2012). Kinetic modeling of firmness breakdown in ‘Braeburn’ apples stored under different controlled atmosphere conditions. Postharvest Biol. Technol. 67, 68–74.
[22] Taha, A. T (2003). Simulation Model of Energy Fluxes in Passive Solar Greenhouses with a Concrete North-Wall. Ph.D. Thesis, University of Hannover, Germany.
[23] Veraverbeke, E. A., P. Verboven., P. Van Oostveldt and B. M. Nicola (2003). Prediction of moisture loss across the cuticle of apple (Malus sylvestris subsp. mitis (Wallr.)) during storage Part 1. Model development and determination of diffusion coefficients Postharvest Biology and Technology 30: 75-88.
[24] Goyette, M., D. Turcotte., V. Mann-Feder., S. Grenier and Turcotte, M-È (2012). Soutenir le passage à la vie adulte des jeunes issus des centres de jeunesse: une expérimentation de deux modalités d'interventionde groupe CREVAJ Montréal: ENAP.