simple rules and optimal policies in staff models · interest rate rules ... have desirable...
TRANSCRIPT

March 2, 2012
Simple Rules and Optimal Policies in Staff Models1
Christopher Erceg, Matteo Iacoviello, Michael Kiley, and David López-Salido
1. Introduction and summary
The staff regularly presents monetary policy prescriptions from simple rules and optimal control simulations in Tealbook B. These prescriptions provide information on the implications of the staff outlook for monetary policy through different lenses – with simple rules providing clear benchmarks linking the federal funds rate to inflation and resource utilization, and optimal control simulations illustrating how a commitment-based strategy can potentially improve inflation and unemployment outcomes.
However, the factors that account for the different policy prescriptions of these alternative strategies, as well as their relative performance in achieving ultimate policy goals, are not always clear. Moreover, the Monetary Policy Strategies section of Tealbook B focuses exclusively on the current baseline outlook. In this memo, we compare the performance of several simple interest rate rules to the optimal policy across a range of scenarios, and highlight factors that account both for their varying performance and somewhat differing policy prescriptions.
Our review suggests the following key results:
Simple policy rules with limited interest rate inertia, including the original Taylor (1993)rule, the modified Taylor (1999) rule, and the outcome-based rule, do not approximateoptimal commitment strategies particularly well.
o Under current conditions, the optimal policy involves a commitment to keepinterest rates unusually low as the economy recovers so that unemploymenteventually falls below its natural rate and inflation rises somewhat above its 2percent target; by contrast, the simple rules studied here imply a much sharper risein real interest rates as the economy recovers.
o Under initial conditions in which unemployment is close to the natural rate andinflation is near 2 percent (“normal times”), we also find that these simple rulesdo not approximate optimal policy well in response to both demand and supplyshocks. For example, the optimal policy succeeds better in restraining theinflationary effect generated by an adverse supply shock through the conditionalcommitment to keep policy tight for a protracted period.
The more aggressive response to the output gap in the Taylor (1999) rule relative to theTaylor (1993) rule leads to somewhat better outcomes for resource utilization under themodal outlook, and also in negative aggregate demand and supply shock scenarios.
1 The authors thank James Clouse, William English, Jon Faust, Andrew Levin, Steve Meyer, David Reifschneider, and David Wilcox for helpful comments and suggestions.
Page 1 of 16
Authorized for public release by the FOMC Secretariat on 02/09/2018

However, a lower response to the output gap, as in the Taylor (1993) rule, leads to better inflation developments in the event of the adverse supply shock.
Previous staff analysis suggests that some simple strategies can approximate optimal commitment strategies in staff models. In particular, policies with features of flexible-price level targeting – such as nominal income targeting – have desirable features in staff models under a range of scenarios. In ongoing staff analysis, we are investigating the degree to which simple commitment-based strategies can come close to the optimal policy.
Section 2 of this memo compares the performance of simple interest rate rules to that of the optimal policy under the current economic outlook. Section 3 discusses the optimal control and simple rules under two scenarios: a recession scenario and an inflationary scenario. Section 4 focuses on the performance of these alternative strategies when the economy is initially operating near full employment and the inflation rate is near target (that is, under normal circumstances); a consideration of how policy strategies perform when the federal funds rate is unconstrained at a more typical level well above zero highlights some of the special features of current circumstances, where the zero lower bound is expected to bind for an extended period. Finally, the last two sections of the memo provide an initial foray into issues that the staff plans to investigate further. In particular, Section 5 briefly summarizes aspects of simple rules that show promise in approximating (at least some features of) optimal commitment strategies, while Section 6 briefly discusses the robustness of alternative strategies to mis-measurement of the output gap, alternative models, and specifications of expectations.
2. Simple rules and optimal policy under the current economic outlook
FRB/US simulations
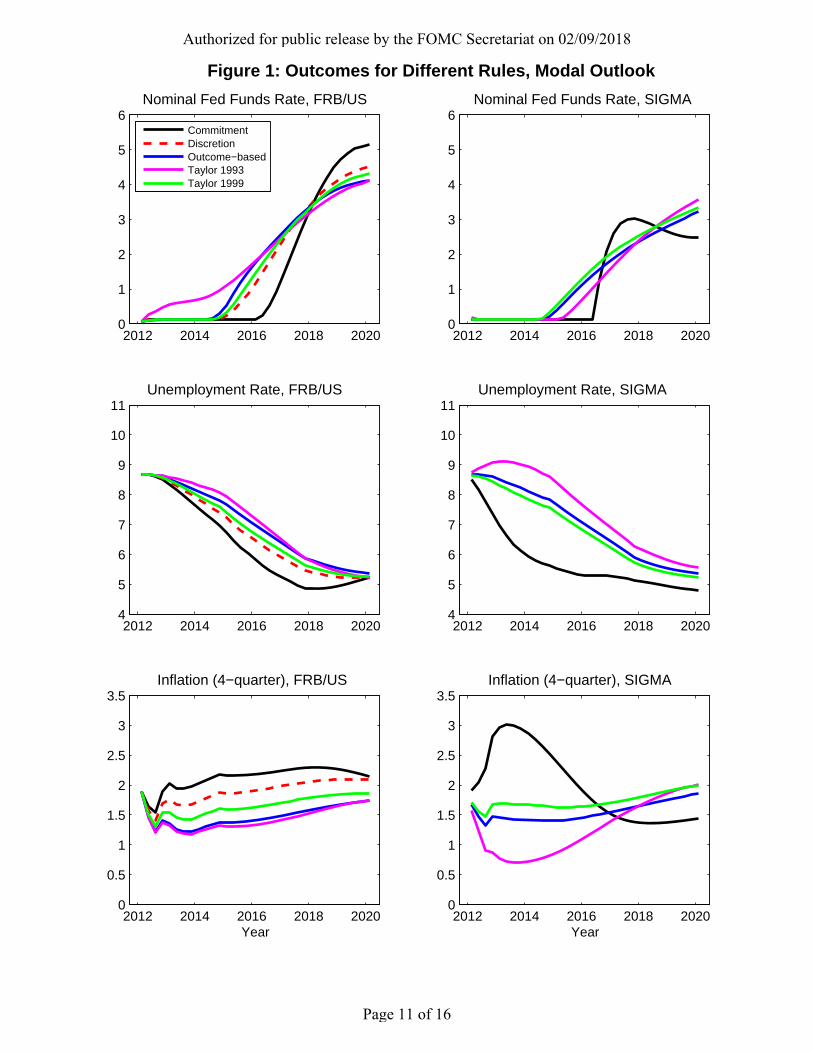
The left-hand column of Figure 1 presents outcomes for the federal funds rate, the unemployment rate, and the headline PCE inflation rate under different policy strategies, using the conditions expected in the January Tealbook as the underlying baseline, and assuming that the dynamics of the economy match those of the FRB/US model under rational expectations. The first set of strategies discussed here focuses on “optimal control” approaches. In the optimal control simulations, policymakers are assumed to place equal weight on keeping PCE inflation around 2 percent, on keeping the unemployment rate close to the staff’s estimate of the effective NAIRU, and on minimizing changes in the federal funds rate. In the “discretion” case, policymakers set policy on a period-by-period basis and are unwilling to promise unusual future accommodation. Under “commitment,” policymakers are willing and able to credibly commit (conditional on economic outcomes) to future policies that are potentially more expansionary than usual in order to stimulate activity today. In both cases, policymakers are assumed to share the baseline projection presented in the January Tealbook. As such, these policies condition on all of the assumptions underlying the Tealbook projection: For example, these policies take into account the effects of the staff’s baseline estimates for the impact of past and prospective balance sheet actions on term premiums, economic activity, and inflation.
Page 2 of 16
Authorized for public release by the FOMC Secretariat on 02/09/2018

Under the commitment strategy, optimal policy would involve holding the nominal federal funds rate near its lower bound well into a projected economic recovery. Of course, this commitment implies that the unemployment rate falls below its natural rate and inflation rises slightly above its long-run objective value, outcomes that future Committees would prefer to act to avoid but are assumed to accept as the price of delivering on the earlier conditional commitment. It is the promise to remain accommodative and not prevent modestly above-target inflation and moderately below-target unemployment in future periods that lowers current long-term interest rates and thereby stimulates activity today. In contrast, “discretionary” optimal policies, which do not constrain future actions, prescribe a considerably more rapid pace of tightening as the economy recovers; this trajectory ensures that inflation rises at most only a bit above 2 percent and that unemployment does not fall appreciably below its natural rate, but also results in substantially poorer economic performance, on average, over the next decade.
We next compare these results under optimal policies with simulated outcomes when the funds rate follows the prescriptions from three simple policy rules that appear regularly in Book B of the Tealbook—the Taylor (1993) rule, the Taylor (1999) rule, and the outcome-based rule.2 As was assumed in the case of optimal policy, the central bank enjoys complete credibility and private agents fully understand the future economic implications of each rule. The Taylor (1999) rule is identical to the original Taylor (1993) rule except that the former puts a higher weight (of unity) on the output gap rather than 0.5 as in the original Taylor rule. Under the outcome-based rule, the federal funds rate adjusts in response to the output gap and the change in the output gap, as well as inflation. For both Taylor rules, we assume a modest degree of interest rate inertia by setting the coefficient on the lagged nominal interest rate to 0.75, which is similar to that in the outcome-based rule. Our results would not be noticeably different if we instead assumed a completely non-inertial rule (that is, a coefficient of zero on the lag of the interest rate), as in the original Taylor rule, though allowing for a modest degree of inertia does improve the performance of the simple rules (relative to the optimal policy) slightly.3
As shown by the green lines in the left-hand column of Figure 1, outcomes under the Taylor (1999) rule are substantially worse than those under the optimal commitment strategy (black lines) though reasonably close to those under the discretion strategy (red-dashed lines). There are two important differences between the Taylor (1999) rule and the optimal strategies. First, the Taylor (1999) rule is somewhat less responsive to resource utilization, which appears to account for the difference between the discretion strategy and the Taylor (1999) outcomes. Second, the commitment strategy involves managing expectations regarding future policy actions and remaining accommodative for a substantially longer period: These conditional
2 The algebraic expressions for each rule appear in the Explanatory Notes attached at the end of each Tealbook B. We ensure that each rule has the long-run steady-state equilibrium real interest rate that is consistent with the staff’s January extended projection. The long-run equilibrium real interest rate is an important factor in the consideration of alternative simple rules (as, for example, uncertainty about this concept can affect the performance of rules in much the same way that uncertainty about the output gap does). This memo is focused on the role of responses to resource utilization and inflation, and hence we do not consider the implications of uncertainty regarding the long-run equilibrium real interest rate. 3 With a coefficient of 0.75 on the lag of the interest rate, the current federal funds rate depends relatively little on developments that occurred more than four or five quarters in the past, which accounts for why the implications are very similar to the non-inertial rule. In contrast, as noted in Section 5, highly inertial rules (a coefficient on the lag of the interest rate exceeding 0.9) can have markedly different implications.
Page 3 of 16
Authorized for public release by the FOMC Secretariat on 02/09/2018

commitments lead to much better performance, on average, with only moderate overshooting of inflation (above its goal) and unemployment (below its goal).
The Taylor (1993) strategy (the purple lines) involves raising the federal funds rate immediately, leading to higher unemployment and inflation further below target over coming years. The outcome-based rule also involves a somewhat earlier increase in the federal funds rate and hence worse outcomes for both policy objectives—although the outcome-based rule is somewhat closer to the Taylor (1999) rule, as it is more responsive to resource utilization than the Taylor (1993) rule. Outcomes under both the Taylor (1993) and outcome-based strategies are further from those under optimal policy than are outcomes under the Taylor (1999) strategy.4
SIGMA Simulations
The right-hand column of Figure 1 reports results for the same policy rules discussed above based on simulations of the staff’s open economy model, SIGMA. SIGMA, like FRB/US, assumes forward-looking behavior both in asset markets and in wage and price setting; however, aggregate demand is more forward looking in SIGMA.
A comparison of the two columns reveals that the relative performance of the alternative strategies for unemployment and inflation is broadly similar in the two models. In SIGMA, the optimal rule is much more successful in reducing unemployment than any of the simple rules. Given that SIGMA embeds a lower degree of intrinsic inflation persistence than FRB/US, the optimal policy involves a larger initial increase in inflation (since it is less costly to bring inflation back down), which lowers real interest rates and contributes to a faster recovery. Among the simple rules, the Taylor (1999) rule performs a bit better than the outcome-based rule. By contrast, the lack of relatively strong accommodation to slack in resource utilization under the Taylor (1993) rule implies markedly higher real interest rates, lower inflation, and higher unemployment.5
3. Performance of rules under two adverse scenarios
We now turn to an evaluation of how each policy rule would operate in both the FRB/US and SIGMA models under two alternative scenarios. Such an analysis is critical to gauging the robustness of the relative performance of the various rules under a range of conditions, and not just under the baseline outlook (particularly as the economy may evolve in quite unexpected ways). In the first scenario, adverse demand shocks lead to a moderately severe recession; in the second scenario, adverse price shocks boost core PCE inflation significantly.
The adverse demand shocks under the recession scenario increase unemployment to around 11 percent in the FRB/US model under the Taylor (1999), Taylor (1993), and outcome-based rule strategies, as can be seen in the left-hand column of Figure 2; as a result, the federal funds rate remains at its effective lower bound until 2016 or later under each strategy, and core PCE prices
4 Table 1 computes welfare losses for each of the alternative policy rules under the assumed quadratic loss function described in Section 2. 5 The staff has not developed methods to compute optimal policy under discretion at the zero lower bound in the SIGMA model.
Page 4 of 16
Authorized for public release by the FOMC Secretariat on 02/09/2018
decline by ½ percent per year for several years starting in 2013. In the SIGMA model, the different strategies lead to more distinct differences in outcomes: The Taylor (1999) rule provides the most accommodation because of its strong response to resource utilization, whereas the Taylor (1993) rule provides the least accommodation; as a result, unemployment and inflation outcomes are closer to objective under the Taylor (1999) strategy than under the other two simple rules, and performance is especially poor under the Taylor (1993) strategy.
In both models, the simple rules do not perform nearly as well as the optimal policy under commitment. In the FRB/US model, optimal policy keeps the unemployment rate from rising much above 10 percent and inflation remains above 1 percent; by contrast, the Taylor (1999) rule allows for a sustained deflation and a much more protracted output contraction. In SIGMA, optimal policy succeeds in boosting inflation well above target, promoting a much faster recovery than under the Taylor (1999) rule. However, these outcomes are only achieved under these commitment strategies by the promise to remain accommodative for a long period, which involves promising to allow unemployment and inflation to notably overshoot their long-run objectives later in the decade.
Figure 3 reports results in response to an adverse shift in inflation (that is, the scenario features “supply” shocks to the Phillips curve). In both models, the optimal strategy is more accommodative in the near-term than the simple rules. In fact, the optimal policy largely avoids an increase in unemployment relative to the modal path, which is highly desirable in the current environment in which unemployment is well above the natural rate. While the simple rules imply a considerably earlier liftoff from the zero lower bound in response to the supply shock, and a fairly rapid pace of tightening thereafter, the optimal policy takes more account of the initially large unemployment gap. For example, the optimal policy keeps the federal funds rate at zero through the end of 2014, while the modified Taylor (1999) rule prescribes a federal funds rate of around 3 percent by that date.
In both models, the real federal funds rate is higher at longer horizons under optimal policy than under the simple rules, which causes inflation to fall significantly below its 2 percent target by 2016. The longer-horizon commitment to tighten policy improves the near-term trade-off between unemployment and inflation relative to the simple rules. Given the high initial level of unemployment, this improved trade-off induces policymakers to pursue a highly accommodative policy in the near-term. In SIGMA, inflation temporarily rises above 4 percent under the optimal policy – noticeably higher than under the simple rules – but this cost is worth bearing to avoid further increases in unemployment. In FRB/US the near-term trade off under the optimal policy is so favorable that the near-term inflation rate is lower even under such an accommodative monetary policy.
4. Simple rules and optimal policy under normal circumstances
We next consider the performance of the alternative rules when the economy is initially operating near full employment, inflation is near target, and the nominal federal funds rate is near its long-run value (that is, under more normal conditions). Such an analysis can help distinguish between those features of optimal policies and simple rule strategies that are related to the current zero-lower bound constraint, and those that are more general.
Page 5 of 16
Authorized for public release by the FOMC Secretariat on 02/09/2018

The blue lines in Figure 4 show the effects of the recession scenario under the outcome-based rule in each model. The shock is normalized to occur in year zero, and the panels show the dynamic responses of nominal interest rates, unemployment, and inflation. In this scenario, aggregate demand weakens enough to push the unemployment rate above 7 percent after two years and inflation declines markedly.
The left-hand column presents results from the FRB/US model. Under the commitment strategy, the federal funds rate is pushed to its effective lower bound for more than three years: As before, a commitment strategy depends upon policymakers having a reputation to deliver on past promises. In this case, the promise is to allow inflation to rise to 2½ percent later on so as to keep unemployment closer to its natural rate in the near-term. The simulations shown here highlight a result we emphasized earlier: The Taylor (1999) strategy is not as responsive to resource utilization and does not mimic the commitments to remain accommodative once activity has recovered that characterize the optimal commitment strategy in the FRB/US model. As a result, the outcomes for inflation and unemployment are not as good. Finally, the Taylor (1993) model delivers worse outcomes for unemployment, while inflation performance is little changed relative to the other simple rules. In the SIGMA model, the relative performance of optimal control and the simple rules is similar to FRB/US.6
Figure 5 reports results in response to an adverse shift in inflation (that is, shocks to the Phillips curve). As discussed in the context of Figure 3, because the optimal policy promises to be less accommodative at longer horizons than the simple rules, it is much more effective in restraining inflation. For example, under optimal policy inflation averages only about 3 percent in the first five years following the shock in FRB/US, compared with about 3½ percent under the Taylor (1999) rule. Although it would be possible to achieve inflation outcomes similar to those obtained under the optimal policy through a simple Taylor rule which reacted much more aggressively to inflation, the outcomes for unemployment would be less palatable than under the optimal rule. Thus, the optimal policy improves the inflation-unemployment tradeoff by refraining from a large upfront tightening of policy, which would lead to a greater rise in unemployment for any given inflation response, and instead makes the (conditional) commitment to keep policy moderately tighter for a protracted period.
On balance, the promise to remain tighter in the future under the optimal policy leads to considerable welfare improvement relative to the simple rules. Although there is some difference in responses across the simple rules, each of them implies a relatively monotonic convergence of inflation to target. Because the optimal policy is able to commit to a persistent undershooting of inflation in the longer-run, it achieves a lower inflation rate in the near-term.
6 In both models, the implications of the Taylor (1999) rule for unemployment and inflation are virtually identical to those of the outcome-based rule. Our previous analysis conditioned on a modal path in which the economy began in recession, and was expected to recover. In that environment, the outcome-based rule – because it reacts to GDP growth, as well as the output gap and inflation – implied a more rapid tightening of policy rates than the modified Taylor rule. The key difference in Figure 4 is that the public recognizes that the outcome-based rule implies a faster decline in policy rates as the economy goes into recession than the modified Taylor (1999) rule; thus, although policy rates are expected to rise more sharply as the economy recovers, the implications for longer-term real interest rates turn out to be very similar under the two rules.
Page 6 of 16
Authorized for public release by the FOMC Secretariat on 02/09/2018

5. Better approximating an optimal commitment strategy with a simple rule
Our simulation results underscore that a simple relatively non-inertial Taylor-style rule does not approximate optimal policy under commitment particularly well, in line with a large academic literature and related staff analysis.
Staff analyses have shown that simple strategies such as flexible price-level targeting – in which policy aims to reverse past inflation shortfalls rather than let bygones be bygones – can approximate optimal strategies under some conditions. Figure 6 illustrates how a form of flexible-price level targeting – nominal income targeting – moves a step closer to the optimal policy under the modal outlook (relative to the Taylor (1999) strategy) in both models. Under a more inertial reaction (than implied by the 0.75 lag coefficient assumed above), a flexible price-level strategy would come even closer to the optimal policy, since the higher inertia means that policy, in effect, takes greater account of past weakness in the economy. The relatively favorable performance of a strategy like nominal income targeting also holds in scenarios involving a recession or rise in inflation, of the type considered in previous sections.7
Although nominal income targeting may be beneficial in certain circumstances, such a strategy may have potentially important shortcomings. Notably, as in the case of the optimal policy, there is a significant commitment problem insofar as the benefits of an inertial nominal income targeting rule in a zero lower bound situation are front-loaded, while the costs, in the form of higher-than-desired inflation and lower-than-desired unemployment, are paid later.
6. Robustness of results to several key issues
Our analysis thus far has focused on a limited set of simulations using the FRB/US and SIGMA models. The results are robust to some key considerations; that said, several issues clearly limit their generality and deserve further investigation.
One possible concern is the robustness of the results to alternative views of how the economy operates. One way of looking at this issue is to consider the robustness of these results to model uncertainty. FRB/US and SIGMA represent distinctly different modeling approaches – one being somewhat more data-based and the other placing a larger emphasis on behavioral foundations for specific equations. Researchers have investigated issues similar to those we have considered in a range of macroeconomic models, and, in general, have suggested conclusions similar to ours. For example, Woodford (2011) discusses how the importance of commitment strategies at the zero lower bound is a central aspect of optimal strategies (that is absent from the simple rules we consider). Levin, Wieland, and Williams (1999) examined the performance of a range of simple rules in four macroeconometric models (including FRB/US): They concluded that, in general, policy strategies in which the federal funds rate responded with very persistent accommodation or tightening in response to shocks (a feature sometimes called history-
7 The nominal income interest rate rule and its performance in a range of scenarios similar to those examined here was discussed in Michael Kiley, Christopher Erceg, and David López-Salido, “Alternative Monetary Policy Frameworks,” memo sent to the Committee on October 6, 2011. In that memo, the lag on the interest rate in the reaction function was set to 0.9, allowing nominal income targeting to come much closer to the optimal policy than in Figure 6.
Page 7 of 16
Authorized for public release by the FOMC Secretariat on 02/09/2018

dependence, and which characterizes commitment strategies) dominated rules without this feature; they also showed that the Taylor (1993) and Taylor (1999) rules delivered, on average, fairly similar performance in the situations they considered.
A further issue that is important in practice is the robustness of alternative strategies to mis-measurement of the output gap. Orphanides et al. (1999) showed that errors in output gap measurement should lead policymakers to respond less to the output gap than they would in the absence of such errors. Nonetheless, the best rules in their analysis had a greater short-run responsiveness to the output gap than the inertial Taylor (1999) rule we considered. Moreover, their analysis also suggested that it remained superior to respond to the level of the output gap, rather than its change, for reasonable assumptions regarding output gap mis-measurement. Similarly, Taylor and Williams (2011) summarized research on how mis-measurement of resource utilization affects the performance of simple rules, and concluded that a high degree of inertia and a sizable short-run response to resource utilization remains a feature of good rules in the face of moderate mis-measurement of utilization. However, they also interpreted the literature as supporting a potentially important role for responding to the change in resource utilization (in addition to the level) when the risk of greatly mis-measuring slack is large.
Finally, a central reason why our analysis suggests an important role for strategies in which policy accommodation remains highly persistent in response to current and past shortfalls in demand (that is, history-dependence) in the current environment is that our models assume an important role for expected future short-term interest rates in aggregate demand determination. This echoes the finding in the related literature (for example, Levin et al (1999) and Woodford (2011)): For example, Levin et al. (1999) emphasized how the central role for history dependence arose because, in the range of models they considered, expected short-term interest rates, through their effect on long-term interest rates, are the key channel through which monetary policy strategies affect inflation and unemployment. Of course, the role of expectations implies that all of the strategies we discuss rely on credible communication that allows the public to understand the policy strategy. In the absence of such understanding, it is likely that some of our key results would be weaker or could even be overturned: For example, commitment strategies yield no benefits, and would even be costly, if the commitments had no influence on long-term interest rates and aggregate demand; the benefits of such strategies would also be smaller if expectations adjusted only very slowly to the announced strategy. At the extreme, history-dependent strategies have been shown to perform very poorly in models in which expectations regarding interest rates or inflation are purely backward looking, such as in the widely analyzed simple model of Rudebusch and Svensson (1999).
Page 8 of 16
Authorized for public release by the FOMC Secretariat on 02/09/2018

References
Taylor, John B. (1993). “Discretion versus Policy Rules in Practice,” Carnegie-Rochester
Conference Series on Public Policy, vol. 39 (December), pp. 195-214.
Taylor, John B. (1999). “A Historical Analysis of Monetary Policy Rules,” in John B. Taylor,
ed., Monetary Policy Rules. University of Chicago Press, pp. 319-341.
Levin, Andrew T., Volker Wieland and John Williams (1999). “Robustness of Simple Monetary Policy Rules under Model Uncertainty,” in John B. Taylor, ed., Monetary Policy Rules. University of Chicago Press, pp. 263-299.
Levin, Andrew T., Volker Wieland, John C. Williams (2003). “The Performance of Forecast-Based Monetary Policy Rules under Model Uncertainty,” The American Economic Review, Vol. 93, No. 3 (Jun., 2003), pp. 622-645.
Orphanides, Athanasios, Richard D. Porter, David Reifschneider, Robert Tetlow, and Federico Finan (2000). “Errors in the measurement of the output gap and the design of monetary policy,” Journal of Economics and Business, vol. 52(1-2), pp. 117-141.
Svensson, Lars and Glenn Rudebusch (1999). “Policy Rules for Inflation Targeting,” in John B. Taylor, ed., Monetary Policy Rules. University of Chicago Press, pp. 203-246.
Taylor, John and John Williams (2011). “Simple and Robust Rules for Monetary Policy,” in B.M. Friedman and M. Woodford, eds., Handbook of Monetary Economics, vol. 3B, pp.829-860.
Woodford, Michael (2011). “Optimal Monetary Stabilization Policy,” in B.M. Friedman and M. Woodford, eds., Handbook of Monetary Economics, vol. 3B, 2011.
Page 9 of 16
Authorized for public release by the FOMC Secretariat on 02/09/2018

Unemp. Loss Inflation Loss Total Loss Unemp. Loss Inflation Loss Total Loss
Commitment 51.7 1.4 54.8 21.6 14.8 38.4Outcome‐based 77.3 9.4 87.5 77.8 6.5 84.8Taylor 1993 87.8 11.6 99.9 130.5 21.9 152.9Taylor 1999 67.6 4.6 72.9 63.8 2.9 67.2
Unemp. Loss Inflation Loss Total Loss Unemp. Loss Inflation Loss Total Loss
Commitment 227.7 29.4 261.0 51.9 16.0 69.5Outcome‐based 315.4 105.8 422.4 309.5 26.3 336.5Taylor 1993 304.0 92.0 397.1 461.6 62.2 524.8Taylor 1999 299.4 90.1 391.0 215.2 11.2 227.1
Unemp. Loss Inflation Loss Total Loss Unemp. Loss Inflation Loss Total Loss
Commitment 61.2 22.4 85.6 57.0 64.0 123.4Outcome‐based 97.4 68.4 167.4 114.8 44.1 159.8Taylor 1993 119.4 83.8 204.5 195.7 28.4 224.7Taylor 1999 78.5 126.7 206.6 87.7 67.2 155.8
Unemp. Loss Inflation Loss Total Loss Unemp. Loss Inflation Loss Total Loss
Commitment 23.7 17.4 47.0 7.0 0.1 7.8Outcome‐based 30.0 38.9 74.5 18.0 3.4 22.3Taylor 1993 40.7 39.5 82.6 29.0 4.1 33.7Taylor 1999 30.7 37.3 72.1 19.3 1.9 21.7
Unemp. Loss Inflation Loss Total Loss Unemp. Loss Inflation Loss Total LossCommitment 12.1 23.8 36.3 33.8 11.9 45.8Outcome‐based 7.6 46.2 54.4 6.8 46.8 53.9Taylor 1993 7.3 41.5 49.3 10.7 48.0 59.1Taylor 1999 5.1 52.2 57.8 4.2 53.2 57.7
Welfare losses are, for unemployment, the sum of the squared deviations of unemployment from its natural rate; for inflation, the sum of the squared
deviations of inflation from 2 percent. Total losses also include the sum of the squared quarter on quarter changes in the fed funds rate. The losses are
calculated for each variable over a 15‐year horizon, and are discounted at 4 percent per annum.
Welfare Losses under normal circumstances
FRB/US SIGMA
Recession Scenario
Adverse Price Shock
Table 1: Welfare Losses under Alternative Rules
Adverse Price Shock
Welfare Losses at the Zero Lower Bound
FRB/US SIGMA
Current Economic
Outlook
Recession Scenario
Page 10 of 16
Authorized for public release by the FOMC Secretariat on 02/09/2018
2012 2014 2016 2018 20200
1
2
3
4
5
6Nominal Fed Funds Rate, FRB/US
Figure 1: Outcomes for Different Rules, Modal Outlook
CommitmentDiscretionOutcome−basedTaylor 1993Taylor 1999
2012 2014 2016 2018 20200
1
2
3
4
5
6Nominal Fed Funds Rate, SIGMA
2012 2014 2016 2018 20204
5
6
7
8
9
10
11Unemployment Rate, FRB/US
2012 2014 2016 2018 20204
5
6
7
8
9
10
11Unemployment Rate, SIGMA
2012 2014 2016 2018 20200
0.5
1
1.5
2
2.5
3
3.5Inflation (4−quarter), FRB/US
Year2012 2014 2016 2018 2020
0
0.5
1
1.5
2
2.5
3
3.5Inflation (4−quarter), SIGMA
Year
Page 11 of 16
Authorized for public release by the FOMC Secretariat on 02/09/2018

2012 2014 2016 2018 20200
2
4
6
8Nominal Fed Funds Rate, FRB/US
Figure 2: Outcomes for Different Rules, Recession Scenario
CommitmentOutcome−basedTaylor 1993Taylor 1999
2012 2014 2016 2018 20200
2
4
6
8Nominal Fed Funds Rate, SIGMA
2012 2014 2016 2018 2020
4
6
8
10
12
Unemployment Rate, FRB/US
2012 2014 2016 2018 2020
4
6
8
10
12
Unemployment Rate, SIGMA
2012 2014 2016 2018 2020
−1
0
1
2
3
Inflation (4−quarter), FRB/US
Year2012 2014 2016 2018 2020
−1
0
1
2
3
Inflation (4−quarter), SIGMA
Year
Page 12 of 16
Authorized for public release by the FOMC Secretariat on 02/09/2018

2012 2014 2016 2018 20200
1
2
3
4
5
6Nominal Fed Funds Rate, FRB/US
Figure 3: Outcomes for Different Rules, Adverse Price Shock
Commitment
Outcome−based
Taylor 1993
Taylor 1999
2012 2014 2016 2018 20200
1
2
3
4
5
6Nominal Fed Funds Rate, SIGMA
2012 2014 2016 2018 20204
5
6
7
8
9
10
11Unemployment Rate, FRB/US
2012 2014 2016 2018 20204
5
6
7
8
9
10
11Unemployment Rate, SIGMA
2012 2014 2016 2018 20200
1
2
3
4
5Inflation (4−quarter), FRB/US
Year2012 2014 2016 2018 2020
0
1
2
3
4
5Inflation (4−quarter), SIGMA
Year
Page 13 of 16
Authorized for public release by the FOMC Secretariat on 02/09/2018

0 2 4 6 80
1
2
3
4
5
6
7Nominal Fed Funds Rate, FRB/US
Figure 4: Outcomes for Different Rules, Recession (Normal Conditions)
Commitment
Outcome−based
Taylor 1993
Taylor 1999
0 2 4 6 80
1
2
3
4
5
6
7Nominal Fed Funds Rate, SIGMA
0 2 4 6 8
4
5
6
7
8Unemployment Rate, FRB/US
0 2 4 6 8
4
5
6
7
8Unemployment Rate, SIGMA
0 2 4 6 80
0.5
1
1.5
2
2.5
3Inflation (4−quarter), FRB/US
Year0 2 4 6 8
0
0.5
1
1.5
2
2.5
3Inflation (4−quarter), SIGMA
Year
Page 14 of 16
Authorized for public release by the FOMC Secretariat on 02/09/2018

0 2 4 6 82
3
4
5
6
7
8Nominal Fed Funds Rate, FRB/US
Figure 5: Outcomes for Different Rules, Price Shock (Normal Conditions)
Commitment
Outcome−based
Taylor 1993
Taylor 1999
0 2 4 6 82
3
4
5
6
7
8Nominal Fed Funds Rate, SIGMA
0 2 4 6 84.5
5
5.5
6
6.5
7
7.5Unemployment Rate, FRB/US
0 2 4 6 84.5
5
5.5
6
6.5
7
7.5Unemployment Rate, SIGMA
0 2 4 6 80
1
2
3
4
5Inflation (4−quarter), FRB/US
Year0 2 4 6 8
0
1
2
3
4
5Inflation (4−quarter), SIGMA
Year
Page 15 of 16
Authorized for public release by the FOMC Secretariat on 02/09/2018

2012 2014 2016 2018 20200
1
2
3
4
5
6Nominal Fed Funds Rate, FRB/US
Figure 6: Outcomes for Different Rules, Modal Outlook
CommitmentTaylor 1999Nominal Income Targeting
2012 2014 2016 2018 20200
1
2
3
4
5
6Nominal Fed Funds Rate, SIGMA
2012 2014 2016 2018 20204
5
6
7
8
9
10
11Unemployment Rate, FRB/US
2012 2014 2016 2018 20204
5
6
7
8
9
10
11Unemployment Rate, SIGMA
2012 2014 2016 2018 20200
0.5
1
1.5
2
2.5
3
3.5Inflation (4−quarter), FRB/US
Year2012 2014 2016 2018 2020
0
0.5
1
1.5
2
2.5
3
3.5Inflation (4−quarter), SIGMA
Year
Page 16 of 16
Authorized for public release by the FOMC Secretariat on 02/09/2018