simple epidemic models
TRANSCRIPT
Simple epidemic models
• Construct ODE (Ordinary Differential Equation) models
• Relationship between the diagram and the equations
• Alter models to include other factors.

2
Simple
epidemics
Solve directly
(mathy)
Time-series
equations
Solution
over time
Phase-portrait
(picture)
Time is
implicit
Equilibria
(ODEs = 0)
Stability of
equilibria
SIR model
Diagram Model
SIR with vaccination
Diagram Model
SIR with mutation
Diagram Model
SIS model
Diagram Model
Ordinary Differential Equations(ODEs)
• ODEs deal with populations, not individuals
• We assume the population is well-mixed• We keep track of the inflow and the
outflow.
ODEs = Ordinary Differential Equations
SIS epidemic
• SusceptibleàInfectedàSusceptible• You get sick, then recover, but without
immunity• E.g. the common cold.
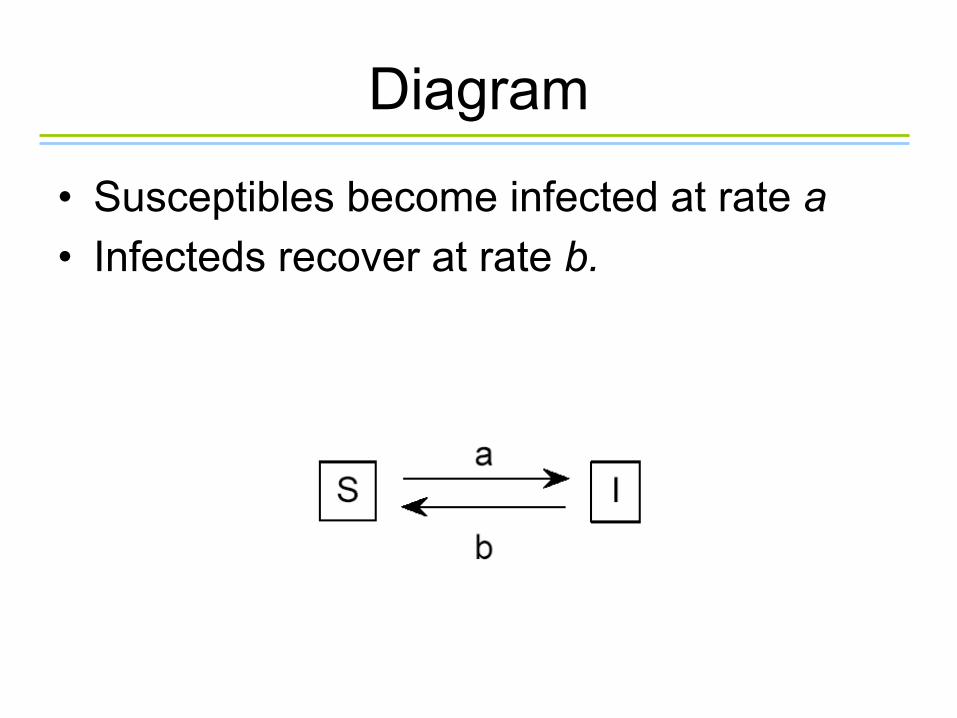
Diagram
• Susceptibles become infected at rate a• Infecteds recover at rate b.

SIS equations
• Becoming infected depends on contact between Susceptibles and Infecteds (aSI)
• Recovery is at a constant rate, proportional to number of Infecteds (b).
a = infection rateb = recovery rate
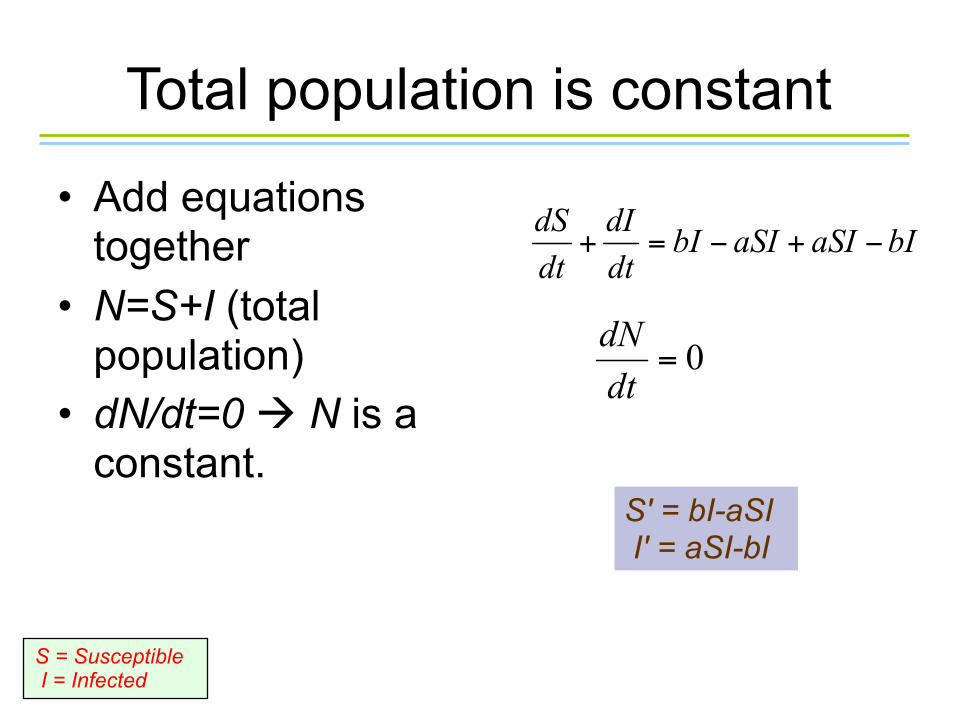
Total population is constant
• Add equations together
• N=S+I (total population)
• dN/dt=0 à N is a constant.
S = Susceptible I = Infected
S' = bI-aSI I' = aSI-bI
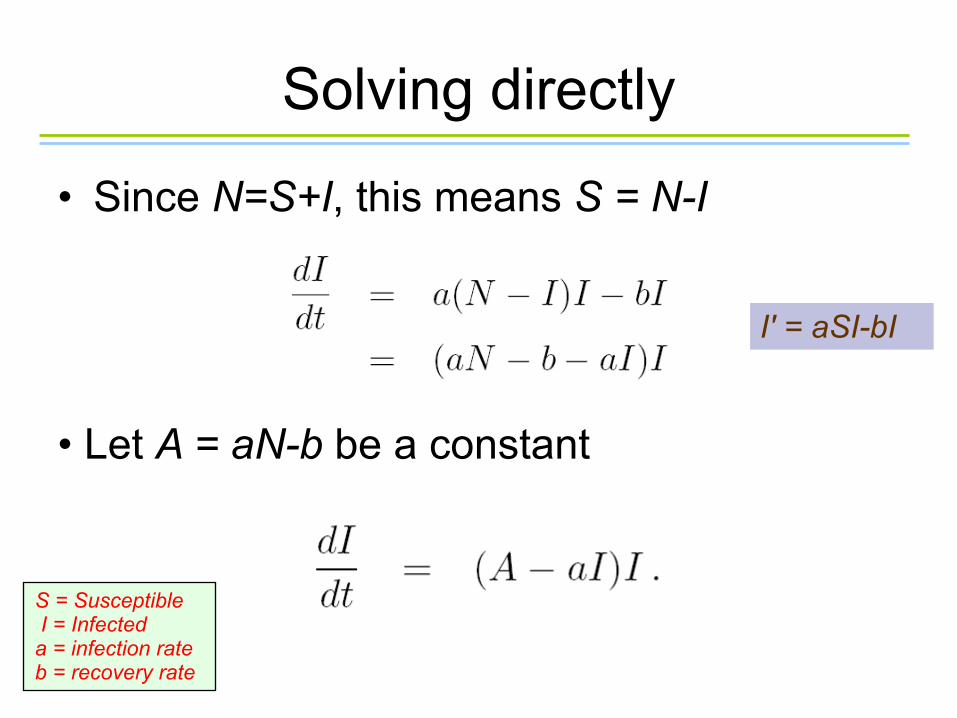
Solving directly
• Since N=S+I, this means S = N-I
• Let A = aN-b be a constant
S = Susceptible I = Infecteda = infection rate b = recovery rate
I' = aSI-bI
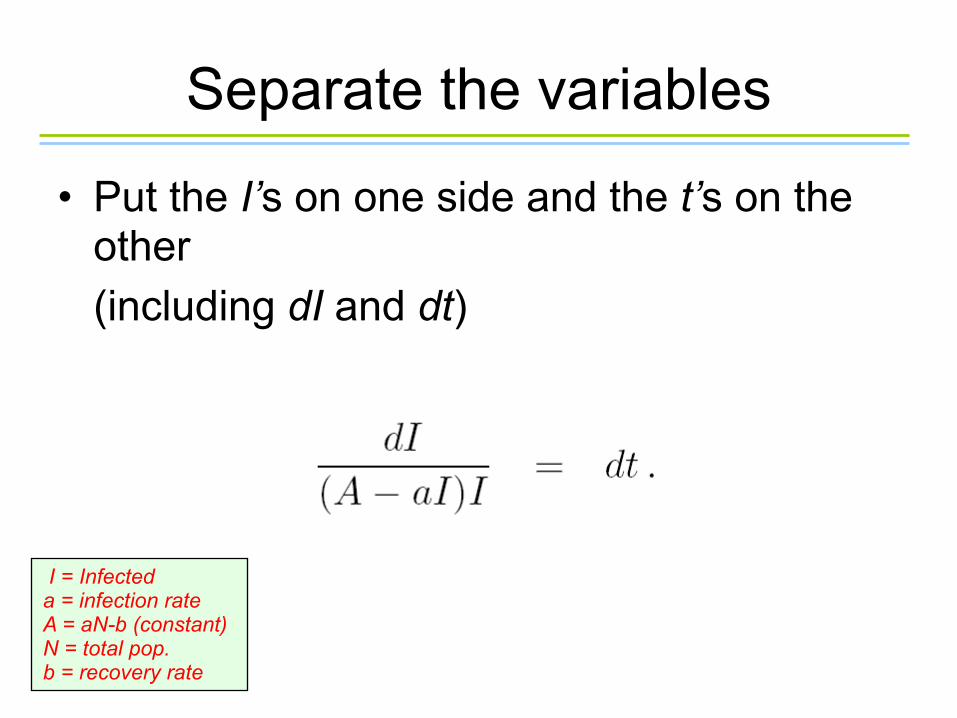
Separate the variables
• Put the I’s on one side and the t’s on the other(including dI and dt)
I = Infecteda = infection rate A = aN-b (constant)N = total pop.b = recovery rate
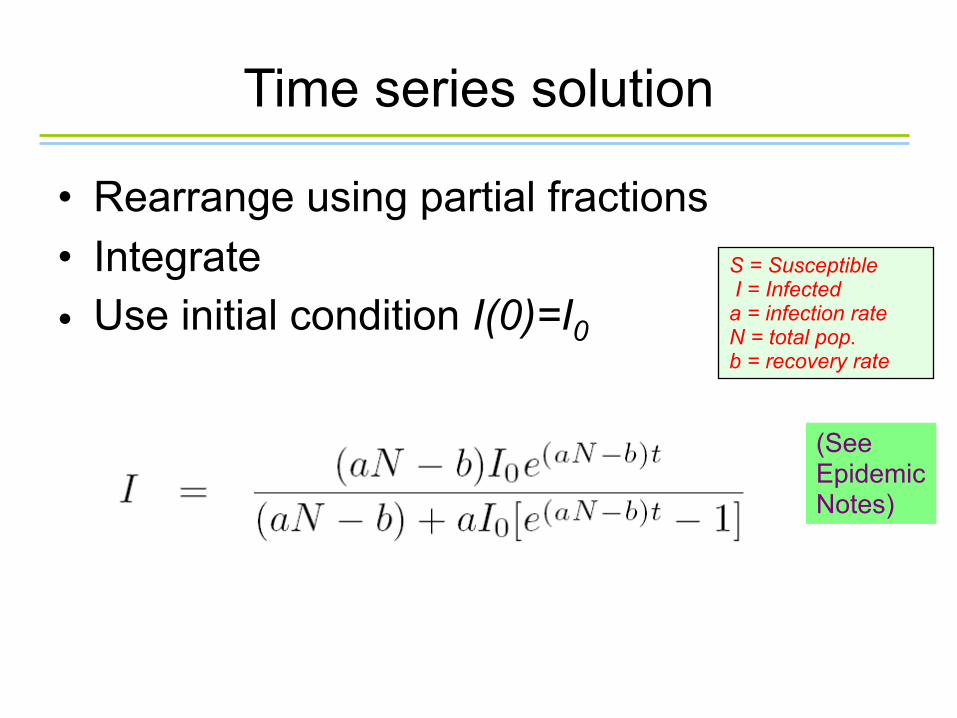
Time series solution
• Rearrange using partial fractions • Integrate• Use initial condition I(0)=I0
S = Susceptible I = Infecteda = infection rate N = total pop.b = recovery rate
(See Epidemic Notes)
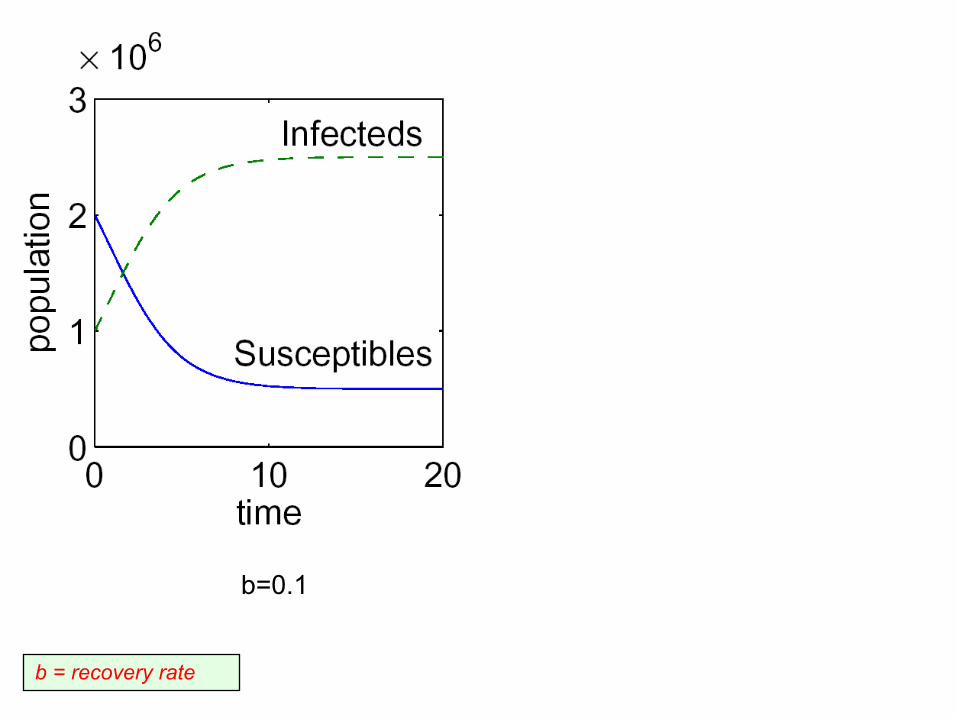
b = recovery rate
b=0.1 b=0.7
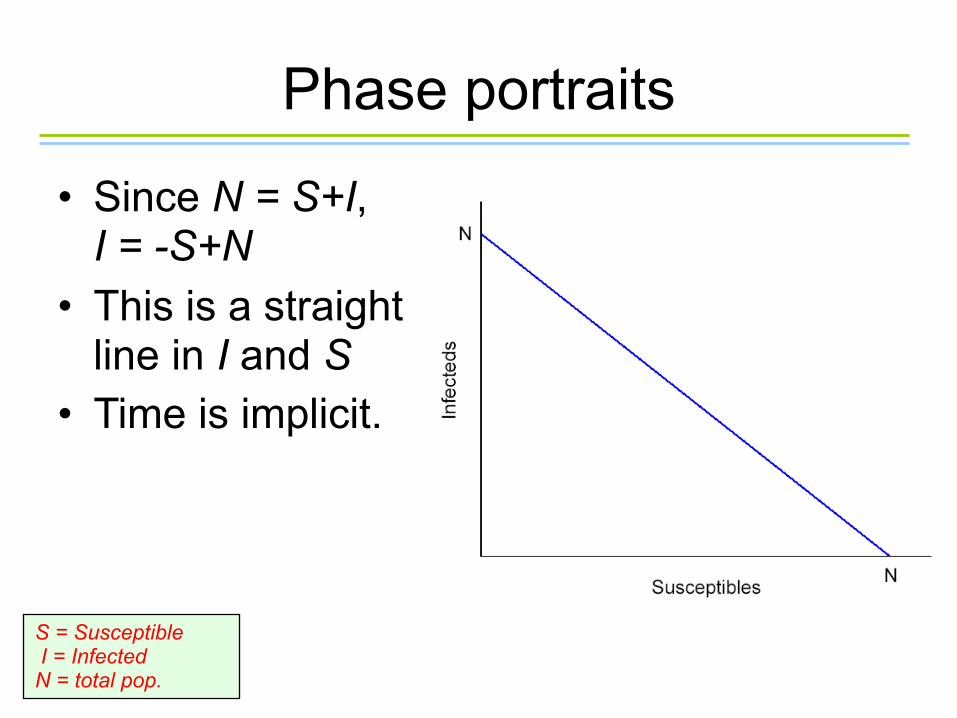
Phase portraits
• Since N = S+I, I = -S+N
• This is a straight line in I and S
• Time is implicit.
S = Susceptible I = InfectedN = total pop.
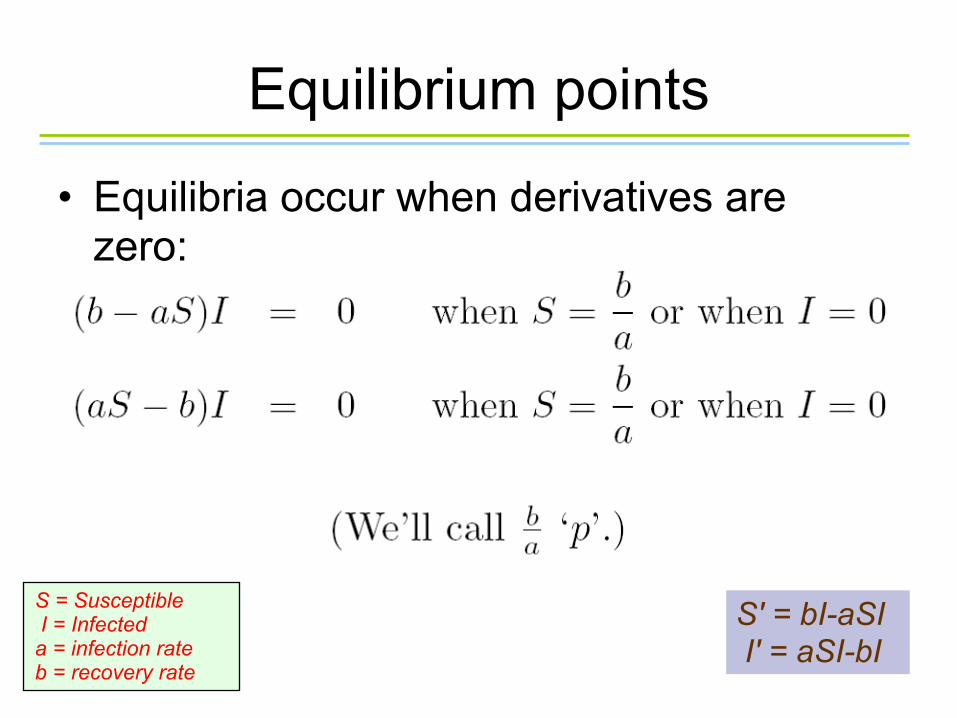
Equilibrium points
• Equilibria occur when derivatives are zero:
S = Susceptible I = Infecteda = infection rate b = recovery rate
S' = bI-aSI I' = aSI-bI

Two equilibria
• Thus our equilibrium points are
• The latter always exists, the former is only biologically reasonable if p<N.
S = Susceptible I = InfectedN = total pop. p = b / ab = recovery rate a = infection rate
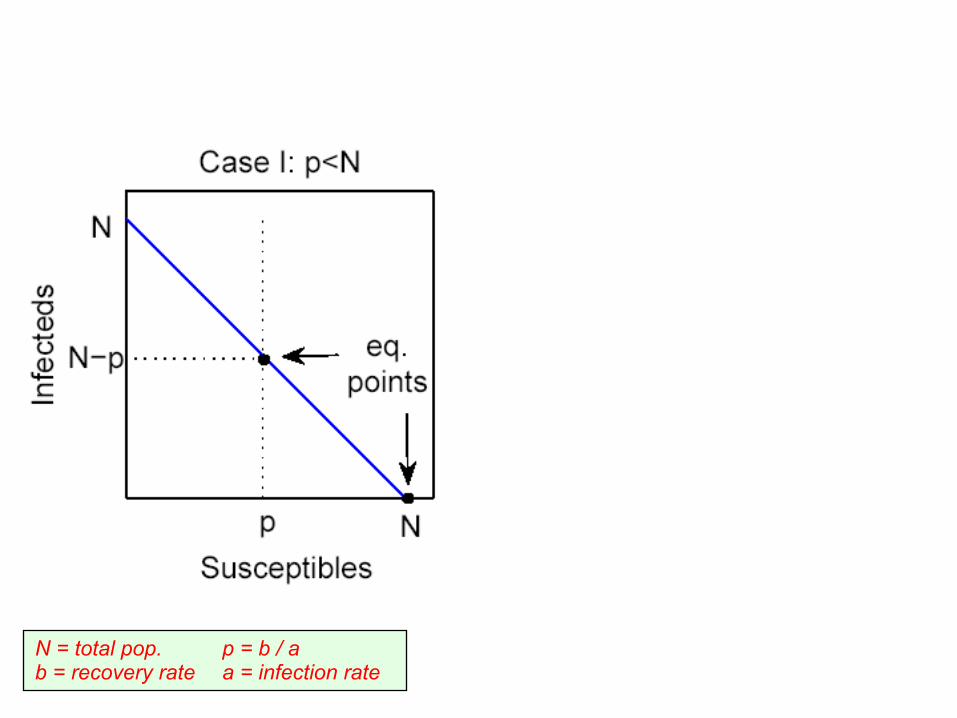
N = total pop. p = b / ab = recovery rate a = infection rate
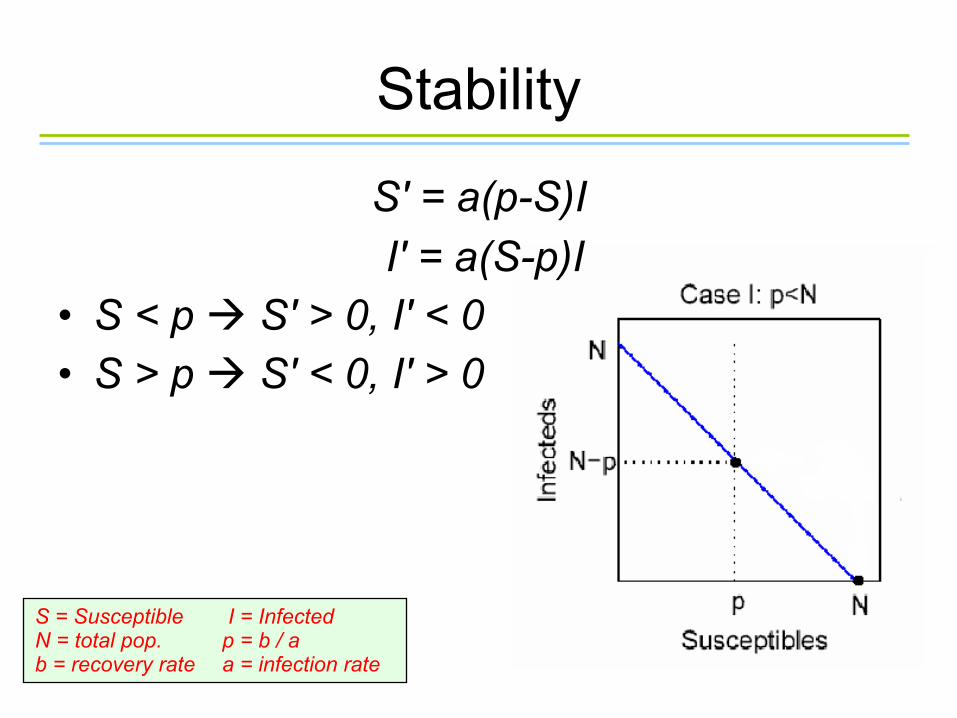
Stability
S = Susceptible I = InfectedN = total pop. p = b / ab = recovery rate a = infection rate
S' = a(p-S)I I' = a(S-p)I
• S < p à S' > 0, I' < 0• S > p à S' < 0, I' > 0
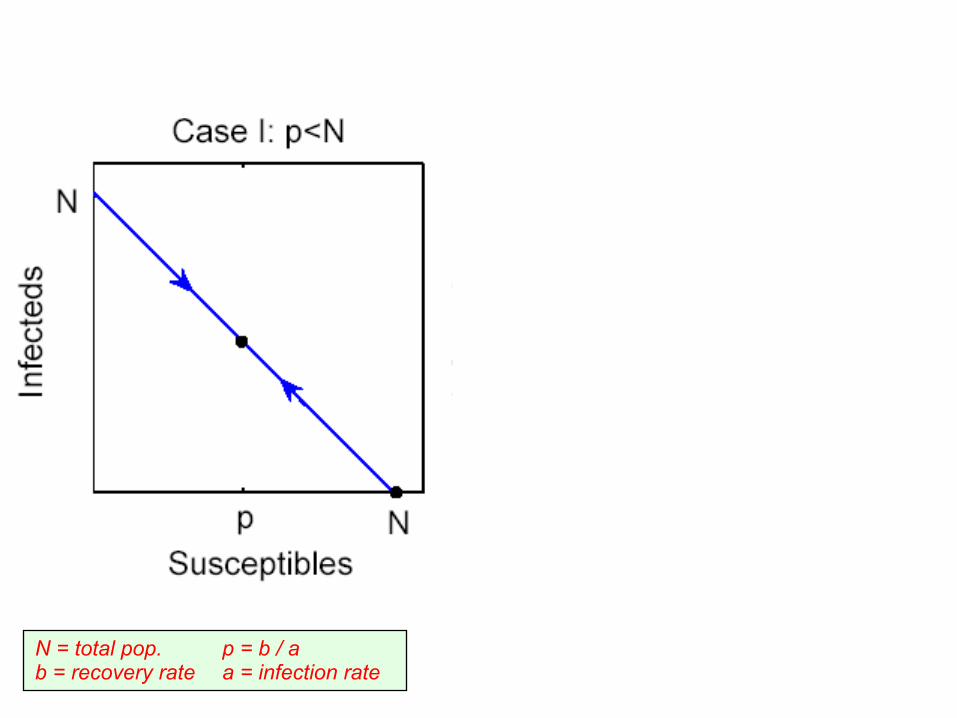
N = total pop. p = b / ab = recovery rate a = infection rate
Stability implications
• When p=b/a>N, the recovery rate is high, so infecteds recover quickly and the population moves to a population of susceptibles
• When p=b/a<N, the infection rate is high and the infection stabilises at an endemic equilibrium.
N = total pop.b = recovery ratea = infection rate
19
Simple
epidemics
Solve directly
(mathy)
Time-series
equations
Solution
over time
Phase-portrait
(picture)
Time is
implicit
Equilibria
(ODEs = 0)
Stability of
equilibria
SIR model
Diagram Model
SIR with vaccination
Diagram Model
SIR with mutation
Diagram Model
SIS model
Diagram Model
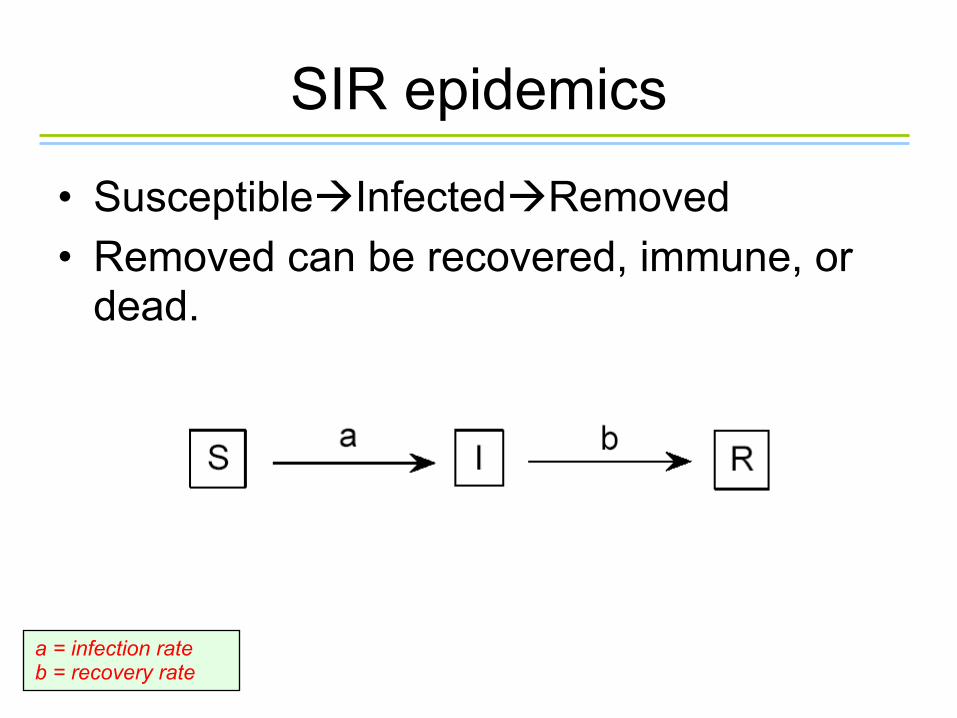
SIR epidemics
• SusceptibleàInfectedàRemoved• Removed can be recovered, immune, or
dead.
a = infection rateb = recovery rate
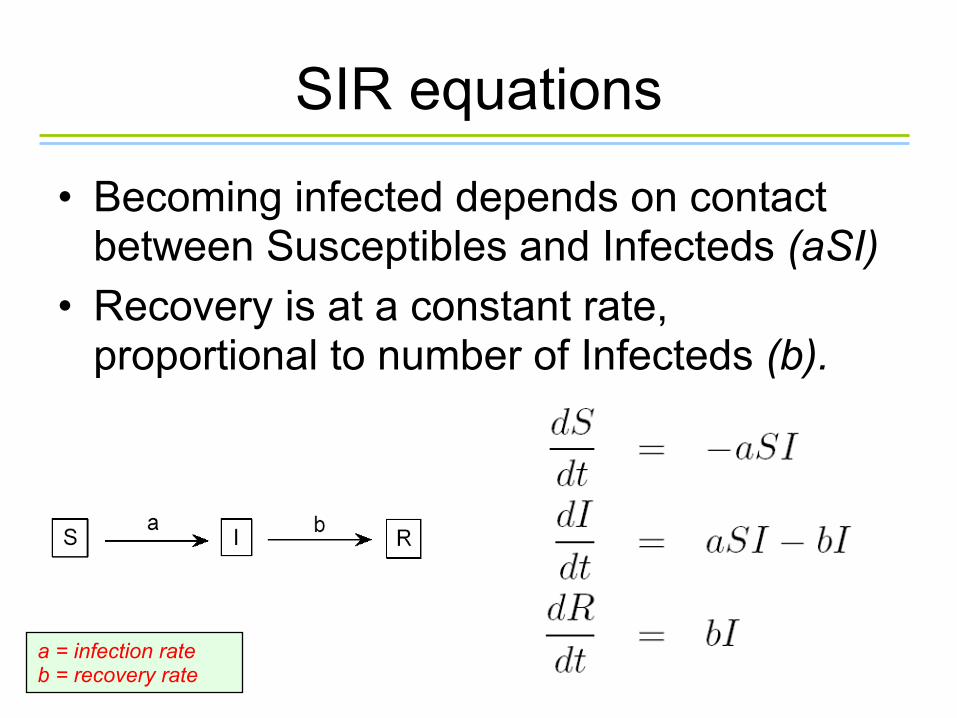
SIR equations
• Becoming infected depends on contact between Susceptibles and Infecteds (aSI)
• Recovery is at a constant rate, proportional to number of Infecteds (b).
a = infection rateb = recovery rate
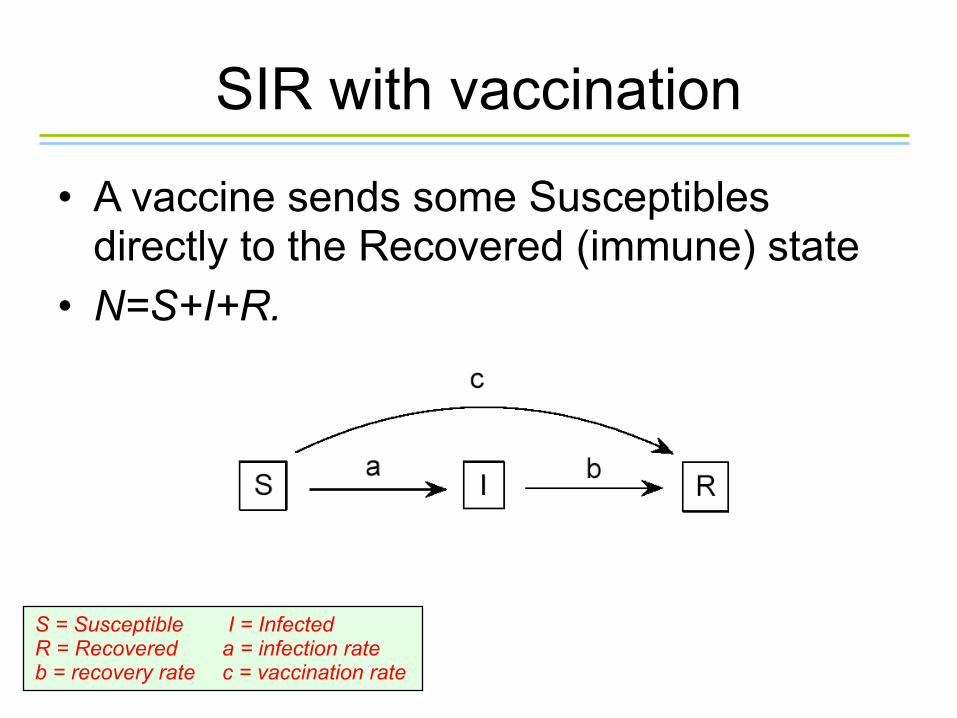
SIR with vaccination
• A vaccine sends some Susceptibles directly to the Recovered (immune) state
• N=S+I+R.
S = Susceptible I = InfectedR = Recovered a = infection rateb = recovery rate c = vaccination rate
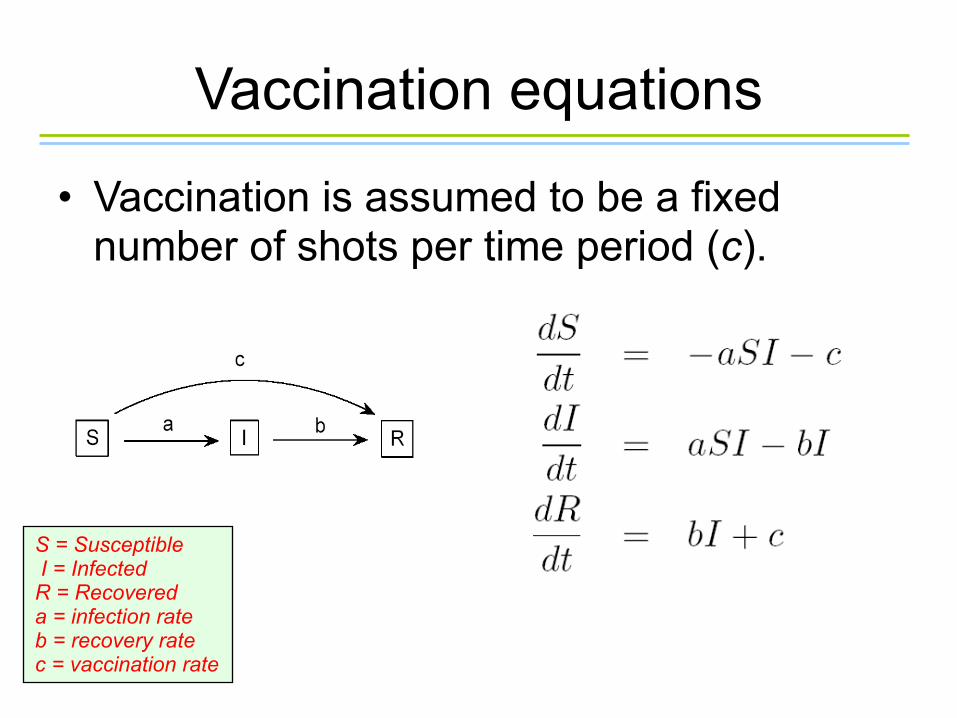
Vaccination equations
• Vaccination is assumed to be a fixed number of shots per time period (c).
S = Susceptible I = InfectedR = Recovereda = infection rateb = recovery ratec = vaccination rate
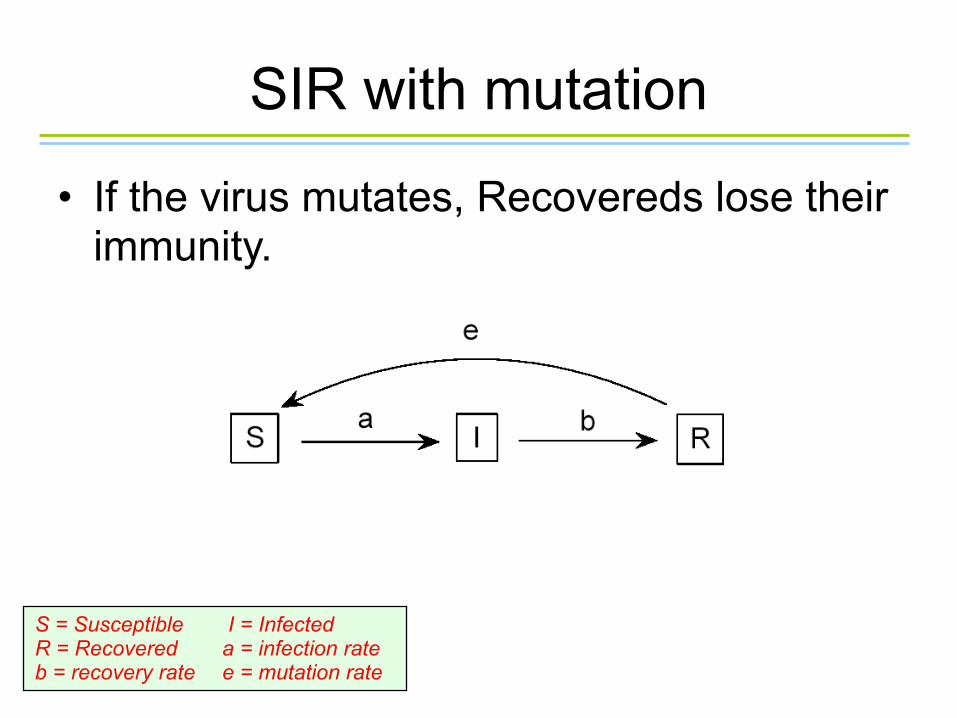
SIR with mutation
• If the virus mutates, Recovereds lose their immunity.
S = Susceptible I = InfectedR = Recovered a = infection rateb = recovery rate e = mutation rate
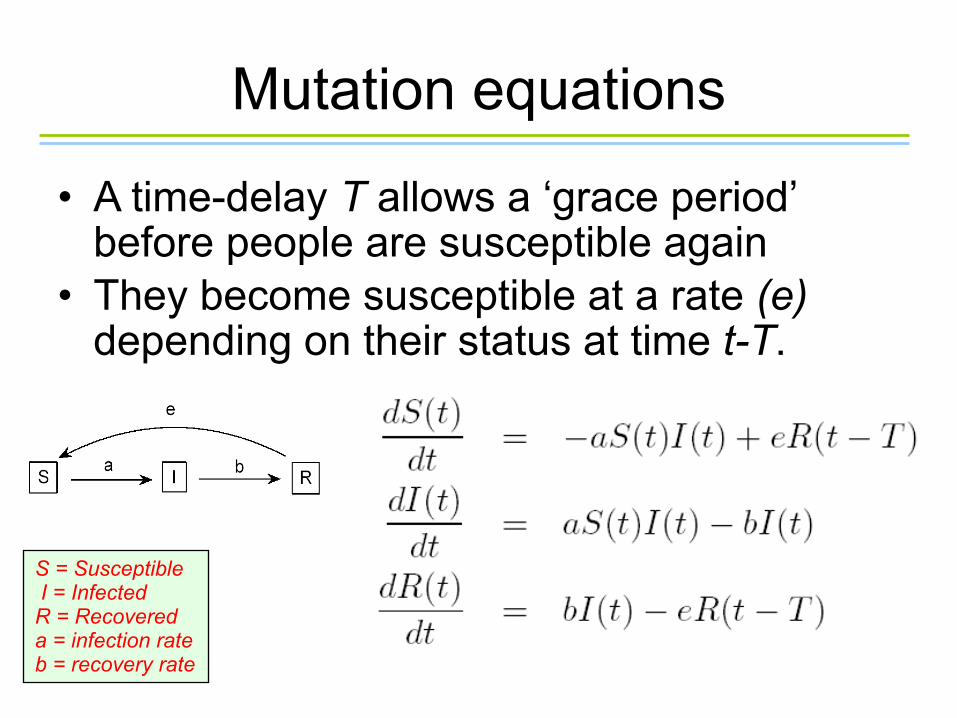
Mutation equations
• A time-delay T allows a ‘grace period’ before people are susceptible again
• They become susceptible at a rate (e) depending on their status at time t-T.
S = Susceptible I = InfectedR = Recovereda = infection rateb = recovery rate
Delay Differential Equations
• These are called delay-differential equations
• They are harder to analyse than ordinary differential equations, but are often more realistic.