similarity: its definition and effect on the visual analysis of complex displays
TRANSCRIPT
Perception & Psychophysics1976, Vol. 19(5),405·411
Similarity: Its definition and effecton the visual analysis of complex displays
MARTIN H. SINGER and JOSEPH S. LAPPINVanderbilt University, Nashville, Tennessee 37240
Contemporary feature models of form perception have typically defined visual similarity in termsof shared (or discordant) sets of points. Two experiments tested the adequacy of this definition. 41a same/different task, subjects were required to detect a single "different" form in displays of two.four, or six forms. In separate conditions, the "different" form was produced by various geometrietransformations, where the number of discordant points could be held constant for some of thosetransformations. The first experiment compared the detectability of three transformations: deletionof an end-of-a-line segment, a break in continuity, and a mirror-image reversal. Reversals weredetected most rapidly and accurately, with performance independent of display size. Althoughbreaks and deletions produced the same number of discordant points, breaks were detected morerapidly and accurately. The second experiment tested whether the better detectability of reversalswas due to a greater number of discordant points or to changes in the orientation of diagonal lines.The results indicated that entire displays can be rapidly organized (in "parallel") on the basis of lineorientations. In general, the experiments suggest that the similarity of forms may depend upon thetransformations by which they are related rather than their common features.
The speed with which subjects can detect a visualform embedded in a complex display depends on thesimilarity among the displayed forms. In visualsearch tasks, where subjects are asked to detect thepresence of a specified "target," speed and accuracyof detection improve as the similarity or confusability of the target and "noise" items isdecreased, and also improve as the similarity of thevarious "noise" items is increased (Atkinson,Holmgren, & Juola, 1969; Estes, 1972). Indeed,when the target and noise items are dissimilar andwhen the noise items are homogeneous, speed andaccuracy are often found to be independent of display size (in contrast to the more typical decline inperformance with increasing display size). This hasbeen demonstrated by Mclntyre, Fox, and Neale(\ 970), as well as by Estes (1972).
The proper definition and measure of similarity,however, are uncertain. Two alternative approachescan be identified. One approach characterizes similarity as a result of the analysis of a form's component parts or "features" (Estes, 1972; Reed, 1973;Shiffrin & Geisler, 1973; Wolford, 1975). Thesimilarity of two forms could thus be measured bythe number of common features shared by the two
This research was supported in pan by Public Health ServiceGrant MH 21105. The report was written while the authors weresupported by grants from the Spencer Foundation and theVanderbilt University Research Council. The authors gratefullyacknowledge the excellent computer programming assistanceof Melanae Schnurr and the creative assistance of Brian Kottas indeveloping the second experiment. This paper was presented atMPA, 1975. Requests for reprints should be sent to Martin Singer,Department of Psychology, Vanderbilt University, Nashville,Tennessee 37240.
forms. Another approach, gestalt in nature, emphasizes the importance of relationships within andbetween various forms. Accordingly, similarity mightbe defined by the transformations required to changeone form into the other.
Estes' (1972) model provides a detailed example ofthe feature approach. Estes argues that the effects ofsimilarity can be explained in terms of interactionsamong visual channels that provide input to featuredetectors. Similar items activate overlapping sets offeature detectors. Noise items that are similar to thetarget can thus be confused with the target. Furthermore, because the input channels have the capabilityto interact and can prevent the further processingof redundant information, homogeneous noise itemstend to inhibit each other and, as a result, increasethe salience of the target.
While it is not exactly clear what comprises a"feature" in most feature models, the definitionemployed by Mclntyre et aI. (1970) usually seemsimplicit. That is, "an estimate of the similaritybetween any pair of letters can be made by conceptually superimposing the pair and counting thenumber of physical features they have in common"(p. 330). In other words, features appear to be subsets of points and dissimilarity might be measured bythe number of discordant points.
Although feature models account for most of thepublished results on the processing of briefly presented visual displays, Egeth, Atkinson, Gilmore,and Marcus (1973) note exceptions. First, in somevisual search tasks where noise items were heterogeneous, reaction time (RT) remained constantacross different display sizes (Egeth, Jonides, &
405
406 SINGER AND LAPPIN
PROTOTYPES ~ ~ ~ LjDELETIONS ( cD~
BREAKS ~ ~ ~ ~
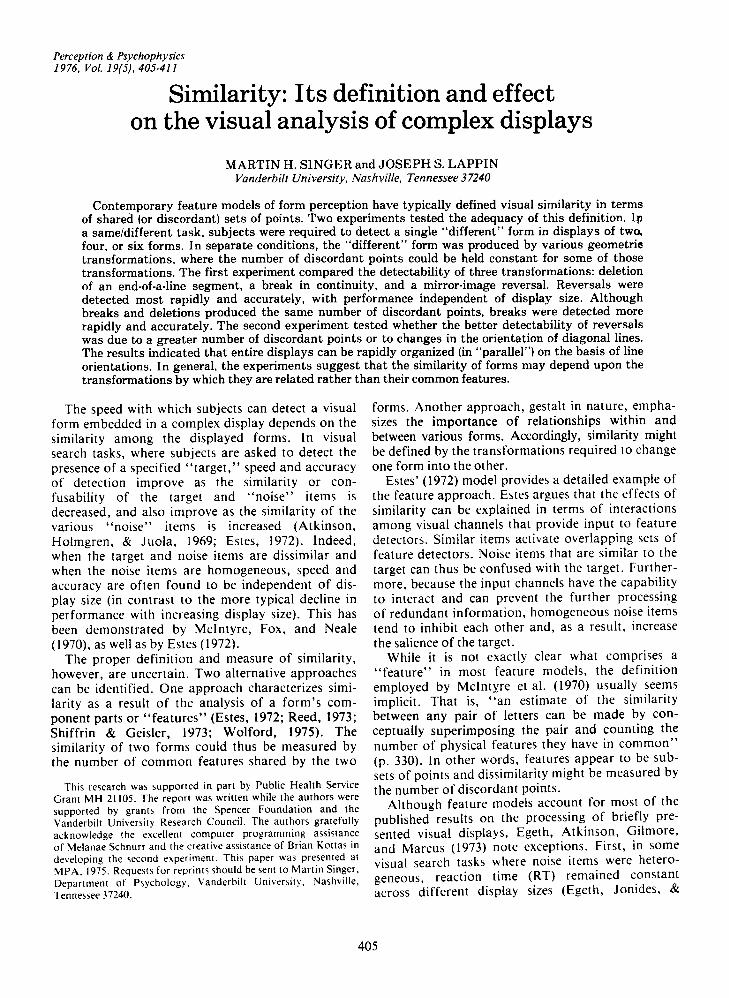
REVERSALS ~ ~ rJ LJFigure I. The prototypes and their three respective transforms
that were used in Experiment I are displayed above.
Wall, 1972). Secondly, Jonides and Gleitman (1972)demonstrated that the "conceptual category" oftarget and noise elements can alter the relationshipbetween RT and display size. In that experiment,"0" was the target and noise items were either allletters or all digits. Subjects were told to either detectthe letter "oh" or the numeral zero. When the "conceptual category" of the target and noise itemsdiffered, RT remained invariant with respect todisplay size. When target and noise elements sharedthe same category, however, RT increased as a function of display size. The results are particularlyinteresting in that target characteristics (e.g., features)remained constant across conditions.
The alternative to the hypothesis that form perception is derived from feature detection, as mentionedearlier, is to suppose that the perceptual system issensitive to relationships within and among forms.Just as the detectability of a target depends on itssimilarity with the other displayed forms (Neisser,1967), it seems likely that the relevant properties of afeature depend upon its context within the wholeform. This approach seems compatible with therationale and results of same/different experiments,in which the subject is asked to determine whetheror not a set of forms is identical. A common findingin such a task is that even "same" displays arerapidly detected, independently of display size.Bamber (1969) has suggested the operation of an"identity detector" to account for such results.
A similar interpretation, as well as perhaps a"difference detector," seems indicated by thedemonstratons of Beck (1972) and Julesz, Gilbert,Shepp, and Frisch (1973). In those experiments, discrepant subsets of very large displays were rapidlydetected when the subset was composed of lineorientations different from the rest of the display.Differences in line orientation apparently allowedsubjects to quickly organize large displays into"same" and "different" subsets. All of theseresults suggest the importance of relationships
between forms. The work of Julesz et al. representsa thorough investigation of the geometric propertiesof form that permit rapid detection of contrastingforms, but it is not certain how their results generalize to the perception of smaller displays and to theslower, serial-like processing of individual forms.
The general method of the present experimentswas to use the same/different task-where the subject was required to decide whether all of the displayed forms were identical or whether anyone wasdifferent-as a means for testing the competingdefinitions of similarity. Independent variables werethe particular transformations used to produce adifference in forms and the number of forms in thedisplay. Both speed and accuracy of the "same" vs."different" responses were used as dependentmeasures for evaluating the effect of display size onthe detectability of a given transformation.
The principal question addressed by our firstexperiment was whether the detectability of a difference in forms is determined by the number ofdiscordant points or, alternatively, whether thedetectability of a transformation depends upon itscontext within the whole form. Specifically, thedetectability of three transformations was examined:Deletion of a set of points from the end of a linesegment, a break in the continuity of a line segment,and a left-right mirror image reversal of the wholeform. As may be seen in Figure I, the deletion andbreak transformations produced the same number ofdiscordant points, while the reversal transformationproduced a much larger number of discordant pointsbut no change in the overall shape of the form. Thus,a difference in detectability of the deletions andbreaks would indicate that the perceptual dissimilarity produced by the removal of a line segmentdepends upon the position of the line segmentwithin the whole form. Similarly, if the reversaltransformations were more difficult to detect thanthe other transformations, then the perceptualsimilarity of a form and its reversal would not bebased on numbers of discordant points, but insteadon more global properties of the overall shape. Weanticipated both of these results, indicating theinadequacy of the number of discordant points as ameasure of similarity. As it turned out, however, thereversals were much easier to detect than the othertransformations, in contrast to earlier experimentsusing reversal transformations (Gibson, Gibson,Pick, & Osser, 1962; Lappin, 1971). Moreover, thesize of the display had no effect on the speed andaccuracy in detecting these transformations. Asecond experiment was then conducted to determinewhether the effectiveness of the reversal transformation resulted from the greater number of discordantpoints it produced or from a change in the orientation of diagonal line segments. The results of both
experiments shed light on the influence of visualsimilarity on the mode of perceptual processing ofdisplays of multiple forms.
EXPERIMENT I
MethodSubjects. Nine male graduate students in psychology at
Vanderbilt University voluntarily participated in the experiment.The subjects' ages ranged from 22 to 34 years.
Apparatus and stimuli. A PDP-8/! computer generated visualdisplays on a cathode ray tube (Tektronix 604 with P-15 phosphor). Telegraph keys served as response mechanisms, and aTeletype bell was used to provide feedback. The figures generatedby the computer appeared at any of 12 locations around acircular display (after Egeth et al., 1972) with the constraint thatthe symbols were maximally spaced. A circular array was used toreduce the transfer of reading-related skills and to minimize differences in acuity due to retinal position. The diameter of thiscircular array subtended a visual angle of 2.6 deg; the individualitems subtended a visual angle of 31 x 23 min.
The figures used in this experiment were adapted from theGibson et al. (1962) experiment. The four figures taken from theirstudy were prototypes from which we derived all of the transforms. Both the prototypes and transforms were constructedwithin 13 by 9 matrices of dots on the display screen.
Three transforms were constructed from each of the fourfigures. In one case, a transform was constructed by deletingfour or five dots from a line element contained in the prototype. This transformation, however, left the continuity of theprototype intact (a deletion). It was sometimes necessary toremove five dots in this condition to ensure that length of thedeleted line was equal to the deleted segment in the secondcondition. The second transform was formed by removing fourdots such that the continuity of the prototype was disrupted(a break). A third transform was a mirror-image reversalaround the vertical axis (a reversal). Although the figures weremade up of dots, the figures on the display appeared to becomposed of continuous lines. Figure 1 illustrates the four prototypes and their respective transforms.
Procedures. The original design of this experiment involvedonly one group of subjects instructed to make same-differentjudgments within a rapid deadline. Because the RTs were essentially constant across conditions, error rate was the onlydependent measure for this group. The experiment was thenreplicated using RT as the dependent measure. A second group ofsubjects was instructed to concentrate on the accuracy of theirresponses. Three of the subjects in the original group plusthree new subjects participated in this second high-accuracygroup. Having three subjects from the first group participatein the second group allowed us to test whether or not any of theobtained effects disappeared with extended practice.
In both instructional groups, the subjects participated in foursessions, the first of which was practice. Each session includedthree blocks of trials, where each block was devoted to discriminations between the prototype and one of the three transformations. That is, only one of the three transformationsoccurred in a block of trials. The order of the conditions withineach session was counterbalanced across sessions and subjects.
Display sizes were randomly mixed within each block of trials.A block contained 196 trials, and display sizes of two, four, andsix occurred with equal probability. The probability of a "same"or "different" display occurring was also equal to .5. Also,given a "different" display. the position of the "different"element was randomly varied and occurred with equal probability.
Care was taken to ensure that the tasks involved samedifferent judgments and were not simply detection tasks. In thedeletion condition. as an example. a "different" display could
SIMILARITY 407
contain all prototypes and one deleted transform or all transforms and one prototype. This technique forced subjects to makecomparisons rather than search for a deletion. The same safeguard was employed in the other two conditions.. The display was viewed binocularly from a distance of about125 ern in a dimly lit room. The subjects initiated a trial bydepressing the two response keys. Immediately, an "X"appeared on the center of the screen. and this was followed500 msec later by a display containing two. four, or six elements.If the subjects judged all the elements to be similar. theyreleased the left telegraph key. If they detected a differentelement, they released the right key. If they made the correctdecision, a Teletype bell rang. After completing a block of trials,the subjects took a brief rest before beginning the next trial block.
The first group was instructed to respond within a 500-msecdeadline. The deadline was signaled by the offset of the display.They were asked to be as accurate as possible within this constraint, but beating the deadline was emphasized. Error rate wasthe dependent measure for this group, as one intent of the instructions was to keep RT constant across the three conditions.
The other group was asked to respond before a I.O-sec deadline.It was explained that this deadline afforded enough time to allowvery accurate judgments. RT was the dependent measure for thisgroup, as we expected error rate to be consistently low across thedifferent conditions. Responses were not discounted in eithergroup if the subjects exceeded the deadline.
The subjects completed all of their sessions within I week.Approximately 2 weeks elapsed after the first group finishedbefore the second group began.
Results and DiscussionData for the error rate group were made condi
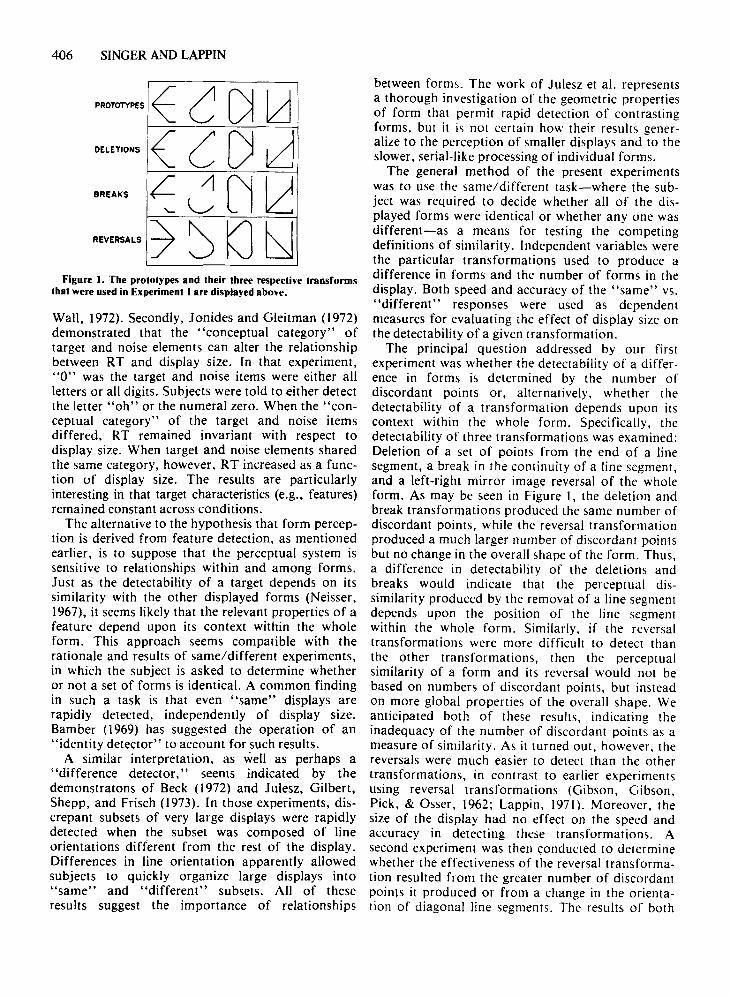
tional upon the responses-i.e., the probability of asame display occurring given a "same" responseand the probability of a different display given a"different" response. The intent of this procedurewas to eliminate the effects of response biases.When errors are made conditional upon the displaysrather than on the responses, then there are oppositetrends for the same and different displays, with theerror rate decreasing with display size on the "same"trials and increasing on the "different" trials. Thesetrends reflect, in part, an increasing bias for "same"responses with increased display sizes; the improvement for the larger "same" displays disappears whenerrors are made conditional upon responses. In theRT group, we separated the latencies for "same"and "different" responses. Table I summarizes thedata for both groups.
The subjects found the deletion condition to be thehardest. In the RT group, it took subjects a longertime to make same-different judgments when adeletion transformation produced any "differences."In the other group, error rate was highest on the deletion condition. Both groups performed better on thebreak condition. In both of these conditions. however, display size similarity affected subjects'performance.
Subjects in both groups performed best on thereversal conditions. They often reported that the"different" figure seemed to "pop out." They alsoreported that they could employ a different strategy
408 SINGER AND LAPPIN
Table IError Rates and Reaction Times for Various Display Sizes and Transformations
Mean Reaction Time (in msec)Error Rates" For "same" and "different" response
Group Error Rate Reaction Time
Response P(Dls) P(Sld) "Same' "Different"
Display Size 2 4 6 2 4 6 2 4· 6 2 4 6
Deletion .27 .31 .35 .22 .28 .31 523 699 733 618 679 723Break .19 .25 .32 .21 .23 .25 551 609 644 528 605 640Reversal .15 .18 .18 .15 .14 .11 476 482 492 468 505 509
"Error rates were made conditional upon responses. Lowercase letters indicate the response type and uppercase letters indicatedisplay type.
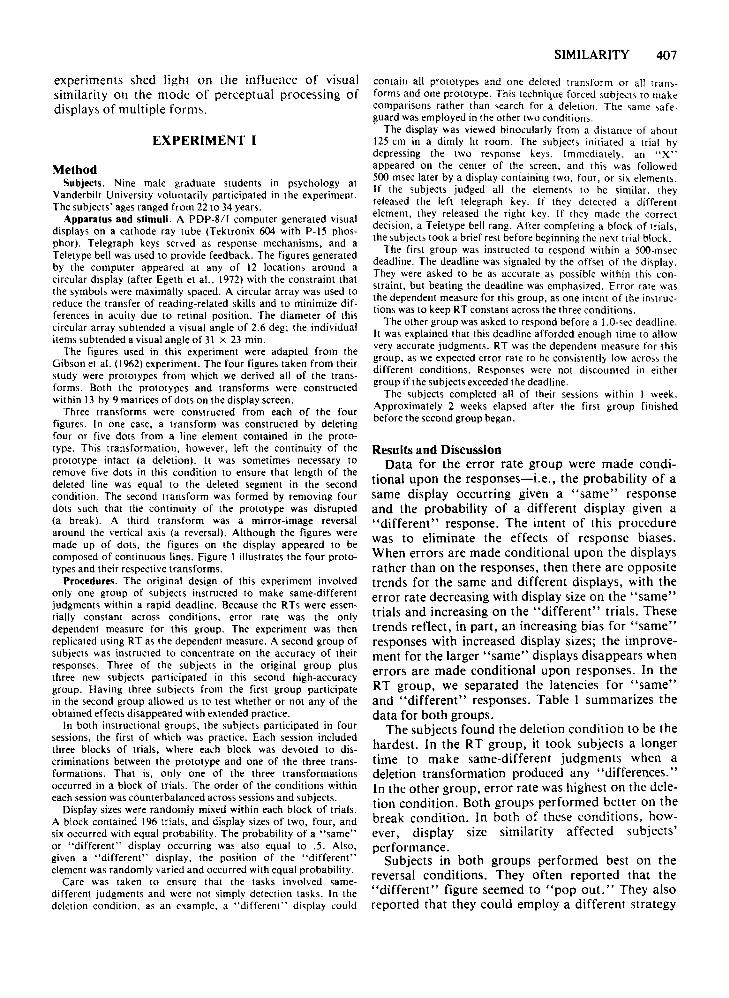
in this condition. While the other conditionsdemanded a figure comparison, in the reversalcondition, the subjects claimed that they looked atthe entire display. The relationship between RT orerror rate and display size may reflect this strategy.In the reversal condition, changes in display sizesignificantly affected the dependent measure. In fact,on the "different" responses in the error-rate group,the accuracy of subjects' responses improved withincreases in display size. Their RTs on the reversalcondition increased only between Display Sizes 2 and4 on the "different" latency. Even this increase inRT is much less than the increases in RT on theother two conditions. Figure 2 illustrates theserelationships, averaging the data for both types ofresponse.
Two analyses of variance corroborate the abovefindings. In the first group, where error rate servedas the dependent measure, there were significanteffects due to the type of transformation, F(2,1O) =21.54, p< .01, and display size, F(2,1O) = 6.27,p < .05, and a significant interaction between displayand transformation, F(4,20) = 3.81, p < .05. Thesame effects were found for the second group, inwhich RT was the dependent variable. The analysis
disclosed effects due to transformation, F(2,1O) ==48.71, P < .01, display size, F(2, 10) = 52.109,p < .01, and the interaction of transformation anddisplay size, F(4,20) = 11.07, P < .01. There were nodifferences in the performances of those subjectswho performed in both groups and those participating in only one group.
It should be noted that none of these effects isattributable to fluctuations in the irrelevant dependent measure. When error rate was the relevantmeasure, the mean RTs were 470 msec on the reversal condition, 532 msec on the break condition, and570 msec on the deletion condition. Likewise, whenRT was the relevant measure, the error rates were70/0 on the reversal condition, 10% on the breakcondition, and 14% on the deletion condition.
There are, then, three primary findings in Experiment I. First, differences that break the continuityof a figure are easier for subjects to detect thandifferences caused by a deletion that leaves thecontinuity of the figure unaltered. The comparisonbetween the break and deletion conditions indicatesthe importance of the relationship between a component feature and the whole figure. The difficultyof detecting the deletion or addition of a component
~.e.S
·SLOW· GROUP
/D£LETIONS
6/'
/1" BREAKS
I ,/
,/~REVERSALS
246DISPLAY SIZE
.315
.3
~ .2It:It:...
•115
.10
·FAST· GROUP
~D£LE11OIlI
/'/.Jl'" X BREAKS
. // ~/
/~"EVERSALS
2 4 6DISPLAY SIZE
Figure 2. The average of the "same" and"different" responses for the error-rategroup and the "same" latency for the RTgroup are separately illustrated in the twogroups.
line segment varied with its relationship to the wholefigure. Second, a reversal transformation produceddifferences most readily and accurately detected bysubjects. This finding is inconsistent with resultsreported by Gibson et al. (1962) and Lappin (1971).1Finally, increases in display size did not affect subjects' performances on the other two conditions.
We did not expect subjects to perform well on thereversal condition. This result, however, was predictable on the basis of the Mclntyre et al. (1970) definition of similarity. That is, if one superimposes areversed transform upon its prototype, there aremore discordant points and fewer "similar" featuresbetween them than there are between the other twotransforms and the prototypes. Given Estes' (1972)system of inhibitory input channels, the redundantand highly dissimilar "same" figures could increasethe salience of the "different" figure.
Subjects' superior performance on the reversalcondition is also consistent, though, with a differentinterpretation. Beck (1972) and Julesz et al. (1973)report that subjects are able to quickly organizevisual displays on the basis of line orientation.Julesz et al. (1973) provide examples in which a set offigures which contain line elements that differ inorientation from the line elements in the stimuluscontext seem to "pop out." He claims that orientation differences between lines allow texture discrimination. There was no such effect when lineorientation differences were not present. In Beck's(1972) experiment, subjects could quickly count thenumber of "different" elements in a visual displaywhen those figures differed from the other displayitems in regard to line orientation. Subjects were lesssuccessful when the "different" figures did not differin line orientation from the other figures. Subjectsin Experiment I could have been quickly organizingthe displays on the basis of line orientation ratherthan attending to an increased number of discordantpoints between the "same" and the "different"figures.
Since line orientation differences and an increasednumber of discordant points are confounded in thereversal condition, we cannot decide between the twoalternative explanations. A second experiment wascarried out that isolated orientation differences asan independent variable.
EXPERIMENT II
MethodSubjects. Seven Vanderbilt students, three female and four
male. served as subjects. None were paid, but the six undergraduates received course credit for their participation. Agesranged from 19 to 24.
Apparatus and Stimuli. The same equipment was used inExperiment II as in Experiment I. The only difference was thefigures. Two sets of four figures were developed. These figures
SIMILARITY 409
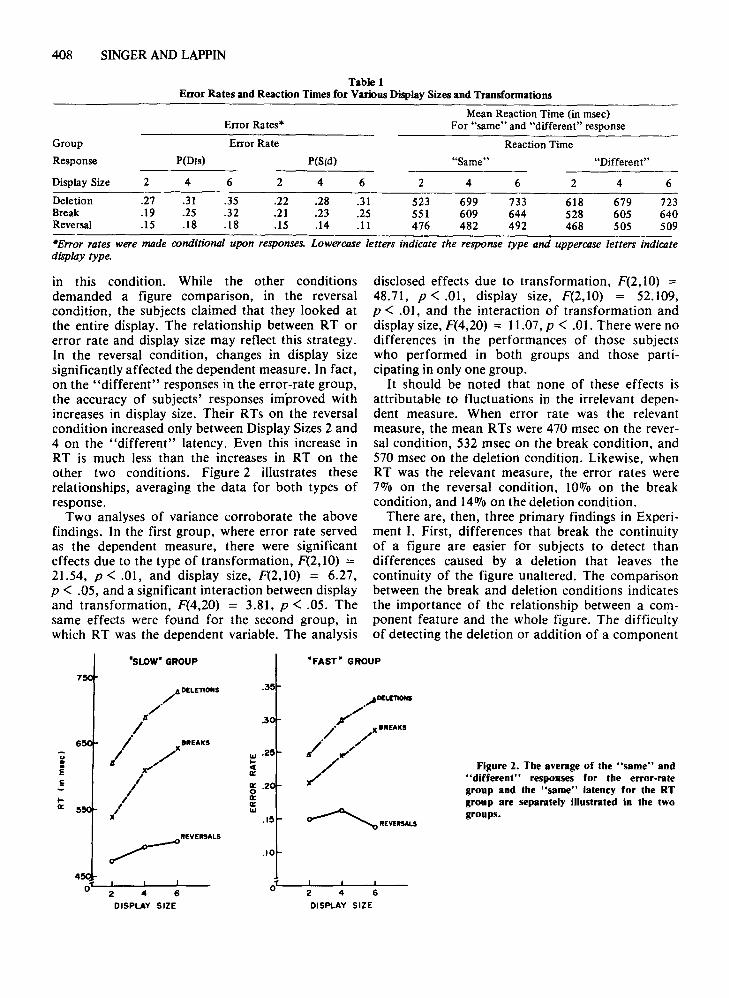
VERTICAL DIAGONALP T P T
00 c)0qJq LSJ[2J
i>~ 0<&pq ~<A
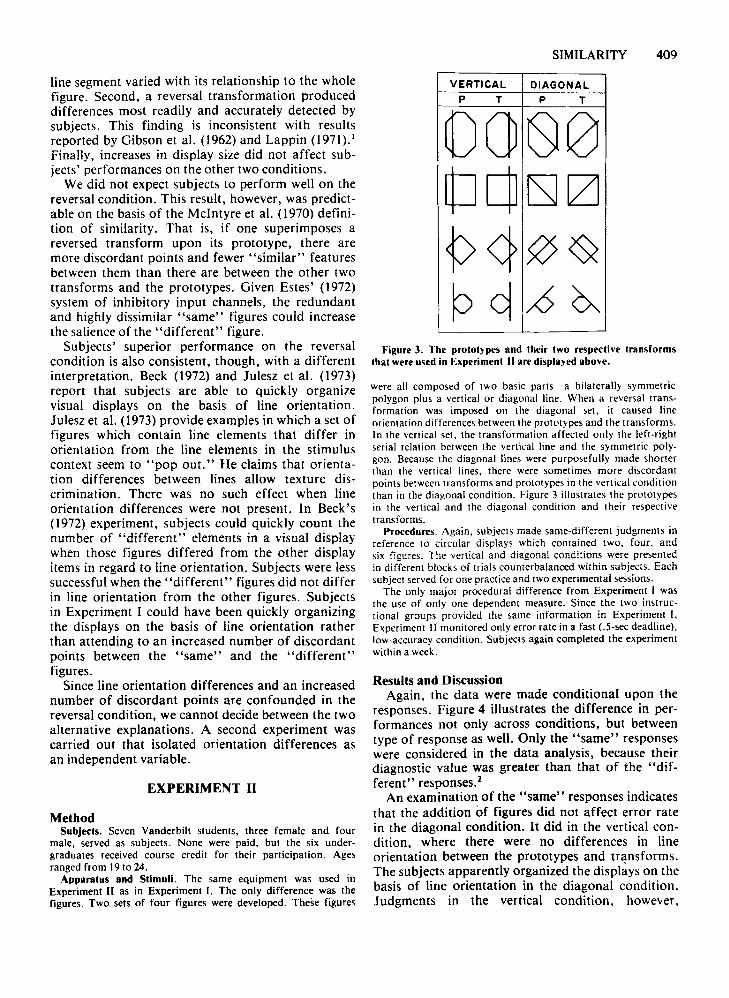
Figure 3. The prototypes and their two respective transformsthat were used in Experiment II are displayed above.
were all composed of two basic parts-a bilaterally symmetricpolygon plus a vertical or diagonal line. When a reversal transformation was imposed on the diagonal set, it caused lineorientation differences between the prototypes and the transforms.In the vertical set, the transformation affected only the left-rightserial relation between the vertical line and the symmetric polygon. Because the diagonal lines were purposefully made shorterthan the vertical lines, there were sometimes more discordantpoints between transforms and prototypes in the vertical conditionthan in the diagonal condition. Figure 3 illustrates the prototypesin the vertical and the diagonal condition and their respectivetransforms.
Procedures. Again, subjects made same-different judgments inreference to circular displays which contained two, four, andsix figures. The vertical and diagonal conditions were presentedin different blocks of trials counterbalanced within subjects. Eachsubject served for one practice and two experimental sessions.
The only major procedural difference from Experiment I wasthe use of only one dependent measure. Since the two instructional groups provided the same information in Experiment I,Experiment 11 monitored only error rate in a fast (.S-sec deadline),low-accuracy condition. Subjects again completed the experimentwithin a week.
Results and DiscussionAgain, the data were made conditional upon the
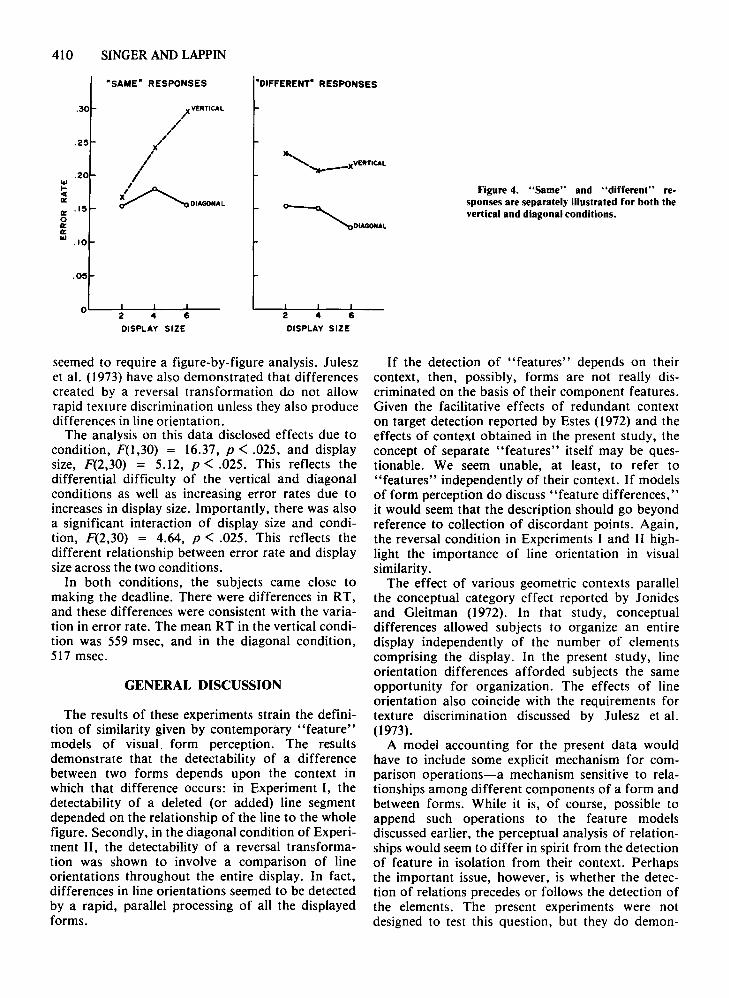
responses. Figure 4 illustrates the difference in performances not only across conditions, but betweentype of response as well. Only the "same" responseswere considered in the data analysis, because theirdiagnostic value was greater than that of the "differen 1" responses. 2
An examination of the "same" responses indicatesthat the addition of figures did not affect error ratein the diagonal condition. It did in the vertical condition, where there were no differences in lineorientation between the prototypes and transforms.The subjects apparently organized the displays on thebasis of line orientation in the diagonal condition.Judgments in the vertical condition, however,
410 SINGER AND LAPPIN
"SAME" RESPONSES "OIFFERENT" RESPONSES
.30
.2S
.2...~c(a:a: .ISoa:a:-. 10
;CVERTICAL
//~DIAGONAL
<, XVERTICAL....,.....--
~DIAGOIIAL
Figure 4. "Same" and "different" responses are separatel)" illustrated for both thevertical and diagonal conditions.
.OS
2 " 6DISPLAY SIZE
2 " 6DISPLAY SIZE
0L.--7--~-~--
seemed to require a figure-by-figure analysis. Juleszet aI. (1973) have also demonstrated that differencescreated by a reversal transformation do not allowrapid texture discrimination unless they also producedifferences in line orientation.
The analysis on this data disclosed effects due tocondition, F(1,30) = 16.37, p < .025, and displaysize, F(2,30) = 5.12, p < .025. This reflects thedifferential difficulty of the vertical and diagonalconditions as well as increasing error rates due toincreases in display size. Importantly, there was alsoa significant interaction of display size and condition, F(2,30) = 4.64, p < .025. This reflects thedifferent relationship between error rate and displaysize across the two conditions.
In both conditions, the subjects came close tomaking the deadline. There were differences in RT,and these differences were consistent with the variation in error rate. The mean RT in the vertical condition was 559 msec, and in the diagonal condition,517 msec.
GENERAL DISCUSSION
The results of these experiments strain the definition of similarity given by contemporary "feature"models of visual. form perception. The resultsdemonstrate that the detectability of a differencebetween two forms depends upon the context inwhich that difference occurs: in Experiment I, thedetectability of a deleted (or added) line segmentdepended on the relationship of the line to the wholefigure. Secondly, in the diagonal condition of Experiment II, the detectability of a reversal transformation was shown to involve a comparison of lineorientations throughout the entire display. In fact,differences in line orientations seemed to be detectedby a rapid, parallel processing of all the displayedforms.
If the detection of "features" depends on theircontext, then, possibly, forms are not really discriminated on the basis of their component features.Given the facilitative effects of redundant contexton target detection reported by Estes (1972) and theeffects of context obtained in the present study, theconcept of separate "features" itself may be questionable. We seem unable, at least, to refer to"features" independently of their context. If modelsof form perception do discuss "feature differences,"it would seem that the description should go beyondreference to collection of discordant points. Again,the reversal condition in Experiments I and II highlight the importance of line orientation in visualsimilarity.
The effect of various geometric contexts parallelthe conceptual category effect reported by Jonidesand Gleitman (1972). In that study, conceptualdifferences allowed subjects to organize an entiredisplay independently of the number of elementscomprising the display. In the present study, lineorientation differences afforded subjects the sameopportunity for organization. The effects of lineorientation also coincide with the requirements fortexture discrimination discussed by Julesz et aI.(1973).
A model accounting for the present data wouldhave to include some explicit mechanism for comparison operations-a mechanism sensitive to relationships among different components of a form andbetween forms. While it is, of course, possible toappend such operations to the feature modelsdiscussed earlier, the perceptual analysis of relationships would seem to differ in spirit from the detectionof feature in isolation from their context. Perhapsthe important issue, however, is whether the detection of relations precedes or follows the detection ofthe elements. The present experiments were notdesigned to test this question, but they do demon-
strate that geometric relations are often rapidlydetected.
One reason for the dominance of the concept of"feature" in research and theory on form perceptionmay be the absence of a clear alternative conception.In this regard, the concept of "transformation"might be considered as an alternative. This alternative has experimental support from Pick (1965),who showed that children were able to transferknowledge about the effect of transformations fromone set of prototypes to another. They did not,however, transfer information about specific featuredifferences. It is possible that a "transformation"represents a general concept which may include theconcept of "feature."
An apparent advantage in defining similarity interms of common features is that such a definitionlends itself naturally to measures of similarity.Defining similarity by transformations, however,would seem to deprive the concept of a rationale formeasurement: How much dissimilarity is generatedby one transformation relative to another? The stepbackwards is more apparent than real, however. If"features" do not have an a priori definition byindependent operations, then similarity is measurableonly after the observation of its effects. If similarityshould be considered as based on transformations,then the present experiments contribute some initialevidence about the effective similarity associatedwith various transformations. We have not yet, however, subjected the concept of "transformation" tothe same tests for context independence that wereemployed in these experiments to test the validityof "features."
REFERENCE NOTE
\. Singer. M. H.. Allen. T. A.. & Lappin. 1. S. Differentialabilities 01 Rood and dyslexic readers (0 discriminate visuaf andauditory sequences. Paper presented at the meeting of theSoutheastern Conference on Linguistics. Nashville. March.1975.
REFERENCES
ATKINSON. R. C.. HOLMGREN. 1. E.. & JUOLA. J. F. Processingtime as intluenced by the number of elements in visual display.Perception & Psychophysics. 1%9. 6. 321·326.
BAMBER. D. Reaction times and error rates for "same't-i'different"judgments of multidimensional stimuli. Perception &Psychophysics. 1%9.6. 169·174.
BECK. J. Similarity grouping and peripheral discriminabilityunder uncertainty. American Journal of Psychology. 1972.85. 1-20.
EGETH. H.. ATKtNSON. L, GILMORE. G .. & MARCUS. N. Factorsaffecting mode in visual search. Perception & Psychophysics.1973. 13. 394-402.
SIMILARITY 411
EGETH. H.. JONIDES. J .. & WALL. S. Parallel processing ofmultit:lement displays. Cognitive Psychology. 1972. 3.674-698.
ESTES. W. K. Interactions of signal and background variablesin visual processing. Perception & Psychophysics. 1972. 12.278-287.
GIBSON. E. 1.. GIBSON. 1. 1.. PICK. A. D .. & OSSER. H. Adevelopmental study on the discrimination of letter-likeforms. Journal of Comparative and Physiological Psychology.1%2. 55. 897-lJOO.
JONIDES. 1.. & GLEITMAN. H. A conceptual category effect invisual search: 0 as letter or as digit. Perception & Psychophysics.1972. 12. 457-460.
JULESZ. B.. GILBERT. E. No, SHEPP. L. A.. & FRISCH! H. L.Inability of humans to discriminate between visual ~xtures
that agree in second-order statistics-revisited. Perception,1973.2.391-405. .
LApPIN. 1. S. Transformation-invariant cues in the recognitionof simple visual patterns. Perception & Psychophysics. 197\.10. 367-370.
MciNTYRE. Co, Fox. R.. & NEALE. 1. Effects of noise similaritvand redundancy on the information processed from brie"fvisual displays. Perception & Psychophysics. 1970. 7. 328-332.
NEISSER U. Cognitive Psychology. New York: Appleton-CenturyCrofts. 1%7.
PICK. A. D. Improvement of visual and tactual form discrimination. Journal ofExperimentul Psychology. 1%5. 69. 331-339.
REED. S. K. Psychological processes in pattern recognition.New York: Academic Press. 1973.
SHIFFRIN. R. M.. & GEISLER. W. S. Visual recognition in atheory of information processing. In R. L. Solso (Ed.),
Contemporary issues in cognitive psychology: The Loyola. Symposium. Washington. D.C: V. H. Winston. 1973.
WOLFORD. G. Perturbation model for letter identilication.Psvchologicul Review, 1975. 82. 184-199.
NOTES
\. The Gibson et at. (\ 962) experiment was done with children.and that might account for the difference in our results. Itshould be mentioned. however. that in another experiment wehad normal and dyslexic children perform these tasks. We againfound that all of these children performed best on the reversalcondition (Singer. Allen, & Lappin. Note I). The reason for thediscrepancy has to do in part with the instructions andstructure of the task. A full discussion of this difference is.however. irrelevant to the present experiments.
2. Even if subjects were scanning displays serially. the errors on"different" responses would not necessarily increase with displaysize: If all the displayed items were the same. then it is not clearwhy larger displays should have an increased tendency to appear"different." Moreover. the effect of display size should be smallerfor different than for same displays, since the former requirescanning of fewer items on the average in order to determine thecorrect response. If subjects were scanning the displays serially.then the error rate for "same" responses should increase withdisplay size whatever the rate of scanning (if it were not sufficientto prevent errors) and whatever the response bias. The error ratefor "same" responses thus has more diagnostic value than thatfor "different" responses.
(Received for publication August II. 1975;revision accepted February 6. 1976.)