similar digit-based working memory in deaf signers and
TRANSCRIPT
Similar digit-based working memory in deaf
signers and hearing non-signers despite digit
span differences
Josefine Andin, Eleni Orfanidou, Velia Cardin, Emil Holmer, Cheryl M. Capek, Bencie Woll,
Jerker Rönnberg and Mary Rudner
Linköping University Post Print
N.B.: When citing this work, cite the original article.
Original Publication:
Josefine Andin, Eleni Orfanidou, Velia Cardin, Emil Holmer, Cheryl M. Capek, Bencie Woll,
Jerker Rönnberg and Mary Rudner, Similar digit-based working memory in deaf signers and
hearing non-signers despite digit span differences, 2013, Frontiers in Psychology, (4), 942.
http://dx.doi.org/10.3389/fpsyg.2013.00942
Copyright: Frontiers
http://www.frontiersin.org/
Postprint available at: Linköping University Electronic Press
http://urn.kb.se/resolve?urn=urn:nbn:se:liu:diva-102262
“fpsyg-04-00942” — 2013/12/12 — 20:03 — page 1 — #1
ORIGINAL RESEARCH ARTICLEpublished: 16 December 2013
doi: 10.3389/fpsyg.2013.00942
Similar digit-based working memory in deaf signers andhearing non-signers despite digit span differencesJosefine Andin1*, Eleni Orfanidou 2,Velia Cardin1,3 , Emil Holmer 1, Cheryl M. Capek 4, Bencie Woll 3 ,
Jerker Rönnberg 1 and Mary Rudner 1
1 Linnaeus Centre HEAD, Swedish Institute for Disability Research, Department of Behavioural Sciences and Learning, Linköping Universtiy, Linköping, Sweden2 Department of Psychology, University of Crete, Rethymnon, Greece3 Deafness Cognition and Language Research Centre, Department of Cognitive Perceptual and Brain Sciences, University College London, London, UK4 School of Psychological Sciences, University of Manchester, Manchester, UK
Edited by:
Ingrid Christoffels, University ofLeiden, Netherlands
Reviewed by:
Daan Hermans, Royal Dutch Kentalis,NetherlandsMarcel Giezen, San Diego StateUniversity, USA
*Correspondence:
Josefine Andin, Department ofBehavioural Sciences and Learning,Linköping University, SE-581 83Linköping, Swedene-mail: [email protected]
Similar working memory (WM) for lexical items has been demonstrated for signers and non-signers while short-term memory (STM) is regularly poorer in deaf than hearing individuals.In the present study, we investigated digit-based WM and STM in Swedish and British deafsigners and hearing non-signers. To maintain good experimental control we used printedstimuli throughout and held response mode constant across groups. We showed that deafsigners have similar digit-based WM performance, despite shorter digit spans, comparedto well-matched hearing non-signers. We found no difference between signers and non-signers on STM span for letters chosen to minimize phonological similarity or in the effectsof recall direction.This set of findings indicates that similar WM for signers and non-signerscan be generalized from lexical items to digits and suggests that poorer STM in deaf signerscompared to hearing non-signers may be due to differences in phonological similarity acrossthe language modalities of sign and speech.
Keywords: deaf signers, working memory, short-term memory, phonological similarity, cross-culture
INTRODUCTIONWorking memory (WM) is the limited capacity available for main-taining and processing information online and is thus vital forcommunication (Baddeley, 2003). The ability to maintain andprocess lexical items in WM has been shown to be equal, irrespec-tive of whether those items are signs or words (Boutla et al., 2004;Rudner et al., 2007, 2013). However, short-term memory (STM)capacity (i.e., maintenance only) is generally lower for signs thanwords (Marschark and Mayer, 1998; Boutla et al., 2004; Rönnberget al., 2004; Geraci et al., 2008). In an attempt to settle the discrep-ancies in capacity estimates, the aim of the present study was toinvestigate STM for digits and letters as well as WM for digits indeaf signers and hearing non-signers by making direct compar-isons between well-matched groups. Text-based presentation wasused throughout and influence of response mode was investigated.
Sign languages are natural, complex visual languages of deafcommunities (for review, see Emmorey, 2002). They can bedescribed using the same terminology as speech-based languages,such as phonology, morphology, syntax, and prosody (Klima andBellugi, 1979; Sandler and Lillo-Martin, 2006). Although signlanguages are not representations of either spoken or written lan-guage, many, although not all, sign languages make use of manualalphabets (fingerspelling) to represent letters and orthographywhen producing, e.g., place names or proper names (Brentari,1998). There are many different one- and two-handed manualalphabets (Carmel, 1982), including the Swedish manual alpha-bet, which is one-handed, and the British manual alphabet, whichis two-handed. Both these alphabets are used productively to filllexical gaps (Bergman and Wikström, 1981; Sutton-Spence andWoll, 1999). For spoken language, phonology is concerned with
the combination of sounds to form utterances, while for signedlanguage phonology refers to how sublexical components of signsare put together with respect to handshape, position (includingorientation), and movement (Sandler and Lillo-Martin, 2006).Signs that share one or more realizations of these features areconsidered to be phonologically similar (Klima and Bellugi, 1976;Sandler and Lillo-Martin, 2006).
Traditionally, WM and STM are measured using span tests. WMcan be measured by, e.g., reading span, listening span, or operationspan, where operation span has been shown to load most stronglyon overall WM capacity (Unsworth and Engle, 2007). The oper-ation span task (Turner and Engle, 1989) is a WM task in whicharithmetic operations are performed on quantities represented bydigits and the results of these operations are serially maintainedin memory for subsequent recall while new operations are per-formed. Thus, the operation span task relies on manipulation ofabstract representations but without necessarily calling on linguis-tic structure. While STM ability, measured by simple spans, fordeaf signers and hearing non-signers has been investigated exten-sively, WM,measured by complex spans, has only been investigatedfor these groups in two studies (Boutla et al., 2004; Alamargotet al., 2007). In both studies a production span task was usedand no differences between groups were found for either adults(Boutla et al., 2004) or children (Alamargot et al., 2007). Studiesusing other tests aimed to investigate WM capacity have also con-cluded that there are no general differences between deaf signersand hearing non-signers in WM (Rudner et al., 2010, 2013). All ofthe above mentioned studies have however, either used linguisticstimuli, such as signs and words, or easily nameable pictures. In thepresent study we will investigate if similar WM capacity for deaf
www.frontiersin.org December 2013 | Volume 4 | Article 942 | 1

“fpsyg-04-00942” — 2013/12/12 — 20:03 — page 2 — #2
Andin et al. Short-term and working memory in deaf signers
signers and hearing non-signers can be generalized to digit-basedWM.
Short-term memory is frequently assessed, in both research andneuropsychological testing, by the digit span test. A substantialbody of literature has shown that deaf signers perform at a lowerlevel on this test than hearing non-signers, even when the testis administered in their native sign language, and despite equalperformance on other cognitive tasks (Pintner and Paterson, 1917;Wilson et al., 1997; Bavelier et al., 2008). This phenomenon is notrelated to deafness per se, but to the use of sign language, sincethis difference is also found in hearing signers (Boutla et al., 2004).There are several potential underlying mechanisms explaining thedifferences in STM between the language modalities of sign andspeech, among them the phonological similarity effect (Baddeleyet al., 1975; Wilson and Emmorey, 1997a) and the temporal ordereffect (Wilson and Emmorey, 1997b; Wilson et al., 1997).
The phonological similarity effect arises because items withsimilar sublexical structure give rise to similar traces in the phono-logical loop, resulting in confusability (Baddeley et al., 1975). Thisapplies to words that sound similar, such as words that rhyme witheach other and to signs with similar formational properties suchas same handshape (Wilson and Emmorey, 1997a). Confusabilityof memory traces means that serial recall is less accurate for itemsthat are phonologically similar (Baddeley et al., 1975; Wilson andEmmorey, 1997a). In most spoken languages, including Englishand Swedish, digit names are phonologically dissimilar, whereasin many sign languages, the numeral signs representing digits arephonologically similar as they share the same position, orientation,and movement and differ only in handshape, and then only min-imally (see Figure 1). Thus, a higher digit span size for speakersthan for signers (Pintner and Paterson, 1917; Bavelier et al., 2008),may at least partially be due to the phonological similarity of man-ual numerals. On the basis of this it has been suggested that letterspan would be a better instrument to use when STM is comparedbetween signers and speakers (Boutla et al., 2004). Indeed, Wilsonand Emmorey (2006a) reported similar STM spans for deaf signersand hearing non-signers for a single set of letters (fingerspelled forthe deaf signers and spoken for the hearing non-signers), matchedfor articulatory duration and phonological similarity in Americansign language (ASL) and English, suggesting that STM for ASLand English do not differ in underlying capacity. However, thisconclusion was contested by Bavelier et al. (2006), who providedevidence of lower STM span for signers than speakers with two setsof letters whose names were duration-matched across languagemodality. Thus, evidence for the role of phonological similarity inspan differences between languages is inconclusive. In this studywe use both digit span (phonologically similar in sign languageand dissimilar in spoken language) and letter span (dissimilarin both languages) to pinpoint the phonological involvementin STM.
The temporal order effect arises because the auditory systemis efficient in retaining temporal order, in contrast to the visualsystem (Smyth et al., 2005). In memory tasks, forward recallpreference has been reported for hearing individuals (Rönnberget al., 1980; Li and Lewandowsky, 1995; Rosen and Engle, 1997).Studies of deaf signers, however, report reduced forward pref-erence (Bavelier et al., 2008) and backward or no temporal
preference (O’Connor and Hermelin, 1973), although the moredeaf individuals rely on a speech-based code, the better they areat maintaining temporal order (Hanson, 1982). This implies thatthere might be a preference for temporal encoding in speech, withsigners using spatial encoding to a larger extent, especially whenthey do not rely on speech encoding. In support of this view, sev-eral studies have demonstrated that hearing individuals prefer torecall information in the same temporal order as presented, whiledeaf individuals preferred spatial recall (O’Connor and Hermelin,1973; Rönnberg and Nilsson, 1987). When temporal processingdemands are relaxed, memory differences between signed and spo-ken language disappear (Hanson, 1982; Boutla et al., 2004; Bavelieret al., 2008; Rudner and Rönnberg, 2008; Rudner et al., 2010).In the present study we examine the temporal order effect byadministering both forward and backward span tests.
Much of the recent work investigating STM for sign languagehas used signed stimuli with signed response for signing partici-pants who are either deaf or hearing and auditory stimuli withspoken response for hearing speakers (Wilson and Emmorey,1998, 2006a; Boutla et al., 2004; Hall and Bavelier, 2011). Themain advantage of this approach is that it allows individuals toperform the tasks in their own language with optimized stimu-lus presentation and recall mode for both language modalities.Another advantage is that it has made it possible to test hearingusers of sign languages in both spoken language and sign language(Hall and Bavelier, 2011), providing experimental control in awithin-groups design. However, this design has the drawback ofintroducing confounds in the experimental situation when stimu-lus and response modes differ between language modalities (Kooet al., 2008). Because auditory memory traces persist longer thanvisual memory traces (Sperling, 1960; Darwin et al., 1972), hear-ing individuals presented with auditory stimuli can take advantageof a more capacious buffer that reduces the load of the rehearsalprocess to a greater extent than can deaf individuals presentedwith visual stimuli (Cowan, 2000). In the present study we usedprinted characters as stimuli and written response for all par-ticipants. In one sense this returns to an older tradition whichexpected deaf individuals to perform memory tasks in speech-based languages which may not have been their preferred mode ofcommunication (Pintner and Paterson, 1917; Ross, 1969; Conrad,1970; Locke and Locke, 1971; Wallace and Corballis, 1973). How-ever, our assumption was that all participants would recode thecharacters as the appropriate lexical labels in their preferred lan-guage modality during memory encoding and reverse this processat recall. To ensure best possible compliance to our assumption,we recruited participants whose language experience was orthog-onal to each other: deaf signers and hearing non-signers. Both theSwedish deaf signers in Experiment 1 and the British deaf signersin Experiment 2 had learned sign language at an early age andused it as their preferred language in everyday communication.The hearing non-signers in these experiments had no knowledgeof sign language.
In sum, the aim of the present study was to investigate digit-based WM and STM in deaf signers and hearing non-signers. Thefirst experiment included deaf signers (SDS) who use Swedishsign language (SSL) and hearing Swedish speakers (SHN) with noknowledge of sign language. We tested WM using the operation
Frontiers in Psychology | Cognition December 2013 | Volume 4 | Article 942 | 2
“fpsyg-04-00942” — 2013/12/12 — 20:03 — page 3 — #3
Andin et al. Short-term and working memory in deaf signers
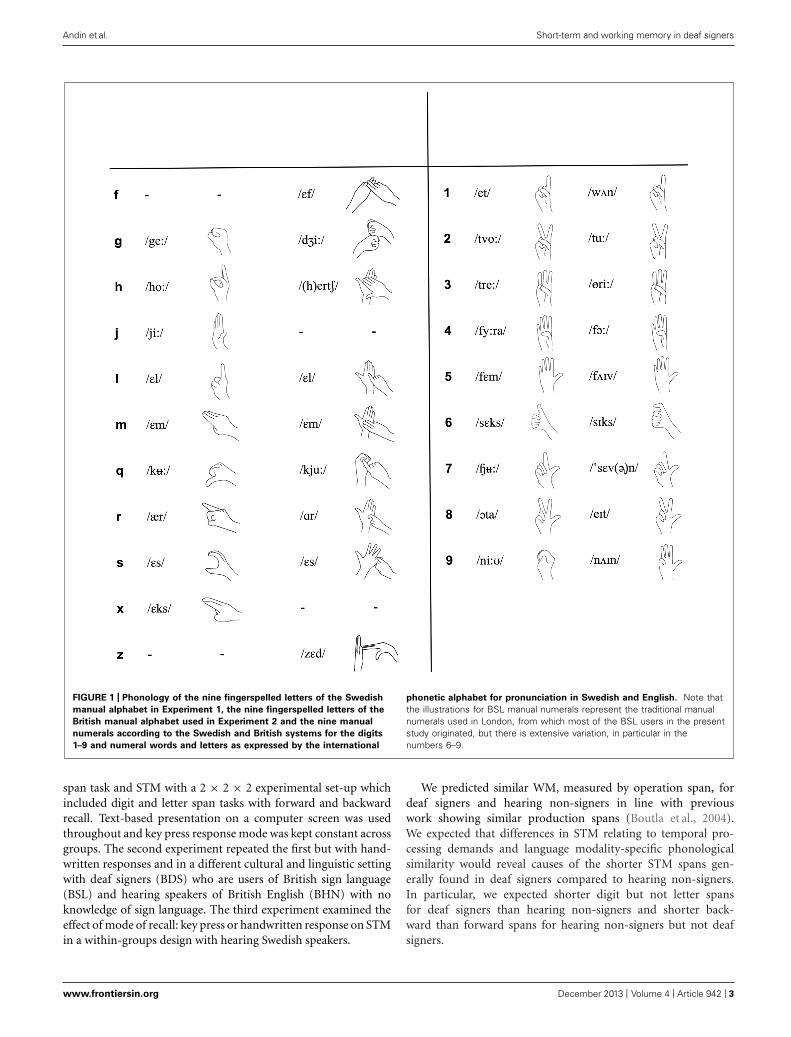
FIGURE 1 | Phonology of the nine fingerspelled letters of the Swedish
manual alphabet in Experiment 1, the nine fingerspelled letters of the
British manual alphabet used in Experiment 2 and the nine manual
numerals according to the Swedish and British systems for the digits
1–9 and numeral words and letters as expressed by the international
phonetic alphabet for pronunciation in Swedish and English. Note thatthe illustrations for BSL manual numerals represent the traditional manualnumerals used in London, from which most of the BSL users in the presentstudy originated, but there is extensive variation, in particular in thenumbers 6–9.
span task and STM with a 2 × 2 × 2 experimental set-up whichincluded digit and letter span tasks with forward and backwardrecall. Text-based presentation on a computer screen was usedthroughout and key press response mode was kept constant acrossgroups. The second experiment repeated the first but with hand-written responses and in a different cultural and linguistic settingwith deaf signers (BDS) who are users of British sign language(BSL) and hearing speakers of British English (BHN) with noknowledge of sign language. The third experiment examined theeffect of mode of recall: key press or handwritten response on STMin a within-groups design with hearing Swedish speakers.
We predicted similar WM, measured by operation span, fordeaf signers and hearing non-signers in line with previouswork showing similar production spans (Boutla et al., 2004).We expected that differences in STM relating to temporal pro-cessing demands and language modality-specific phonologicalsimilarity would reveal causes of the shorter STM spans gen-erally found in deaf signers compared to hearing non-signers.In particular, we expected shorter digit but not letter spansfor deaf signers than hearing non-signers and shorter back-ward than forward spans for hearing non-signers but not deafsigners.
www.frontiersin.org December 2013 | Volume 4 | Article 942 | 3
“fpsyg-04-00942” — 2013/12/12 — 20:03 — page 4 — #4
Andin et al. Short-term and working memory in deaf signers
EXPERIMENT 1MATERIALS AND METHODSParticipantsEighteen Swedish deaf adults (14 women; mean age = 27.83,SD = 4.08) were recruited to the study. All participants weredeaf from birth (17 participants) or before 6 months of age (oneparticipant) and all were native or early signers who started touse SSL before the age of three. Four participants had deaf par-ents who signed with them from birth and one had a deaf oldersibling and was therefore signed with from birth. All deaf partici-pants born after 1976 went to deaf schools using the 1983 Swedishnational curriculum with education mainly in SSL (Svartholm,2010). One deaf participant born before 1976 started to useSSL at the age of two and worked as an accredited sign lan-guage teacher. Thus, we consider the SSL proficiency of thisindividual to be on a par with that of the rest of the deafparticipants. All deaf participants considered SSL to be theirfirst language; they used SSL in all one-to-one communication,and were reluctant to use oral communication and lip reading.However, they were all capable of communicating in writtenSwedish.
Eighteen adult hearing, native Swedish speakers (14 women;mean age = 28.17, SD = 5.52) were also included in the study. TheSwedish speakers were unfamiliar with sign language. The par-ticipants in the spoken language group were recruited to matchthe signing group on age, t(34) = 0.21, p = 0.84, and educa-tion. The two groups were further matched on non-verbal IQ(Raven’s standard progressive matrices, t-scores; SDS M = 50.94SD = 7.93, SHN M = 54.94 SD = 7.02; t(34) = 1.60, p = 0.12).All participants had completed mandatory Swedish education,which at the time meant 9 years for SHN and 10 years for SDS,and Swedish high school (3–4 years). Six of the SHN and six ofthe SDS had a university degree or equivalent education (e.g.,as sign language teachers). Thus, we used a participant basewith no statistically significant differences between the groupsregarding sex, age, non-verbal IQ, and education. We con-sider this careful matching to be of great importance and suchmatching differentiates this study from previous studies wheregroups have been less well-matched (typically only on gender andage).
The group manipulation in this study is language modality. Thegroups also differ in that one group consists of deaf individuals andthe other of hearing individuals. However, we consider languagemodality to be the differentiator in serial recall tasks as it hasbeen shown that increased reliance on speech-based code leads tosmaller differences between hearing and deaf individuals (Hanson,1982).
The study was approved by the regional ethics committee inLinköping (Dnr 190/05). Written informed consent was given byall participants. The participants were compensated for their travelexpenses and offered a small gift of nominal value after completingthe study.
StimuliThe test battery used in this study comprised five span tests,which were performed in the following order for all partici-pants: digit span forward and backward, letter span forward
and backward, and operation span. All stimuli were presentedas printed characters at the center of a computer screen keep-ing mode of presentation constant across conditions. The testswere performed individually. Verbatim translation of test instruc-tions from Swedish to SSL for deaf participants was performedby professional sign language interpreters, and participants couldask questions. In the same session, before the span tests, tests ofphonology and arithmetic were administered to all participants aspart of a larger study.
Working memory testThe WM measure was the dual-task operation span test based onTurner and Engle (1989). Forty-two equations each consisting oftwo operations were used as stimuli. The first operation in thestring was either multiplication or division and the second oper-ation was either addition or subtraction (e.g., 3 × 2 + 1 = 7).Single digit numbers 1–9 were used throughout the test. Twelvesequences, half true and half false, were created (2–5 strings pro-gressively increasing in size, three sequences of each length). Thetask of the subjects was to report, by key press, if the stated answerwas correct or not. After each sequence the subjects were instructedto recall all the stated answers in the same order as presented. Datawere collected from both the recall and the manipulation phase.Generally, deaf individuals have been shown to have poorer math-ematical ability than hearing peers (Traxler, 2000), which couldaffect performance on the operation span task. However, the care-ful matching of performance on Raven’s matrices and educationwas an attempt to handle this potential problem. To further ensurethat all participants had basic mathematical knowledge, all sub-jects were tested on a simple digit task where they were asked aboutnumerical order. No language modality differences were seen onthis task, t(27) = 1.46, p = 0.154.
Short-term memory testsFor the digit span tests, digits from 1 to 9 were chosen to create ran-dom sequences of 2–9 items. For the letter span tests, sequences ofnine letters that represent consonants, chosen to minimize phono-logical similarity in both SSL and Swedish, were created (G, H, J,L, M, Q, R, S, and X; Figure 1). Phonological similarity was mini-mized by avoiding letter names that either rhymed with each otherin Swedish or shared the same handshape in Swedish sign alpha-bet. Sixteen meaningless sequences were created randomly (2–9items, two sequences of each length). All participants were firstexposed to two trials consisting of a sequence of two items. Then,the sequence length increased progressively, by one digit/letter ata time.
ProcedureAll stimuli were presented visually using Presentation 14.2 soft-ware on a PC. Stimulus materials were presented in Times NewRoman with a font size of 90. For the STM tests each digit orletter was presented for 1 s on a computer screen. For the WMtask each equation appeared on the screen for 5 s. At the end ofthe sequence the participants were asked to enter the digits orthe letters in presentation order for forward spans and operationspan, and in the reverse order for backward spans, by using thenumber pad of the computer keyboard. Instead of using the fullkeyboard for letters the participants used a number pad where
Frontiers in Psychology | Cognition December 2013 | Volume 4 | Article 942 | 4
“fpsyg-04-00942” — 2013/12/12 — 20:03 — page 5 — #5
Andin et al. Short-term and working memory in deaf signers
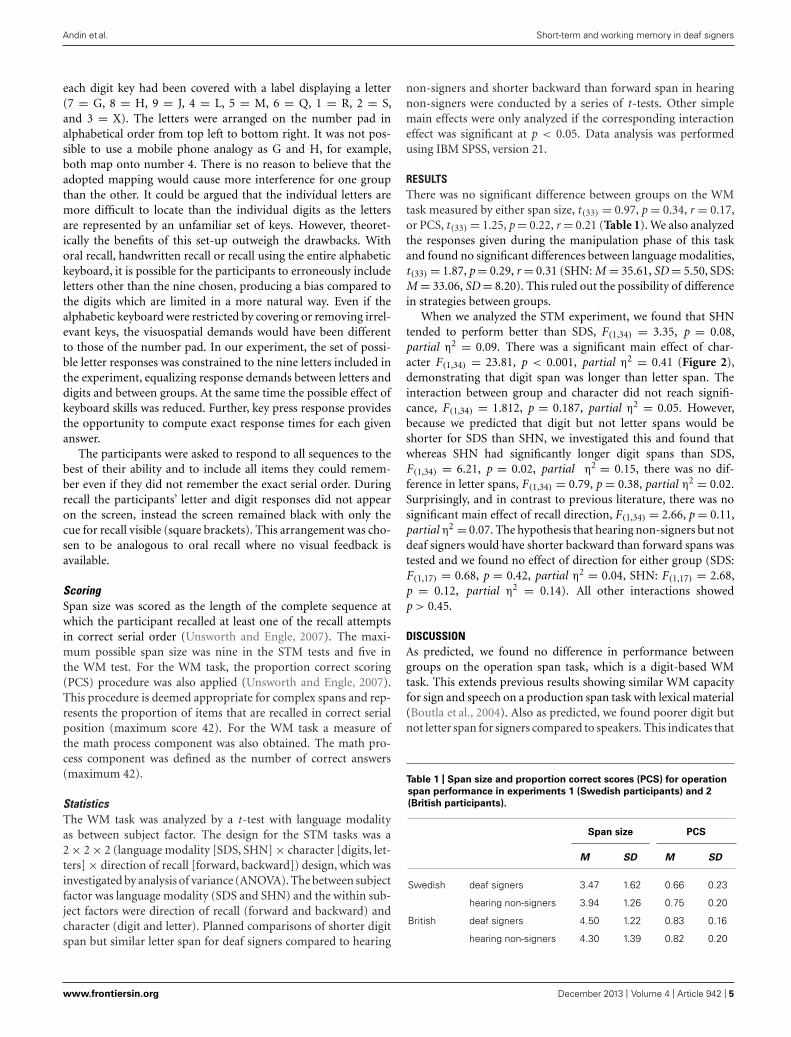
each digit key had been covered with a label displaying a letter(7 = G, 8 = H, 9 = J, 4 = L, 5 = M, 6 = Q, 1 = R, 2 = S,and 3 = X). The letters were arranged on the number pad inalphabetical order from top left to bottom right. It was not pos-sible to use a mobile phone analogy as G and H, for example,both map onto number 4. There is no reason to believe that theadopted mapping would cause more interference for one groupthan the other. It could be argued that the individual letters aremore difficult to locate than the individual digits as the lettersare represented by an unfamiliar set of keys. However, theoret-ically the benefits of this set-up outweigh the drawbacks. Withoral recall, handwritten recall or recall using the entire alphabetickeyboard, it is possible for the participants to erroneously includeletters other than the nine chosen, producing a bias compared tothe digits which are limited in a more natural way. Even if thealphabetic keyboard were restricted by covering or removing irrel-evant keys, the visuospatial demands would have been differentto those of the number pad. In our experiment, the set of possi-ble letter responses was constrained to the nine letters included inthe experiment, equalizing response demands between letters anddigits and between groups. At the same time the possible effect ofkeyboard skills was reduced. Further, key press response providesthe opportunity to compute exact response times for each givenanswer.
The participants were asked to respond to all sequences to thebest of their ability and to include all items they could remem-ber even if they did not remember the exact serial order. Duringrecall the participants’ letter and digit responses did not appearon the screen, instead the screen remained black with only thecue for recall visible (square brackets). This arrangement was cho-sen to be analogous to oral recall where no visual feedback isavailable.
ScoringSpan size was scored as the length of the complete sequence atwhich the participant recalled at least one of the recall attemptsin correct serial order (Unsworth and Engle, 2007). The maxi-mum possible span size was nine in the STM tests and five inthe WM test. For the WM task, the proportion correct scoring(PCS) procedure was also applied (Unsworth and Engle, 2007).This procedure is deemed appropriate for complex spans and rep-resents the proportion of items that are recalled in correct serialposition (maximum score 42). For the WM task a measure ofthe math process component was also obtained. The math pro-cess component was defined as the number of correct answers(maximum 42).
StatisticsThe WM task was analyzed by a t-test with language modalityas between subject factor. The design for the STM tasks was a2 × 2 × 2 (language modality [SDS, SHN] × character [digits, let-ters] × direction of recall [forward, backward]) design, which wasinvestigated by analysis of variance (ANOVA). The between subjectfactor was language modality (SDS and SHN) and the within sub-ject factors were direction of recall (forward and backward) andcharacter (digit and letter). Planned comparisons of shorter digitspan but similar letter span for deaf signers compared to hearing
non-signers and shorter backward than forward span in hearingnon-signers were conducted by a series of t-tests. Other simplemain effects were only analyzed if the corresponding interactioneffect was significant at p < 0.05. Data analysis was performedusing IBM SPSS, version 21.
RESULTSThere was no significant difference between groups on the WMtask measured by either span size, t(33) = 0.97, p = 0.34, r = 0.17,or PCS, t(33) = 1.25, p = 0.22, r = 0.21 (Table 1). We also analyzedthe responses given during the manipulation phase of this taskand found no significant differences between language modalities,t(33) = 1.87, p = 0.29, r = 0.31 (SHN: M = 35.61, SD = 5.50, SDS:M = 33.06, SD = 8.20). This ruled out the possibility of differencein strategies between groups.
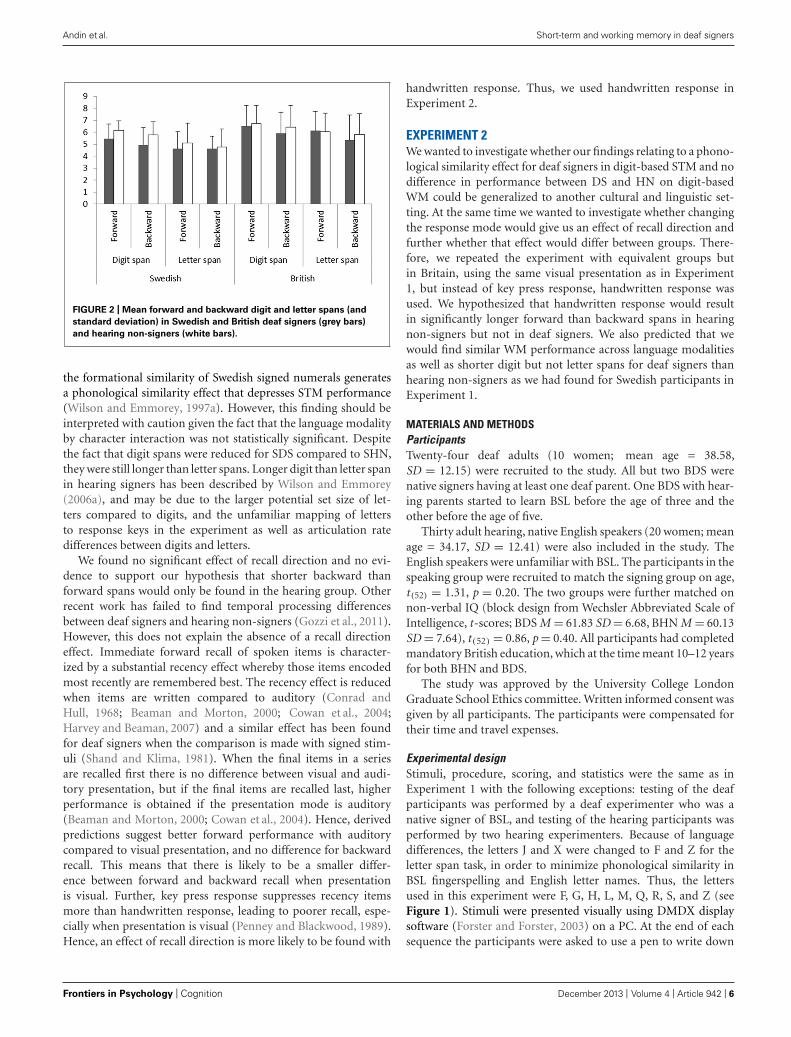
When we analyzed the STM experiment, we found that SHNtended to perform better than SDS, F(1,34) = 3.35, p = 0.08,partial η2 = 0.09. There was a significant main effect of char-acter F(1,34) = 23.81, p < 0.001, partial η2 = 0.41 (Figure 2),demonstrating that digit span was longer than letter span. Theinteraction between group and character did not reach signifi-cance, F(1,34) = 1.812, p = 0.187, partial η2 = 0.05. However,because we predicted that digit but not letter spans would beshorter for SDS than SHN, we investigated this and found thatwhereas SHN had significantly longer digit spans than SDS,F(1,34) = 6.21, p = 0.02, partial η2 = 0.15, there was no dif-ference in letter spans, F(1,34) = 0.79, p = 0.38, partial η2 = 0.02.Surprisingly, and in contrast to previous literature, there was nosignificant main effect of recall direction, F(1,34) = 2.66, p = 0.11,partial η2 = 0.07. The hypothesis that hearing non-signers but notdeaf signers would have shorter backward than forward spans wastested and we found no effect of direction for either group (SDS:F(1,17) = 0.68, p = 0.42, partial η2 = 0.04, SHN: F(1,17) = 2.68,p = 0.12, partial η2 = 0.14). All other interactions showedp > 0.45.
DISCUSSIONAs predicted, we found no difference in performance betweengroups on the operation span task, which is a digit-based WMtask. This extends previous results showing similar WM capacityfor sign and speech on a production span task with lexical material(Boutla et al., 2004). Also as predicted, we found poorer digit butnot letter span for signers compared to speakers. This indicates that
Table 1 | Span size and proportion correct scores (PCS) for operation
span performance in experiments 1 (Swedish participants) and 2
(British participants).
Span size PCS
M SD M SD
Swedish deaf signers 3.47 1.62 0.66 0.23
hearing non-signers 3.94 1.26 0.75 0.20
British deaf signers 4.50 1.22 0.83 0.16
hearing non-signers 4.30 1.39 0.82 0.20
www.frontiersin.org December 2013 | Volume 4 | Article 942 | 5
“fpsyg-04-00942” — 2013/12/12 — 20:03 — page 6 — #6
Andin et al. Short-term and working memory in deaf signers
FIGURE 2 | Mean forward and backward digit and letter spans (and
standard deviation) in Swedish and British deaf signers (grey bars)
and hearing non-signers (white bars).
the formational similarity of Swedish signed numerals generatesa phonological similarity effect that depresses STM performance(Wilson and Emmorey, 1997a). However, this finding should beinterpreted with caution given the fact that the language modalityby character interaction was not statistically significant. Despitethe fact that digit spans were reduced for SDS compared to SHN,they were still longer than letter spans. Longer digit than letter spanin hearing signers has been described by Wilson and Emmorey(2006a), and may be due to the larger potential set size of let-ters compared to digits, and the unfamiliar mapping of lettersto response keys in the experiment as well as articulation ratedifferences between digits and letters.
We found no significant effect of recall direction and no evi-dence to support our hypothesis that shorter backward thanforward spans would only be found in the hearing group. Otherrecent work has failed to find temporal processing differencesbetween deaf signers and hearing non-signers (Gozzi et al., 2011).However, this does not explain the absence of a recall directioneffect. Immediate forward recall of spoken items is character-ized by a substantial recency effect whereby those items encodedmost recently are remembered best. The recency effect is reducedwhen items are written compared to auditory (Conrad andHull, 1968; Beaman and Morton, 2000; Cowan et al., 2004;Harvey and Beaman, 2007) and a similar effect has been foundfor deaf signers when the comparison is made with signed stim-uli (Shand and Klima, 1981). When the final items in a seriesare recalled first there is no difference between visual and audi-tory presentation, but if the final items are recalled last, higherperformance is obtained if the presentation mode is auditory(Beaman and Morton, 2000; Cowan et al., 2004). Hence, derivedpredictions suggest better forward performance with auditorycompared to visual presentation, and no difference for backwardrecall. This means that there is likely to be a smaller differ-ence between forward and backward recall when presentationis visual. Further, key press response suppresses recency itemsmore than handwritten response, leading to poorer recall, espe-cially when presentation is visual (Penney and Blackwood, 1989).Hence, an effect of recall direction is more likely to be found with
handwritten response. Thus, we used handwritten response inExperiment 2.
EXPERIMENT 2We wanted to investigate whether our findings relating to a phono-logical similarity effect for deaf signers in digit-based STM and nodifference in performance between DS and HN on digit-basedWM could be generalized to another cultural and linguistic set-ting. At the same time we wanted to investigate whether changingthe response mode would give us an effect of recall direction andfurther whether that effect would differ between groups. There-fore, we repeated the experiment with equivalent groups butin Britain, using the same visual presentation as in Experiment1, but instead of key press response, handwritten response wasused. We hypothesized that handwritten response would resultin significantly longer forward than backward spans in hearingnon-signers but not in deaf signers. We also predicted that wewould find similar WM performance across language modalitiesas well as shorter digit but not letter spans for deaf signers thanhearing non-signers as we had found for Swedish participants inExperiment 1.
MATERIALS AND METHODSParticipantsTwenty-four deaf adults (10 women; mean age = 38.58,SD = 12.15) were recruited to the study. All but two BDS werenative signers having at least one deaf parent. One BDS with hear-ing parents started to learn BSL before the age of three and theother before the age of five.
Thirty adult hearing, native English speakers (20 women; meanage = 34.17, SD = 12.41) were also included in the study. TheEnglish speakers were unfamiliar with BSL. The participants in thespeaking group were recruited to match the signing group on age,t(52) = 1.31, p = 0.20. The two groups were further matched onnon-verbal IQ (block design from Wechsler Abbreviated Scale ofIntelligence, t-scores; BDS M = 61.83 SD = 6.68, BHN M = 60.13SD = 7.64), t(52) = 0.86, p = 0.40. All participants had completedmandatory British education, which at the time meant 10–12 yearsfor both BHN and BDS.
The study was approved by the University College LondonGraduate School Ethics committee. Written informed consent wasgiven by all participants. The participants were compensated fortheir time and travel expenses.
Experimental designStimuli, procedure, scoring, and statistics were the same as inExperiment 1 with the following exceptions: testing of the deafparticipants was performed by a deaf experimenter who was anative signer of BSL, and testing of the hearing participants wasperformed by two hearing experimenters. Because of languagedifferences, the letters J and X were changed to F and Z for theletter span task, in order to minimize phonological similarity inBSL fingerspelling and English letter names. Thus, the lettersused in this experiment were F, G, H, L, M, Q, R, S, and Z (seeFigure 1). Stimuli were presented visually using DMDX displaysoftware (Forster and Forster, 2003) on a PC. At the end of eachsequence the participants were asked to use a pen to write down
Frontiers in Psychology | Cognition December 2013 | Volume 4 | Article 942 | 6
“fpsyg-04-00942” — 2013/12/12 — 20:03 — page 7 — #7
Andin et al. Short-term and working memory in deaf signers
on a printed form the digits or letters in: presentation order, forforward spans and operation span; and in the reverse order, forbackward spans. Forward span always preceded the correspondingbackward span but order of presentation of digit and letter spantests was balanced across participants. The span tests were admin-istered in the beginning of a test session including other cognitivetests.
RESULTSFor the WM task there was no significant difference in performancebetween groups on either span size, t(52) = 0.55, p = 0.58, r = 0.07,or PCS, t(52) = 0.14, p = 0.89, r = 0.02, as in Experiment 1and in line with our prediction (Table 1). Again, there was nodifference in performance between groups in the manipulationphase, t(51) = 0.31, p = 0.76, r = 0.04 (data from one participantmissing due to technical problems).
Analysis of the STM span experiment showed no significantmain effect of group, F(1,52) = 0.53, p = 0.47, partial η2 = 0.01.Just as in Experiment 1, digit span was longer than letter span,F(1,52) = 12.57, p = 0.001, partial η2 = 0.20 (see Figure 2). Therewas no significant interaction effect between groups and charac-ter, F(1,52) = 0.288, p = 0.594, r = 0.074. However, because wepredicted shorter digit but not letter spans for deaf signers thanhearing non-signers, we investigated and found that there was noeffect of group for either digit span, F(1,52) = 0.79, p = 0.38, partialη2 = 0.02 or letter span F(1,52) = 0.22, p = 0.64, partial η2 = 0.004.As expected, forward spans were significantly longer than back-ward spans, F(1,52) = 10.64, p = 0.002, partial η2 = 0.17. Oppositeto our prediction of shorter backward than forward spans for hear-ing non-signers but not deaf signers we found longer forward thanbackward spans in BDS, F(1,23) = 8.58, p = 0.01, partial η2 = 0.27,but not for BHN, F(1,29) = 2.02, p = 0.17, partial η2 = 0.07. Noneof the other interactions approached statistical significance (allps > 0.56).
DISCUSSIONThe pattern of results obtained from the STM experiment differedsomewhat between Experiments 1 and 2. Results of Experiment 2showed no significant difference between deaf signers and hear-ing non-signers on either the digit or letter span tasks. Further,forward spans were longer than backward spans in Experiment 2.This contrasts with Experiment 1 where we did not find such aneffect. We reasoned that the lack of a directional effect in Experi-ment 1 was driven by visual presentation and keypress response,both of which are known to reduce the recency effect which con-tributes to the reported performance difference between recallof first compared to recall of last presented items (Beaman andMorton, 2000; Cowan et al., 2004). In Experiment 2 we usedhandwritten response which influences recency less (Penney andBlackwood, 1989). As expected, with handwritten response, per-formance was worse for backward compared to forward recall,however, in contrast to our prediction, only for deaf signers.
In the operation span task, which was our measure of WM, wefound no significant differences in performance between BDS andBHN. However, it is important to note here that the performanceof both groups approached ceiling. Thus, there is a possibility thatthe operation span task was not powerful enough to detect group
differences in Experiment 2. However, in Experiment 1, there wasno evidence of a ceiling effect and no difference in performancebetween deaf and hearing participants on WM. Both experimentsformed part of larger studies reported elsewhere. In Experiment1, participants performed the span tasks towards the end of anextensive test battery, when they were probably tired. In Exper-iment 2, participants performed the span tasks when they werestill fresh. This may explain why performance approached ceilingin Experiment 2 but not in Experiment 1. This explanation alsosuggests that the lack of difference in WM performance betweengroups in Experiment 2 is real and not simply an artifact of a ceilingeffect.
CROSS EXPERIMENT ANALYSISThe main aim of the cross experiment analysis was to determinewhether the similarities and differences in performance acrosscharacter and language modality in Experiments 1 and 2 wouldcrystalize into a more general pattern of results. A further aim wasto determine whether an interaction between response directionand language modality would become apparent with the greaterpower afforded by collapsing the data.
MATERIALS AND METHODSThe data entered into the cross experiment analysis were identi-cal to those analyzed in Experiments 1 and 2. As deaf signer andhearing non-signer groups with similar characteristics took partin both experiments, we set up a design with two between-groupfactors for the STM tasks. The first factor, also analyzed in Exper-iment 1 and 2, was language modality. The second factor, whichwas new for the cross experiment analysis, was data set (responsemode). There was an age difference between data sets such thatBritish participants (BDS and BHN) were significantly older thanthe Swedish participants (SDS and SHN: F(1,86) = 15.2, p < 0.001,r = 0.39). However, no age difference between deaf signers andhearing non-signers, F(1,86) = 0.84, p = 0.36, r = 0.09, werefound. Performance on the non-verbal intelligence tests could notbe compared since Raven’s SPM (Experiment 1) does not dif-ferentiate as well as WASI (Experiment 2) in the higher ranges.However, all participants performed within the normal range onthe non-verbal IQ scale.
StatisticsFor the cross experiment analysis of the STM tasks the ANOVAdesign was 2 × 2 × 2 × 2: language modality (deaf signers, hearingnon-signers) × response mode (key press, handwritten) × char-acter (digits, letters) × direction of recall (forward, backward).There were two between-subject factors: modality (deaf signersand hearing non-signers) and response mode (key press and writ-ten) and the within-subject factors were, as in Experiments 1 and2, direction of recall (forward and backward) and character (digitand letter).
RESULTSThe British participants had significantly longer STM spansthan the Swedish participants, F(1,86) = 11.74, p = 0.001,partial η2 = 0.12. Further, there was a non-significant tendencytowards shorter spans for deaf signers than hearing non-signers,F(1,86) = 2.41, p = 0.12, partial η2 = 0.03. Digit span was longer
www.frontiersin.org December 2013 | Volume 4 | Article 942 | 7
“fpsyg-04-00942” — 2013/12/12 — 20:03 — page 8 — #8
Andin et al. Short-term and working memory in deaf signers
than letter span, F(1,86) = 33.47, p < 0.001, partial η2 = 0.28.Testing the hypothesis that deaf signers had shorter digit but notletter spans than hearing non-signers, as in Experiment 1, weinvestigated the non-significant interaction between character andlanguage modality, F(1,86) = 1.69, p = 0.197, partial η2 = 0.02and found an effect of shorter digit spans for deaf signers thanhearing non-signers, F(1,88) = 3.96, p = 0.05, partial η2 = 0.04,but no difference in letter span length between language modal-ities, F(1,88) = 0.98, p = 0.33, partial η2 = 0.01. Forward spanswere longer than backward spans, F(1,86) = 11.05, p = 0.001, par-tial η2 = 0.11. Because we had predicted shorter backward thanforward spans for hearing non-signers but not deaf signers, thenon-significant interaction between language modality and direc-tion, F(1,86) = 0.491, p = 0.485, partial η2 = 0.01, was testedand we found longer forward than backward spans for both deafsigners, F(1,41) = 7.12, p = 0.01, partial η2 = 0.15, and hearingnon-signers, F(1,47) = 4.58, p = 0.04, partial η2 = 0.09.
To exclude the possibility that age drove the difference in STMperformance between the British and the Swedish groups, we re-ran the analysis, including age as a covariate. However, the Swedishparticipants still performed worse than the British participants,F(1,85) = 15.45, p < 0.001, partial η2 = 0.15 and the effect ofcharacter, F(1,85) = 4.01, p = 0.049, partial η2 = 0.05, and direc-tion, F(1,85) = 6.78, p = 0.01, partial η2 = 0.07, still remained.To exclude the possibility that the absence of between-group dif-ferences in WM performance in Experiments 1 and 2 was due tolack of power, we compared deaf signing and hearing non-signinggroups across experiments but still found no difference for eitherspan size, t(87) = 0.31, p = 0.76, r = 0.03, or PCS, t(87) = 0.83,p = 0.41, r = 0.09.
DISCUSSIONThe cross experiment analysis generated three important results.Firstly, the lack of differences between groups on WM persisted.Secondly, a clearer pattern crystalized concerning the effects ofcharacter and language modality in STM. In particular, the patternof results revealed in Experiment 1 was confirmed and strength-ened. Hearing non-signers had longer digit spans than deaf signers,while there was no difference in letter span length. This is inline with our hypothesis that the formational similarity of man-ual numerals representing digits causes a phonological similarityeffect leading to poorer STM performance. Thirdly, despite theincrease in power achieved by collapsing over data sets therewas still no difference in the effect of direction for signers andspeakers.
Further, we found that the British participants performed bet-ter than the Swedish participants. We have already noted thatBritish participants performed span testing while they were stillfresh whereas Swedish participants had been subject to an exten-sive battery of testing when they performed the tasks included inthe present study. Thus, one likely explanation of performancedifference across experiments is a fatigue effect. The participantsof the four groups included in the cross experiment analysis allhad normal non-verbal intelligence and had completed at leastmandatory education in their respective country. Further, theywere similar on language proficiency. The age difference did notaffect the results materially. Even though we cannot rule out that
there are differences in non-verbal intelligence and in level of edu-cation which we have not been able to control for, that could affectthe results, we do not believe that this is the main cause of thedifference in performance between experiments. Of course therewas one important difference in the design of the two experiments,namely response mode. Thus, although we believe a fatigue effectmay be driving the differences in performance between the twoexperiments, we cannot rule out an effect of response mode.
EXPERIMENT 3To determine whether the difference in STM performance betweenthe Swedish and British populations could be attributed to dif-ference in response mode, we performed a third experimentwith normally hearing Swedish participants who performed for-ward and backward versions of the digit and letter span taskswith both key press and handwritten response modes in a fullywithin-subjects design.
Short-term memory span size has been found to be approxi-mately equivalent to the number of items that can be articulatedin 2 s (Baddeley et al., 1975). Speakers of languages with shortdigit names, such as Chinese, show longer digit spans than speak-ers of languages with longer digit names, such as Welsh (Ellisand Hennelly, 1980; Elliott, 1992). To investigate if the longerdigit than letter span found in Experiment 1 and 2 could beattributed to slower articulation rate for letters, we also determinedrelative articulation rates for the digits and letters used in thelists.
MATERIALS AND METHODSParticipantsSixteen adults (eight women; mean age = 32.63, SD = 5.46) withnormal hearing took part in the experiment. All participants hadat least 3 years of university education. Written informed consentwas given by all participants. No compensation was paid.
Experimental designThe stimuli from Experiment 1 were used along with an additionalset of material generated according to the principles described inExperiment 1. Specifically the four lists of digit sequences (twoold and two new) and the four lists of letter sequences (two oldand two new) were randomized across the four different con-ditions (forward and backward by keypress and by handwrittenresponse). Power calculation showed that 16 participants wouldbe sufficient to reveal an effect equivalent to that found betweenBritish and Swedish participants. Taking practical considerationsinto account, we decided to let forward span always precede theequivalent backward span in the same response mode but to switchresponse mode between these span pairs. Character and responsemode order were balanced. This resulted in 16 different test orderlists and participants were randomized to these lists. The par-ticipants were also given separate lists of 200 digits and lettersand asked to say them aloud as fast as possible (based on Boutlaet al., 2004). Time was taken and rounded to the nearest wholesecond.
StatisticsFor the STM tasks the ANOVA design was 2 × 2 × 2:response mode (key press, handwritten) × character (digits,
Frontiers in Psychology | Cognition December 2013 | Volume 4 | Article 942 | 8

“fpsyg-04-00942” — 2013/12/12 — 20:03 — page 9 — #9
Andin et al. Short-term and working memory in deaf signers
letters) × direction of recall (forward, backward). The artic-ulation rate measures were analyzed by a t-test and fur-ther run together with the STM data in a correlationanalysis.
RESULTSThe results of the span tasks are shown together with correspond-ing results from Experiment 1 and 2 in Figure 3. As in Experiments1 and 2, digit span was longer than letter span, F(1,15) = 6.99,p = 0.02, partial η2 = 0.32. However, there was no difference indirection, F(1,15) = 0.82, p = 0.381, partial η2 = 0.05, or responsemode, F(1,15) = 0.01, p = 0.93, partial η2 = 0.001 and none ofthe two-way interactions approached statistical significance (allps > 0.4).
The set of 200 digits were articulated significantly more rapidly(M = 69.63, SD = 12.85) than the set of 200 letters (M = 76.81,SD = 9.70), t(15) = 2.71, p = 0.02, r = 0.57. However, there were nosignificant correlations between the span scores and articulationrate (all ps > 0.28). Thus, the better performance in digit spanthan letter span cannot be explained by a slower articulation ratefor letters than digits.
To test if the lack of a directional effect in Experiment 1 and3 is due to lack of power we collapsed the data from all hear-ing participants in Experiment 1 and 3, but were still not ableto find an effect of direction, F(1,33) = 1.92, p = 0.18, partialη2 = 0.06.
Finally, we investigated if there were differences betweenkeyboard response in Experiment 3 and SHN from Experiment1 and between written response in Experiment 3 and BHNfrom Experiment 2. We found that the non-signers in Exper-iment 3 had a significantly better overall performance thannon-signers in Experiment 1, F(1,32) = 14.02, p = 0.001, partialη2 = 0.31, whereas there were no difference between the non-signers in Experiment 2 and 3, F(1,44) = 0.88, p = 0.35, partialη2 = 0.02.
FIGURE 3 | Mean forward and backward digit and letter span for all
hearing non-signers from Experiment 1 to 3 divided by response mode
and cultural setting.
DISCUSSIONThe results of Experiment 3 demonstrated that the difference inSTM span performance between the Swedish and British par-ticipants observed in the cross experiment analysis cannot beattributed to the use of different response modes. Because theparticipants enrolled in Experiment 3 performed on par withthe non-signers in Experiment 2 and significantly better thanthe non-signers in Experiment 1 the significant difference in per-formance between the Swedish and British participants found inthe cross experiment analysis is probably due to differences inthe overall design of the studies in which the individual experi-ments were included and lack of participant matching betweenexperiments. In particular, the educational background of theparticipants differed between Experiments 1 and 3. Whereas allparticipants in Experiment 3 had at least 3 years of universityeducation, only one-third of the participants in each of the twogroups in Experiment 1 had a university degree. Level of edu-cation is positively correlated with cognition (e.g., Kuncel et al.,2004; St Clair-Thompson and Gathercole, 2006), and thus it isplausible that better STM performance in Experiment 3 com-pared to Experiment 1 was due to differences in level of education(Unsworth and Engle, 2007).
The lack of directional effect mirrors the results of Experiments1 and 2 for non-signing participants. As we have already noted, thevisual presentation used in the present study is likely to reduce theeffect of recall direction. Interestingly, several participants com-mented after completing the testing that they were surprised tofind backward recall easier than forward recall.
We found faster articulation rates for digits than letters but wefound no association between articulation rate and span size foreither digits nor letters. Thus, although we cannot exclude thepossibility that articulation rate explains some of the between-group differences in STM performance, the evidence suggests thatit does not constitute a key underlying mechanism. This contraststo other studies where such a correlation has been described forboth digit and letter span in hearing individuals (Hall and Bavelier,2010).
GENERAL DISCUSSIONIn the present study, we investigated WM and STM using a novelapproach based on keeping stimulus presentation and responsemodes constant across groups, while assuming similar recod-ing demands in relation to memory encoding and recall acrossgroups. For the first time, we investigated WM performancebetween well-matched groups of deaf signers and hearing non-signers on a digit-based operation span task and were unableto identify differences in performance. In line with the litera-ture, we also showed poorer STM performance for deaf signerscompared to hearing non-signers on a digit span task. Thissuggests that deaf signers and hearing non-signers have equiv-alent digit-based WM despite poorer STM performance fordeaf signers compared to hearing non-signers on a digit spantask. These findings confirm and extend previous work demon-strating similar WM performance for deaf signers and hearingnon-signers on a production span task involving storage andprocessing of lexical items (Boutla et al., 2004). This suggeststhat the WM processing capacity of deaf signers can outweigh
www.frontiersin.org December 2013 | Volume 4 | Article 942 | 9

“fpsyg-04-00942” — 2013/12/12 — 20:03 — page 10 — #10
Andin et al. Short-term and working memory in deaf signers
any STM storage decrement, even when WM processing involvesdigits.
In the present study we used operation span as a measure ofWM and found no differences between deaf signers and hearingnon-signers. This well-established test loads strongly on over-all WM capacity (Unsworth and Engle, 2005, 2007). It also hasthe advantage of being digit-based, thus making it comparablewith the digit span test of STM and avoiding the use of speech-based lexical items which are known to make different cognitiveprocessing demands on deaf signers and hearing non-signers.The mechanisms behind similar WM but different STM for deafsigners and hearing non-signers on digit-based tasks need to beinvestigated experimentally and it may turn out that the storagecomponent is more heavily taxed for deaf signers in both tasks.However, one explanation may be a different or more efficientallocation of resources between the storage and processing com-ponents of WM for deaf signers than hearing non-signers, whichwould compensate for poorer STM storage for digits. Such aneffect may be related to the ability of signers to generate proposi-tions at the same rate as speakers with economical use of lexicalitems (Bellugi and Fischer, 1972). One of the main functionsof WM is the comprehension and generation of propositions(Baddeley, 2003).
For the first time we present results from a cross culturalanalysis of STM in deaf signers and hearing non-signers. Therewas a difference in performance between Experiments 1 and 2with British participants showing consistently better STM per-formance than Swedish participants. Experiment 3 showed thatbetter performance by British than Swedish participants couldnot be explained by the difference in response mode betweenExperiments 1 and 2. Instead, we suggest that the reason forthe difference between experiments is twofold: Firstly, it maystem from potential differences in participant characteristicsbetween experiments. Although these were rigorously controlledwithin experiments, the same was not possible between exper-iments. In particular, we suggest that potential differences inlevel of education between experiments may have driven thedifferences in STM. Secondly, as already suggested participantsin Experiment 1 may have been more fatigued than partici-pants in Experiment 2 and 3 when they performed the spantasks.
Experiment 1 provided some evidence of STM performancedifferences relating to language modality (sign and speech) andcharacter (digit and letter) in support of our hypothesis. In Exper-iment 1 and in the cross experiment analysis, we found evidenceof shorter digit but not letter spans for sign than speech forthe first time in one and the same analysis. Shorter digit spanfor deaf signers compared to hearing non-signers was shownpreviously by Bavelier et al. (2008) and no difference betweendeaf signers and hearing non-signers on letter span was shownby Wilson and Emmorey (2006a). The results of the presentstudy are in line with our hypothesis, based on Wilson andEmmorey (1997a, 2006b), that the formational similarity of man-ual numerals representing digits, compared to the phonologicaldistinctiveness of spoken digits, would generate a phonologicalsimilarity effect leading to poorer STM performance for sign-ers than speakers, whereas no such effect would be apparent for
letters chosen explicitly to minimize the formational similarity oftheir sign names and the phonological similarity of their spokennames.
There was no evidence of shorter letter spans for DS than HN aswould have been predicted by the findings of Bavelier et al. (2008).At least three factors differentiate the present study from the studyby Bavelier et al. (2008) where group differences were found forboth digit and letter span. The first is that the present study useda within-group comparison of digit and letter span, guardingagainst sampling differences leading to a more stringent com-parison between the two span types. The second is that groupsin the present study were matched on non-verbal intelligence,whereas any cognitive differences between the groups may haveconfounded the observed effects in Bavelier et al. (2008). Thethird and presumably the most important difference, relatesto presentation mode, where the present study makes con-sistent use of text-based visual presentation, whereas Bavelieret al. (2008) used auditory presentation for hearing non-signersand signed presentation for deaf signers. For both deaf signersand hearing non-signers text-based visual presentation prob-ably requires phonological recoding. However, because visualpresentation removes the opportunity for the hearing individu-als to take advantage of longer lasting auditory memory traces(Cowan, 2000), it is expected that the performance of the hear-ing individuals decreases more than that of the deaf individualsin the visual presentation mode. Therefore, we suggest thatthe visual presentation employed in the present study makesgroup comparisons more equal and that the remaining differ-ence between groups on the digit span task reflects the “true”difference between groups and that this difference is relatedto differences in the phonological similarity of recoded dig-its between the two language modalities of sign and speech.However, because the language modality by character interac-tions were not statistically significant, possibly due to insuf-ficient power, simple main effects should be interpreted withcaution.
The lack of digit span difference between deaf signers andhearing non-signers in Experiment 2 was unexpected but mightindicate an element of speech phonology in the STM represen-tation of printed digits by BDS (Hanson, 1982). All but one ofthe SDS had been educated mainly in SSL in accordance withthe 1983 Swedish National school curriculum (Svartholm, 2010).No comparable national curriculum exists in Britain and indi-vidual schools have varying communication policies. Thus, theBDS group was less likely to have had a strong emphasis on signlanguage during their education and might be expected to usespeech phonology in representation of printed digits and lettersto a greater extent than SDS and might therefore not be affectedto the same extent by the phonological similarity of the manualnumerals.
We predicted that if temporal processing differencesbetween signed and spoken languages influence STM, hearingnon-signers – but not deaf signers – would perform worse onbackward than forward recall. We did not find any evidence sup-porting this in either Experiment 1 or 2 or in the cross experimentalanalysis. This is in line with Gozzi et al. (2011) who found nosupport for serial order being a detrimental factor for the STM
Frontiers in Psychology | Cognition December 2013 | Volume 4 | Article 942 | 10
“fpsyg-04-00942” — 2013/12/12 — 20:03 — page 11 — #11
Andin et al. Short-term and working memory in deaf signers
discrepancy between signers and speakers. Some of the work onwhich we based our hypothesis studied STM in children (e.g.,O’Connor and Hermelin, 1973; Wilson et al., 1997). Deficits in theallocation of attention in time sometimes found in deaf childrenlargely resolve by adulthood (Dye and Bavelier, 2010). Thus, it ispossible that lower STM in deaf children is partially explained bydeficits in temporal processing not found in deaf adults. How-ever, other recent studies have shown differences in temporalorder processing in adult signers and speakers in STM using freerecall (Bavelier et al., 2008) and WM using temporal versus spa-tial modes of presentation (Rudner et al., 2010). The temporalprocessing manipulation in the present study involved directionof recall. Both forward and backward recall require maintenanceof temporal order while processing differs between directions.In line with Bavelier et al. (2008), we conclude that the rela-tive difference in temporal processing demands between forwardand backward serial recall does not differ between the languagemodalities of sign and speech in adult deaf signers and hearingnon-signers.
CONCLUSIONFor the first time we have shown similar digit-based WM perfor-mance for deaf signers and hearing non-signers in both Swedishand British populations. This extends previous findings of similarlexically based WM for signers and non-signers. Importantly, thisshows that deaf signers and hearing non-signers can have equiv-alent digit-based WM despite poorer digit-based STM. Further,we have shown that poor digit span performance for deaf signerscompared to hearing non-signers is probably due to the greaterphonological similarity for deaf signers, since no between-groupdifferences were found for letter span. We found no differencesbetween deaf signers and hearing non-signers in the relativeeffect of recall direction, suggesting that these particular tem-poral processing demands do not play out differently in STMfor these two groups when stimuli are printed. Nonetheless,because simple span tests seem to be confounded by phono-logical similarity, we suggest that WM tasks, either verbal ordigit-based, may provide a better test of cognitive function in deafindividuals.
ACKNOWLEDGMENTSWe would like to thank all participants for their participation,Lena Davidsson for sign language interpreting as well as testingof deaf participants in Experiment 1, Sally Reynolds for testingof deaf participants in Experiment 2 and Örjan Dahlström forstatistical support. The work was supported by funding from theSwedish Research Council (grant number 20051353), the SwedishResearch Council for Working Life and Social Science (grantnumber 2008-0846), and Riksbankens jubileumsfond (grant num-ber P2008-0481:1-E). Bencie Woll’s work is supported by theEconomic and Social Research Council of Great Britain (RES-620-28-6001; RES-620-28-0002): Deafness Cognition and LanguageResearch Centre.
AUTHOR CONTRIBUTIONSExperiment 1 was prepared and designed by Josefine Andin, JerkerRönnberg, and Mary Rudner, Experiment 2 by Josefine Andin,
Jerker Rönnberg, Mary Rudner, Eleni Orfanidou, Cheryl M. Capekand Bencie Woll and Experiment 3 by Josefine Andin, Mary Rud-ner, and Emil Holmer. Acquisition of data was done by JosefineAndin together with interpreter Lena Davidsson (acknowledged)in Experiment 1, by Eleni Orfanidou, Velia Cardin, and SallyReynolds (acknowledged) in Experiment 2 and by Emil Holmerin Experiment 3. Analysis and interpretation of results was carriedout mainly by Josefine Andin and Mary Rudner in Experiment1 and Experiment 2 and by Mary Rudner and Emil Holmer inExperiment 3. The first draft of the manuscript was written byJosefine Andin and Mary Rudner. All authors took part in criticalrevision of the manuscript.
REFERENCESAlamargot, D., Lambert, E., Thebault, C., and Dansac, C. (2007). Text composition
by deaf and hearing middle-school students: the role of working memory. Read.Writ. 20, 333–360. doi:10.1007/s11145-006-9033-y
Baddeley, A. (2003). Working memory and language: an overview. J. Commun.Disord. 36, 189–208. doi:10.1016/S0021-9924(03)00019-4
Baddeley, A., Thomson, N., and Buchanan, M. (1975). Word length and struc-ture of short-term memory. J. Verbal Learn. Verbal Behav. 14, 575–589.doi:10.1016/S0022-5371(75)80045-4
Bavelier, D., Newport, E. L., Hall, M., Supalla, T., and Boutla, M. (2006). Persistentdifference in short-term memory span between sign and speech: implicationsfor cross-linguistic comparisons. Psychol. Sci. 17, 1090–1092. doi:10.1111/j.1467-9280.2006.01831.x
Bavelier, D., Newport, E. L., Hall, M., Supalla, T., and Boutla, M.(2008). Ordered short-term memory differs in signers and speakers:implications for models of short-term memory. Cognition 107, 433–459.doi:10.1016/j.cognition.2007.10.012
Beaman, C., and Morton, J. (2000). The separate but related origins of therecency effect and the modality effect in free recall. Cognition 77, B59–B65.doi:10.1016/S0010-0277(00)00107-4
Bellugi, B., and Fischer, S. (1972). A comparison of sign language and spokenlanguage. Cognition 1, 173–200.
Bergman, B., and Wikström, L.-Å. (1981). Supplement till Forskn-ing om Teckenspråk, videogram I: Svenska handalfabetet och bokstaver-ade tecken [Supplement to Research on sign language, videogram I;Swedish manual alphabet and fingerspelled signs]. Stockholm: Stockholmsuniversitet.
Boutla, M., Supalla, T., Newport, E. L., and Bavelier, D. (2004). Short-termmemory span: insights from sign language. Nat. Neurosci. 7, 997–1002.doi:10.1038/nn1298
Brentari, D. (1998). A Prosodic Model of Sign Language Phonology. Cambridge, MA:MIT Press.
Carmel, S. J. (1982). International Hand Alphabet Charts. Silver Spring, MD:National Association of the Deaf.
Conrad, R. (1970). Short-term memory processes in the deaf. Br. J. Psychol. 61,179–195.
Conrad, R., and Hull, A. (1968). Input modality and the serial position curve inshort-term memory. Psychon. Sci. 10, 135–136.
Cowan, N. (2000). The magical number 4 in short-term memory: a recon-sideration of mental storage capacity. Behav. Brain Sci. 24, 87–185.doi:10.1017/S0140525X01003922
Cowan, N., Saults, J., and Brown, G. (2004). On the auditory modality superiorityeffect in serial recall: separating input and output factors. J. Exp. Psychol. Learn.Mem. Cogn. 30, 639–644. doi:10.1037/0278-7393.30.3.639
Darwin, C. J., Turvey, M. T., and Crowder, R. G. (1972). An auditory analogue ofthe Sperling partial report procedure: evidence for brief auditory storage. Cogn.Psychol. 3, 255–267. doi:10.1016/0010-0285(72)90007-2
Dye, M. W. G., and Bavelier, D. (2010). Differential development ofvisual attention skills in school-age children. Vision Res. 50, 452–459.doi:10.1016/j.visres.2009.10.010
Elliott, J. M. (1992). Forward digit span and articulation speed for Malay,English, and 2 Chinese dialects. Percept. Mot. Skills 74, 291–295.doi:10.2466/pms.1992.74.1.291
www.frontiersin.org December 2013 | Volume 4 | Article 942 | 11
“fpsyg-04-00942” — 2013/12/12 — 20:03 — page 12 — #12
Andin et al. Short-term and working memory in deaf signers
Ellis, N. C., and Hennelly, R. A. (1980). A bilingual word-length effect: impli-cations for intelligence testing and the relative ease of mental calculation inWelsh and English. Br. J. Psychol. 71, 43–51. doi:10.1111/j.2044-8295.1980.tb02728.x
Emmorey, K. (2002). Language, Cognition and the Brain: Insights from Sign LanguageResearch. Mahwah, NJ: Lawrence Erlbaum Associates.
Forster, K., and Forster, J. (2003). A windows display program with millisecondaccuracy. Behav. Res. Methods Instrum. Comp. 35, 116–124. doi:10.3758/BF03195503
Geraci, C., Gozzi, M., Papagno, C., and Cecchetto, C. (2008). How grammar can copewith limited short-term memory: simultaneity and seriality in sign languages.Cognition 106, 780–804. doi:10.1016/j.cognition.2007.04.014
Gozzi, M., Geraci, C., Cecchetto, C., Perugini, M., and Papagno, C. (2011). Lookingfor an explanation for the low sign span. Is order involved? J. Deaf Stud. DeafEduc. 16, 101–107. doi:10.1093/deafed/enq035
Hall, M., and Bavelier, D. (2010). “Working memory, deafness, and sign language,”in Oxford Handbook of Deaf Studies, Language, and Education, Vol. 2, eds M.Marschark and P. A. Spencer (London: Oxford University Press), 458–472.
Hall, M., and Bavelier, D. (2011). Short-term memory stages in sign vs.speech: the source of the serial span discrepancy. Cognition 120, 54–66.doi:10.1016/j.cognition.2011.02.014
Hanson, V. L. (1982). Short-term recall by deaf signers of American sign language:implications of encoding strategy for order recall. J. Exp. Psychol. Learn. Mem.Cogn. 8, 572–583. doi:10.1037/0278-7393.8.6.572
Harvey, A., and Beaman, C. (2007). Input and output modality effects in immediateserial recall. Memory 15, 693–700. doi:10.1080/09658210701644677
Klima, E. S., and Bellugi, U. (1976). Poetry and song in a language without sound.Cognition 4, 45–97. doi:10.1016/0010-0277(76)90010-x
Klima, E. S., and Bellugi, U. (1979). The Signs of Language. Cambridge, MA: HarvardUniversity Press.
Koo, D., Crain, K., LaSasso, C., and Eden, G. F. (2008). Phonological awarenessand short-term memory in hearing and deaf individuals of different com-munication backgrounds. Learn. Skill Acquist. Read. Dyslexia 1145, 83–99.doi:10.1196/annals.1416.025
Kuncel, N. R., Hezlett, S. A., and Ones, D. S. (2004). Academic performance, careerpotential, creativity, and job performance: can one construct predict them all? J.Pers. Soc. Psychol. 86, 148–161. doi:10.1037/0022-3514.86.1.148
Li, S. C., and Lewandowsky, S. (1995). Forward and backward recall: dif-ferent retrieval-processes. J. Exp. Psychol. Learn. Mem. Cogn. 21, 837–847.doi:10.1037/0278-7393.21.4.837
Locke, J. L., and Locke, V. L. (1971). Deaf children’s phonetic, visual and dactyliccoding in a grapheme recall task. J. Exp. Psychol. 89, 142–146.
Marschark, M., and Mayer, T. S. (1998). Interactions of language and memoryin deaf children and adults. Scand. J. Psychol. 39, 145–148. doi:10.1111/1467-9450.393069
O’Connor, N., and Hermelin, B. (1973). Short-term memory for the order of pic-tures and syllables by deaf and hearing children. Neuropsychologia 11, 437–442.doi:10.1016/0028-3932(73)90031-6
Penney, C. G., and Blackwood, P. A. (1989). Recall mode and recency in immediateserical recall: computer users beware. Bull. Psychon. Soc. 27, 545–547.
Pintner, R., and Paterson, D. G. (1917). A comparison of deaf and hearing childrenin visual memory for digits. J. Exp. Psychol. 2, 76–88. doi:10.1037/h0072870
Rönnberg, J., Archer, T., and Ohlsson, K. (1980). Temporal factors in audition andvision: a functional emphasis. Scand. J. Psychol. 21, 241–247. doi:10.1111/j.1467-9450.1980.tb00367.x
Rönnberg, J., and Nilsson, L. G. (1987). The modality effect, sensory handicap,and compensatory functions. Acta Psychol. 65, 263–283. doi:10.1016/0001-6918(87)90053-9
Rönnberg, J., Rudner, M., and Ingvar, M. (2004). Neural correlates ofworking memory for sign language. Cogn. Brain Res. 20, 165–182.doi:10.1016/j.cogbrainres.2004.03.002
Rosen, V. M., and Engle, R. W. (1997). Forward and backward serial recall.Intelligence 25, 37–47. doi:10.1016/S0160-2896(97)90006-4
Ross, B. M. (1969). Sequential visual memory and the limited magic of numberseven. J. Exp. Psychol. 80, 339–347.
Rudner, M., Davidsson, L., and Rönnberg, J. (2010). Effects of age on the temporalorganization of working memory in deaf signers. Aging Neuropsychol. Cogn. 17,360–383. doi:10.1080/13825580903311832
Rudner, M., Fransson, P., Ingvar, M., Nyberg, L., and Rönnberg, J.(2007). Neural representation of binding lexical signs and words in theepisodic buffer of working memory. Neuropsychologia 45, 2258–2276.doi:10.1016/j.neuropsychologia.2007.02.017
Rudner, M., Karlsson, T., Gunnarsson, J., and Rönnberg, J. (2013). Lev-els of processing and language modality specificity in working mem-ory. Neuropsychologia 51, 656–666. doi:10.1016/j.neuropsychologia.2012.12.011
Rudner, M., and Rönnberg, J. (2008). Explicit processing demands reveal languagemodality-specific organization of working memory. J. Deaf Stud. Deaf Educ. 13,466–484. doi:10.1093/deafed/enn005
Sandler, W., and Lillo-Martin, D. (2006). Sign Language and Linguistic Universals.Cambridge, NY: Cambridge University Press.
Shand, M. A., and Klima, E. S. (1981). Nonauditory suffix effects in congenitallydeaf signers of American sign language. J. Exp. Psychol. Hum. Learn. Mem. 7,464–474. doi:10.1037/0278-7393.7.6.464
Smyth, M. M., Hay, D. C., Hitch, G. J., and Horton, N. J. (2005). Serialposition memory in the visual-spatial domain: reconstructing sequences ofunfamiliar faces. Q. J. Exp. Psychol. A Hum. Exp. Psychol. 58, 909–930.doi:10.1080/02724980443000412
Sperling, G. (1960). The information available in brief visual presentation. Cogn.Psychol. 74, 1–29.
St Clair-Thompson, H. L., and Gathercole, S. E. (2006). Executive func-tions and achievements in school: shifting, updating, inhibition, and work-ing memory. Q. J. Exp. Psychol. 59, 745–759. doi:10.1080/17470210500162854
Sutton-Spence, R., and Woll, B. (1999). The Linguistics of British Sign Language.Cambridge: Cambridge University Press.
Svartholm, K. (2010). Bilingual education for deaf children in Sweden. Int. J. Biling.Educ. Biling. 13, 159–174. doi:10.1080/13670050903474077
Traxler, C. B. (2000). The Stanford Achievement Test, 9th Edition: National Normingand Performance Standards for Deaf and Hard-of-Hearing Students. J. Deaf Stud.Deaf Educ. 5, 337–348. doi:10.1093/deafed/5.4.337
Turner, M. L., and Engle, R. W. (1989). Is working memory capacitytask dependent? J. Mem. Lang. 28, 127–154. doi:10.1016/0749-596X(89)90040-5
Unsworth, N., and Engle, R. W. (2005). Working memory capacity and fluid abilities:examining the correlation between operation span and raven. Intelligence 33,67–81. doi:10.1016/j.intell.2004.08.003
Unsworth, N., and Engle, R. W. (2007). On the division of short-term and work-ing memory: an examination of simple and complex span and their relation tohigher order abilities. Psychol. Bull. 133, 1038–1066. doi:10.1037/0033-2909.133.6.1038
Wallace, G., and Corballis, M. C. (1973). Short-term memory and coding strategiesin the deaf. J. Exp. Psychol. 99, 334–348.
Wilson, M., Bettger, J., Niculae, I., and Klima, E. (1997). Modality of languageshapes working memory: evidence from digit span and spatial span in ASLsigners. J. Deaf Stud. Deaf Educ. 2, 150–160. doi:10.1093/oxfordjournals.deafed.a014321
Wilson, M., and Emmorey, K. (1997a). A visuospatial “phonological loop” in work-ing memory: evidence from American sign language. Mem. Cogn. 25, 313–320.doi:10.3758/BF03211287
Wilson, M., and Emmorey, K. (1997b). Working memory for sign language: awindow into the architecture of the working memory system. J. Deaf Stud. DeafEduc. 2, 121–130.
Wilson, M., and Emmorey, K. (1998). A “word length effect” for sign language:further evidence for the role of language in structuring working memory. Mem.Cogn. 26, 584–590. doi:10.3758/BF03201164
Wilson, M., and Emmorey, K. (2006a). Comparing sign language and speech revealsa universal limit on short-term memory capacity. Psychol. Sci. 17, 682–683.doi:10.1111/j.1467-9280.2006.01766.x
Wilson, M., and Emmorey, K. (2006b). No difference in short-term memoryspan between sign and speech. Psychol. Sci. 17, 1093–1094. doi:10.1111/j.1467-9280.2006.01835.x
Conflict of Interest Statement: The authors declare that the research was conductedin the absence of any commercial or financial relationships that could be construedas a potential conflict of interest.
Frontiers in Psychology | Cognition December 2013 | Volume 4 | Article 942 | 12
“fpsyg-04-00942” — 2013/12/12 — 20:03 — page 13 — #13
Andin et al. Short-term and working memory in deaf signers
Received: 14 August 2013; accepted: 28 November 2013; published online: 16 December2013.Citation: Andin J, Orfanidou E, Cardin V, Holmer E, Capek CM, Woll B, RönnbergJ and Rudner M (2013) Similar digit-based working memory in deaf signersand hearing non-signers despite digit span differences. Front. Psychol. 4:942. doi:10.3389/fpsyg.2013.00942This article was submitted to Cognition, a section of the journal Frontiers inPsychology.
Copyright © 2013 Andin, Orfanidou, Cardin, Holmer, Capek, Woll, Rönnbergand Rudner. This is an open-access article distributed under the terms ofthe Creative Commons Attribution License (CC BY). The use, distribu-tion or reproduction in other forums is permitted, provided the originalauthor(s) or licensor are credited and that the original publication in thisjournal is cited, in accordance with accepted academic practice. No use, dis-tribution or reproduction is permitted which does not comply with theseterms.
www.frontiersin.org December 2013 | Volume 4 | Article 942 | 13