signature of author i
TRANSCRIPT
STRUCTURE AND ELECTRICAL PROPERTIES OF ASSEMBLIES OFPOLYANILINE: FROM BLENDS TO SELF-ASSEMBLED MULTILAYERS
William B. Stockton
B.S. Chemical Engineering, Rice University (1985)M.S. Chemical Engineering, Princeton University (1987)
Submitted to the Department of Materials Science and Engineering and theProgram in Polymer Science and Technology in partial fulfillment of the
requirements for the degree of
Doctor of Philosophy
at the
Massachusetts Institute of Technology
June 1995
© 1995 Massachusetts Institute of TechnologyAll rights reserved
Signature of Author i... - -Department of Materials Science and Engineering
May 5, 1995
Certified byProfessor Michael F. Rubner
TDK Professor of Polymer ScienceThesis Supervisor
Accepted by i ---Professor Carl V. Thompson II
Professor of Electronic MaterialsChair, Departmental Committee on Graduate Students
and by _ / Professor Edwin L. Thomas
Morris Cohen Professor of Polymer ScienceDirector, Program in Polymer Science and Technology
,4ASSACHUSETTS INSTITUTEOF TECHNOLOGY
JUL 2 01995
LIBRARIES
STRUCTURE AND ELECTRICAL PROPERTIES OF ASSEMBLIES OFPOLYANILINE: FROM BLENDS TO SELF-ASSEMBLED MULTILAYERS
William B. Stockton
Submitted to the Department of Materials Science and Engineering and theProgram in Polymer Science and Technology on May 5, 1995 in partialfulfillment of the requirements for the degree of Doctor of Philosophy inPolymer Science.
ABSTRACT
Assemblies of polyaniline (PAn) have been manipulated on two levels,1) preliminary investigations into solution-cast blends and 2) a more detailedstudy of self-assembled multilayer thin films formed via polymer adsorption.
Relatively stable, electrically conducting compatible blends of PAn withpoly(vinyl pyrrolidone) (PVP) have been cast from both N-methyl pyrrolidone(NMP) and N,N-dimethyl acetamide (DMAc). The two polymers were miscibleto the extent probed by thermal analysis (DSC and DMA), light microscopy,and SAXS. Blended films with a conductivity on the order of pure PAn (-1S/cm) require > -25 wt% PAn; conductivities two orders of magnitude lowercan be obtained with less than 5 wt% PAn. TGA results revealed high solventretention, particularly NMP, even after considerable drying of the films. Thisresidual solvent hinders conductivity. Conducting blends of PVP with pre-dopedPAn can also be cast directly from solution, but display lower conductivities.
The formation of thin polymer films through molecular layer-by-layeradsorption on a variety of substrates has been demonstrated for PAnalternating with non-ionic water soluble polymers. The adsorption is enabledby the strong interchain interactions with PAn, such as hydrogen bonding.Multilayer build-up has been demonstrated with four distinctly different non-ionic water soluble polymers: PVP, poly(vinyl alcohol) (PVA),poly(acrylamide) (PAAm), and poly(ethylene oxide) (PEO). Thus, non-ionicwater soluble polymers containing a wide variety of functional groups such asamide, hydroxyl or ether groups can be used to successfully fabricatemultilayer thin films with polyaniline. FTIR spectroscopy measurements showthe PAn to be hydrogen bonded in these multilayer films. The techniqueuniformly deposits multiple molecular layers, with each layer completelycovering the preceding one, as revealed by contact angle measurements.Conductivities for acid-doped multilayer films are on the order of 1-4 S/cm.Conductivities on the order of 0.1 S/cm can be achieved for a single mixed layerself-assembled from a mixed solution of PAn/PVP or PAn/PAAm. Effects ofmolecular weight, solution pH, and concentration on the adsorptionmechanism and resulting film structure are investigated.
Thesis Supervisor: Professor Michael F. RubnerTDK Professor of Polymer Science
2

ACKNOWLEDGMENTS
There are many individuals who contributed to this work throughdiscussions, teachings, instrument instruction, and general support. Below arethe most immediate few who made my graduate school experience a mostrewarding one.
I would like to especially thank my advisor, Prof. Michael F. Rubner forhis deep interest in my progress, his constant encouragement, and constantsupply of helpful advice. I also thank my Thesis Committee, Prof. DanielBlankschtein, Prof. Kirk D. Kolenbrander, and Prof. Edwin L. Thomas for theirtime and constructive input.
I've shared lab space and truck food with many Rubner Research Groupcolleagues over the years, and am thankful to have worked with such anoutstanding group of individuals whom I thank for their friendship, support,and assistance. In semi-chronological order they are: Haskell Beckham, PaulaHammond, Yading Wang, Tim Royapa, Rob Rosner, Josephine Cheung,Masahiro Rikukawa, Ken Zemach, Augustine Fou, Diane Ellis, MarysilviaFerreira, Dongsik Yoo, Carla DiBartolomeo, Bashir Dabbousi, Jeff Baur, OsamuOnitsuka, Mike Durstock, Erika Abbas, Erik Handy, and Pascal Besson. Thanksalso to Wade Samec and Anand Raghunathan, undergraduates working in ourlab, for tremendous experimental assistance. Special thanks to Sandy Schaefer-Ung who has been tremendously supportive in many ways, to me and theentire Research Group.
Thanks also goes out to people outside of our group for collaborativework: Dr. Greg Kellogg and Prof. Anne Mayes for all of the neutron reflectivitymeasurements and data interpretation, and John Martin, Libby Shaw, and TimMcClure for help with the Central Facilities. Thanks to the NSF and the MITCenter for Materials Science, who provided funding for this work.
Finally, for my weekly retreat from the lab, my radio show, I thankWMBR 88.1 FM for providing me a creative musical outlet. "Bring the noise..."
In memory of John Martin.
3

TABLE OF CONTENTS
Title ..................................................... 1.Abstract ..................................................... 2.Acknowledgments ..................................................... 3.Table of Contents ..................................................... 4.
List of Figures ..................................................... 6.List of Tables ..................................................... 9.
I. Introduction
I.A. Conducting Polymers ................................................ 10.I.A.1. Introductory Remarks ................................. ............... 10.I.A.2. Background ................................................ 12.
I.B. Polyaniline ................................................ 14.I.B.1. Background ................................................ 14.
I.B.2. Processing of Polyaniline Blends .............................................. 21.
I.C. Self-Assembled Multilayer Films ................................................ 24.
I.C.1. Polymer Adsorption Background ............................................25.I.C.2. Multilayer Adsorption of Conjugated Polymers ..................26.
II. Structure and Electrical Properties of Blends of Polyaniline with Poly (vinyl
pyrrolidone)
II.A. Experimental ................................................ 30.II.A.1. Synthesis and Preparation of Blends ......................................30.II.A.2. Characterization Techniques ................................................31.
II.B. Solvent Effects ................................................ 32.
II.C. Thermal Analysis ................................................ 33.II.C.1. Thermal Gravimetric Analysis ............................................... 33.
II.C.2. Differential Scanning Calorimetry .........................................37.II.C.3. Dynamic Mechanical Analysis ............................................... 39.
II.D. Light Microscopy ................................................ 41.
II.E. Small Angle X-ray Scattering .............................. .................. 47.
II.F. Electrical Conductivity ................................................ 47.
4

III. Self-Assembled Multilayer Films of Polyaniline
III.A. Introductory Remarks ........................................................ 51.III.B. Experimental ........................................................ 52.
III.B.1. Solution Preparations ........................................................ 52.
III.B.2. Film Deposition ........................................................ 53.
III.B.3. Characterization Techniques ................................................... 55.
III.C. Multilayer Film Deposition ........................................................ 56.
III.D. FTIR Determination of Hydrogen Bonding ........................................60.
III.E. Properties of Multilayer Films ........................................ 64.
III.F. Effects of pH on Deposition ........................................................ 67.
III.G. Effects of Molecular Weight on Deposition ........................................70.III.H. Interactions of Non-Ionic Polymers with Ionic Polymers ...............72.III.I. Conductivity vs. Number of Bilayers .................................................... 73.
III.J. Layer-by-Layer Surface Energy as Determined by Contact Angle..76.III.J.1. Contact Angle Background .......................................................76.III.J.2. Contact Angle Study for PAn/PVP Multilayer Films .........79.
III.K. Monolayer and Multilayer Deposition From Mixed Solutions ......86.
III.K.1. Monolayer Deposition From Mixed Solutions of PAn WithPVP and PAAm .................................................. 86.
III.K.2. Effect of Substrate on Monolayer Deposition from MixedSolutions ....................................................... 90.III.K.3. Varying the PAn/PVP Ratio and Concentration in theMixed Solution ....................................................... 95.
III.K.4. Multilayer Films of Mixed PAn/PVP with SPS ...................97.
III.L. Surface Topography by Atomic Force Microscopy ..........................103.
III.M. Neutron Reflectivity Study ....................................................... 105.
III.N. Chain Orientation by Dichroism Studies ..........................................105.
IV. Conclusions, Summary, and Future Work
IV.A. Summary - PAn/PVP Blends ............................................................ 109.
IV.B. Summary - Self-Assembly of PAn Multilayers .................................110.IV.C. Future Work ............................................................. 112.
References ............................................................. 116.
5

LIST OF FIGURES
Figure 1.1. Chemical structure of several conducting organic polymers ............15.
Figure I.2a. Chemical structure of polyaniline in its three oxidation states .......17.
Figure I.2b. Chemical structure of acid doping of polyaniline .............................18.
Figure 1.3. Chemical structure of sulfonated polyaniline ......................................20.
Figure I.4. Polymer chain adsorbed to a smooth vs. rough surface .....................26.
Figure I.5. Chemical structure of water soluble polymers used in this work ....29.
Figure II.1.
Figure II.2.
Figure II.3.
Figure II.4.
Figure II.5.
Figure II.6.
Figure II.7.
Figure II.8.
Histogram of TGA wt% loss from PAn/PVP-1M blend films (castfrom NMP) showing three weight loss regions ...............................34.
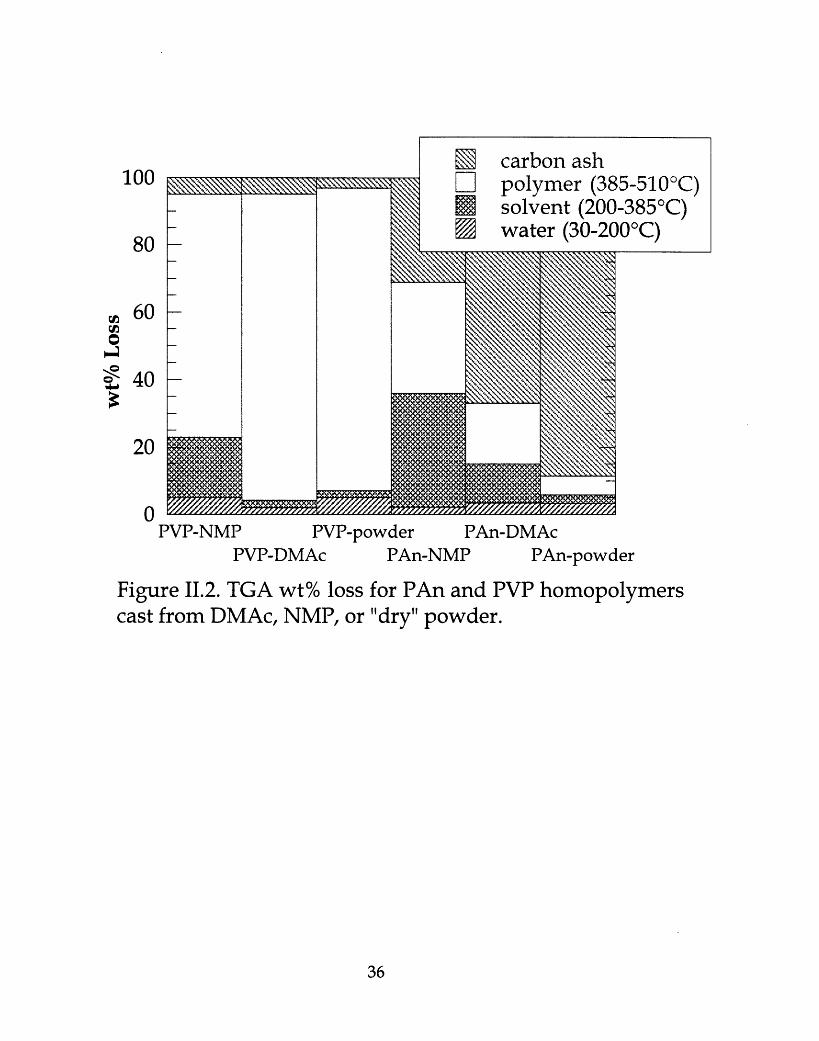
TGA wt% loss for PAn and PVP-1M homopolymers cast fromDMAc, NMP, or "dry" powder .................................................. 36.
DSC results (Tg and DCp) for PAn blends with PVP-1M and PVP-10K .................................................. 38.
Tg of PAn/PVP-1M blend (DB series) as measured by both DSC andDM A (loss tangent peak) ................................................. 40.
Light micrographs for PAn blends with PVP and PMMA, filmssolution cast from NMP (200x magnification) ..................................43.
Light micrographs for 50/50 blends of PAn with PVP and PMMA,films solution cast from NMP (1000x magnification) ................... 44.
Light micrographs for solution doped PAn blends with PVP andPMMA, films solution cast from NMP (1000x magnification) .......46.
Conductivity of HCl-doped PAn/PVP blends ....................................49.
Figure III.1. Light absorbance vs. adsorption time for PAn adsorption (fromthree concentrations) onto SPS treated glass ....................................54.
Figure III.2. Schematic of the self-assembly process, showing treating a glassslide, coating with SPS, then a PAn/PVP bilayer ............................57.
6

Figure III.3. Absorbance at 630 nm vs. number of bilayers for several PAnsystems: PVP- poly(vinyl pyrrolidone), PVA - poly(vinylalcohol), SPS - sulfonated polystyrene (low - low mw, hi - highmw), PEO - poly(ethylene oxide), PAAm -poly(acrylam ide) ........................................................... 59.
Figure III.4. IR spectra showing the N-H stretch region for PAn base, a 10bilayer film of PAn/PVP, a 50/50 PAn/PVP blend, and PVP .......61.
Figure III.5. IR spectra showing the N-H stretch region for PAn base, a 10bilayer film of PAn/PEO, a 50/50 PAn/PEO blend, and PEO .......62.
Figure III.6. Conductivity and film thickness as a function of number of bilayersfor two PAn/PVP systems ................................ .......................... 75.
Figure III.7. Schematic of a sessile water drop on a flat surface indicating thecontact angle, 0, and the interfacial tensions of the air-solid (ys),solid-liquid (si), and air-liquid () interfaces ..................................76.
Figure III.8. Absorbance at 620 nm vs. number of layers for 12 alternatingPAn/PVP layers. Note PVP layer shows no absorbance ................81.
Figure III.9. Contact angle vs. layer number for 12 layers (6-PAn, 6-PVP,alternating), for three different conditions, as noted ......................82.
Figure III.10 RMS roughness (as measured by AFM for a 10 x 10 gm area) vs.layer number for PAn layers only (alternating with PVP) ............84.
Figure III.1. Contact angle vs. layer number for 12 layers (6-PAn, 6-PVP,alternating), for two different conditions, as noted ........................85.
Figure III.12. AFM surface plot of a 1 x 1 gm area of layer 9 (PAn) in the 12 layerPAn/PVP film .................................................. 8................... ....... 87.
Figure III.13. AFM surface plot of a 1 x 1 gm area of layer 11 (PAn) in the 12layer PAn/PVP film ........................................................... 88.
Figure III.14. AFM surface plot of a 1 x 1 gm area of layer 12 (PVP) in the 12layer PAn/PVP film ........................................................... 89.
Figure III.15. Absorbance at 630 nm vs. adsorption time for a 50/50 mixedsolution of PAn/PVP, using either NMP or DMAc as the PAnsolvent ........................................................... 91.
7
Figure III.16.
Figure III.17.
Figure III.18.
Figure III.19.
Figure III.20.
Figure III.21.
Histogram of cumulative absorbance for layers of PAn, PVP, andPAn/PVP mixed solution; six different films ................................... 93.
Contact angle for the six films from Figure III.16 for threedifferent conditions ................................................ 94.
Absorbance at 870 nm vs. bilayer number for a series of PAn/PVPmixed solution monolayers, varying the PAn/PVP ratio.(Deposited onto two bilayers of PAn/SPS) ....................................... 96.
Contact angle for the series from Figure III.18 (PAn/PVP mixedsolution films varying the PAn/PVP ratio), for three differentconditions ................................................ 98.
Absorbance at 860 nm vs. bilayer number for a series of PAn/PVPmixed solution multilayer films built up with SPS, varying thePAn/PVP ratio (overall polymer concentration = 0.01 M) .......... 100.
Absorbance at 860 nm vs. bilayer number for a series of PAn/PVPmixed solution multilayer films built up with SPS, varying thePAn/PVP ratio (PAn concentration = 0.01 M) ................................ 101.
Figure III.22. Polarized UV-visible absorption spectra for three PAnmultilayers, PAn/PVP, PAn/PVA, and PAn/SPS. Light polarizedparallel to the plane of incidence is labeled P, perpendicular is S.The angle of incidence is 45 .................... 107.
8

LIST OF TABLES
Table III.1. Average thickness and absorbance for multilayer films of PAn witha series of water-soluble polymers .................................................... 66.
Table III.2. Effect of the pH of the water-soluble polymer solution on theaverage thickness and absorbance for multilayer films of PAn...69.
Table III.3a. Effect of PVP molecular weight on the average thickness andabsorbance for multilayer films of PAn ............................................71.
Table III.3b. Effect of SPS molecular weight on the average thickness andabsorbance for multilayer films of PAn ............................................71.
Table III.4. Absorbance at 870 nm for PAn/PVP mixed solution layers as afunction of solution concentration .....................................................97.
Table III.5. Selected properties of six bilayer films of SPS with PAn/PVP mixedsolution layers .............................................. 102.
Table III.6. Root mean square (RMS) roughness of adsorbed polymer films asmeasured by AFM .............................................. 104.
9

STRUCTURE AND ELECTRICAL PROPERTIES OF ASSEMBLIES OF
POLYANILINE: FROM BLENDS TO SELF-ASSEMBLED MULTILAYERS
CHAPTER I. INTRODUCTION
I.A. Conducting Polymers
I.A.1. Introductory Remarks
The field of electrically conducting polymers continues to grow rapidly,with the range of applications, both speculated and realized, ever expanding.The driving force behind much of this work is the potential for a variety ofelectroactive properties combined with some of the advantages of polymers,such as the relative ease in processing, certain mechanical properties, chemicalresistance, and light weight. Conducting polymers are well suited for manyapplications, including semiconductor devices [1], energy storage anddistribution [2], conductive composites and coatings, a wide variety of sensors,rechargeable batteries, nonlinear optical materials [3], and evenelectromechanical actuators [4]. Polyaniline alone has been investigated foruses as rechargeable battery electrodes [5-7], conductive fibers and textiles [8,9], EMI shielding [10], transparent thin film electrodes [11-13], electrochromicwindows and devices [5, 14-17], infrared polarizers [18], electrostatic discharge[19, 20] and non-conducting applications such as a patternable photoresist [20,21], fluid separation membranes [22], and corrosion resistant coatings [23].These examples constitute only a small fraction of the many proposed andinvestigated applications of what can be considered a rather novel material.
There are, of course, significant hurdles to overcome in achieving morewide-spread use of conducting polymers and to tap into the specific electrical
10

properties, such as the reversible switching from insulator to conductor. Theachievable levels of conductivity range from highly insulating (generally < 10-8S/cm for conjugated polymers [24] ) up to about 105 S/cm (for highly orientediodine-doped polyacetylene in inert atmospheres) [25]. More typical values forair stable systems are between 10-1 and 102 S/cm, which are generally quiteadequate for a wide variety of applications calling for limited electronicconduction. To put these values into perspective, conventional metalconductors such as silver, copper, and gold have conductivities on the order of105 - 106 S/cm.
Also, it is well known that conducting polymers are relatively unstableconductors, being susceptible to environmental (extrinsic) and/orthermodynamic (intrinsic) forces that can act to "dedope" the polymer, orrevert the material back to insulating. This dedoping can occur extrinsically,such as thermal or externally-driven chemical reversal of an oxidized (doped)backbone, or intrinsically, where there is little energy barrier for the dopedstate to return to its more stable insulating form by reversing the dopingprocess.
Several classes of conducting polymers are known for their relativestability within the class of conducting polymers, namely polyanilines,polypyrroles, and polythiophenes. These three are intrinsically conducting intheir doped form, susceptible primarily to external dedoping processes. It isthese three types that show the most promise in terms of the above mentionedapplications, primarily for stability reasons.
Processing and manipulating these polymers into desired shapes, be itfilms, fibers, or thin coatings, presents an additional challenge. Generallyspeaking, the processing of conducting polymers is tremendously less energyintensive than for conventional electronic materials, but is still somewhatproblematic relative to conventional polymers. It is this challenge, that ofmanipulating conducting polymers into useful blends, coatings, or films, that isthe basis of this thesis. The goal of this work is to develop and characterize thestructure and resulting electrical properties of assemblies of conductingpolymers.
11

I.A.2. Conducting Polymers - Background
Conducting polymers generally refers to a class of organic conjugatedpolymers that demonstrate, under certain conditions, electrical conductivity.This is distinguished from ionic conductivity in that the charge carriers aremore akin to those in metals (electrons and holes), rather than ionic species(electrolytes). What enables electrical conduction in an organic polymer is itsconjugation, or overlapping of Pz orbitals along the backbone, that can lead tomobile charge carriers. Electrons can be delocalized over a series of rmolecular orbitals, as opposed to the tightly bound, highly localized electronsin saturated a bonding orbitals. The existence of a conjugated chain is not
sufficient to render a polymer conductive, however, as the lowest energy stateof these polymers generally does not consist of completely delocalized 7-electrons. The model example of this is polyacetylene, one of the firstdiscovered conducting polymers [26]. Every carbon along its backbone has a Pzorbital overlapping with its neighbor. But rather than having uniformlydistributed nr-electrons (completely delocalized), the ground state ofpolyacetylene consists of alternating single and double bonds, with only verylimited delocalization. The result is a band gap (between the bonding -valenceband and the antibonding ir*-conduction band) of about 1.5 eV [27], close to that
of semiconductors. Similarly for other conjugated polymers, the ground statelimits electron delocalization, and their band gaps typically range from 1-4 eV[24].
What was observed by Shirakawa, et al., was that charge carriers couldbe created in polyacetylene by chemically oxidizing the backbone (removingelectrons), thus creating charge defects [26]. A single charge defect is called apolaron, which is a positive charge coupled with an unpaired electron, as aresult of the electron transfer to the oxidant (called the dopant). The dopant(now ionized) remains associated with the polaron as a counterion. This processis called doping, but is only loosely analogous to doping in the semiconductorindustry [28]. Traditional semiconductor dopant concentrations are in the partsper million range. For conducting polymers, dopant concentrations necessarilyexceed 1 mol%, as high as 50 mol% in some cases, thus can add significant massto the final system. The presence of dopant ions can also cause structuralchanges. It is likely that for many dopants, these changes cause structural
12

disorder, although efforts have been made to use dopant counterions that will
enhance order [29].Due to the conjugation, this new charge defect (the polaron) can be
delocalized to some extent along the polymer backbone, but not completely. Itis still confined by the energetics of bond configurations, as well as counterionmobility. Thus these charge carriers are also not free to move like partially-filled valence band electrons, as in metallic conduction.
The formation of a polaron creates a new energy state in the middle ofthe band gap. Further oxidation on the same chain generally creates dications,(by removal of the unpaired electron) as it is energetically more favorable thanthe creation of a second polaron along a single polymer chain. Forpolyacetylene, which has a degenerate ground state, this dication is called asoliton. Additional doping forms more solitons. These cationic charge defectsall show approximately the same energy state, thus their energy falls withinone band, called the soliton band. For non-degenerate ground state polymers(most all others), the subsequent oxidation of a polaron forms two non-equivalent energy states. The two cations become delocalized over severalrepeat units, coupled in a state that has two possible configurations (one with ahigher energy that the other), called a bipolaron. Thus, two mid-gap bands areformed, one of higher energy than the other, called bipolaron bands [28].
Continued doping in either case acts to widen the mid-gap bands (eithersoliton or bipolaron) due to intrachain interactions as additional bipolarons orsolitons are formed. Eventually, these bands become close enough to thevalence and conduction bands to enable metal-like conductivity along a singlepolymer chain.
Of course, macroscopic conductivity must involve charge transfer fromchain to chain, and for polymers this can present a substantial barrier. Therelative importance of inter- to intra- chain charge mobility depends on thepolymer's microstructure, but both mechanisms contribute to an overall bulkconductivity. Certainly, ordered structures (crystals, drawn fibers) have betterconductivities, although this enhanced conductivity is generally anisotropic.Chain elongation leads to both longer conjugation lengths, thus smaller bandgaps, and enhanced packing, thus easing interchain charge transfer.
Charge carriers must hop or tunnel through structural barriers such aschain ends, disordered domains, and weakly doped regions. Many models havebeen proposed describing the conduction mechanism, which can vary from
13

polymer to polymer. Determining the temperature dependence of conductivity
can reveal a general type of mechanism. If the conductivity is thermally
enhanced, it suggests charge mobility is enhanced by hopping activation, which
is a non-metallic-like conduction mechanism. Thermally hindered conductivitysuggests that increased "lattice" vibrations act to scatter electrons (phononscattering), thus more metallic-like conduction [28, and references therein].
Both of these types of behavior have been seen in conducting polymers,depending on the polymer type and more importantly, its structure.
Of course, many other conjugated structures exist beyond polyacetylene,primarily aromatic and heterocyclic polymers. Several examples are listed in
Figure I.1, plus many derivatives of these also exist. Doping is most commonly
oxidative, called p-type due to the positive charge created on the polymer
backbone. Chemical reduction is also possible (adding an electron to the
polymer), called n-type doping, but is less common. One additional type of
doping occurs with polyaniline. The imine nitrogen atoms in the emeraldine
form of polyaniline (see Section I.B.1.) can act as proton acceptors, which createspositive charges on the polymer chain. The chain conjugation allows electronicrearrangement that makes these charges mobile. Thus polyaniline can be dopedwith protonic acids such as hydrochloric or sulfuric acid. This implies that the
extent of polyaniline doping, and thus its conductivity, are pH sensitive.Exposing polyaniline to aqueous solutions with pH - 5 will completely"dedope" the polymer, with a corresponding conductivity of about 10-10 S/cm[30]. Lowering the pH gives rise to an increasing conductivity, down to about
pH = 1, below which no increased conductivity occurs, about 1-10 S/cm [30].Thus polyaniline can span 10-12 orders of magnitude of conductivity simply bychanging its pH conditions.
I.B. Polyaniline
I.B.1. Background
The focus of this work will be on polyaniline (PAn), for several reasons.Polyaniline is a relatively well-investigated conducting polymer, having beenthe subject of extensive research for over nine years. PAn presents itself as wellsuited for a variety of applications due to its relative ease in synthesis, low cost
14

Polyacetylene Poly (p-phenylene)
Poly (p-phenylene sulfide)
Polyaniline
Polyaniline
NH
Polypyrrole
Poly (p-phenylene vinylene)
Polythiophene
S
Poly (thienylene vinylene)
Polyfuran
Figure I.1. Chemical structure of several conducting organic polymers.
15
�t�
and stable electronic conduction. PAn does have a somewhat limitedprocessability due to its very high glass transition temperature (Tg) and even
higher melting temperature, and very limited solubility, particularly in itsdoped state. Its T g ranges from about 220-250°C [31], with a meltingtemperature likely well in excess of this (although there is low crystallinity in
dedoped PAn base). Relative to most conducting polymers, however, PAn issignificantly more processable.
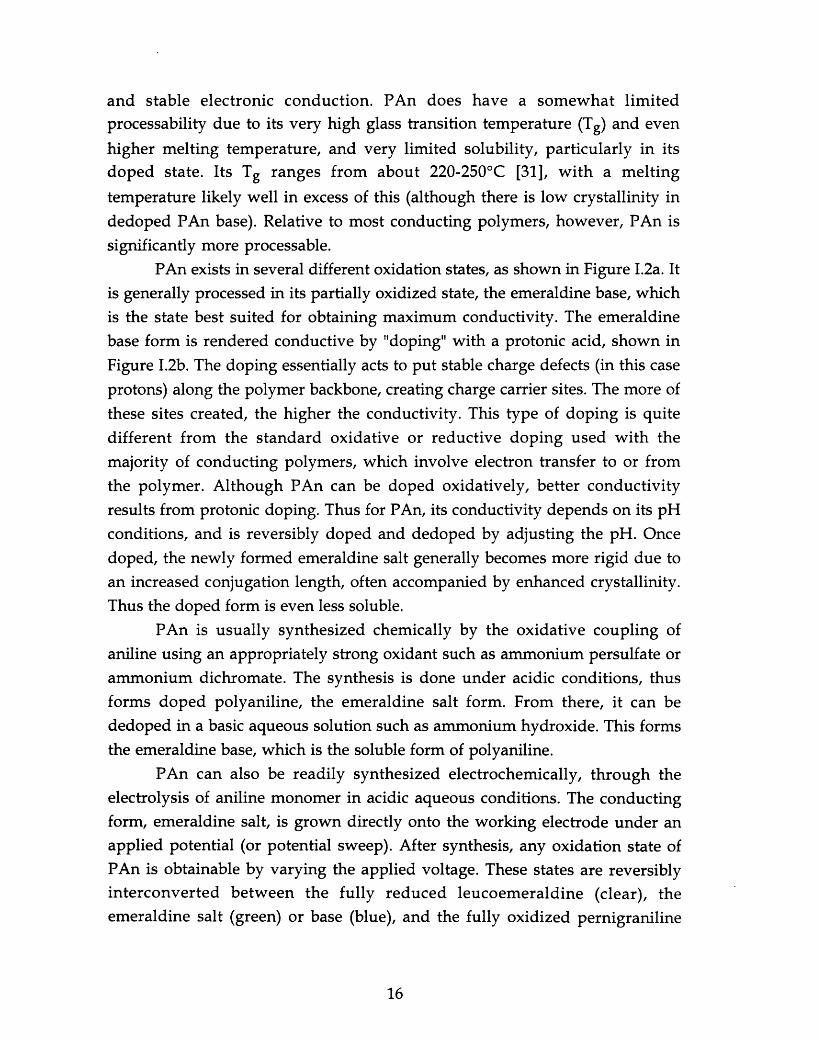
PAn exists in several different oxidation states, as shown in Figure I.2a. Itis generally processed in its partially oxidized state, the emeraldine base, whichis the state best suited for obtaining maximum conductivity. The emeraldinebase form is rendered conductive by "doping" with a protonic acid, shown inFigure I.2b. The doping essentially acts to put stable charge defects (in this caseprotons) along the polymer backbone, creating charge carrier sites. The more ofthese sites created, the higher the conductivity. This type of doping is quitedifferent from the standard oxidative or reductive doping used with themajority of conducting polymers, which involve electron transfer to or fromthe polymer. Although PAn can be doped oxidatively, better conductivityresults from protonic doping. Thus for PAn, its conductivity depends on its pHconditions, and is reversibly doped and dedoped by adjusting the pH. Oncedoped, the newly formed emeraldine salt generally becomes more rigid due toan increased conjugation length, often accompanied by enhanced crystallinity.Thus the doped form is even less soluble.
PAn is usually synthesized chemically by the oxidative coupling ofaniline using an appropriately strong oxidant such as ammonium persulfate orammonium dichromate. The synthesis is done under acidic conditions, thusforms doped polyaniline, the emeraldine salt form. From there, it can bededoped in a basic aqueous solution such as ammonium hydroxide. This formsthe emeraldine base, which is the soluble form of polyaniline.
PAn can also be readily synthesized electrochemically, through theelectrolysis of aniline monomer in acidic aqueous conditions. The conductingform, emeraldine salt, is grown directly onto the working electrode under anapplied potential (or potential sweep). After synthesis, any oxidation state ofPAn is obtainable by varying the applied voltage. These states are reversiblyinterconverted between the fully reduced leucoemeraldine (clear), theemeraldine salt (green) or base (blue), and the fully oxidized pernigraniline
16

H HI I
H H
Leucoemeraldine(fully reduced, clear)
HI
H
Emeraldine Base(partially oxidized, blue)
Pernigraniline(fully oxidized, violet)
Figure I.2a. Chemical structures of the three oxidation states of polyaniline(all insulating). The color of each state is indicated.
17

Emeraldine Base(insulating)
Dope with Protonic AcidH+A- * t Dedope with Strong Base
R+OH-
intermediate
electronic rearrangement
H H' I I
N N
H H
Emeraldine Salt(conducting)
Figure I.2b. Chemical structures of the emeraldine base, its acid-doped intermediate,and final doped form, emeraldine salt.
18
H HI I
H HH H

(violet) [32]. The ease and reversibility of these conversions leads topolyaniline's use in electrochromic devices.
MacDiarmid and Epstein have identified three forms of the emeraldinebase distinguished by their x-ray diffraction spectra and their solubilitybehavior [33]. They label them EB I, EB II, and EB II'. EB I is the most common,
amorphous form, soluble in NMP, DMAc, and the like. EB II is a partially
crystalline form insoluble in these solvents. EB II' is formed by acid-doping EBII, then dedoping. The resulting form is amorphous and soluble, but differs
from EB I. There are two doped forms of PAn (emeraldine salt), alsodistinguishable by their crystal structure, labeled ES I and ES II [33]. Acid-doping EB I gives ES I, a partially crystalline material, while acid-doping EB IIgives ES II, also partially crystalline, but a different crystal structure than ES I.
Most work involved with PAn solutions therefore uses the EB I form, as the EB
II crystals are generally filtered out.
Two recent stability studies on PAn have shown its conductivity stabilityto depend on the dopant [34] as well as the synthesis route [35]. In all cases,conductivity levels for bulk PAn show little, if any, decline in air attemperatures up to about 130°C for over 24 hour exposure. Above 130°C,conductivity starts to decrease relatively rapidly, depending on the dopant.Generally speaking, sulfonic acid dopants (like methane sulfonic acid andtoluene sulfonic acid) show the highest stability, relative to other commondopants like hydrochloric and sulfuric acid. Of course, sample geometry is animportant factor, as diffusion kinetics generally limit conductivity degradation.Thinner samples degrade faster by the diffusion in of oxygen and moisture,plus the diffusion out of dopants. Although the presence of moisture actuallyenhances the conductivity of PAn, too much for too long can lower the pH orotherwise cause sample degradation. A wide range of "half-lives" and "t/o10"
(time for conductivity to drop one order of magnitude) values at roomtemperature have been estimated for PAn, again varying due to differences insynthesis, dopant, and film thickness. A rough estimate is that bulk PAn willmaintain its conductivity within an order of magnitude for a period of severalyears.
It should also be noted that a water soluble derivative of PAn has beensynthesized by sulfonating the emeraldine base [36-38], with its chemicalstructure shown in Figure 1.3. This form also has the added property of "self-doping." With a sulfonic acid group attached to approximately every other ring,
19

Sulfonated Polyaniline
S0 3 H S0 3 HI I
NH H
Conducting H
Aqueous Protonic Acid Aqueous NaOH(pH < 7) (pH > 7)
Na+SO3 H S03Na
N N
Water Soluble, Insulating H
Figure 1.3. Chemical structure of sulfonated polyaniline in its (self) dopedconductive form and its insulating sodium salt, which is water soluble.
20

the sulfonated polyaniline (SPAn) effectively dopes itself over a broad pHrange, up to as high as pH=7. As depicted in Figure 1.3, for pH values aboveabout 7, the salt form of the sulfonic acid is formed, which dedopes thebackbone, but renders the polymer soluble in water. The compromise for thiswater solubility and the increased pH range of the conducting form is a drop in
conductivity. The reported value is around 0.1 S/cm [36]. This reducedconductivity is due to the sulfonic acid side groups that act to reduce theplanarity of the neighboring rings, which reduces p-orbital overlap, thus a
shorter effective conjugation length.
I.B.2. Processing of Polyaniline Blends
The only solvents reported as useful for PAn are either concentrated
acids, such as sulfuric acid, or amide-type polar solvents such as N-methylpyrrolidone (NMP), dimethyl acetamide (DMAc), dimethyl formamide (DMF),
and dimethyl propylene urea (DMPU). Only the base forms of PAn (non-
conducting) were considered soluble in these solvents. Once doped by eitherprotonation or by oxidation, the resulting conducting form generally becameintractable and brittle. Thus, processing of PAn is somewhat limited, and purePAn has little mechanical integrity.
It may be that this is related to molecular weight, as the most commonsynthesis route generally yields molecular weights (Mn) in the 20-25,000 range,
which may be below the entanglement molecular weight. Polyaniline is a rigid
polymer with a relatively long persistence length, which suggests that itsentanglement molecular weight is higher than more flexible polymers (forpolystyrene, for example, the entanglement molecular weight is about 35,000,for poly(ethylene terephthalate, however, it is only about 6000) [39]. Tensile
strengths of stretch-oriented films of plasticized PAn have been reported forseveral molecular weight regimes [40], showing significant increase in tensilestrength with molecular weight increase from about Mn = 26,000 to Mn =
125,000.
Blending PAn with a host polymer has the advantage of enhancing theoverall mechanical properties, versatility, and processability. Blends alsoreduce the amount of polyaniline necessary for conductivity and increase thestability of this conduction by providing environmental protection. PAn blends
21

have generally been observed to be immiscible, however, reducing many of
the above mentioned advantages.Attempts to blend PAn with a host polymeric matrix have resulted in a
variety of approaches, most of which require subsequent doping to render the
composite conductive. Little morphological characterization has been done; theblends are generally phase separated in both the doped and undoped states dueto the low inherent miscibility of rigid conjugated polymers. Recently, several
research groups have reported approaches to process PAn in its doped,conducting form. Both pure PAn films, as well as conducting blends, have beenreported, as noted below.
The use of "functionalized" protonic acids to dope PAn base renders the
doped polymer soluble in several organic solvents [41-44]. The protonic acid is
usually a large sulfonic acid, primarily DBSA (dodecylbenzene sulfonic acid)and CSA (camphor sulfonic acid); many other sulfonic acids have shownvarying degrees of success. PAn-CSA has been blended with PMMA in m-
cresol, showing high conductivity and a percolation threshold as low as 1-2wt% PAn. The blends were shown by TEM to be phase separated on the
submicron level, with fibril-like continuous paths of PAn formed in the host
matrix. Blends with several other host polymers have been reported, including
nylon, PVC, PS, PVA, PP, PE, ABS, and polycarbonate [43, 44].
It has also been shown that certain residual solvents, such as m-cresol,can act to significantly enhance the conductivity through solvent-inducedordering of the doped PAn [45, 46]. MacDiarmid, et al, have shown significantincreases in structural order and resulting conductivities in the abovementioned "functionalized" sulfonic acid-doped PAn that has been cast from, orexposed to, m-cresol.
Conducting PAn/poly (alkyl methacrylate) blends have been preparedby emulsion polymerization in the presence of HCl [47, 48]. A percolationthreshold of about 3-4% PAn in PEMA is observed, while for PAn/PBMA, thethreshold is closer to 10%.
Conducting PAn films have been cast from a ferric chloride solution innitromethane, starting with either PAn base or already-doped PAn [49]. Theferric chloride acts to oxidize the PAn, and a conducting film can be cast. Ablend with cellulose acetate butyrate resulted in a conducting composite, butwith relatively low conductivity (10-3 S/cm).
22

Doped PAn can be rendered soluble by the addition of a Lewis base, such
as a tertiary amine [50]. The Lewis base acts to complex the dopant, effectivelyreverting the PAn to its soluble base form. The Lewis base can be later drivenoff by heating, reverting the PAn back to it doped state.
PAn doped with 5-sulfosalicylic acid (SSA) is soluble in DMSO, DMF, andNMP up to 11 mg/ml [51]. The aniline is polymerized in the presence of SSA;resulting conductivities are around 0.2 S/cm.
Several groups have reported doping PAn with polymeric dopants, bothsulfonated polystyrene and poly(acrylic acid) [52-55]. Both solid state(mechanical mixing and compression molding) and solution doping resulted inlow conductivities, due to steric hindrance of the dopant, and to low mobilityof the dopant [52, 53]. Electrochemical polymerization of aniline in the presenceof sulfonated polystyrene resulted in a film that was 66.5 mol% PAn with aconductivity of 2-3 S/cm [54]. Chemical polymerization of aniline in thepresence of either sulfonated polystyrene or poly(acrylic acid) resulted in awater soluble complex with conductivity of cast films about 0.1-1 S/cm [55].
Water soluble complexes of PAn and PAn derivatives with a polyacidhave been reported [56, 21]. These complexes can form solutions that areconcentrated enough to spin coat, and have been proposed to have applicationsin the microelectronics industry, among other areas.
Chapter II of this thesis addresses the issue of manipulating PAn in itsbulk state, such as in blends of both its doped and dedoped states. In an attemptto prepare miscible systems, we have examined blends of PAn base withpoly(vinyl pyrrolidone) (PVP). PVP was chosen because of its ability to formstrong secondary bonds, such as hydrogen bonds, with PAn. PVP is thepolymer analog of NMP, a known good solvent for PAn base. The stronginteractions between these two polymers leads to enhanced solubility of PAn inNMP and to the creation of miscible blends. We have found PAn base to be
compatible with PVP under certain processing conditions [57]. Thiscompatibility is assessed in terms of the mechanical, thermal, and electricalproperties of the blend.
It was also found that, depending on the processing conditions, dopedPAn can show a large extent of compatibility with PVP [58]. The presence ofPVP enhances the solubility of doped PAn in NMP. As a result, doped PAnblends with PVP were also prepared, in the form of spin coated and static cast
23

films, and self-assembled into multilayer coatings. Three sulfonic acid dopantswere evaluated; methane sulfonic acid (MeSA), camphor sulfonic acid (CSA),and dodecylbenzene sulfonic acid (DBSA). The resulting solution cast filmsshow some phase segregation of PAn, but also show significant compatibilityof the doped PAn with PVP.
I.C. Self-Assembled Multilayer Films
The manipulation of PAn on the molecular level is discussed in ChapterIII. Assemblies of PAn are formed by means of polymer adsorption in a layer-by-layer fashion onto substrates, referred to as self-assembly. The general ideaof self-assembly is to simply deposit conjugated polymer monolayers onto avariety of substrates by adsorption from solution. From there, a tremendousrange of possible molecular level structures becomes possible, primarily in theform of electroactive thin films and coatings.
There has been extensive work in our group manipulating conjugatedpolymers by means of self-assembly onto a variety of substrates [58-65]. Thinfilm assemblies are grown on a molecular level, layer by layer, by means ofpolymer adsorption from solution, a technique adapted in our research groupfor conjugated polymers. This technique is well suited for depositing controlledmultilayer coatings of polymers, and in particular interest to our group,conducting, or more generally, conjugated polymers. The advantages includethe relative ease of the technique combined with the quality of deposited films.Adsorption is done primarily from aqueous solutions, thus limiting oreliminating the use of organic solvents. Therefore, the formation of stableaqueous solutions in the concentration range of interest is quite important.Most all polyelectrolytes are water soluble, thus layer by layer build up byelectrostatic assembly is well suited for this technique. There are manyvarieties of water-soluble polymers, both ionic and non-ionic, that are usefulfor not only adsorption studies, but are of significant interest in terms of a widevariety of potential applications. These include all types of surfacemodifications, adhesion-promoters, biocompatiblizers, as well as electroactivecoatings, like transparent electrodes, sensors, and semiconductor devices.
Understanding the structure of such systems is important fordetermining the extent of monolayer coverage, the film uniformity, and
24

interfacial diffuseness. The effects of pH conditions, molecular weight, andconcentration (among others) on polyaniline adsorption are addressed as well.This will shed light on the nature of self-assembly deposition and the extent ofpolymer/polymer interactions in molecular level assemblies.
I.C.1. Polymer Adsorption Background
There are several forces that must be considered that are involved in the
adsorption of a polymer chain onto a solid surface. Competing enthalpic andentropic energies determine the extent of adsorption and subsequentdesorption. In terms of enthalpic energies, the strongest adsorptive forces arechemisorption processes, where molecules become chemically bonded to thesurface. This implies an exothermic reaction is the driving force for theadsorption, with energies on the order of 100-700 kJ/mol (depending on thetypes of bonds involved) [66]. The next strongest bonding is electrostaticattraction, in the case of charged polymers with oppositely charged surfaces.Coulombic interactions are on the order of 50-200 kJ/mol. Hydrogen bondinginteractions are important for systems capable of forming such bonds, whichwill be a significant portion of the systems investigated in this work. Theseinteraction energies are in the range of 20-40 kJ/mol, depending on theproximity of the species involved. Hydrogen bonds thus are more easilyreversed thermally. Important for organic polymer systems in aqueoussolutions are hydrophobic interactions. Hydrocarbon chains can be drivenenthalpically to a surface to minimize their interactions with water. Theweakest forces that lead to polymer adsorption are van der Waals forces (suchas dispersive forces and dipole-dipole interactions) between the surface andpolymer chains in immediate proximity. These cohesive forces are estimated tobe in the range of 1-5 kJ/mol [66].
All of the above mentioned enthalpic forces act to enhance adsorption.There are entropic energies primarily related to chain configuration thatgenerally act to inhibit adsorption. A polymer chain must undergo some extentof configurational changes (primarily elongation) along with confinement toremain adsorbed. These are entropic penalties, more so in good solvents. Therecan be, however, a slight entropy gain as surface solvent is desorbed in place ofadsorbed polymer chains, gaining degrees of freedom.
25

It is also important to consider the surface upon which adsorption takes
place. Aside from the interaction energies depending on the chemical make-upof the surface, geometrical factors such as surface roughness also act to affectadsorption. By presenting more interaction sites in a confined space, aroughened surface allows polymer chain adsorption without as large of anentropic penalty as a smooth surface [67]. As depicted below in Figure 1.4, thepolymer chain can remain in a more coiled configuration while stillparticipating in many surface interactions on the rougher film.
Figure 1.4. Polymer chain adsorbed to a smooth vs. rough surface [67].
This effect will be seen to be important in the case of adsorbedpolyaniline, which forms relatively rough surfaces (see Section III.J.2), thusenhancing additional adsorption on top of it. Thermodynamically, polymeradsorption is thus governed by the balance of these interactions under thegiven conditions of concentration, ionic strength, pH, temperature, solvent, etc.These are all addressed in Chapter III for the specific case of adsorption ofpolyaniline with the series of previous mentioned polymers.
I.C.2. Multilayer Adsorption of Conjugated Polymers
Multilayer assemblies of doped conjugated polymers can be fabricatedquite simply from aqueous solutions. The doping renders the conjugatedpolymer charged (by means of delocalized charges), thus it behaves as apolyion. In the case of PAn, doping by protonation puts on a positive charge,thus is called p-type doping. Alternating layers of polycations and polyanionscan then be built up, adsorbing by means of electrostatic forces. Multilayerbuild-up has previously been demonstrated with flexible polyions such aspoly(vinyl sulfate) and sulfonated polystyrene (anionic) with poly(allyl amine)
26
�t�F�8�

(cationic) [68, 69]. Researchers in our lab have demonstrated electrostatic self-assembly with quite a variety of conjugated polymers, including poly(p-phenylene vinylene) [61, 63], polypyrrole [64], poly(thiophene acetic acid) [59],and both polyaniline and sulfonated polyaniline (SPAn) [60]. Many non-conjugated polyions and molecules have been incorporated as well, includingsulfonated buckminster fullerene [63] and a wide variety of dye molecules [70].These systems have applications ranging from simple anti-static coatings toelectroactive devices such as light-emitting diodes and capacitors.
Recent work in other research groups include attaching ionic biologicalmolecules such as DNA [71], and monitoring adsorption kinetics as a function
of polyelectrolyte molecular weight distribution [72]. Multilayer coatings ofcationic polyelectrolytes alternating with individual sheets of anionic hectorite(a layered silicate) have also been demonstrated [73]. It is clear that thistechnique is rapidly becoming a quite useful and versatile approach to formingthin film assemblies with molecular level control.
In the work presented in this thesis, molecular level manipulation of a
conjugated polymer, PAn, is demonstrated with strongly interacting polymers,both ionic and non-ionic, through the use of polymer adsorption. Thisadsorption is from aqueous solutions, with the exception of 5-10% organicsolvent necessary for the PAn solution. Depending on the conditions, PAn canbe maintained in a metastable solution that is 90-95% water, thus well suitedfor self-assembly. The details will be outlined in the experimental section.SPAn forms more stable aqueous solutions than PAn, and proves to be quiteinteresting for electrostatic self-assembly since it contains both positive andnegative sites at pH < 7, but was not investigated in this thesis work, primarily
because of its lower conductivity.These above mentioned polyions all rely on electrostatic forces for
polymer chain adhesion. Electrostatic forces are certainly not the only means ofmolecular adsorption, as it is also well known that surface adsorption can bedriven by molecular forces like hydrogen-bonding. The strong chaininteractions between PAn and PVP, for example, due primarily to hydrogenbonding, enable molecular layer-by-layer build-up of doped PAn alternatingwith PVP. There is some extent of molecular level blending between the layersdue to the large extent of interpenetration expected for strongly interactingpolymers. We believe that this is the first demonstration of polymer-polymermultilayer build-up of a rigid conjugated polymer (PAn) through hydrogen
27

bonding to a flexible, electrostatically neutral polymer (such as PVP). The layer
thickness can be controlled by the processing conditions such as solutionconcentration, pH, and ionic strength, as well as the adsorption time. The
structure can also vary considerably with molecular weight. It is this ability to
controllably form thin electroactive films capable of adhering to a variety of
surfaces that renders this technique so useful. This is a new approach to
polymer multilayer self-assembly, extending the range of types ofheterostructures possible by self-assembly.
In the work of this thesis, four distinctly different non-ionic watersoluble polymers were used to fabricate multilayer thin films with PAn;poly(vinyl pyrrolidone) (PVP), poly(vinyl alcohol) (PVA), poly(acrylamide)
(PAAm), and poly(ethylene oxide) (PEO), along with an ionic polymer for
comparison, sulfonated polystyrene (SPS), shown in Figure 1.5. Multilayerbuild-up with PAn was also demonstrated with poly(acrylic acid) (PAA), an
ionic water soluble polymer, while poly(ethylene imine) (PEI), also water
soluble, was sometimes used as the first layer in multilayer systems (both also
shown in Figure 1.5). Thus, both ionic and nonionic water soluble polymers
containing a wide variety of functional groups such as amide, alcohol, or ether
groups can be used to successfully fabricate multilayer thin films with p-type
doped polyaniline. Each of these groups is capable of forming hydrogen bonds
with polyaniline. Again, the results and discussion are in Chapter III.
28

Poly (vinyl pyrrolidone), PVPI Na0 Na'
Sulfonated Polystyrene, SPS
Poly (ethylene oxide), PEO
O OH
Poly (acrylic acid), PAAO NH2
Polyacrylamide, PAAm
H
,¢N.
OH Poly (ethylene imine), PEI
Poly (vinyl alcohol), PVA
Figure I.5. Chemical structure of water soluble polymers used in this work.
29
CHAPTER II. STRUCTURE AND ELECTRICAL PROPERTIES OF BLENDS
OF POLYANILINE WITH POLY(VINYL PYRROLIDONE)
As outlined in the Introduction, conducting composites of PAn blendedprimarily with PVP have been explored. These composites were blended insolution and cast from either NMP or DMAc in the form of films. The films were
characterized in terms of their morphology and electrical properties.
II.A. Experimental
II.A.1. Synthesis and Preparation of Blends
PAn was synthesized chemically by the direct oxidation of freshly distilledaniline by slowly adding an equimolar amount of ammonium persulfate(dissolved in 1 M HC1) to freshly distilled aniline, also dissolved in 1 M HC1(similar to the method described in [74]). Both solutions were pre-cooled to 40C,and the mixture was stirred for 3 hours at 4°C, as polyaniline precipitated. Theprecipitate was then filtered, washed with methanol and water, then de-doped ina 0.1 M solution of ammonium hydroxide. Based on results from many similarsyntheses [75, 40], the molecular weight (Mn) is estimated to be 20-25K g/mole
with a polydispersity of about 2.5. PAn was dissolved in either N-methylpyrrolidone (NMP) or dimethyl acetamide (DMAc) at 20 mg/ml by first stirringovernight, then sonicating the solution for about 8-10 hours. The solution hadsome fine particulates which were removed by filtering through a 2 gum paperfilter, followed by a 0.45 gm solvent-resistant filter, or by filtering through a 0.7gm glass filter.
PVP of three different molecular weights was used. High molecularweight (Mw = 1,000,000 g/mole), designated PVP-M, and low molecular weight
30

(Mw =10,000 g/mole - PVP-1OK) were used as received from Polysciences. Low
molecular weight PVP (approx. 8000 g/mole - PVP-8K) synthesized in our lab byfree radical polymerization of N-vinyl pyrrolidone was also used. PVP was alsodissolved in either DMAc or NMP, then filtered through a 0.22 gm filter. Variousconcentrations of PVP were used for comparisons. Appropriate ratios of the twosolutions were mixed to give desired compositions. The blended solutions weregenerally about 2 wt% polymer in solvent, and were stirred overnight before use.Films consisting of the entire composition range (0-100 wt% PAn) were explored.
Doped blends were formed by mixing in excess molar amounts of eithermethane sulfonic acid (MeSA), camphor sulfonic acid (CSA), or dodecylbenzenesulfonic acid (DBSA), previously dissolved in NMP. The doped solutionsinstantly turned from a deep blue to a dark green, characteristic of doped PAn. Insome cases the doped solutions were filtered through a 0.45 m filter forcomparison to unfiltered films.
Several series of blends were cast, including spin-coated films and static-cast films, from all three PVP types, and with both solvents. Thinner films (60 gmand less), used for light microscopy and conductivity measurements, were driedin a vacuum oven at 70-100°C for at least one day. Vigorous drying is necessaryto remove as much NMP as possible, but care was taken to minimize thermaldedoping of the doped samples. Thicker films (0.3 mm), used in the thermalanalysis (DMA, DSC, and TGA) and SAXS, were dried for several days undervacuum at 70-1000C.
II.A.2. Characterization Techniques
Microscopy was performed on a Zeiss light microscope with a maximummagnification of 1000x. The thickness of the static cast films ranges from 4-8 gm;the spin coated films ranged in thickness from 0.3-0.6 gm. Color photographswere taken with an attached 35 mm camera.
Thermogravimetric analysis, TGA, was run on 10 mg samples in a SeikoTG/DTA-320. The samples were run from 30-510°C, 20°C/min. under a nitrogenpurge. Differential scanning calorimetry, DSC, was done using a Perkin-ElmerDSC-7. Samples were either cast directly into the DSC pans, or cast into films,then cut into small pieces to be placed in the pans. Sample sizes were typically 5-12 mg. In all cases, the DSC pans had lids, but were not sealed air-tight. Tofurther dry the samples, and erase any thermal history, the samples were first
31

run up to 2200C in the DSC, and held for one minute under a nitrogen purge. Thesamples were then cooled to 10°C, and scanned from 10-220°C at 200C/min(collecting data). Dynamic mechanical analysis, DMA, was run on a Seiko DMS-200 using small strips cut from solution-cast films, 25 mm long, 5 mm wide, and0.3 mm thick. The samples were run in tension mode from 20-220°C, 2°C/min.,and five frequencies were scanned, 1, 2, 5, 10, and 20 Hz.
Pieces cut from these same films used for DMA were used for small anglex-ray scattering (SAXS) measurements. The films were mounted in the x-raybeam with transmission through the film thickness. A sample-to-detectordistance of 272 cm enabled a scattering angle (20) collection range of approx.0.16° to 1.05°. This corresponds to a d-spacing range of 540-84A. The SAXS was
calibrated using duck tendon, with scattering collected by a two-dimensionaldetector for 30 minute exposure times. This time was sufficient for a test sampleof a phase separated block copolymer with lamellar morphology to show the firsttwo orders of d-spacing peaks.
All conductivities were measured in air by the van der Pauw four cornerprobe method [76]. Relative humidity ranged from 20-75 over the course ofseveral months in which the measurements were made. Samples measured atboth ends of this range showed only a slight increase in conductivity withincreasing humidity. Conductivities were remeasured for some of the samplesafter one year of storage in atmospheric conditions, and showed about an orderof magnitude drop. This depended on the sample thickness, as thinner samplesdedope more quickly.
II.B. Solvent Effects
It is worth noting some interesting solution behavior observations madeduring the course of preparing the blends. Several series of PAn/PVPcompositions were blended, varying both the solvent and the PVP molecularweight. Due to the relatively low solubility of PAn, the solutions were all lowconcentration, about 2 wt% polymer in all cases. With PVP-1OK, the two-polymermixture was soluble in both solvents for all PAn:PVP-10K ratios prepared (up to30/70 PAn/PVP). PAn and PVP-M were soluble in NMP for all ratios ofPAn:PVP-M (0/100 to 100/0 PAn/PVP). PVP-M and PAn mixed together werenot soluble in DMAc, however, even though both polymers individually are
32

DMAc-soluble. Mixing the two in DMAc resulted in the immediate formation ofa thick PVP-M/PAn "gel", regardless of the fraction of PAn. It is possible to use aDMAc/NMP solvent mixture, but at least 80% NMP is necessary for the blend toremain in solution. Heating the gelled solution reduced the amount of gel(possibly reversing some hydrogen bonding), but did not completely dissolve it.This solution behavior reflects the significant effect both solvent and molecularweight have on polymer-polymer interactions. Apparently, NMP and itspolymer analog PVP interact more strongly with PAn than does DMAc. In aDMAc solution, the PAn interacts more strongly with PVP, creating a gel. The gelis a result of tightly associated PAn and PVP molecules that behave as a non-soluble complex. In NMP, the interactions are similar between PAn and bothNMP and PVP, thus it remains in solution. Low molecular weight PVP blendedwith PAn remains in solution in DMAc, however, thus the PVP-1OK must be alow enough molecular weight to prevent enough interchain physical crosslinkingthat would form a gel. Thus, for some cases, only NMP can be used as a solventto solution cast PAn/PVP blends.
It is possible that these interactions can be thermally weakened, such asthe thermal dissociation of hydrogen bonding. Thus heating the solutions mightact to initially dissociate complexed PAn and PVP chains, increasing theirsolubility. Of course, raising the temperature could also weaken the solventstrength. These temperature effects were not explored, however, as all solutionsand films were prepared at room temperature.
II.C. Thermal Analysis Results
II.C.1. Thermal Gravimetric Analysis (TGA)
TGA was run on the thick cast films to monitor the presence of solvents.All samples had been under dynamic vacuum right up until they were loadedinto the instrument to minimize adsorbed moisture. The loading time is aboutone minute, which is enough air-exposure time to absorb 2-3% by weightmoisture from the humid air (Relative humidity = 70-75). Three distinct regionsof weight loss are evident in the TGA thermograms represented graphically inFigure II.1.
33

0 1 5 10 15 20 25 100wt% PAn
Figure II.1. Histogramblend films (cast from
of TGA wt% loss from PAn/PVP-1MNMP) showing three weight loss regions.
34
000
0-l
100
80
60
40
20
0

In the first region, there is a steady weight loss of about 2-3% from 30-200°C, corresponding to the above-mentioned adsorbed water. From 200-385°Cthere is a steeper drop, with a corresponding weight loss of 14-20%, dependingon the amount of PAn in the blend. This loss is due to trapped NMP being drivenoff. Although the boiling point of NMP is 202°C, it is physically bound to boththe PVP and PAn, thus difficult to drive off. Similar results were seen withsamples cast from DMAc, which has a boiling point of 165°C, except that lessDMAc was retained than was NMP. The NMP is bound more tightly to PAn thanto PVP, as is evident by the increasing amount of retained NMP as thepercentage of PAn increases. All but about 10-25% carbon ash is burned off from385-510°C, during the steepest drop in the TGA curve. The amount of remainingash also increases with increasing amounts of PAn.
TGA on pure PAn and pure PVP were run for comparison, on threedifferent samples each (dry powder, films cast from NMP, and films cast fromDMAc). These results are shown schematically in Figure II.2. All three sampletypes showed a small amount of moisture retention up to about 200°C. Beyondthis, the PVP powder showed minimal weight loss from 200-385°C (about 2%),the PVP film cast from DMAc had a small dip from 200-385°C (about 4-5%),while the PVP film cast from NMP showed about 18% weight loss from 200-385°C. The PAn film cast from NMP was about 33% NMP by weight, comparedto only 12% DMAc for the PAn film cast from DMAc.
The TGA thus revealed both the hygroscopic and high solvent bindingnature of PAn and PVP. Despite efforts to remove the solvent by vacuum dryingat elevated temperatures (about 100°C), both PAn and PVP tenaciously retainedsignificant fractions of solvent. Several other research groups have reported thisbehavior for PAn [31, 77, 78], but rarely is this condition mentioned in the vastmajority of work done with NMP solution cast films of PAn. Thus all samplescharacterized by thermal analysis (as well as otherwise) had some extent ofresidual solvent and moisture present, which must be considered in interpretingthe results. Complete removal of these solvents requires high temperatureswhich were not used throughout this study in order to avoid sampledegradation. Wei, et al., have suggested repeatedly HC1 solution-dopingfollowed by NH40H solution-dedoping of the pure PAn for extended periods oftime to remove residual NMP [31]. This was not an option in the case ofPAn/PVP blends, since PVP is water soluble.
35
100
80
60
0- 40
20
nv
PVP-NMP PVP-powder PAn-DMAcPVP-DMAc PAn-NMP PAn-powder
Figure 11.2. TGA wt% loss for PAn and PVP homopolymerscast from DMAc, NMP, or "dry" powder.
36

II.C.2. Differential Scanning Calorimetry (DSC)
Figure II.3 shows the glass transition (Tg) and the change in heat capacityat Tg (ACp) vs. wt% PAn (measured by DSC) for two series of blends cast fromNMP, one with PVP-M, the other with PVP-1OK. The samples were cast directlyinto DSC pans (again, from about 2 wt% polymer solution), then vacuum ovendried overnight at 1000C before running in the DSC (thermal cycle given inexperimental section). In all cases, a single Tg was observed, and no othertransitions. If the blends were truly homogeneous, the blend Tg would appearbetween that of the two homopolymers. Here, the Tg generally rises with theaddition of PAn, suggesting that the two polymers are phase mixed. Purepolyaniline, however, shows no thermal transitions in the DSC up to about280°C, due to its high melting temperature and rigid structure (although it haslow crystallinity). Its Tg has been reported as between 220-250°C [31]. Thus, aphase separated system would still show a single Tg, but always near the same
temperature. There are some fluctuations seen in Figure II.3, likely due tovarying amounts of residual solvent. Since the wt% of solvent can actually behigher than that of PAn, its Tg-lowering effect can act to oppose the Tg-raisingeffect of added PAn.
For a homogeneous blend, the ACp would similarly be the sum of the twohomopolymer ACps, weighted by their respective fractions. If they were phaseseparated, the Tg of the PVP phase would not vary much and the ACp would beproportional to the amount of PVP, thus would decrease with added PAn. It canbe seen in Figure II.3 that the ACp values do not change much over thiscomposition range, with the exception of one data point. This is also evidence fora phase mixed blend.
One might be tempted to verify if this system follows a Gordon-Taylorrelation for Tgs of miscible blends, and to estimate the Tg of PAn by using arelation such as:
Al(Tg-Tgl)wl = A2(Tg2-Tg)w2,
where A1 and A2 are constants; wl and w2 are the weight fractions. Plotting Tgvs. (Tg2-Tg)w2/(1-w2) gives intercept Tgl. For the 10K series, this gave a Tg ofPAn 179°C. The 1M series predicts the Tg of PAn = 229°C. Simply extrapolatingthe Tg values in Figure II.3 to 100% PAn gives Tg of PAn closer to 2600C. This
37

PAn/PVP Blends, DSC Results(Thermal cycle 10-220°C, 20°C/min)
0 5 10 15 20 25 30 35wt% PAn
Figure 11.3. DSCand PVP-1OK.
results (Tg and ACp) for PAn blends with PVP-1M
38
170
160
150
140
130
Vbt
E-4
0.3
0.25
0.2 >
0.15 OQ0
0.1
0.05
0
120
110
100

broad range of predicted Tgs exemplifies the complications encountered in
characterizing this three-component system of PAn, PVP, and solvent. Eventhough the samples were heated to 220°C for one minute in the DSC (in coveredbut unsealed pans to allow vapor to escape), apparently this was not sufficient touniformly remove all residual NMP. As seen in the previously mentioned TGAresults, the NMP does not begin to come off during a heating scan until about200°C, and is not completely removed until about 380°C, which takes 9 minutesat 20°C/min. Therefore, in retrospect, is it clear that some residual NMP remains,likely acting to plasticize the samples used in DSC runs. This effect will also beseen in the DMA results. None-the-less, the DSC results suggest, at least for thisthree-component system, that there is significant PAn/PVP compatibility.
II.C.3. Differential Mechanical Analysis (DMA)
Tgs were measured for two other series, cast from a NMP/DMAc mixture
(the amount of DMAc was proportional to the amount of PAn; the wt% of DMAcequaled 0.8 times the wt% of PAn). One series was cast directly in the DSC pans,the other was the thick film (0.3 mm) series. Although all of these samplesdisplayed a single Tg, they had less definite trends. The Tg generally increased
with increasing wt% PAn, but not uniformly. These results are seen in Figure 11.4,along with DMA results. DMA was run on the 0.3 mm thick films of PAn/ PVP-M cast from the above mentioned NMP/DMAc mixture. Again, a single losspeak (tan 6) was seen, and the loss peak at 1 Hz is shown to represent Tg. The
storage modulus, E', ranged from 2 to 3 GPa, generally increasing withincreasing wt% PAn. These films are therefore relatively stiff materials, butembrittle with increasing percentage of PAn.
It is difficult to draw conclusions from the thermal analysis due to thevariable amounts of bound solvent in the films and to the varying effects ofDMAc vs. NMP. There is competition between the plasticizing effect of residualsolvent, and the stiffening effect of added PAn. Added PAn acts to increase theTg and modulus, but also retains more solvent (as seen in Figure II.1), which actsto plasticize. The result is the wavy trend seen in Figure II.4 - a Tg that fluctuates
as the relative amount of the three components varies. For the thick films run inTGA, DSC, and DMA, there does appear to be a correlation between the amountof retained solvent and both the measured Tg and the modulus. As seen in FigureII.4, the Tg displayed by DMA (open circles) and DSC (open triangles) follow a
39

Tg vs. wt% PAn in PAn/PVP-1M Blend, , , , , , . , . , i .i , , i i , I I i
8A
0
AA
I I I I I I
0 5
I I l
10 15 20
A
I I I I I I I I I I I I I I I I I
25 30wt% PAn
Figure II.4. Tg of PAn/PVP-1M blend (DB series) as measured byboth DSC and DMA (loss tangent peak).
40
160
150
140
o tan 6 (1 Hz) - film* DSC Tg (DB-cast in pan)A DSC Tg (DB-film)
Vb
F-
130
120
110
100
I I I I I I I I I I I I I I I I I ... .... . i .. i .
I I I I
-1
~Z
I-,*

similar trend, as these samples were cut from the same film. There is an initialrise up to about 5 wt% PAn, followed by a region of decreasing Tg up to about15% PAn, then an increasing Tg above that. Again, if there was macroscopic
phase separation, the loss tangent would show little trend with added PAn. Asimilar trend was seen with the modulus. This behavior is likely due tocompeting effects, that of an increasing amount of NMP with increasing wt%PAn that acts to counter the stiffening effect of added PAn. It is apparent thatPAn can be compatiblized with PVP in an NMP solution, but the resultant blendis a three component system containing variable amounts of solvent.
II.D. Light Microscopy
Microscopy samples were prepared by spin-coating PAn/PVP-M blendsranging from 0-100% PAn in the aforementioned NMP/DMAc solution ontosilicon wafers, then drying in a vacuum oven overnight at about 100°C. Thesefilms are approximately 0.5 gm thick. Since the solvent is a high-boiling/lowvapor pressure solvent, the spin coating does not rapidly remove the solvent asin conventional spin coating. The cast films therefore are not "quenched-in"kinetically restricted structures, but still maintain some chain mobility untildrying is complete. The overnight drying at 1000C, although below Tg, also
allows some additional chain mobility, such that the final structure is likelycloser to an "equilibrium" structure than to a quenched phase-mixed one.
The undoped blends all appear miscible, as evident by uniform color ofthe films, at the resolution limit of light microscopy. This limit is estimated to beabout 1000A for good contrast at 1000x magnification. Since PAn is dark blue andPVP is transparent, contrast is indeed reasonably good (for films of appropriatethickness). There were some micro-particulates in many of the samples, but thesewere mostly due to undissolved PAn, not due to phase segregation in thepresence of PVP. This is evident by the fact that pure undoped PAn (no PVP)contained a few small (submicron) undissolved aggregates in the solution castfilms. Most all of the aggregates disappeared after filtering the PAn solution(using a 0.45 gm filter), and the filtered solutions did not become lighter in color.Also, in the case of the blends, the amount of visible particulates was too low toaccount for the amount of PAn present. These particulates appeared primarily insamples that were prepared with unfiltered PAn.
41

Figure II.5 shows light micrographs of three PAn/PVP-1M solution-castfilms (from NMP), containing 5,15, and 50 wt% PAn. For comparison to a highlyincompatible system, a 50 wt% PAn/PMMA blended film, also cast from NMP,is shown. These are all taken at 200x magnification. All three of the PAn/PVPsamples appear uniform, even up to 50% PAn. The vertical striations in the 5%and 15% photographs are due to the light filament image, not sample features.The PAn/PMMA sample is clearly phase separated. The two 50% PAn samplesare shown in Figure II.6 at higher magnification, 1000x. Again, the uniformity ofthe PAn/PVP sample is evident, with the possibility of some light spottiness,whereas the phase-separated PAn/PMMA structure is evident. Thus while PVPand PAn are compatible, PMMA and PAn are clearly not, despite having theability to form hydrogen bonds with each other. Apparently, PVP interacts muchmore strongly with PAn than does PMMA. This issue of polymer-polymerinteractions is addressed in more detail in Chapter III.
These solution-cast films all remain uniform upon doping with HCl vapor,showing little or no signs of phase separation. Also, all blended samples weredark under crossed polarizers, indicating that there were no crystallites (at leastnot larger than about 1000A, the estimated resolution limit of the microscope).
These blends can also be doped while still in solution (NMP) with anumber of protonic acids, including methane sulfonic acid, camphor sulfonicacid, and dodecylbenzene sulfonic acid. Excess acid is simply added directly tothe NMP solution such that the PAn becomes fully doped. In most cases, thedoped blends remain soluble. In pure NMP, PAn/PVP mixtures were soluble inall ratios, and the resulting films also remained miscible. Upon doping withMeSA, the solutions remained visibly soluble for all ratios. There were likelysome microaggregates at this point, however, as indicated by their presence inthe cast films. For samples doped with DBSA and CSA, the blended solution wasnot soluble at all ratios. The highest fraction of doped PAn soluble with PVP wasabout 30/70 PAn/PVP (2 wt% total polymer in NMP) for both CSA and DBSA,above this precipitation occurred. The solution doped films showed extensivecrystallinity for all ratios greater than 50/50 PAn/PVP, as observed undercrossed polarizers. For PAn ratios less than 50/50, the amount of crystallitesquickly diminished. This is not what was observed for the films cast in thededoped state, as mentioned above. No crystalline regions were observed at anyPAn/PVP ratio in the films that were cast dedoped, then subsequently doped. Itcould be that there are very small crystallites in this case, or that the degree of
42

15% PAn in PVP
50% PAn in PVP
Figure II.5. Light micrographs of PAn blends withfilms cast from NMP (200x magnification).
50% PAn in PMMA
PVP and PMMA,
43
1
---
,I7
-'
--
;-i
*-
"-
5%/ PAn in PVP

50% PAn in PVP
50% PAn in PMMA
Figure 11.6. Light micrographs of PAn blendsfilms cast from NMP (1000x magnification).
with PVP and PMMA,
44

mixing with PVP has hindered PAn crystallite formation. In summary, it appearsthat at higher PAn ratios (greater than 50/50), doping while in solution leads to ahigher fraction of crystallinity, while for lower fractions of PAn and for non-doped solutions, the presence of PVP hinders the crystallinity, indicative of someextent of phase mixing.
Light micrographs of samples with these three dopants are shown inFigure II.7. All samples are 10 wt% PAn, three in PVP, one in PMMA forcomparison, doped in solution in NMP, then cast into films. The PAn/PVP filmsappear mostly uniform, especially compared to the PAn/PMMA film. Thedoped-PAn/PMMA blend is grossly phase separated, even in solution. Dopingthe PAn in DMAc with any of the three above mentioned sulfonic acids (in thepresence of PMMA) resulted in the immediate precipitation of the PAn.
In the films cast from these pre-doped solutions of PAn/PVP there wassome level of phase segregation, as evidenced by the increasing appearance ofmicroaggregates in the cast films with increasing wt% PAn. The aggregate sizeswere difficult to determine due to resolution limits, but they appear to range insize from 0.1 - 1.0 gm. The smallest domain sizes were observed with MeSA asthe dopant. The largest particulates appeared in the PAn-DBSA films.Presumably, these aggregates are doped PAn crystallites. Under crossedpolarizers, however, both MeSA and CSA doped samples appeared dark, whilethe DBSA doped samples showed some faint scattered light, indicating thepresence of PAn crystallites. As mentioned above, the frequency of crystallitesincreased with increasing fraction of PAn.
It should be noted that in all of the microscopy results presented here, thePVP molecular weight used was 1M. Similar compatibility results were observedwith PVP-1OK. Since compatibility was observed for both a high molecularweight (thus very limited mobility) and low molecular weight (very mobile)PVP, this suggests that phase separation kinetics were not a limiting factor in themorphologies observed. Although it is possible to quench in a phase mixedmorphology in an incompatible blend, the rapid formation of two phases inPAn/PMMA blends observed, and the lack of phase separation for lowmolecular weight PVP suggest that this is not the case here.
45

10% PAn-DBSA in PVP
10/% PAn-CSA in PVP 10%/ PAn-CSA in PMMA
Figure 11.7. Light micrographs of pre-doped PAn blends with PVP and PMMA,films cast from NMP (1000x magnification).
46
10% PAn-MeSA in PVP

II.E. Small-Angle X-Ray Scattering (SAXS)
Transmission SAXS was run on solution cast films ranging from 5-30%PAn (same samples as used for DMA). There were no detectable scattering peaksfrom any of them, suggesting a lack of any periodic domain spacings on theorder of 540-84A. Since the highest wt% PAn was only 30%, it is possible that thedomain spacing, if it existed, was greater than about 540A, the limit of thedetector. The less PAn present, the larger the spacing, for a phase separatedsample. Therefore, the only conclusion that can be drawn from the SAXS resultsis that either the samples are not phase separated, or that there are domainsspaced greater than 540A apart. Light microscopy suggested that there are notdomains larger than about 1000A, thus it is possible that phase separation hasoccurred in the 500-1000A size range. The thermal behavior suggests that this isnot the case, however. No SAXS measurements were taken on doped samples,but this would certainly be valuable information.
II.F. Electrical Conductivity
It might be expected that a macrophase separated blend with an insulatingpolymer matrix would insulate the conducting domains until a percolationthreshold was achieved. This value is typically predicted to be near 16 vol% forthe conducting phase, using a small-spheres packing model for a 3D system. Amore compatible blend would act to disperse the conducting component, givingrise to non-sharp percolation type behavior. In addressing this issue,conductivity was measured as a function of PAn wt% in several series of blends.Six series of PAn/PVP blends were cast into films, dried under vacuum, dopedwith HC1 vapor, and measured for conductivity. They are:
1. D8KS. - PAn blended with PVP-8K in DMAc, spin-coated to 0.6-1.2 jgm thick.2. D1OKS. - PAn blended with PVP-1OK in DMAc, spin-coated to 0.4-0.6 gmthick.
3. N1OKS. - PAn blended with PVP-1OK in NMP, spin coated to 0.3-0.5 gm thick.4. N10OK. - PAn/PVP-1OK in NMP, static cast to 24-60 gm thick.5. N1MS. - PAn with PVP-M in NMP, spin-coated to 0.5-0.7 gm thick.6. N1M. - PAn/PVP-M in NMP, static cast to 24-60 gm thick.
47

The results are plotted in Figure II.8, and show the conductivity to rangefrom 10-3 to 2 S/cm for PVP-M blends ranging from 3-30 wt% PAn. There is not asharp percolation threshold, but rather a gradual decrease in conductivity as the% PAn is decreased, with a sharper drop around 5-8 wt% PAn (depending on theseries). The drop-off is gradual, indicating a gradual insulating dilution of PAnrather than a sharp break in conducting domains. For films with less than about4% PAn, the conductivity was below the range of our instrument (about 10-5
S/cm), and this may be where percolation occurs. It is possible that the extent ofmiscibility of these two polymers results in the gradual dilution of PAn chains,rather than the formation of discrete domains, to the point where they are nolonger near enough for effective charge transport.
The conductivity may also be limited by the presence of NMP, which canweakly complex the proton involved in doping PAn, hindering the dopingprocess. Several authors have reported similar results [50, 78]. The two series castfrom DMAc rather than NMP, the D8KS and D1OKS series, showed a largeincrease in conductivity compared to the equivalent series cast from NMP (N1OKseries), as seen in Figure 11.8. As seen earlier, it is easier to remove residual DMActhan NMP. For the two 1M series, thicker films (static cast) showed about doublethe conductivity of the thinner spin-coated samples. This thickness effect isattributed to the increased chances of forming percolation pathways that traversethe entire film in thicker films. The PVP-M blends showed a conductivity aboutan order of magnitude higher than the PVP-1OK blends. It is not clear why this isthe case, although the PVP-1M films tended to be thicker than the PVP-1OK films,thus there can be a thickness effect. In terms of stability, the conductivitydropped about one order of magnitude over the course of one year for the thickersolution-cast films (stored in air).
A much different trend was seen for the pre-doped films, cast from dopedsolutions. The conductivity was relatively low, however, and did not increasemuch with increasing amounts of PAn. For a pre-doped blend of only 1 wt% PAnin PVP (doped with MeSA), the conductivity was already 5x10⁻³ S/cm, butincreased to only about 3x10⁻² S/cm for pure PAn. Conductivities for CSA andDBSA doped PAn were even lower, on the order of 10-3 S/cm, and also showedlittle increase with increasing wt% PAn. These low values, again, are likely dueto interactions with NMP, both in-solution and in the cast films. As mentionedabove, the NMP acts to weakly complex the proton involved in doping PAn. It isalso very likely that there is considerable residual NMP (approx. 10-20 wt%) in
48
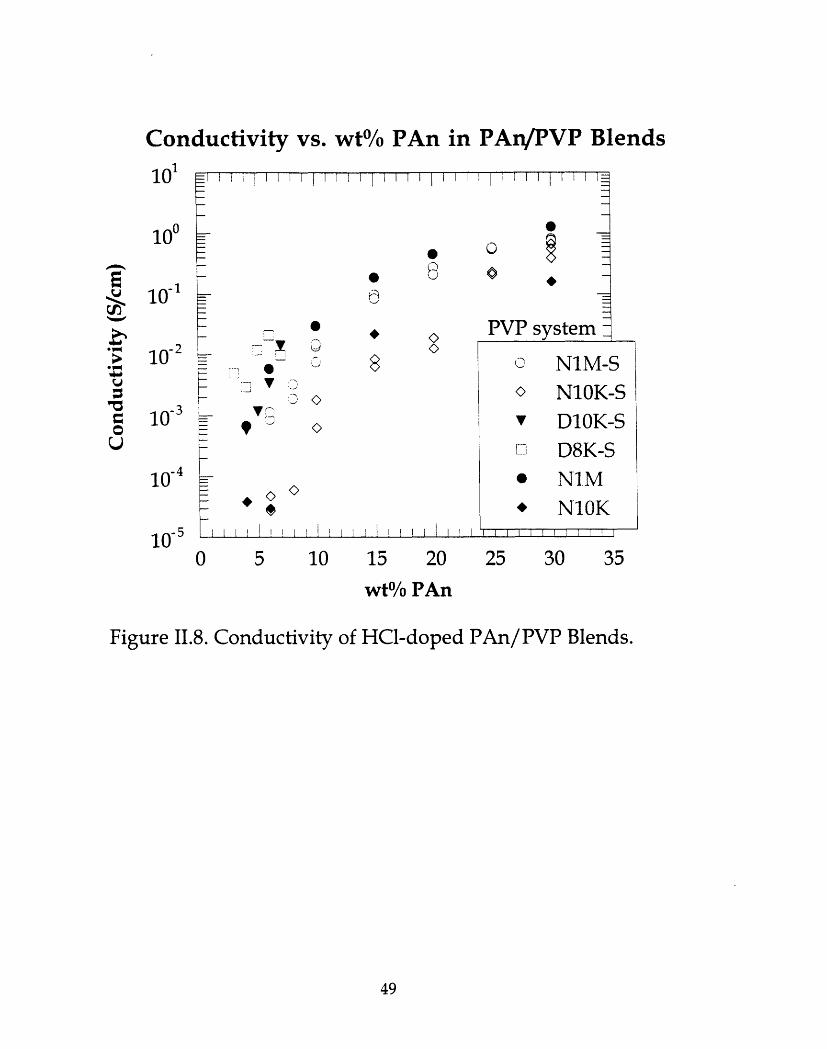
Conductivity vs. wt% PAn in PAn/PVP Blends
--T I 1 t I I I I L T I I I I I I I I I I I I I _-
0'9
o
PVP system ~
0_
9 J
I I I I I
LlI I I l III I I
0 5 10
I I I I I I I I I I I I I I T
15 20 25
C NIM-S° N1OK-SV D1OK-S
::::] D8K-S
* NIM* N10K
I I I I I ! ! I
30 35
wt% PAn
Figure II.8. Conductivity of HCl-doped PAn/PVP Blends.
49
101
100
110'0
10 -2 U-
310'0
U)e~
10 -5
- - :
I... I .- .....
I
. I .... I .... [ I , i

these pre-doped cast films, again as evident of the earlier mentioned TGA results.
Since PAn binds NMP more tightly than does PVP, there is more NMP in the
higher wt% PAn samples. Also, since the solution doped blends appear to have a
higher extent of phase separation relative to the undoped blends, they are less
likely to have a continuous conducting path of PAn. The undoped blends can
remain more phase-mixed upon doping, since chain mobility is restricted in the
solid state.
It is also possible that PVP, which, like NMP, can weakly complex the
dopant proton, reduces the effective extent of doping. The strong interactions
between these two polymers that enables the formation of a compatible system
might simultaneously act to hinder the formation of ordered or high conjugation
length regions of PAn, thus restricting conductivity.
It has been shown that PAn forms compatible blends with PVP, the first
such system reported for PAn. Even upon subsequent doping, the blend remains
miscible. If pre-doped PAn is solution mixed with PVP (in NMP), there is still
considerable compatibility, although PAn crystallites can form, which are not
present in "post-doped" PAn/PVP blends.
The PAn/PVP blend can be doped to reasonable conductivity levels, but
since PVP is water soluble, its structural usefulness has obvious limitations.
However, one can exploit the strong polymer-polymer interactions that drive the
miscibility in the formation of adsorbed multilayer films. It was the recognition
of the strong interaction strength, primarily through hydrogen bonding. between
PAn and PVP that led to the idea of using these two polymers, and others
capable of such interactions, in the formation of self-assembled multilayer films.
This is the subject of the next chapter.
50
CHAPTER III. SELF-ASSEMBLED MULTILAYER FILMS OF POLYANILINE
III.A. Introductory Remarks
As mentioned in the introduction, multilayer assemblies of conjugatedpolymers deposited by means of self-assembly have been demonstrated andinvestigated for quite a number of systems. The idea is to fabricate molecularcoatings onto a variety of substrates by simply allowing the polymers toadsorb onto the surface. Adhesion is maintained by a variety of forces,including electrostatic attraction, and secondary molecular forces, such ahydrogen bonding or hydrophobic interactions. Previous work in our grouphas been exclusively with charged polymers (doped conjugated polymers andpolyelectrolytes), including some structural characterization. In the workpresented in this chapter, we exploit the strong interchain interactions betweenPAn and several non-ionic water soluble polymers that enable multilayerbuild-up. As described in the introduction (Section I.C), the films consist ofalternating layers of PAn with one of several other strongly interactingpolymers.
There remain, however, some questions concerning the extent ofcoverage, the nature of the interfaces, and the polymer configuration onceadsorbed onto the surface. These questions, as well as the effects of the variousprocessing parameters on both film structure and adsorption mechanisms, willbe addressed.
51

III.B. Experimental
III.B.1. Solution Preparations
The self-assembly technique for PAn is described in detail in [79], andoutlined with some variations here. The basis for the technique involvescoating substrates with layers of polymers by means of spontaneous adsorptionfrom aqueous solutions. Multilayers are built up by dipping the substratealternately from one solution to the next, using solutions of suitableconcentrations, pH conditions, and for sufficient lengths of time.
PAn was synthesized chemically as described in Section II.A.1, anddissolved in either NMP or DMAc (at 18 mg/ml), as before. The PAn dippingsolution was prepared by slowly adding one part (by volume) of the filteredPAn solution (in DMAc or NMP) in with 9 parts water with the pH adjusted toabout 3.0-3.5 with methane sulfonic acid (MeSA). The pH was then quicklylowered to 2.5-2.6 by adding drops of concentrated MeSA. Care must be takento not go below pH=2.5 or above pH=3.5 to avoid precipitating the doped PAn.The solution was filtered through a 0.45 lm filter just before use. The PAnconcentration can be varied by adjusting either the amount of PAn in DMAc, orby adjusting the amount of water added. We believe that at least 5% DMAc isnecessary to form a metastable solution, although it may be possible to useless. There is a range of concentrations and pH conditions that are suitable forself-assembly; this range has been mapped out by Cheung [79]. The PAnconcentration primarily used throughout this paper is 0.01 M (Molar in terms oftwo aniline structural units), and pH as mentioned above, 2.5-2.6.
In forming the other dipping solutions, all polymers were used as-received, and dissolved in water to form 0.01 M solutions, molar in terms ofone monomer repeat unit. For the pH study, the pH was adjusted by usingeither MeSA or ammonium hydroxide. The solutions were all filtered througha 0.2 gm filter.
Solutions of different molecular weights of poly(vinyl pyrrolidone)(PVP, Mw=l1,000,000 g/mole and Mw=10,000, Polysciences, narrow molecularweights from American Polymer Standards) were prepared by dissolving thepolymers in water at 1.11 mg/ml. These solutions have a pH of about 4.5.Poly(vinyl alcohol) (PVA, Mw=86,000, Scientific Polymer Products) wasdissolved in water at 0.44 mg/ml. The resulting solution has a pH of 6.25.
52

Poly(acrylamide) (PAAm, Mw=5,500,000, Polysciences) was dissolved in waterat 0.71 mg/ml, with a resulting pH of 6.2. Poly(ethylene oxide) (PEO,Mw=5,000,000, Aldrich) was dissolved in water at 0.44 mg/ml and has a pH of6.3. Poly(acrylic acid) (PAA, Mw=1,000,000, Polysciences) was dissolved inwater at 0.72 mg/ml, with a resulting pH of 3.44. Solutions of sulfonatedpolystyrene (SPS, Mw=70,000 and Mw=500,000, plus a monodisperse molecularweight series, Polysciences) were prepared by dissolving in water at 2.06mg/ml, and the pH was adjusted to 2.5-2.6 with MeSA. Poly(ethylene imine)(PEI, Mw=70,000, Polysciences) comes dissolved in water, and was further
diluted to form a 0.02 M solution, then adjusted to pH = 2.6 with MeSA. Allchemical structures of these polymers were shown in Figure 1.4.
III.B.2. Film Deposition
The films were deposited on a variety of substrates, including glass,plastics, metal, and silicon. Adhesion could be enhanced by surface treatment ofthe substrate. Glass slides and silicon wafers were rendered charged by one oftwo types of surface treatments. Briefly, there were four main steps in thetreatments, as follows. First the slides were acid cleaned in a sulfuricacid/hydrogen peroxide bath (piranha), then second they were hydroxylated inan ammonium hydroxide/hydrogen peroxide bath. Third, the glass or siliconwas rendered positively charged by one of two approaches. The surface was
either silanized with an amine-terminated trifunctional silane in toluene, orcoated by adsorption with a monolayer of PEI. In either case, this enabledrendering the surface positively charged through the protonation of the amineends. The final step was to coat the surface with a protective monolayer of SPSby immersion into a SPS solution at pH=2.5, which gave the surface a negativecharge. Doped PAn is effectively a polycation, thus adsorbs quite readily to anegative surface (such as SPS), which improves the adhesion of the first layer.
The dipping procedure using these treated substrates was as follows. The
treated slides were first immersed into the PAn bath for 15 minutes, followedby rinsing with water at pH=2.5 (MeSA), then drying with a compressed air jet.A 15 minute dip time was used because adsorption vs. time experiments in ourlab have shown that almost 100% of the equilibrium thickness deposits in thefirst 15 minutes (for concentrations of PAn > 0.0005 M). A plot of absorbance at880 nm vs. time in Figure III.1 shows the self limiting "high affinity" adsorption
53
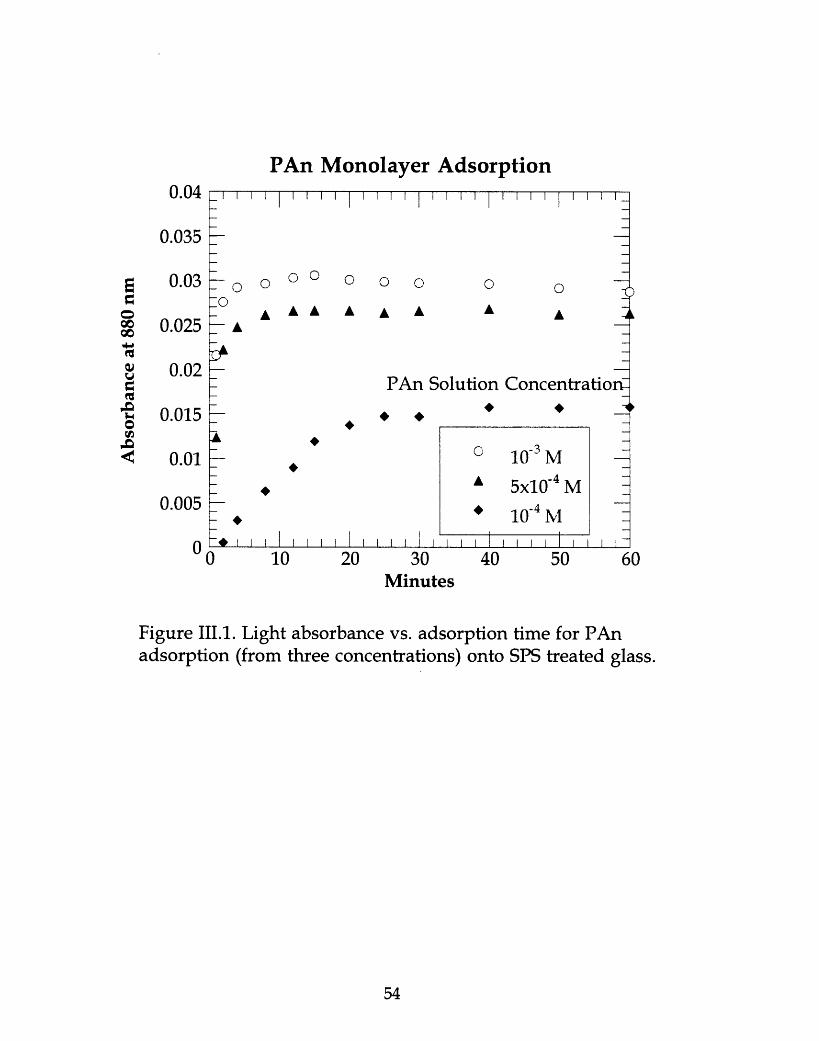
PAn Monolayer AdsorptionI' ' ''I I I I 1 1 1 I I I I I I I I I
0 0 0 0
A
0
A
PAn Solution Concentration-. * 1
20 30Il l I l l II
40 50I I I
60Minutes
Figure III.1. Light absorbance vs. adsorption time for PAnadsorption (from three concentrations) onto SPS treated glass.
54
0.04
0.035
-o10
0
AA A Ao0
oo
(¢
rd;C
0.03
0.025
0.02
0.015
0.01
0.005
n
o 10-3 M
5x10-4 M
* 10-4 M
1010~~~~~. . . .
V I I
L...f-2
J L
-
V O
IIII I I

of PAn, onto SPS in this case. Three lower concentrations are shown, 0.0001,0.0005, and 0.001 M. It can be expected that the 0.01 M concentration wouldbehave similarly to 0.001 M solution, or deposit faster, as it is well known thatincreases in concentration generally accelerate the kinetics of adsorption.
The films were then immersed in the non-ionic polymer bath for 15minutes, followed by rinsing with neutral water, and compressed air drying.From there, layers were simply alternated between PAn and the non-ionicpolymer. The resulting films were only lightly doped; they were immersed in a1 M MeSA solution to fully dope, followed by a quick rinse in a 1 M HC1solution to remove residual surface MeSA.
III.B.3. Characterization Techniques
Layer-by-layer build-up was monitored by visible and infraredspectroscopy. UV-Visible light absorption spectra were taken directly fromcoated glass slides using an Oriel Multispec spectrophotometer. Dichroic ratiosof PAn (S-polarized/P-polarized absorbance) were measured at a 450 angle ofincidence using polarized light. IR spectra were taken on films built up on ZnSeplates, using a Nicolet 510P FTIR. Both UV-vis and IR spectra were takenbetween each bilayer after dedoping the films by rinsing with 0.1 Mammonium hydroxide. This was to ensure a uniform electronic state in all filmsfor direct comparison of absorption spectra. Contact angle measurements weremade using a VCA 2000 video image system by the sessile drop technique,measuring advancing angle. Atomic force microscopy (AFM) was performedusing a Digital Instruments Nanoscope III operating in tapping mode. The filmthicknesses were measured by both profilometry (using a Sloan Dektak 8000)and by ellipsometry (for films on reflective surfaces, using a Gaertner threewavelength ellipsometer). A Zeiss light microscope with a maximummagnification of 1000x was used for light microscopy. All conductivities offully doped films were measured in air by the van der Pauw four comer probemethod. As with the blends of Chapter II, measurements were made in relativehumidity ranging from 20-75. Samples measured at both ends of this rangeshowed only a slight increase in conductivity with increasing humidity.
55
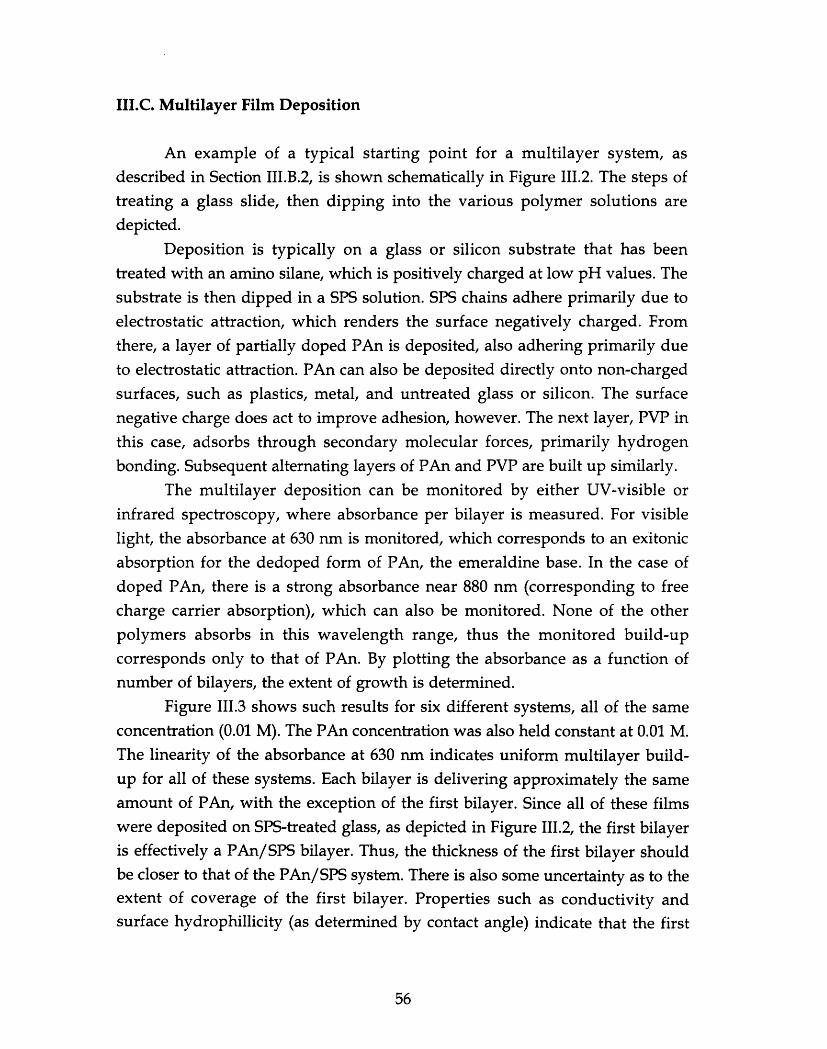
III.C. Multilayer Film Deposition
An example of a typical starting point for a multilayer system, asdescribed in Section III.B.2, is shown schematically in Figure 111.2. The steps oftreating a glass slide, then dipping into the various polymer solutions aredepicted.
Deposition is typically on a glass or silicon substrate that has beentreated with an amino silane, which is positively charged at low pH values. Thesubstrate is then dipped in a SPS solution. SPS chains adhere primarily due toelectrostatic attraction, which renders the surface negatively charged. Fromthere, a layer of partially doped PAn is deposited, also adhering primarily dueto electrostatic attraction. PAn can also be deposited directly onto non-chargedsurfaces, such as plastics, metal, and untreated glass or silicon. The surfacenegative charge does act to improve adhesion, however. The next layer, PVP inthis case, adsorbs through secondary molecular forces, primarily hydrogenbonding. Subsequent alternating layers of PAn and PVP are built up similarly.
The multilayer deposition can be monitored by either UV-visible or
infrared spectroscopy, where absorbance per bilayer is measured. For visiblelight, the absorbance at 630 nm is monitored, which corresponds to an exitonicabsorption for the dedoped form of PAn, the emeraldine base. In the case ofdoped PAn, there is a strong absorbance near 880 nm (corresponding to freecharge carrier absorption), which can also be monitored. None of the otherpolymers absorbs in this wavelength range, thus the monitored build-upcorresponds only to that of PAn. By plotting the absorbance as a function ofnumber of bilayers, the extent of growth is determined.
Figure III.3 shows such results for six different systems, all of the sameconcentration (0.01 M). The PAn concentration was also held constant at 0.01 M.The linearity of the absorbance at 630 nm indicates uniform multilayer build-up for all of these systems. Each bilayer is delivering approximately the sameamount of PAn, with the exception of the first bilayer. Since all of these filmswere deposited on SPS-treated glass, as depicted in Figure III.2, the first bilayeris effectively a PAn/SPS bilayer. Thus, the thickness of the first bilayer shouldbe closer to that of the PAn/SPS system. There is also some uncertainty as to theextent of coverage of the first bilayer. Properties such as conductivity andsurface hydrophillicity (as determined by contact angle) indicate that the first
56

I~ -1. Clean Substrate(glass or Si)
Figure III.2. Schematic of the self-assembly process, showing treating a glass
slide, coating with SPS, then a PAn/PVP bilayer.
57
2. Silane in toluene(overnight)
(15 minutes)

bilayer behaves differently than the subsequent layers, suggesting non-uniformcoverage.
As evident in Figure III.3, there is quite a range of absorbances,depending on the particular system. The most polyaniline is deposited withPAAm, while the ionic system, SPS, delivers the least. All of the non-ionicpolymers of this study deposited more PAn per bilayer than did the ionicpolymer, SPS. The implication is that there are strong interactions between PAnand these ionic polymers that lead to considerable bilayer thicknesses, relativeto that formed with polyanions (additional work in our group hasdemonstrated similar PAn deposition levels with other polyanions such aspoly(methacrylic acid) and poly (vinyl sulfonate) ).
There are many factors that influence polymer adsorption, however, andthese must all be considered in comparing the various systems. Solutionconcentrations are important, as it is known that generally thicker films aredeposited from more concentrated solutions. This results from the fact thatpolymer chains adsorbing from very dilute solutions have opportunity toreconfigure with time on a surface, spreading out to maximize surfaceinteractions. In more concentrated solutions, adsorption happens faster, and allsurface sites can become quickly occupied, preventing the subsequentelongation of a chain. Depending on the solvent strength, the polymeradsorbed from the more concentrated solution is therefore more coiled,forming a thicker layer.
The molecular weight, and thus the size, of the adsorbed polymer cancertainly influence film thickness, depending on the chain conformation. Theinteraction strength between the surface polymer and the adsorbing polymer isalso important. The strength of the interactions can depend on pH conditions,charge densities and ionic strength, and solvent conditions. In the case ofpolyelectrolyte adsorption, the primary interaction energy is electrostaticattraction (for oppositely charged polymers), which is on the order of 50-200kJ/mol. For the non-ionic polymers of this study, there are little, if any,Coulombic interactions. Thus, there must be other secondary interactions thatlead to this enhanced deposition. These water soluble polymers are all capableof forming hydrogen bonds with PAn, with interaction energies in the range of20-40 kJ/mol. Certainly these must be important, but it is possible that thereare other specific interactions with PAn that are also involved.
58

0
PAn Multilayers0.6
0.5
0.4
0.3
0.2
0.1
02 4 6 8
PAAm
PVP
PVA
PEO
SPS-highSPS-low
10
Bilayers
Figure III.3. Absorbance at 630 nm vs. number of bilayers forPAn multilayer films deposited with six different polymers.
59
to
(U
O0In
A

The solvent strength also affects polymer adsorption by dictating thechain configuration. The energetics of adsorption must be sufficient tooutweigh both the solvent-polymer interaction energies as well as the entropicpenalty of confining and reconfiguring a polymer chain at a surface. For PAn,the 90% water/10% DMAc solution is a very poor solvent, thus adsorptionhappens quite readily. For the water-soluble polymers, surface interactions(such a hydrogen bonding) become more important, as will be discussed.
III.D. FTIR Determination of Hydrogen Bonding.
The possiblity of hydrogen bonding interactions as a mechanism drivingthe adsorption of non-ionic polymers was investigated. If a primary means ofadhesion from layer to layer for the non-ionic multilayer systems is byhydrogen bonding, the actual extent of interaction between any two layers canbe monitored to some extent by the presence of H-bonds, as measured by FTIR.Coleman and Painter have used such an approach for determining the extent ofhydrogen bonding in polyurethanes [80] and for determining the extent ofphase separation in H-bonding polymer blends [81, 82]. They have showndistinct absorption bands for free and H-bonded carbonyl groups and N-Hstretches. The energy of the N-H stretch (of PAn), and the carbonyl C=O stretch(in PVP) both depend on whether they are H-bonded or not, thus these twoabsorption peaks can be monitored as a function of their environment. BecausePAAm and PVA both H-bond with themselves, it is more difficult to determinewhether the H-bonds are inter- or intra- molecular. PEO is also more difficultsince there is not a strong energy shift for a free ether linkage compared to a H-bonded one [82].
To prepare the films, the self-assembled films were grown onto ZnSeplates, which do not absorb in the middle IR region. A PAn layer is depositedfirst, as it readily adsorbs onto ZnSe. Two multilayer systems were evaluated,PAn/PVP and PAn/PEO (10 bilayers each). In looking at the IR spectra shownin Figures III.4 and III.5, the presence of hydrogen bonding is evident in the N-H stretch region in Figure III.4 for PAn/PVP and in Figure III.5 for PAn/PEO.The N-H stretch of pure PAn in its dedoped state (not charged) appears at 3382cm- 1. This corresponds to the free (not hydrogen bonded) N-H. PAn canhydrogen bond to itself, and there is evidence of a small fraction of H-bonded
60

IR Absorbance PAn/PVP
3400 3200 3000 2800 2600 2400
Wavenumber (cm'l)
Figure III.4. IR spectra showing the N-H stretcha 10 bilayer film of PAn/PVP, a 50/50 PAn/PVI
region for PAn be? blend, and PVP.
ase,
61
0.015
0.01
toIn0 0.005
0
n Mr,-. UUJ
3600

IR Absorbance PAn/PEO0.01
0.0075
0.005
0.0025
0
-0.0025
A AA-u.uuD3600 3400 3200 3000 2800 2600 2400
Wavenumber (cm')
Figure III.5. IR spectra showing the N-H stretch region for PAn base,a 10 bilayer film of PAn/PEO, a 50/50 PAn/PEO blend, and PEO.
62
tor,0

N-H groups, seen by the shoulder on the right side of the N-H peak for purePAn.
In a multilayer system with either PVP or PEO, there is a new peak at3300 cm-1 (with PVP) or at 3330 cm-1 (with PEO). This shift to lower energycorresponds to a hydrogen bonded N-H. There is a fraction of these hydrogensthat remain free, as evident by the presence of the original peak at 3382 cm-1.Thus both systems have a fraction of N-H bonds that are involved in hydrogenbonds. It is difficult to determine what this fraction is from just the IR data,since the hydrogen bonded N-H stretch absorbs more strongly than the free N-H, thus the peak areas are not directly related.
Also shown for comparison are blended systems; films of approximately50/50 PAn/PVP or PAn/PEO cast from a mixed solution in NMP. The PAn/PVPblend also shows the peak shift to about 3317 cm-1, thus there is some extent ofH-bonded N-H. This indicates that PAn and PVP are compatible, forminghighly interacting blends, which agrees with results seen in Chapter II. ThePAn/PEO blend shows no shift, suggesting a phase separated system, thus fewhydrogen bonding interactions. Observing these blends under a lightmicroscope at 1000x confirms the phase separated structure of the PEO blend,and the phase mixed structure of the PVP blend.
Looking at the carbonyl peak around 1685 cm-1 for the PVP was lessinformative. It turns out that a hydrogen-bonded carbonyl in PVP only acts towiden the absorption band, and it was difficult to determine the extent of peakwidening for the PAn/PVP vs. pure PVP spectra.
It is interesting to note that PAn will hydrogen bond with both PVP andPEO, but shows much stronger interactions with PVP, as evident by the blendbehavior of these pairs. Pearce has shown that miscibility between normallyimmiscible pairs can be enhanced by the modification of one component toincorporate a certain percentage of hydrogen bonding functional groups [83,84]. For example, he has shown that polystyrene becomes miscible with PMMAby copolymerizing styrene with only about 5% vinyl phenol. The addedhydroxyl groups are capable of forming hydrogen bonds with the acrylatecarbonyl in PMMA. This miscibility is thermally reversible, thus the blendbehaves as a LCST blend (phase separates at elevated temperatures), typical ofmany hydrogen bonded blends.
Apparently, for PAn/PEO, the presence of hydrogen bonding issufficient to drive the adsorption of PEO from water onto PAn (even though
63

water is a good solvent for PEO), but not sufficient to form a miscible blend. Asseen in Chapter II, PAn with PVP does form a miscible system, but PAn withPEO (or with PMMA, also seen in Chapter II) does not. It has not been fullyinvestigated, but PAn and PAAm appear compatible, as well. All of thesepolymers (PEO, PVP, PAAm, PVA, and PMMA) are capable of hydrogenbonding with PAn, but of these five, only PVP and PAAm contain a nitrogenatom in their structure (in addition to a hydrogen-bonding oxygen). Thisnitrogen is also capable of forming hydrogen bonds with hydrogens in PAn,and may be the added interaction strength that leads to this compatibility. Ithas been observed that the nitrogen atoms in PAn chains can act as protonacceptors, forming interchain NH - N hydrogen bonds in pure PAn [85]. Thesetwo nitrogen containing polymers, PVP and PAAm, thus can similarly formsuch additional interactions.
III.E. Properties of Multilayer Films
Once grown, the PAn multilayer films generally appear as green (doped)or blue (dedoped) uniform coatings, which can be mostly transparent,depending on the thickness. They all adhere tenaciously to the glass,particularly if the glass has been treated. Film adhesion is monitored in twomanners, one way by simply rubbing, and the other by the "Scotch tape test."In this test, a piece of adhesive tape is pressed firmly on the sample, then peeledoff. For all films deposited on treated glass (silanized), no material comes off inthe Scotch tape test. The films are also resistant to light rubbing with one'sfingers, but will come off with more aggressive rubbing. Adhesion does varywith substrates, and is best with silanized surfaces.
Some of the properties of these multilayer films are outlined in TableIII.1. All values are listed as ranges measured for multiple series of samples.Listed are the polymers displayed in Figure 1.4 and their molecular weights (allare polydisperse). All solution concentrations were 0.01 M, as defined in theexperimental section, with no pH adjustment. The unperturbed radius ofgyration of each polymer, Rg, was calculated using characteristic ratiostabulated in the Polymer Handbook, and assuming theta conditions. The Rg forPAn is estimated at about 80 A, based on a mw of 25,000 and an estimatedcharacteristic ratio of 12. Using these Rg values, it was determined that 0.01 M
64

concentration is well below the calculated critical overlap concentration in all
cases. Thus, adsorption is from non-overlapping chains in solution. For the caseof high mw PAAm, it has been shown that aqueous solutions of concentrationless than about 0.015 M contain no aggregates [86].
It is possible, however, that there is some extent of nano-aggregation in
the PAn solution, since it is in water, a non-solvent. Lower concentration PAn
(10-4 M) delivers smoother (as determined by AFM) yet thinner films, with
higher dichroic ratios (see Section III.N). This indicates a preferred in-plane
chain orientation, more so than in films adsorbed from the higherconcentrations (10-2 M). This results from the more favorable conditions for
chain elongation on the surface due to decreased competition for surface sites.
Included in the table is the average thickness per bilayer for filmsranging from 8 to 16 bilayers (column 2), as measured by profilometry.Conductivities (, column 3) are measured for fully doped films (doped with
MeSA) by the usual van der Pauw technique. The absorbance (at 630 nm) per
bilayer is listed for dedoped films (column 4). An approximate vol% PAn islisted in column 5, and is calculated by using an absorbance per thicknesscalibration curve. This curve was generated by measuring the thickness and
absorbance (at 630 nm) for a series of known concentration spin-coated thinfilms of PAn/PVP. The absorbance per unit thickness is 7.155x10⁻⁴ abs. units/A.This calibration gives an extinction coefficient, £, at 630 nm of about 1.3 x 10⁴
(M-cm)-1 for dedoped PAn (where a mole is defined for two aniline structuralunits). This compares quite favorably to the value of e reported by Cheung, 1.4
x 104 (M-cm)- 1, calculated by calibrating with a series of PAn solutions of
known concentration [79]. Using this calibration value and the absorbance perbilayer value (column 4), the contribution of PAn per bilayer is estimated. Thevolume% PAn (column 6) is simply this PAn contribution divided by the
thickness per bilayer.The dichroic ratio listed in column 6 (S-polarized/P-polarized
absorbance ratio) gives relative information about the actual chainconfiguration of PAn. The higher values have preferential in-plane orientation,lower values indicate a more random 3D configuration. Under severalassumptions regarding these films (see Section III.N), a dichroic ratio thatcorresponds to no preferred orientation is 1.13. Thus any ratio greater than 1.13should have preferred in-plane orientation. If all PAn chains laid in the plane ofthe surface, then the ratio would be 1.535. Dichroic ratios less than 1.13 indicate
65

that the chains are preferentially oriented normal to the surface. Values greaterthan 1.535 are theoretically impossible for the given assumptions. There aresome difficulties in determining the absolute dichroic ratio (such as problemswith baseline interpretation, and variability of the ratio with wavelength), aswell as assumptions about the film's refractive index, but the values do giverelative comparisons.
Table III.1. Selected properties of PAn multilayer films ranging from 8 to 16bilayers (solutions with no pH adjustment.).
PAAm- poly(acrylamide)PEO - poly(ethylene oxide)SPS - sulfonated polystyrene
PVP - poly(vinyl pyrrolidone)PVA - poly(vinyl alcohol)
It is evident that although each bilayer is approximately the samethickness for a given PAn system, there is a wide range of thicknessesdepending on the particular system. In fact, the ionic system, SPS, delivers thethinnest film, while the non-ionic polymers show up to six times theabsorbance for the same number of bilayers. In comparing two similar mw
66
Polymer a (S/cm) Absorbance Est. DichroicSystem bilayer (630 nm) vol% Ratiow/ PAn /bilayer PAn
PAAm 90 - 125 1.9 - 4.0 0.042 - 0.054 53 - 76 1.11 - 1.12
(5,500,000)
PVP 65 - 85 2.3 - 3.7 0.032 - 0.045 64 - 74 1.21- 1.25
(1,000,000)
PEO 50 - 70 0.4 - 2.2 0.021 - 0.028 49 - 60 1.21 - 1.26
(5,000,000)
PVA 55 - 65 1.1 - 3.6 0.020 - 0.031 52 - 72 1.22 - 1.24
(86,000)
SPS-low 28 - 41 0.1 - 0.5 0.007 - 0.013 26 - 62 1.19 - 1.21
(70,000)
SPS-hi 27 - 42 0.1 - 0.4 0.011 - 0.013 43 - 65 1.20
(500,000)

systems at the same concentration, SPS (ionic, Mw=70K) to PVA (non-ionic,Mw=86K), the non-ionic polymer still shows over double the absorbance perbilayer. PVP, at Mw=lM, shows almost three times the absorbance as SPS-990K(seen in Table III.3b).
These thickness differences are related to the strong interactions betweenpolyaniline and water soluble polymers capable of hydrogen bonding. Everyrepeat unit of PAn is capable of hydrogen bonding with every repeat unit ofPVP, PAAm, PEO, and PVA. For the electrostatic interactions, PAn has a verylow charge density at pH = 2.5. Only about one in every 20-30 aniline repeatunits is protonated, thus there are fewer ionic interaction sites per chain thanthere are hydrogen bonding sites. This discrepancy is even larger for the case ofthe nitrogen-containing polymers, PVP and PAAm, which can form additionalhydrogen bonds. Apparently, thicker films (more deposited PAn) are obtainedin the systems that have the most "binding" interactions.
There are other factors affecting the deposition and resulting properties,however, such as molecular weight, solution pH, and concentration. Forexample, PAAm delivered a much thicker bilayer than PEO, of comparablemolecular weight. It is likely that the increased interactions between PAAmand PAn relative to PEO and PAn act to deposit more PAn. Also noted in TableIII.1 is the fact that the dichroic ratio of PAAm system is lower than for PEO.This means less in-plane orientation of the PAn chains (more coiled), whichsuggests a thicker film. Each system behaves slightly differently, as alsoevident by the large disparity in molecular weight between PVA and PEO, yetboth deliver comparable thicknesses and conductivities. Although there is asignificant molecular weight effect on film deposition (to be discussed in thenext section), there are also competing effects based on interaction strength.Here it is evident that PAn interacts more strongly with PVA than PEO. In thenext two sections, the effects of pH and molecular weight are discussed in moredetail.
III.F. Effects of pH on Deposition.
Cheung has mapped out concentration, pH, and adsorption timedependence for PAn/SPS self-assembled systems, showing strong dependenceon all three [79]. She has shown that the thickness of the deposited film
67

increases with lowering the pH, while the dichroic ratio goes through amaximum near pH=3. The thicker films at low pH result from the increasedpositive charge density on PAn, which increases interaction sites with SPS. Forthe non-ionic systems of this study, the solution pH plays a different role sincethe charge density on PAn is a less significant factor. As will be seen, there areindeed pH and thus charge effects, but not to the extent seen in polyelectrolytesystems. For example, non-ionic polymers such a PVP can be deposited ontoPAn over a wide pH range, from fully doped (positively charged) to fullydedoped (electrostatically neutral). Multilayer build-up can thus be readilyobtained, whereas for polyelectrolytes, adsorption (and particularly multilayerbuild-up) can be sigificantly hindered if the charge densities are not sufficient.The only reason to keep the PAn slightly doped in the case of non-ionic self-assembly is to keep the PAn aqueous solution stable.
The pH of the non-ionic polymer solution can affect a polymer's abilityto hydrogen bond. It has been observed that high pH values can hinderhydrogen bonding, since OH- groups act to dissociate hydrogen bonds [87, 88].Table III.2 summarizes results from a series of multilayer films built up fromdifferent pH values for the non-ionic polymer. In all cases, the PAn solutionremained at pH=2.5 for bath stability reasons. The films were all 8 bilayersthick built up on treated glass substrates. The following observations can bemade:
With PEO, low pH hinders adsorption, as evident by the thinnerbilayers, while the dichroic ratio remains about the same for all pH values.Since high pH values are known to hinder hydrogen bonding, it might beexpected to see the reverse trend. There must be stronger interactions betweenPEO and PAn in its electrically neutral state (high pH) than with doped PAn(low pH). Of the four polymers considered in this table, PEO appears to havethe weakest interaction strength with PAn, as it has a high molecular weight,but forms thinner films. This might be expected in light of the ether linkagelikely being the weakest at form hydrogen bonds.
With PVA, as pH increases, the thickness decreases, while the % PAn andthe dichroic ratio remain about the same. PVA has a partially anionic nature,which can enhance adsorption at low pH (onto charged PAn). Thus less PVAadsorbs at higher pH, as there is no charge on PAn. This is a similar effect seenwith SPS, which is anionic.
68

Table III.2. Selected properties of PAn multilayer films (8 bilayers) as a functionof pH conditions.
System (pH) Ave. thick. A/bilayer Absorb/ Est.vol% Dichroic(__) bilayer PAn Ratio
PEO - 3.0 269 34 0.0124 52 1.23
PEO - 6.0 413 52 0.0210 57 1.19
PEO - 9.0 396 50 0.0222 63 1.22
PVA - 3.0 537 67 0.0263 55 1.20
PVA- 5.0 438 55 0.0204 52 1.23
PVA- 7.0 369 46 0.0174 53 1.24
PAAm - 3.0 1171 146 0.0688 66 1.09
PAAm - 5.0 728 91 0.0494 76 1.12
PAAm- 7.0 599 75 0.0430 80 1.29
PVP - 4.0 673 84 0.0446 74 1.19
PVP- 5.0 592 74 0.0430 81 1.20
PVP - 6.0 571 71 0.0412 81 1.20
With PAAm, as pH increases, the thickness decreases, while the % PAnand the dichroic ratio increase. At lower pH, there is some positive charge onPAAm, thus charge repulsion allows less elongation of the chains, giving riseto a lower dichroic ratio. These coiled chains result in thicker films, but with alower percentage of PAn. Evidently, this charge density is not enough toprevent considerable adsorption. There also must be considerableinterpenetration of the PAn and PAAm at the lower pH. This is the only case ofthese four systems that shows significant dichroic ratio dependence on the pH.
With PVP, as pH increases, the thickness decreases slightly, while the %PAn and the dichroic ratio remain about the same. Amides and lactams areknown as good solvents for PAn (PVP monomer is a lactam), thus there arestrong interactions, and little effect, regardless of pH conditions. Although only
69

a small pH range is presented in the PVP series, results from earlierexperiments at low pH values confirm the relative pH-independent behavior.
From looking at the results tabulated in Table III.2, it is evident that pHeffects can be significant in altering the way PAn interacts with other polymers.Again, the primary effects are related to the strength of these interactions, bothionic and otherwise, as determined by the solution pH.
III.G. Effects of Molecular Weight on Deposition.
Reference was mentioned above to molecular weight differencesresulting in film thickness differences. A more systematic approach addressingthe effects is presented here. Tables III.3a and III.3b outline the results from twomolecular weight studies, one for a non-ionic polymer (PVP) and the other foran ionic polymer (SPS). The SPS used is narrow molecular weight distribution,Mw/Mn = 1.10, obtained from Polysciences, except for SPS-hi (500K) and SPS-low (70K), which are polydisperse. The PVP is also a "narrow" distribution(obtained from American Polymer Standards), but is much more polydisperse,M/Mn = 3. Again, two samples (PVP-1M and PVP-1OK) are not of this narrowdistribution, thus are even more polydisperse. It is generally known that inpolymer adsorption, low molecular weight chains adsorb more quickly due todiffusion kinetics. High molecular weight chains can replace the low ones withtime since they have lower desorption rates due to having more interactionsites per chain. The implication is that in polydisperse systems, the lowmolecular weight chains will likely adsorb first, and then depending on theirinteraction strength, might be replaced by higher molecular weight chains. Forthis reason, monodisperse fractions were used.
The two polymer types have quite different behavior, as evident in thesetwo tables. The deposition of a PAn/PVP film is quite dependent on themolecular weight of the PVP. There appears to be a minimum MW belowwhich no deposition occurs. This MW is about 25K, as the two MWs below thisdid not build multilayer films. Apparently, the low mw PVP does not haveenough exposed bonding sites to adhere an additional layer of PAn.Presumably, many interaction sites are needed for the weaker hydrogen bond,compared to ionic bonding, to adhere a polymer chain. There also appears to be
70

a maximum molecular weight, above which there is little MW dependence,since both the 350K and 1M PVP show similar film properties.
Table III.3a. Selected properties of PAn/PVP multilayer films (10 bilayers) as afunction of PVP molecular weight.
Sample (Mw) Ave. A/ Absorb/ Dichroic Est. vol% a (S/cm)
Thick. (A) bilayer bilayer Ratio PAn
PVP 1M * 774 77 0.0403 1.14 73 1.21
PVP 350K 796 80 0.0370 1.17 65 1.65
PVP 125K 562 56 0.0272 1.26 68 1.17
PVP 35K 170 17 0.0072 1.38 59 0.075
PVP 25K 110 11 0.0040 1.47 51 0.10
PVP 10K *-- -- 1.49t
PVP 9K - -- 1.45t* indicates very polydisperse PVP (branched as well), all others are relativelynarrow MW distribution, (Mw/Mn = 3).
t effectively a PAn monolayer.
Table III.3b. Selected properties of PAn/SPS multilayer films (10 bilayers) as function of SPS molecular weight.
Sample (Mw) Ave. |A/ Absorb/ Dichroic | Est. vol% (S/cm)Thick. (A) bilayer bilayer Ratio PAn
SPS 990K 419 42 0.0143 1.19 48 0.11
SPS 500K * 415 42 0.0127 1.20 43 0.11
SPS 350K 407 41 0.0138 1.20 47 0.11
SPS 77K 402 40 0.0128 1.17 45 0.09
SPS 70K * 405 41 0.0125 1.19 43 0.11
SPS 35K 412 41 0.0122 1.18 41 0.06
SPS 5K 406 41 0.0131 1.14 45 0.06* indicates polydisperse SPS, all others are monodisperse (Mw/ Mn = 1.10)
The thickness per bilayer decreases with decreasing MW, where the vol% PAnseems constant until a lower MW regime, at which point both the % PAn and
71
I

the conductivity drop off. The dichroic ratio increases during this decrease inMW. These two effects, the decreasing thickness and increasing dichroic ratio,with decreasing mw, suggest that the PVP chain is acting as a template for PAnadsorption. Higher mw PVP has more loops extending from the surface, whichact to form thicker films with less in-plane PAn orientation. The PAn stronglyinteracts with the PVP chains, interpenetrating into the PVP loops.
For the ionic system of SPS, there appears to be little molecular weightdependence on most all film characteristics. PAn builds up nicely with SPS forall molecular weights used, ranging from 5K to 990K. Systems that form ionicbonds therefore require much fewer interaction sites in order to formmultilayer films. This is evident from the demonstrated multilayer filmsconsisting of poly(thiophene acetic acid) as the polyanion, a short chainpolymer consisting of only eight to ten thiophene repeat units [59]. In fact, Yoohas demonstrated multilayer build-up with small ionic molecules containingonly two or three charges per molecule [70]. There is little change in thedichroic ratio with molecular weight, indicative of the reduced interactionsbetween PAn-SPS compared to PAn-PVP. The SPS does not act as a template thatcontrols the thickness with extensive interpenetration, like PVP does. The SPSfilms have a lower vol% PAn than with PVP (due to fewer interaction sites),with about an order of magnitude lower conductivity.
III.H. Interactions of Non-Ionic Polymers with Ionic Polymers.
Investigations have been made into the ability of charged polymers toadhere to non-ionic polymers, and vice versa. We have seen that PEO, PAAm,PVA, and PVP will all build multilayer systems with PAn over a wide range ofpH values, discussed in the previous sections. Thus build up is possible on bothdoped (low pH) and dedoped (high pH) PAn. Here, doped PAn is only partiallydoped, but has a net positive charge, while the dedoped PAn is electrostaticallyneutral. Systems of non-ionic polymers with ionc plymers other than PAn havealso been considered.
Attempts were made to adsorb PEO and PVP onto charged layers,monitoring the deposition by IR absorbance. It turns out that neither PEO norPVP will build up multilayers with SPS, a polyanion, in the pH range tested(2.5-6.5). Neither will build up with poly(allyl amine), a polycation at low pH
72

(2-3). The implication is that there are very strong specific interactions with
PAn not related to ionic charges, since these water soluble polymers (PVP andPEO in this case) will not interact with other charged polymers, either positive
or negative, in a manner that allows multilayer self-assembly. The interactionswith PAn, however, are strong enough to drive the adsorption from water, agood solvent.
Since these interactions are primarily hydrogen bonding, as seen abovein Section III.D, it might be expected that multilayer build-up would bepossible with most any hydrogen bonding pairs, such as PVP with PVA, orPAAm with PVP, PVA, or PEO. Preliminary results show, however, that none
of these four systems forms multilayer films, as determined by IR spectroscopy.This suggests that there are additional specific interactions between PAn andthese water-soluble polymers (such as hydrophobic interactions), or that thehydrogen bonding is not of as strong of a nature between PAAm and PVA, forexample, as it is between PAn and PVA or PAAm. Certainly one driving forcefor the deposition of polyaniline is the fact that it is in an unstable solution,thus favors adsorbing onto a surface for thermodynamic reasons. Water is anon-solvent for PAn, thus the PAn chains remain tightly coiled, eager to comeout of the metastable solution. This is evident in the wide variety of surfaces
that PAn will adsorb onto from the standard 90% water/10% DMAc solution.This driving force is much weaker for the other water soluble polymers, thus
the argument that additional interactions with PAn must exist. Certainly thereare some hydrophobic interactions related to the fact that these are allpolymers with hydrocarbon backbones, despite being water-soluble.
The surface roughness of a polyaniline layer can make subsequent layer
adsorption more appealing as well. PAn deposits as a much rougher layer than
all of the other polymers of this study, due to its nano-aggregated nature in theunstable solution. This roughness allows an adsorbing chain more interactionsites without the entropic penalty of spreading onto a smooth surface(described in Section I.C.1).
III.I. Conductivity vs. Number of Bilayers
Up to this point, film properties have been described primarily formultilayer films. It was seen in Section III.C that the first bilayer possibly has
73

incomplete coverage, likely due to variable surface conditions on the substrate.To address how properties change as the number of layers increases, singlelayer properties, at least conductivity and thickness, were measued for twoPAn/PVP systems. Conductivity and film thickness as a function of number ofbilayers are plotted in Figure III.6. Both films are built up from the samesolution concentrations (0.01 M for both PAn and PVP) and pH conditions(pH=2.6 for PAn, pH=4.5 for PVP). The only difference is that one PAn solutionwas made from dimethyl acetamide (DMAc) in water, while the other from N-methyl pyrrolidone (NMP) in water. This comparison of solvents was done todetermine the extent of residual solvent effects of these two PAn solvents.Thicknesses were calculated based on a calibration of the absorbance at 630 nm,conductivities were measured after each bilayer for fully doped (with MeSA)films.
It can be seen in Figure III.6 that after only two bilayers, the films arealready within an order of magnitude of their ultimate conductivities. Thiscorresponds to a film thickness of about 75A. The first bilayer is so thin (< 30A)likely due to both incomplete coverage and the fact that it is effectively abilayer of PAn/SPS rather than PAn/PVP. The incomplete coverage issuggested by the lack of any conductivity. The second layer fills in more, withtotal coverage coming by the third bilayer. After three bilayers, the films areapproximately 150A thick, and have almost reached their eventualconductivity. Each successive bilayer delivers about 80A (the average bilayerthickness). Beyond three bilayers, there is little subsequent increase inconductivity. These values indicate the connectivity of the first three bilayers.
The film assembled from DMAc is about five times as conductive as thatassembled from NMP, even though both films are about the same thickness.This implies that there is residual NMP, which acts to hinder doping by looselybinding or complexing the dopant protons. There is likely less residual DMAc,since PAn retains NMP more tightly than DMAc. Similar results were seen forPAn/PVP blends [57], as described in Chapter II.
74

PAn/PVP Multilayer Film
Conducti
- N
I I I ivity
NIPMAc ®
_O I
P- I ICKness
14 1 4--8--NMP- - - - DMAc
1 2 3Bilayers
4 5 6
400
350
300
*3250 A
200 M
150 >o
100
50
0
Figure III.6. Conductivity and film thickness of PAn/PVPmultilayer films as a function of number of bilayers.(Two PAn dipping solns. compared, one with DMAC, one NMP).
75
10
1
0.1
u
rrl
O
U
n n1V.VL0
. ... I I
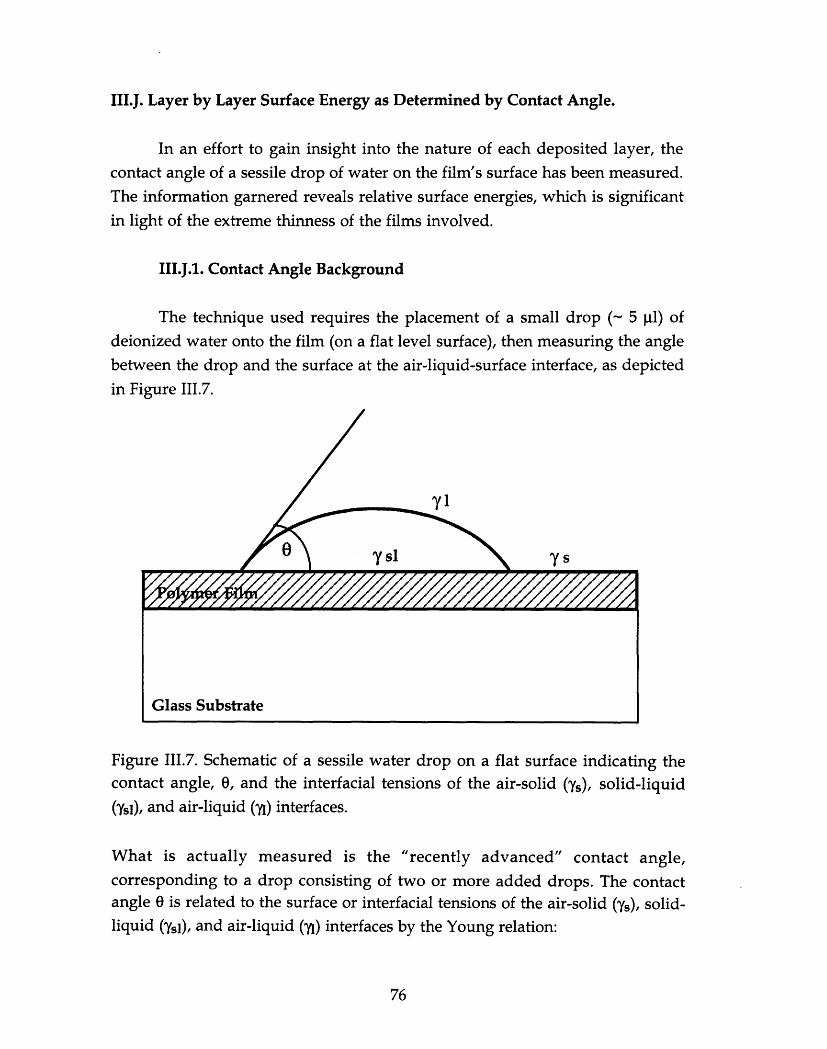
III.J. Layer by Layer Surface Energy as Determined by Contact Angle.
In an effort to gain insight into the nature of each deposited layer, thecontact angle of a sessile drop of water on the film's surface has been measured.The information garnered reveals relative surface energies, which is significantin light of the extreme thinness of the films involved.
III.J.1. Contact Angle Background
The technique used requires the placement of a small drop (- 5 R1) ofdeionized water onto the film (on a flat level surface), then measuring the anglebetween the drop and the surface at the air-liquid-surface interface, as depictedin Figure III.7.
Figure III.7. Schematic of a sessile water drop on acontact angle, 0, and the interfacial tensions of the
(Ysl), and air-liquid () interfaces.
flat surface indicating theair-solid (ys), solid-liquid
What is actually measured is the "recently advanced" contact angle,corresponding to a drop consisting of two or more added drops. The contactangle 0 is related to the surface or interfacial tensions of the air-solid (ys), solid-liquid (sI), and air-liquid () interfaces by the Young relation:
76

Ys = Ysl + 1 cos 0 {1}
For a given liquid, 7y is constant, thus cos 0 is proportional to Ys - Ysl. Smallcontact angles (better wetting) occur when Ys - ysl is maximum; extremely poorwetting occurs when ys < ysl . Qualitatively, the contact angle increases as sdecreases and/or ysl increases. It has been shown, however, that these twosurface energies (ys and ysl) are related [89], thus changes in contact angles canbe attributed to changes in ys, the surface tension, all geometrical parametersthe same. Good has outlined the relation between Ys and Ysl [89], described herebriefly.
He starts with the assumption that the free energy of adhesion betweentwo phases (a solid and a liquid), AGasl, is equal the geometric mean of the twofree energies of cohesion of the two separate phases, AGCi.
AGasl = 4IAGCSAGC {2}
The negative sign is for consistency. The free energy of adhesion of bringingtwo unlike phases together (forming interface sl at the expense of surfaces s and1) is given by
AGasl = Ysl - Ys - I (3}
Similarly, the free energy of cohesion of bringing two like phases together(thus no interface formed) is given by
AGCi = -2y1 and AGCs = -2ys (4)
Thus, combining equations 2), (3), and 4), gives
Ys - - = 4 4ys {5}
Equation (5) now relates ysl to Ys and A, and thus can be eliminated from theYoung equation {1}. Combining these two equations, {1} and (5), gives
q cos 0 = Ys - (s + -4 4ysy) (6)
77

which can be rearranged to give
Ys = ?l(l + cos 0)2/4 {(7
This relation assumes apolar liquids and solids, and has been further modifiedby Good to account for polar interactions. He starts by assuming that thesurface tension of a polar phase i can be broken into contributions falling undertwo classes, Lewis acid-base interactions (AB) and Lifshitz-van der Waalsinteractions (LW), as such;
yi = yAB + ,iLW {8)
AB interactions refer to electron sharing interactions such as hydrogenbonding. LW interactions are all other apolar interactions including dispersionforces and dipole interactions. yiAB can be further broken down to its acid andbase contributions, iA and yiB. By accounting for both ysA y1B and ysB y1A
adhesion interactions between a solid and a liquid, it can be shown thatrewriting equations {3) and {4} combine to give
7iAB = 21 yiA yiB (9)
Substituting this result into equation {8}, then rewriting equation {7} gives
?l(1 + cos 0) = 2[/ (ysLw lLW) + / (ysA MB) + (s B ylA)] 1101
Thus, equation 10) or its simpler form 7) allow for direct relation between themeasured contact angle and the solid surface tension. The followingconclusions can be drawn regarding this. In equation 7), as increases, cos 0decreases (for 0 < 0 < 180°), and since all yl terms can be considered constant,this means that Ys must necessarily decrease. Similarly for equation 10), which
is better suited for this study which uses water (a polar liquid) on both polarand apolar surfaces. As 0 increases, cos 0 decreases, and the entire right handside must decrease. This means that ysLw, ysA, and/or ysB must decrease. Since ys= yLW + 2ysA ysB , then ys necessarily decreases.
78

Therefore, the contact angle is a fair measure of a solid surface energy,
and not just a measure of the difference between surface tension and interfacialtension, ys - ysl, as obtained from Young's equation. It can be concluded that for
the sessile water drop contact angle measurements in this study, an increase incontact angle 0 corresponds to a decrease in ys, the solid surface energy.
As mentioned, these interfacial energies depend on many factors, such as
polar effects, van der Waals interactions, and other specific interactionsbetween the liquid (in this case, water) and the solid. There are also non-intrinsic features that can affect the contact angle, such as surface roughness and
film porosity. Young's equation assumes a smooth, homogeneous, rigid, and
insoluble surface, thus deviations can be expected for rough surfaces. Wenzel
has attempted to quantify this effect by incorporating a roughness factor, r, into
Young's equation [90]. The equation takes the form
COs Om = r cos 0 {11)
where em is the measured contact angle and 0 is the Young equation, or smooth
surface, contact angle. The roughness factor r is defined as the ratio of the actual
surface area to the smooth projection onto a plane. Thus, r is always > 1, whichimplies that Om < 0 for 0 m < 90° and Om > 0 for 0 m > 90 °. Since measured
contact angles of this study were all < 90°, the Wenzel relation suggests that Om
< 0, or that surface roughness acts to lower the contact angle. The Wenzel
relation, however, does not account for relative scales nor lateral degrees ofroughness, simply the overall surface area. It is likely that the Wenzelroughness factor applies to roughness on a larger scale than the 40-70 Ameasured for the thin films of this study. The issue of surface roughness will befurther addressed in the next section.
III.J.2. Contact Angle Study for PAn/PVP Multilayer Films
In the case of the multilayer films of this study, contact anglemeasurements were used to monitor surface energies as a function of depositedlayer. Effects of the underlying layers as well as changes with time were alsoconsidered. The drop size used was about 3 mm in diameter, thus averages over
79

about a 7 mm2 area. Reported values represent averages of three or four dropswith the angle measured on both sides of each drop.
The contact angle as a function of deposited layer was measured for aPAn/PVP multilayer system grown on glass coated with a PEI/SPS bilayer. Inorder to measure surface properties of each individual layer under different
conditions, thirteen different films were made, ranging from zero to twelvelayers. The individual films did show the expected linear growth, as seen by alinear increase in absorbance vs. layer number, shown in Figure III.8. Thisimplies that the each film can be considered as equivalent to its previous filmplus one more layer. Since PVP does not absorb light near 630 nm, the filmswith PVP as the outer layer have the same absorbance as those with PAn as the
outer layer.
Shown in Figure III.9 are three series of contact angle measurementsmade on the same films under different conditions. Several observations can be
made. First, for the "zero layer" which means no PAn, but just the initialadhesion enhancement bilayer of PEI/SPS, the contact angle is initially verylow, about 8. This is due to the relatively high surface energy and stronginteraction between SPS and water. Drying this bilayer slightly raises thecontact angle, but annealing at 175°C tremendously raises the contact angle.This suggests that the thermally enhanced chain mobility allowed the bilayerto reconfigure to its lowest surface energy configuration, possibly increasingthe number of ionic interactions between PEI and SPS, leaving fewer chargedsites on the surface. Since the PEI was only physisorbed to the glass surface tobegin with, heating to 175°C eased chain mobility as well as possibly thermallybreaking any hydrogen bonding that my have been in place.
For the freshly made films, there is an oscillating behavior in themeasured contact angle as the surface alternates between PAn and PVP. Asexpected, the PVP outer surface has the lower contact angle, being a morehygroscopic polymer. This oscillating behavior is indicative of how each addedlayer acts to completely cover the surface, and in a reproducible fashion. Theindication is that the deposited layers are stacking to some extent in discretelayers. Although there is certainly some extent of interpenetration betweenevery layer, the outer surface remains extremely rich in the most recentlydeposited polymer. Also noted is that the contact angle returns toapproximately the same value for each type of layer regardless of the numberof layers (except for the first PAn layer, which likely has incomplete coverage).
80

0.2
2
0
Cu
00M
0.15
0.1
0.05
0
12 PAn/PVP-1M Films(used for contact angle study)
1 2 3 4 5 6 7
Bilayer
0
Figure III.8. Absorbance at 620 nm vs. number of layers for 12alternating PAn/PVP layers. Note PVP layer shows no absorbance.
81

PAn/PVP-1M, (odd layers - PAn)80
60 I i i i
_. - .. . .. ....., ...................... ......... ...... .......... . ................... ................
o 50
30 ', /il-' ,~, ,1%A~'
zU X ........................ . ...........................
0 - - Freshly made.. - ....----------------------------------- -- w ee .r dryl 10 .... .. . 1 week air dry
I , I . ----A---- Anneal 1750C (2 hrs)U I I I I I I I I I I I I I I
0 2 4 6 8 10 12 14
Layer
Figure III.9. Contact angle vs. layer number for 12 layers(6-PAn, 6-PVP, alternating), for three different conditions, as noted.
82

This implies that the coverage from each layer is complete (after the first layer),
as each successive layer erases the effects of underlying layers. These layers areon the order of 70A thick, 50A of PAn and 20A of PVP, as outlined in SectionIII.F. Yoo has shown thinner layered films to respond differently depending onthe underlying substrate [70]. Thus there can be an effect "felt" through the filmdepending on both film thickness and polymer type.
The stability of this stacked configuration was evaluated by remeasuringthe contact angle after extensive drying and annealing. There are aging effects,as seen in Figure III.9 by remeasuring the contact angle one week later. Thecontact angles have increased by about 6-10°, due to both the increased drynessof the films, and to the film's tendency to reduce its surface energy. This surfacerearrangement involves configurational changes that can, for example, bury
higher surface energy side groups, as observed in polyelectrolyte systems [91].The result is to increase the contact angle (poorer wetting for lower surfaceenergy). The oscillating nature remains, however, suggesting that there is notany bulk chain diffusion. Further annealing at an elevated temperature (175°C)for two hours, that is likely above the film's Tg, led to slightly increased contactangles, but the oscillations persisted. Again, there was no bulk diffusion ofchains to the surface suggesting no (or little) additional phase mixing betweenthe layers, beyond the first PAn layer. The first PAn layer did show a largeincrease in contact angle, however, due to the extreme thinness of this layer
(and possible incomplete coverage), thus behaves more like the 'zero' layer.
There does appear to be an effect of the number of layers in the annealedsamples. The contact angle increases with layer number, whereas this was notthe case for the freshly made films. This increase has been attributed to anincrease in surface roughness with increasing layers, enhanced during theannealing. These results are seen in Figure III.10 which shows the RMSroughness as measured by atomic force microscopy (AFM) for 10x1O micronareas. Starting with the third layer (second PAn layer), the roughness increasesfrom about 60A to greater than 70A by the eleventh layer (sixth PAn layer).Even though the first PAn layer has the lowest RMS roughness (45A), it still hasa very high contact angle. This is related to the incomplete coverage of the firstbilayer, mentioned above. It should be noted that the AFM images were takenone month after the films had been annealed at 175C. Therefore, their contactangles were remeasured immediately after imaging. These results are shown inFigure III.11. The contact angles have dropped by about 6-12°, suggesting either
83

Roughness of PAn Layer in a PAn/PVP Film"7r--
70
65
= 60
Y 55
d 50
45
An
................................... ..
I!
I
I...........................
0 vI...........................i............... a: :*.> B
__- - - - I- - - - - - - - - - - - -_ 1
0 2 4 6 8 10 12
Layer
Figure III.10 RMS roughness (as measured by AFM for a 10 x 10 ugmarea) vs. layer number for PAn layers only (alternating with PVP).
84
I.........................- -------·
........
- --
I
I...........................
I...........................
I i I I I
6
....... -
............................
I...........................
...........................
...................... ....
, _I
............... ............
............................
............................
................. ..........
............................
...........................
...........................
...........................
...........................
.......-
.......-
I.......-
..... .... ..... .... ....
I
...........................
I I
---------

PAn/PVP Multilayers (odd layers are PAn)80
70
60
50
40
30
200 2 4 6
Layer8 10 12 14
Figure III.11. Contact angle vs. layer number(6-PAn, 6-PVP, alternating), for two different
for 12 layersconditions, as noted.
85
-1--WUS
U

a slight reduction in roughness since the anneal, and/or effects of adsorbedmoisture over the month storage in air. The trend of oscillating contact anglewith alternating layers and the increase in contact angle with number of PAnlayers persists.
The RMS roughness for PAn layers ranges from 60-70A, while PVP layershave a slightly lower RMS roughness of about 50-55A. PVP is a flexiblepolymer that deposits in non-aggregated layers, acting to smooth the surface.AFM surface plots shown in Figures III.12, III.13, and III.14 show lxl micronareas of two different PAn layers (Figures III.12 and III.13) and a PVP layer(Figure III.14). The aggregated features are apparent, typical of adsorbed filmsof PAn. PAn is deposited as both individual chains and nano-aggregates, asdescribed earlier. A more detailed comparison of AFM images is described inSection III.L.
III.K. Monolayer and Multilayer Deposition From Mixed Solutions
In contrast to ionic polymers, the favorable interactions between PAnand these non-ionic hydrogen bonding polymers also makes it possible to formmixed solutions of the two without sacrificing solution stability. In fact, it maybe that the presence of one of these polymers acts to increase the stability of anaqueous PAn solution. Two such systems have been investigated, PAn withPVP and PAn with PAAm.
III.K.1. Monolayer Deposition From Mixed Solutions of PAn with PVPand PAAm
Self-assembly-type deposition using these mixed solutions has beendemonstrated with the deposition of mixed monolayers of both PAn/PVP andPAn/PAAm. The dipping solutions were prepared by mixing equal volumeportions of 0.01 M PAn (pH=2.6) and either 0.01 M PAAm (pH=2.6) or 0.01 MPVP (pH=2.6) to form a 50/50 mixture 0.005 M in both polymers. The solutionsappeared miscible and completely soluble in both cases, as no particulatesformed upon mixing. Adsorption was onto an SPS treated glass slide, and wasmonitored as a function of time, showing rapid deposition of a monolayer.Measuring the absorbance as a function of time has revealed these solutions to
86

JJM
d di vZ 60.000 nM/div
Figure III.12. AFM surface plot of a 1 x 1 pm area of layer 9 (PAn) in the12 layer PAn/PVP film.
87

JiM
/divZ 50.000 n/div
Figure III.13. AFM surface plot of a 1 x 1 gm area of layer 11 (PAn) in the12 layer PAn/PVP film.
88

I
JM
'd ivZ bU60UUU n/d
Figure 111.14. AFM surface plot of a 1 x 1 gm area of layer 12 (PVP) inthe 12 layer PAn/PVP film.
89

be self-limiting in deposition, meaning that only a single layer is deposited(over 90% of the eventual thickness in the first 30 minutes). This is seen in theabsorbance vs. time plot shown in Figure III.15. Deposition tapered off,virtually stopping after about 45 minutes. Two different dipping solutions arecompared in Figure III.15, one made using NMP as the PAn solvent, the otherusing the usual DMAc. Deposition is virtually identical in both cases, however,films cast from DMAc have higher conductivities, as was seen in Section III.I.Again, this is attributed to higher residual solvent retention with NMP.
No direct thickness measurements have been made; values of 60 A forthe PAn/PVP film and 47 A for PAn/PAAm are estimated based on assumingthe same absorbance as seen in the respective multilayer films. Similarly, theyare estimated to have 50-60 vol% PAn. The single layer conductivity (0.1 S/cmfor both films) is only about an order of magnitude lower than the eventualconductivity for multilayer films. The significance is that a conducting layer isdeposited with a single "dip." The first bilayer in a multilayer system formedby alternative dipping is the thinnest since the first layer of PAn is usuallydeposited on SPS, leaving a thin, incomplete-covering layer. By using a mixedsolution, a thicker first layer can be deposited, as seen with PVP and PAAm.Since these films are about 50-60A thick, they are highly transparent, andadvantageous in the fact that only a single step is required for deposition.
III.K.2. Effect of Substrate on Monolayer Deposition From Mixed
Solutions
Since the exact film thicknesses and corresponding vol% PAn depositedhave not been determined, it is uncertain exactly what structure is beingdeposited. Certainly, there is sufficient connectivity of PAn to create aconductive layer. The questions to be addressed concern the manner ofdeposition from the mixed solution. Do the two polymers co-deposit as ainterpenetrated blend, do they deposit sequentially, or does only PAn deposit?
In addressing these questions, attempts were made to deposit PAn andPVP on top of a PAn/PVP mixed layer. Also, mixed layers were deposited onto
both PAn and PVP surfaces (as opposed to the polyanionic SPS surface). Theresults are graphically shown in Figure III.16 for a series of six films,summarized as follows:
90

U.UO
0.025
0 0.02%0
o 0.015
° 0.01
0.005
/3
Monolayer, PAn/PVP mixed soln.
U
0 20 40 60 80Minutes
Figure III.15. Absorbance vs. adsorption time for a 50/50 mixedsolution PAn/PVP, using either NMP or DMAc as the PAn solvent.
91
- O 0
- AO-
0 |A NMPO DMAc
- I I I I I I i I I I I

PAn will deposit onto the PAn/PVP mixed layer, but only about half asmuch as onto pure PVP, as determined by light absorbance (film 1 compared tofilm 5). Similarly, PAn will adsorb onto a layer of PVP that has first beenadsorbed onto a mixed layer, but again shows only about half the usualabsorbance (film 2). Since only half as much PAn is being deposited, thisindicates that the mixed layer presents a surface that must be a mixture of itstwo components, PVP and PAn, since PAn will not deposit onto itself. The factthat still only about half as much PAn adsorbs even if a layer of PVP is firstadsorbed onto the mixed layer suggests that very little PVP is being deposited.These two results imply that the surface of the mixed layer is heterogeneous,but likely PVP-rich.
For the deposition of the mixed layer on top of PAn and PVP, very littlewas deposited in both cases (films 4, 5, and 6). Apparently the stronginteractions between PAn and PVP in the mixed solution prevent the mixturefrom forming sufficient interactions with either the PAn or the PVP surface tostrongly adhere. The mixed layer deposits nicely onto a negatively chargedsurface (SPS), suggesting that the positive charge sites along the PAn backboneare what enable the mixed layer deposition. No attempt was made to build upfurther with PAn on top of this weakly adsorbed mixed layer. This might showthat the underlying PAn layer preferentially adsorbed PVP from the mixedsolution, had a subsequent full layer of PAn been deposited. This preferentialadsorption would not be expected, since the PVP layer did not preferentiallyadsorb PAn from the mixed solution (film 4).
Contact angle measurements were made on all six films with the resultsplotted in Figure III.17. The contact angle of the freshly made films for all caseslies between 28-32°, regardless of whether the surface layer was PAn, PVP, or amixed layer. This range lies between the contact angles measured for freshlydeposited PVP (-26°) and PAn (-38°), seen in Figure III.9 for a multilayer film.With the exception of film 1, the PAn surface, this intermediate value of contactvalue again suggests that the mixed layer consists of a well interpenetratedmixture of PAn and PVP. Since the contact angle lies slightly closer to that ofpure PVP, it supports a PVP rich surface. The fact that the PAn surface of film 1has a low contact angle can be attributed to its relative thinness - this layerconsisting of only about half of a usual PAn layer.
Allowing the films to dry in air for two days increased their contactangle up to about 36-38° (including the PEI/SPS "zero" bilayer), seen in Figure
92
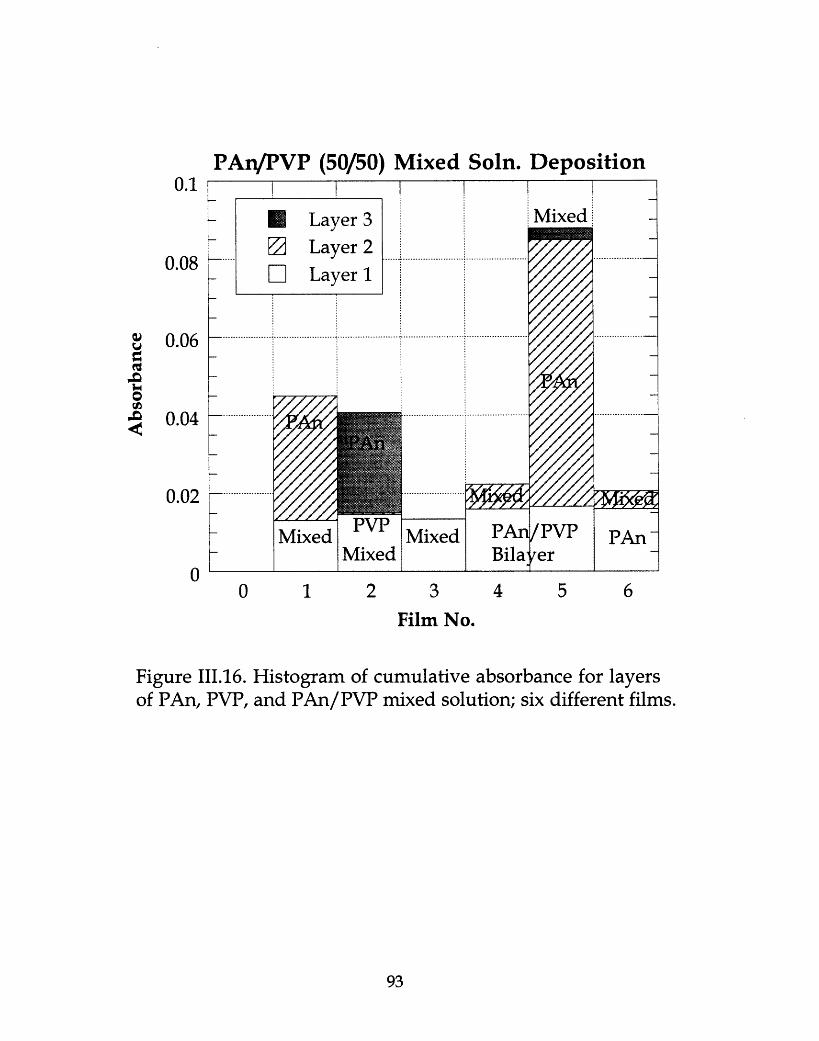
PAn/PVP (50/50) Mixed Soln. Deposition0.1
0.08
0.06
0.04
rOC%JIu
Oo
0.02
00 1 2 3 4 5 6
Film No.
Figure III.16. Histogram of cumulative absorbance for layersof PAn, PVP, and PAn/PVP mixed solution; six different films.
93

Contact Angle for PAn/PVP Mixed Films. .. ...
A
A
AA
8
1 2
0
3
A
0
4 5 6
Film
Figure III.17. Contact angle at threefor the six films from Figure II1.16.
different conditions
94
80
70* Freshly Made* Two day air dryA Anneal 175°C (4 hrs)
60
50
40
ubC
uto
0.m)
4
30
20
I,
0
0 7

III.17. One exception was film 2, which was measured after the PVP layer(before the PAn layer), whose contact angle was near 30°. This lower valuereflects a PVP-rich surface.
Subsequent annealing at 175°C for four hours led to higher contactangles in all cases, particularly for the PAn surface in film 1. The lowest contactangle is for the PVP surface of film 2, with all the contact angle of the otherfilms (with mixed-layer surfaces) lying in between these two. The implicationis that the PAn/PVP mixed solution deposits a well interpenetrated layer withthe two polymers strongly interacting with each other.
III.K.3. Varying the PAn/PVP Ratio and Concentration in the MixedSolution
All of the above mentioned mixed solution work was done using a 50/50mol ratio at 0.01 M overall concentration (0.005 M of both polymers). Theconcentration parameter space has also been explored, varying both thePAn/PVP ratio as well as the overall concentration.
First, a series of samples were deposited from a mixed solution atconstant overall polymer concentration, 0.01 M, varying the PAn/PVP ratiofrom 10/90 to 90/10. A single mixed layer was deposited onto two PAn/SPSbilayers on clean glass, using a 30 minute dip time. A two bilayer base wasused to ensure a uniform SPS surface covering on which to deposit the mixedlayer. The absorbance at 870 nm (corresponding to the absorption maximumfor PAn at pH=2.5) is plotted for this series in Figure III.18, showing how theaddition of PVP increased the amount of adsorbed PAn. The absorbance due
only to the mixed layer is tabulated for the series in Table III.4. Included is theabsorbance for the second PAn/SPS layer, which corresponds to the 100% PAncase. All mixed solutions deposit more PAn than the 100% case, even thoughthe concentration of PAn has decreased. The absorbance appears to go throughmaximum near 75% PAn, which reflects the competing events for adsorption inthis system. Adding PVP acts to enhance the adsorption onto SPS, butdecreasing the PAn concentration diminishes the amount adsorbed.
The next section addresses the case of constant PAn concentration (0.01M), with added PVP.
95

PAn/PVP Mixed Monolayer on 2 Bilayers PAn/SPS
41 2 3Bilayer
Figure III.18.of PAn/PVP
Absorbance at 870 nm vs. bilayer number for a seriesmixed solution monolayers, varying the PAn/PVP
ratio. (Deposited onto two bilayers of PAn/SPS).
96
0.1
0.08
0.06
0.04
o0
,6auI0,-WCZ0%J9MIn
0.02
00
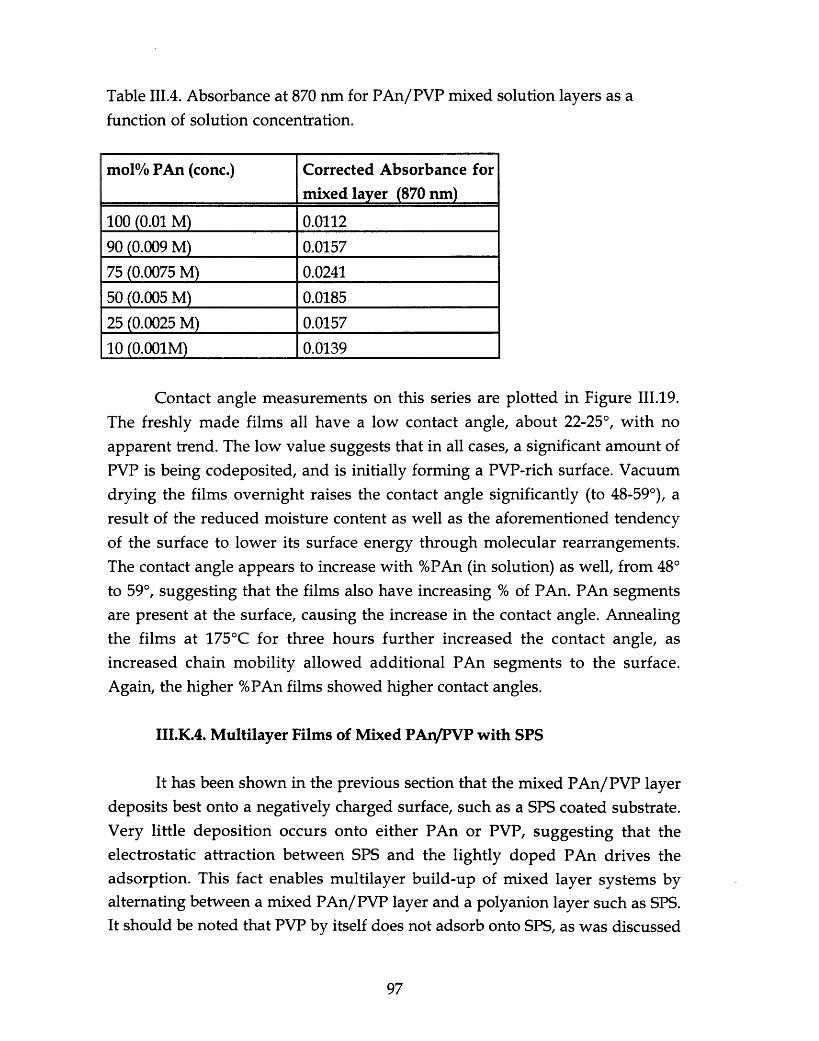
Table III.4. Absorbance at 870 nm for PAn/PVP mixed solution layers as afunction of solution concentration.
mol% PAn (conc.) Corrected Absorbance for
mixed layer (870 nm)
100 (0.01 M) 0.0112
90 (0.009 M) 0.0157
75 (0.0075 M) 0.0241
50 (0.005 M) 0.0185
25 (0.0025 M) 0.0157
10 (0.001M) 0.0139
Contact angle measurements on this series are plotted in Figure III.19.The freshly made films all have a low contact angle, about 22-25°, with noapparent trend. The low value suggests that in all cases, a significant amount ofPVP is being codeposited, and is initially forming a PVP-rich surface. Vacuumdrying the films overnight raises the contact angle significantly (to 48-59°), aresult of the reduced moisture content as well as the aforementioned tendencyof the surface to lower its surface energy through molecular rearrangements.
The contact angle appears to increase with %PAn (in solution) as well, from 48°
to 59°, suggesting that the films also have increasing % of PAn. PAn segmentsare present at the surface, causing the increase in the contact angle. Annealingthe films at 175C for three hours further increased the contact angle, asincreased chain mobility allowed additional PAn segments to the surface.Again, the higher %PAn films showed higher contact angles.
III.K.4. Multilayer Films of Mixed PAn/PVP with SPS
It has been shown in the previous section that the mixed PAn/PVP layerdeposits best onto a negatively charged surface, such as a SPS coated substrate.Very little deposition occurs onto either PAn or PVP, suggesting that theelectrostatic attraction between SPS and the lightly doped PAn drives theadsorption. This fact enables multilayer build-up of mixed layer systems byalternating between a mixed PAn/PVP layer and a polyanion layer such as SPS.It should be noted that PVP by itself does not adsorb onto SPS, as was discussed
97

PAn/PVP Mixed Layeron PAn/SPS
90
804
70
60
U 40
Figure III.19. Contact angle for PAn/PVP mixed solution series(from Figure III.18) for three different conditions.
98
30
20
10 ()I I I I I
20 40
...... ...................... ........... .._
............... ........... .. ....... .................... ............... ... ... ... .. ... . .... .. ... ..... _
60mol% PAn
I I I
80I I I
100
--- Freshly Made-[--- Vacuum Dried
A-- Anneal 175°C (3 hrs)i 1 . . /
-
i [ I I I I [ I I I
................................. ............... -
-- --------- la-�..................................in_- -----------------------------r-L��JuFv -- -- .L.

in Section III.E. Thus, the mixed solution approach enables deposition ofmultilayers of a heterogeneous conducting layer alternating with a polyanion.
Two series of multilayer films were grown, as described below. The firstwas deposited from a PAn/PVP solution of constant overall concentration (0.01M, total of both polymers), varying the PAn/PVP ratio from 25/75 to 75/25.The second series held the PAn concentration constant at 0.01 M while addingPVP to again vary the ratio from 25/75 to 75/25, designated the F-series. Inboth cases, all solutions were adjusted to pH=2.5 with MeSA. As before, 30minute dip times were used for the mixed layers, 15 minutes for the SPS. Layer-by-layer build-up was monitored by UV-vis absorbance.
For the first series, six bilayers were deposited onto SPS-treated glassslides, measuring the UV-vis absorbance after every bilayer. Again, these arepartially doped films, thus the absorbance maximum (for PAn) is near 860 nm.Figure III.20 shows the linear growth for these six bilayers for three PAn/PVPsolution ratios, 75 mol%, 50%, and 25% PAn. For the first bilayer, all threeconcentrations deliver about the same amount of PAn, somewhat lower thanthat seen in the previous section for the 10%-90% PAn series. The absorbance isabout 0.008-0.011 here, before it was 0.016-0.024 (Table III.4). The difference isdue primarily to the condition of the underlying SPS layer. For the previouscase, the base layer consisted of two PAn/SPS bilayers, presenting a moreuniform and complete SPS layer. In this case, the substrate is SPS-treated glass,which has a thinner, "spottier" covering. The subsequent layers contain morePAn, comparable to those seen in the previous section. A comparison will beseen shortly, in Table III.5.
As evident in Figure III.20, the most PAn is deposited from the 50%solution. This again reflects the competing nature for adsorption. PVP acts toenhance the deposition, but lowering the PAn concentration decreases theamount available to adsorb.
If the amount of PAn is held constant, at 0.01 M (the F-series), a slightlydifferent trend is seen. Again, linear build-up is observed, plotted in FigureIII.21. By eliminating the PAn concentration variable, the effect of PVP can beobserved. All three concentrations (75, 50, and 25 mol%) deliver about the sameamount of PAn, with the highest concentration of PVP having a slightly higheramount. This corresponds to the effect of PAn-enhanced deposition onto SPS bymeans of added PVP.
99

PAn/PVP Mixed Layers alternating with SPS0.14
0.12
0.1
0.08
0.06
0.04
0.02
00 1 2 3 4 5 6 7
Bilayers
Figure III.20. Absorbance at 860 nm vs. bilayer number forPAn/PVP mixed solution multilayer films built up with SPS.(Three PAn/PVP ratios, overall polymer concentration = 0.01 M).
100
To
To5¢

PAn (0.01 M)/PVP Mixed Layers Alternating with SPS0.15
aO
mj
In;-4
0.1
0.05
u0 1 2 3 4 5 6 7Bilayer
Figure III.21. Absorbance at 860 nm vs. bilayer number forPAn/PVP mixed solution multilayer films built up with SPS.(three PAn/PVP ratios, PAn concentration = 0.01 M).
101
n

Film thicknesses were measured by profilometry, revealing the bilayersto measure about 60A thick and consist of approximately 40 vol% PAn. Thisincludes both the SPS layer and the mixed PAn/PVP layer. Since SPS generallydelivers 10-15A per layer, thus about 20% of the total thickness, this impliesthat the amount of PVP being deposited never exceeds the amount of PAn. Itappears that the amounts of PAn and PVP are about the same, suggesting thatthe two polymers are highly interacting, and deposit as though they arecomplexed. These values are tabulated in Table III.5.
Table III.5. Selected properties for six bilayer films of SPS with PAn/PVP mixedsolution for varying concentrations of PAn and PVP in the mixed solution,average values for each concentration. F-series hasconcentration of 0.01 M, the other series has an overall PAn/of 0.01 M.
a constant PAnPVP concentration
% PAn Ave. A Abs. at Abs. Est. Dichroic a S/cm
in thick. (A) /bilayer 630 nm /bilayer vol% RatioPA,/PVP__ PAn
100 * 245 41 0.0748 0.01246 43 1.19 0.110
75% 284 48 0.0850 0.01416 39 1.26 0.010
50%/o 342 57 0.1127 0.01878 44 1.29 0.025
25% 378 63 0.1012 0.01687 35 1.29 0.016
F-75% 232 39 0.1143 0.01905 64 1.26 0.094
F-50% 321 54 0.1286 0.02143 52 1.25 0.092
F-25% 323 54 0.1253 0.02088 51 1.27 0.029
* PAn/SPS multilayer film, no PVP.
Dichroic ratios (S-polarized/P-polarized) were also measured, and aretabulated in Table III.5 as well. This ratio gives a relative indication as to theaverage preferred chain orientation of the PAn chains. The ratio lies between1.25-1.30 for all concentrations, indicative of an in-plane orientation preference,but little or no difference for changing concentrations.
Conductivity measurements show the films to be about one order ofmagnitude lower than PAn/SPS systems for the lower concentration PAnseries, and about the same for the 0.01 M PAn series (F-series). There is little or
102

no increase in conductivity from a single mixed layer, seen in Section III.K.1, tothe multilayers here. In all cases, the conductivity is lower by at least an orderof magnitude to the PAn/PVP multilayer films. This is due to several factors,primarily that the PAn/PVP mixture acts to dilute the PAn chains, reducingeffective interchain charge transfer, as was seen in blended films in Section II.F.Also, as was seen in section III.H, the PAn/SPS multilayer films generally havea lower conductivity than the PAn/PVP systems, by about an order ofmagnitude. The cause of this is uncertain, and might be simply due to the PAnthickness per bilayer, which is less in PAn/SPS than in PAn/PVP (see TableIII.1)
III.L. Surface Topography by Atomic Force Microscopy
An important issue in understanding the structure of the films is therelative smoothness of the deposited films, and how the various parameterssuch as molecular weight and number of bilayers affects the surface roughness.To elucidate these effects, samples consisting of self-assembled polymer filmson both glass slides and silicon wafers were imaged by atomic forcemicroscopy. Clean glass and clean silicon were imaged first as references. Thereported root mean square (RMS) roughness values show the range measuredfor at least five different scans per sample. For the RMS roughnessmeasurements, the scan area was generally 10 jgm x 10 jim.
Table III.6 summarizes results from a series of films on both glass andsilicon. As expected, silicon is the smoothest, with an average RMS roughness(Rq) of 3-6 A. Glass has a roughness of only 5-9 A. Silanizing the glass with atrifunctional silane slightly increases the roughness (Rq = 7-12 A), and coverage
appears complete. The behavior is similar with silanized silicon. One layer oflow mw SPS (70K) on the trifunctional silane does not significantly change theappearance or roughness, still around Rq = 10-16 A. Coating glass with a layerof PEI rather than silanizing gives slightly smoother films, Rq = 7-9 A. PEI will
not deposit onto silicon, however.A monolayer of PAn on glass has Rq = 39-47 A. The PAn film appears
aggregated; Table III.6 gives a rough estimate of the diameter of the aggregates.A monolayer of PAn on silicon has Rq = 50-70 A. The PAn deposited a rough,
aggregated layer, similar to the film on glass. The coverage was not quite
103

complete, and adhesion was not as good as with glass. A layer of PAn on SPS-silanized glass has only slightly increased roughness, Rq = 45-53 A, as does alayer of PAn on SPS-PEI-glass, Rq = 45-55 A. This is despite the increasedroughness of a layer of SPS-hi on PEI on cleaned glass, Rq = 20-29 A, vs. SPS-low
on silanized glass, Rq = 10-16 A.
The increased roughness in going from SPS on silane to SPS on PEI maybe due entirely to the increased mw of the SPS (70K to 500K), since the PEImonolayer (7-9 A) is slightly smoother than the trifunctional silane (7-12 A).Table III.6. RMS roughness of various films as measured by AFM.
Two PAn/PVP multilayer samples were imaged, numbers 13 and 14 inTable III.6, showing slightly increased roughness with increasing number ofbilayers. Apparently, the addition of bilayers does not act to planarize thefilms, but rather continues to slightly roughen. Even one layer of SPS increasesthe roughness of a glass slide, and subsequent layers act to roughen the surfaceeven more. The low concentration PAn solutions (10-4 vs. 10-2 M) deposit thesmoothest films, indicating the more favorable conditions for chain elongation
104
Sample RMS Appearance
Roughness (A)
1. clean glass 5-9 smooth
2. clean silicon 3-6 smooth
3. silanized glass (trifunctional) 7-12 uniform, 15 nm aggregates.
4. silanized silicon (trifunctional) 9-18 uniform, 16 nm aggregates.
5. PEI on clean glass 7-9 uniform
6. PAn on clean glass 39-47 30-38 nm aggregates
7. PAn on clean silicon 50-70 38 nm aggregates
8. SPS-low on silanized silicon 10-16 15 nm aggregates
9. SPS-low on silanized glass 8-9 16 nm aggregates
10.PAn on SPS-low silanized glass 45-53 32-38 nm aggregates
11. SPS-hi on PEI on clean glass 20-29 25-38 nm aggregates
12. PAn on SPS-hi on PEI-glass 45-55 30-38 nm aggregates
13. 5 bilayers PAn/PVP 63-70 On SPS treated glass
14. 20 bilayers PAn/PVP 56-91 On SPS treated glass
15. 5 bilayers PAn/SPS 29-43 Low conc. PAn (10-4 M)

on the surface due to decreased competition for surface sites. It is also possiblethat there are fewer or smaller aggregates in the lower concentration PAnsolution, thus delivering a smoother layer.
III.M. Neutron Reflectivity Study
In collaborative work with Mayes and Kellogg [92], neutron reflectivityexperiments have been performed to address questions about the nature of thebilayer interfaces and surface roughness. The technique is sensitive to gradientsin the neutron scattering length density normal to the film surface, thus is wellsuited to characterizing internal layer organization as well as surfaceroughness. The particular system under study was SPAn/PAH (sulfonatedpolyaniline/ poly(allylamine hydrochloride)). This is an ionic system withrelatively thin bilayers (about 15A). Films of 40 bilayers were prepared,selectively labeling certain blocks of bilayers with deuterated SPAn.
In short, the multilayer structure was found to have broad interfaces, onthe order of 45A. Considering that each bilayer is only 15A, this implies thatthere is considerable interfacial diffusion and/or a highly corrugated interface,that appears to become rougher as more layers are deposited. The surfaceroughness was estimated to be about 95A, supporting the idea of irregular(wavy or corrugated) interfaces. Parallel AFM measurements on films with 32bilayers revealed an RMS roughness of about 80A, consistent with the neutronreflectivity data fits. The deposition was uniform in terms of average bilayerthickness, however, as all films had about the same overall thickness, andlinear growth was always seen in monitoring the deposition.
Preliminary results on PAn/PEO systems have revealed, again, veryrough surfaces, and irregular or diffuse interfaces.
III.N. Chain Orientation by Dichroism Studies
One method for determining chain orientation of molecules on surfacesis that of polarized light spectroscopy. By measuring the absorption of lightpolarized parallel (P) compared to that perpendicular (S) to the plane ofincidence, the average orientation of a chromophore transition moment can be
105

determined. This approach has been applied to Langmuir-Blodgett films [93-96], which are quite similar to self-assembled films in that they are both thinfilms usually deposited on both sides of the substrate (glass, in this case). Theabsorption maximum is measured for the two polarizations at off-normalincidence. For S polarized light, the electric field component lies entirely in theplane of the substrate. For P polarization, the electric field vector hascomponents both in the plane of, and perpendicular to, the plane of thesubstrate. The average orientation of the transition moment is thus dependenton the dichroic ratio, or the ratio of S absorbance to P absorbance. Forpolyaniline, this transition moment lies effectively along the chain axis, thusthe average chain orientation can be determined from the dichroic ratio. Noneof the other polymers of this study absorbs visible light, thus do not interferewith interpretation of the PAn chain orientation. A similar experiment can bedone with infrared spectroscopy to probe the orientation of these otherpolymers. Several example spectra are shown in Figure III.22.
Using the relations outlined in references [93-95], the ratio of Pabsorption to S absorption is given in equation 112},
Ap nl cos i + n3 cos r n13 n3 sin2 i--- =--------------------- (cos i cosr+ ---------------- ) {12}
As nl cos r + n3 cos i n24 tan2
where nj is the refractive index of phase j (1 = air, 2 = polymer film, 3 = glass
substrate), and i is the angle of incidence at the air-film interface, and r is theangle of refraction at the film-glass interface. The angle is the angle of the
transition moment from the surface normal, assuming uniaxial orientation.This angle can be thought of as the average angle of the PAn chains from thesurface normal.
Relative chain orientation for PAn multilayer films were determined forseveral sets of films. The dichroic ratio (S/P) was measured at three differentangles of incidence, 30°, 45°, and 60°. Using equation 12}, the average chain axisangle, 0, was calculated, using the following values: ni = 1.0, n2 = 1.6, n3 = 1.5,
and r was determined by Snell's law, n3 sin r = nl sin i. There is someuncertainty in the index of refraction for the thin PAn multilayer films, n2. A
refractive index of n = 1.6 has been reported for thin polyaniline films grownelectrochemically, at a wavelength of 600 nm [97, 98]. The index, n, increases
106

1.4
1.2
1
0.8
0.6
0.4
0.2
0
Polarized Light Absorbance Spectra_ ,. .. . . ..
400 500 600 700 800 900
Wavelength (nm)
Figure III.22. Polarized UV-visible absorption spectra for threePAn multilayers, PAn/PVP, PAn/PVA, and PAn/SPS, withS and P polarization. (Angle of incidence is 45°)
107
CuU
o.m¢a
I I I I I I
.....- PVP (15 bilayers)
P ' .
b.? , -
_ ~:~ PVA(15bilayers) _' ;- S '._
I i I f I i I ~ I

with decreasing wavelength. Values as low as 1.17 were measured for doped
films [97]. Ellipsometry measurements in our lab at three wavelengths, 488, 633and 830 nm, show the value to range from 1.7-2.1, quite a large range. Sincethere is a fourth power relation for n2 in equation {12}, it is important toaccurately know this value. Thus current calculated values for remainuncertain. Qualitatively, however, this technique is quite useful for makingrelative comparisons between various film-forming conditions.
For dichroic measurements made on several samples of varying PAnconcentration, the following observations can be made. The lowerconcentration PAn solutions (low = 10-4 M) had the highest dichroic ratios,indicating that these films have the most "flattened" chain orientation, or the
most preferential in-plane orientation. This behavior is expected since the more
dilute environment allows chains to reconfigure to a more extended state onthe surface, thus increasing their adsorption interactions. Solutions made fromDMAc rather than NMP generally delivered higher ratios, as well. Again,stronger interactions with NMP reduces available adhesion sites along the PAnchain, decreasing its ability to extend along the surface. Most all of themultilayer thin films had a dichroic ratio of about 1.18-1.26, indicating a slightpreferential in-plane orientation of the PAn chains, with the exception ofmultilayer flms made with PAAm. As discussed in Section III.F, theconfiguration of PAAm is more strongly dependent on pH than the othersystems, most likely due to the fact that it can be positively charged at low pHvalues, thus experiences some charge repulsion from the positively charged
PAn layer.
108

CHAPTER IV. CONCLUSIONS, SUMMARY, AND FUTURE WORK
The controlled manipulation of conducting polymers will prove to beextremely useful in quite a variety of applications ranging from thin filmconducting coatings to large scale bulk materials. It is the goal of this thesis toaddress some of the issues concerning structure and the nature of interactionswithin conjugated polymer assemblies, focusing on one particularly promisingconducting polymer, namely polyaniline.
IV.A. Summary - PAn/PVP Blends
It has been shown in this work that relatively stable, electricallyconducting compatible blends of PAn with PVP can be cast from both NMP andDMAc. The two polymers were miscible to the extent probed by thermalanalysis, light microscopy, and SAXS. The formation of a single-phase blend issolvent-dependent, however, depending on the blend ratio and molecularweights. NMP is the preferred solvent (over DMAc), even though both are goodsolvents for the individual homopolymers. Compatible blends with aconductivity on the order of pure PAn (-1 S/cm) require > -25 wt% PAn, butconductivities two orders of magnitude lower (-0.01 S/cm) can be obtained withless than 5 wt% PAn. Although a relatively low apparent percolation threshold(about 3-5% PAn) is obtainable, it is not clear that miscibility is best to lower thepercolation threshold. Completely dissolved (and dilute) PAn, if uniformlydistributed in an insulating matrix, would have significant barriers for interchaincharge transport. TGA results revealed high solvent retention, particularly NMP,up to as high as 33% for pure PAn solvent-cast films, even after considerabledrying. The strong interactions between PAn and NMP act to retain NMP in thefilms, which leads to reduced conductivity.
109
The above reported conductivity values are for blends cast in the undoped
form, then subsequently doped. Conducting blends of fully doped PAn with PVPcan also be cast directly from solution, again with NMP a better solvent thanDMAc. There is, however, a significant conductivity drop for these systemscompared to the post-doped system (about two orders of magnitude). The blendfilms with high wt% PAn show evidence of crystallites, seen under crossedpolarizers in a light microscope. There is still considerable compatibility betweenthe two components, however, as evident by the films' uniform appearanceunder the microscope. In all cases, the presence of residual NMP remainsproblematic.
IV.B. Summary - Self-Assembly of PAn Multilayer Films
Building up multilayer thin films can be readily achieved with a widevariety of combinations, as demonstrated in this paper with polyaniline.Conductivities on the order of 2-4 S/cm are readily obtained with thickermultilayers, with a minimum thickness of about 200A. These thin film assembliesare controllably grown by means of adjusting solution chemistry andcomposition, most importantly pH, concentration, and molecular weight. In thecase of films with PAn, it has been shown that multilayer films can be built up bymeans of both electrostatic forces as well as secondary forces like hydrogen
bonding. Solution pH and molecular weight effects (of the counter-polymer)have been described. There has been no investigations yet into the effect of themolecular weight of the PAn, but this is certainly a very important issue.
It is apparent in the case of the non-ionic polymers that there areadditional interactions other than hydrogen bonding that lead to this build-up.Certainly, hydrophobic interactions are important in the deposition of PAn (aswater is a non-solvent), but it is not clear what other interactions are driving thedeposition of the non-ionic polymers. Investigations have been made into theability of charged polymers to adhere to non-ionic polymers, and vice versa. PEOand PVP will build multilayer systems with PAn at both low pH (2.6), thuspositively charged, and "neutral" pH (4.5-6.5). PEO and PVP will not build upmultilayers with SPS, a polyanion, nor PAH, a polycation, at any pH. Theimplication is that either there are very strong specific interactions with PAn, or
110
that these water soluble polymers (PVP, PEO, etc.) will not interact with chargedpolymers in a manner that allows multilayer self-assembly.
Investigations into the ability of hydrogen-bonding pairs other than PAnto form multilayer films have also shown no build-up. All possible hydrogenacceptor/hydrogen donor combinations were tried with PVP, PAAm, PEO, andPVA, with no build-up. Again, there are strong interactions such as additional H-bonding or specific interactions with PAn that enable this multilayer growthusing non-electrostatic polymer adsorption.
A variety of techniques has been used to assess the structure of thesemultilayer films. It appears that the deposited films are relatively rough andwavy, but by all indications, they are continuous with uniform growth. They
have diffuse interfaces, but the surface is completely changed (covered) uponaddition of each subsequent polymer layer. AFM results indicate some extent ofnano-aggregation of the PAn chains, thus the relatively rough surfaces. Polarized
light spectroscopy confirms that for these films cast from higher concentrations(10-2 M PAn) the PAn chains have only slight preferred in-plane orientation.
It has yet to be determined, but the strong interactions of PAn with certainwater-soluble polymers such as PVP or PAAm may act to stabilize aqueoussolutions of a mixture of the two. Deposition is possible from a mixed solution ofPAn with PVP or PAAm. This is advantageous from a processing perspective, aswell as in forming thicker films in one dip. A conductive film can be deposited ina single step in the case of these mixed solutions (conductivities on the order of0.1 S/cm). Although these mixed solutions are self-limiting (they only formmonolayers, just like a homopolymer solution), it is possible to form multilayersby alternating the mixed layer with a layer of SPS. The mixed layer deposits as acompatible blend, as evident by intermediate contact angles between that of PAnand PVP. Since the mixed layer will not deposit onto a PAn nor a PVP layer, butdoes deposit onto a negatively charged layer (like SPS), this implies that thepresence of charged PAn drives the deposition, but significant amounts of PVPare co-deposited.
There are strong interactions between PAn and DMAc, and even strongerwith NMP. It has been shown that these residual solvent interactions can lead toreduced conductivity, and slightly less in-plane orientation of PAn chains in self-assembled films.
Contact angle measurements have shown the layering structure to havesome discreteness. Even though there is strong evidence for interpenetrated
111

layers, each deposited layer remains rich in its own self, effectively covering thesurface. This layering persists through many bilayers, as well as after longanneals at relatively high temperatures. Despite the compatibility of a system likePAn/PVP, the bilayers maintain their original layered structure, at least to theextent of having surfaces rich in one polymer.
IV.C. Future Work
There are some logical extensions of this work that would address in moredetail the questions about multilayer film structure, mechanisms of adsorption,and the nature of the specific interactions between PAn and other polymers.Further work concerning the electrical properties would also be of interest. Somepossibilities are:
1. Depth profiling of self-assembled films.
Shimidzu and coworkers [99, 100] have done depth profiling onelectrochemically grown multilayered structures of conducting polymers bymeans of secondary-ion mass spectrometry (SIMS). They used relatively thickerfilms, on the order of 1000-5000A, than those grown by self-assembly, 100-1000A.More distinctively, their layers were on the order of 250-500A thick, while self-assembled bilayers range from 20-80A per bilayer. These thinner films may posea resolution problem, but are certainly well suited for SIMS due to the lack ofcharging in the films, a problem normally associated with polymer films.Preliminary attempts to profile by x-ray photoelectron spectroscopy (XPS) werenot successful due to resolution limitations of the instrument.
2. Polymer adsorption - effects of PAn molecular weight and of ionic strength.
There are many adsorption parameters left unexplored that are ofsignificant importance in understanding and fully characterizing the adsorptionof PAn. For example, a single molecular weight (distribution) PAn was usedthroughout this thesis, due to the synthesis route used. Higher (and lower)molecular weights are obtainable by adjusting the synthesis conditions [40],although there is no simple way to obtain a narrow molecular weight
112

distribution. It has been shown that molecular weight can play an important rolefor the adsorption of non-ionic polymers; this parameter should be explored forPAn as well.
It is well known in polyelectrolyte adsorption that the solution ionicstrength plays a very important role, as it controls chain configurations. It can beexpected that the presence of ions would also affect non-ionic polymeradsorption, but it is not clear as to what type of effects to expect. It would also beinteresting to explore the adsorption of sulfonated polyaniline (SPAn), which isan unusual polymer in that it can have both positive and negative charges at thesame time along its chain, it is water soluble, and it is electrically conducting(although an order of magnitude lower than PAn). Certainly, there would beinteresting effects of pH, ionic strength, etc. with SPAn.
3. Enhancing conductivity with surfactant-type dopants.
Many groups, as mentioned in the introduction, have shown enhancedconductivity for PAn by using larger, surfactant-type dopants like DBSA andCSA. These dopants, due to their large size, may act to enhance ordering bymeans of forming "stratified" organization of the PAn chains. All of the films ofthis work were doped by either MeSA or HCl. Although MeSA forms one of themost stable conducting films, preliminary results indicate that the potentiallyenhanced conductivity with DBSA or CSA will have enhanced stability."Secondary doping," or solvent-induced ordering of PAn has been demonstratedwith m-cresol. Preliminary results show no conductivity enhancement in thesethin, multilayer films (MeSA-doped). It is possible that the effect is mostsignificant only with larger dopants like CSA and DBSA.
4. Annealing and/or orienting.
It is well known that thermal annealing of polymers can enhance order,and may prove to do so with these films. Preliminary results indicate that there isno improvement in conductivity after several hours of annealing at 900C, evenupon re-doping. This is below the Tg of PAn, however, and future annealingshould be at higher temperatures. The actual Tg of PAn is not known, since itdoes not display a Tg in calorimetry, and DMA on pure PAn has not been done.
It has been estimated around 150-180°C, and was addressed in Section II.C.
113

Heating can act to dedope PAn, thus doping will be necessary after annealing forlong times or elevated temperatures.
It is also well known that axially orienting conjugated polymers acts toenhance conductivity by increasing the conjugation length, and by easinginterchain charge transport by means of increased order. Several possibleapproaches to ordering self-assembled films are as follows. One simple means isby depositing the films onto a plastic substrate, then stretching. Anotherapproach is to adsorb the films onto grooved surfaces such that the chains aredriven to align in an "epitaxial" fashion. One last alignment method is byapplying an extremely strong magnetic field. We have tested this approach, andresults show that polyaniline chains will align at field strengths on the order of10 Tesla, and there is some remnance of alignment after the field is turned off.
5. Structure by neutron reflectivity and x-ray reflectivity.
X-ray reflectivity measurements could be useful in determining the extentof order of the layers in a multilayer film. Well defined, regular layers will showstrong Bragg scattering peaks, where diffuse, corrugated layering will show littlescattering. Similarly, neutron reflectivity can be used as a probe to assess theextent of layering in appropriately labeled multilayer structures.
6. Additional investigations addressing the miscibility of PAn blends.
Transmission electron microscopy (TEM) would allow the directobservation of phase separation on the nanometer scale, if it exists. A goodstaining agent for PVP is RuO4, thus contrast should be assured.
Polymer-polymer miscibility can also be probed by NMR, by observingthe extent of like-chain interactions vs. unlike-chain interactions. This techniqueis only useful for domain sizes smaller than about 1000A. Also, a comparison ofthermal behavior (Tg and ACp) for phase separated blends such as PAn/PMMAmay provide more insight into the thermal behavior of PAn/PVP blends.
There are many other techniques useful in the determination of polymermiscibility, as well as a logical area of parameter space that could be explored.For example, polymer miscibility is usually temperature dependent. In the caseof the hydrogen bonding interactions between PAn and PVP, heating the blendwould dissociate the hydrogen bonds, likely driving phase separation. Although
114

it has not been determined, a PAn/PVP blend likely has LCST (lower critical
solution temperature) phase behavior. The kinetics of phase separation are also
critical to the final morphology, as polymer mobility can determine the extent ofphase separation. High molecular weights and/or temperatures well below Tg
are two hindrances to polymer mobility, which can leave a blend in a non-
equilibrium morphological state.
These are but a few of the many possible directions that this work canlead.
115

REFERENCES
1. J.H. Burroughes and R.H. Friend in Conjugated Polymers, edited by J.L.Bredas and R. Silbey, (Kluwer Academic Publishers, The Netherlands1991), pp. 555-662.
2. J.R. Ellis in Handbook of Conducting Polymers, Vol. 1, edited by T.A.
Skotheim, (Marcel Dekker, Inc., New York 1986), pp. 489-505.
3. F. Kajzar and J. Messier in Conjugated Polymers, edited by J.L. Bredas and
R. Silbey, (Kluwer Academic Publishers, The Netherlands 1991), pp. 509-
554.
4. R.H. Baughman, L.W. Shacklette, R.L. Elsenbaumer, E. Plichta, and C.
Becht in Conjugated Polymer Materials: Opportunities in Electronics.
Optoelectronics and Molecular Electronics, edited by J.L. Bredas and R.R.
Chance, (Kluwer Academic Publishers, The Netherlands 1990), pp. 559-582.
5. M.G. Kanatzidis, Chem. and Eng. Newls, 68 (49), 36 (1990).
6. N. Oyama, T. Tatsuma, T. Sato, T. Sotomura, Nature, 373, 598 (1995).
7. T. Nakajima and T. Kawagoe, Synth. Met., 28, C629 (1989).
8. K.T. Tzou and R.V. Gregory, ACS Polymer Preprints, 35 (1), 245 (1994).
9. C.-H. Hsu, J.D. Cohen, and R.F. Tietz, Synth. Met., 59, 37 (1993).
10. D.C. Trivedi and S.K. Dhawan, Synth. Met., 59, 267 (1993).
11. Y. Yang and A.J. Heeger, Appl. Phys. Lett., 64 (10), 1245 (1994).
12. Y. Cao, G.M. Treacy, P. Smith, and A.J. Heeger, Appl. Phys. Lett., 60 (22),
2711 (1992).
13. G. Gustafsson, Y. Cao, G.M. Treacy, F. Klavetter, N. Colaneri, and A.J.
Heeger, Nature, 357, 477 (1992).
14. M.-N. Collomb-Dunand-Sauthier, S. Langlois, and E. Genies, J. Appl.
Electrochem., 24, 72 (1994).
15. B.P. Jelle and G. Hagen, J. Electrochem. Soc., 140 (12), 3560 (1993).
16. Daimler-Benz HighTechReport 3, 44 (1994).
17. T. Kobayashi, H. Yoneyama, and H. Tamura, J. Electroanal. Chem., 161, 419
(1984).
18. Y. Cao, N. Colaneri, P. Smith, and A.J. Heeger, ACS Polymer Preprints, 35
(1), 253 (1994).
116
19. V.G. Kulkami, W.R. Matthew, J.C. Campbell, C.J. Dinkins, and P.J.
Durbin, Proc. Soc. Plast. Eng., 665 (1991).
20. M. Angelopoulos and N. Patel, ACS PMSE Proc., 71, 222 (1994).
21. M. Angelopoulos, N. Patel, J.M. Shaw, N.C. Labianca, and S.A. Rishton, J.
Vac. Sci. Technol. B, 11 (6), 2794 (1993).
22. J.A. Conklin, S.C. Huang, and R.B. Kaner, ACS Polymer Preprints, 35 (1),
251 (1994).
23. D.A. Wrobleski, B.C. Benicewicz, K.G. Thompson, and C.J. Bryan, ACS
Polymer Preprints, 35 (1), 265 (1994).
24. H. Stubb, E. Punkka, and J. Paloheimo, Materials Science and Eng. Reports,
10 (3), (1993).
25. H. Naarman and N. Theophilou, Synth. Met., 22,1 (1987).
26. H. Shirakawa, E.J. Louis, A.G. MacDiarmid, C.K. Chiang, and A.J. Heeger,
J. Chem. Soc. Chem. Commun., 578 (1977).
27. W.J. Feast and R.H. Friend, J. Materials Sci., 25, 3796 (1990).
28. M.F. Rubner in Molecular Electronics, edited by G.J. Ashwell, (Research
Studies Press Ltd., England 1992), pp. 65-116.
29. W.-Y. Zheng and K. Levon, submitted for publication (1995).30. A.G. MacDiarmid, J.-C. Chiang, M. Halpern, W.S. Huang, S.L. Mu, N.L.D.
Somasiri, W. Wu, and S.I. Yaniger, Mol. Cryst. Liq. Cryst., 121, 173 (1985).
31. Y. Wei, G.-W. Jang, K. Hsueh, E.M. Scherr, A.G. MacDiarmid, and A.J.
Epstein, Polymer, 33 (2), 314 (1992).
32. P.M. McManus, R.J. Cushman, S.C. Yang, J. Phys. Chem., 91, 744 (1987).
33. A.G. MacDiarmid and A.J. Epstein, Faraday Discuss. Chem. Soc., 88, 317
(1989).
34. Y. Wang, Ph.D. Thesis, Massachusetts Institute of Technology, 1991.
35. K. Amano, H. Ishikawa, A Kobayashi, M. Satoh, and E. Hasegawa, Synth.
Met., 62, 229 (1994).
36. J. Yue, A.J. Epstein, and A.G. MacDiarmid, Mol. Cryst. Liq. Cryst., 189, 255
(1990).
37. J. Yue and A.J. Epstein, J. Amer. Chem. Soc., 112, 2800 (1990).
38. J. Yue, H.W. Zhao, K.R. Cromack, and A.J. Epstein, J. Amer. Chem. Soc.,
113, 2665 (1991).
39. D.W. Van Krevelen, Properties of Polymers, 2nd Ed., (Elsevier Scientific,The Netherlands 1976), p. 339.
117

40. E.J. Oh, Y. Min, J.M. Wiesinger, S.K. Manohar, E.M. Scherr, P.J. Prest, A.G.
MacDiarmid, and A.J. Epstein, Synthetic Metals, 55-57, 977 (1993).
41. C.Y. Yang, Y. Cao, P. Smith, and A.J. Heeger, ACS Polymer Preprints, 34
(1), 790 (1993).
42. Y. Cao and A.J. Heeger, Synth. Met., 52, 193 (1992).
43. Y. Cao, P. Smith, and A.J. Heeger, Synth. Met., 48, 91 (1992).
44. A. Andreatta and P. Smith, Synth. Met., 55, 1017 (1993).
45. Y. Min, A.G. MacDiarmid, and A.J. Epstein, ACS Polymer Preprints, 35 (1),
231 (1994).
46. Y.-G. Min, Y. Xia, A.G. MacDiarmid, and A.J. Epstein, Synthetic Metals, in
press (1994).
47. S.Y. Yang and E. Ruckenstein, Synth. Met., 59, 1 (1993).
48. E. Ruckenstein and S.Y. Yang, Synth. Met., 53, 283 (1993).
49. R.L. Elsenbaumer, U.S. Patent No. 4,983,322 (1991).
50. C.C. Han, R.L. Elsenbaumer, L.W. Shacklette, and G.G. Miller,
International Patent Application, No. WO 92/11644 (1992).51. D.C. Trivedi and S.K. Dhawan, Synth. Met., 58, 309 (1993).
52. Y.-H. Liao and K. Levon, ACS PMSE Proc., 69, 327 (1993).
53. B.D. Malhotra, S. Ghosh, and R. Chandra, J. Appl. Polym. Sci., 40, 1049
(1990).
54. Y. Kang, M.-H. Lee, and S.B. Rhee, Synth. Met., 52, 319 (1992).
55. L. Sun, S.C. Yang, and J.-M. Liu, ACS Polymer Preprints, 33 (2), 379 (1992).
56. K. Shannon and J.E. Fernandez, J. Chem. Soc., Chem. Commun., 5, 643
(1994).
57. W.B. Stockton and M.F. Rubner, Mat. Res. Soc. Symp. Proc., 328, 257 (1994).
58. W.B. Stockton and M.F. Rubner, ACS Polymer Preprints, 35 (1), 319 (1994).
59. M. Ferreira, J.H. Cheung, and M.F. Rubner, Thin Solid Films, 244, 806
(1994).
60. J.H. Cheung, A.C. Fou, M.F. Rubner, Thin Solid Films, 244, 985 (1994).
61. A.C. Fou, O. Onitsuka, M. Ferreira, and M.F. Rubner, submitted to Mat.
Res. Soc. Symp. Proc. , Fall MRS Meeting (1994).
62. A.C. Fou, O. Onitsuka, M. Ferreira, D. Howie, and M.F. Rubner, ACS
PMSE Proc., 72, 160 (1995).
63. M. Ferreira, M.F. Rubner, and B.R. Hsieh, Mat. Res. Soc. Symp. Proc., 328,
119 (1994).
118

64. A.C. Fou, D.L. Ellis, and M.F. Rubner, Mat. Res. Soc. Symp. Proc., 328, 113
(1994).
65. W.B. Stockton and M.F. Rubner, submitted to Mat. Res. Soc. Symp. Proc.,
Fall MRS Meeting (1994).
66. P.W. Atkins, Physical Chemistry, 2nd Ed., (W.H. Freeman and Co., SanFrancisco 1982), pp. 1014-1017.
67. T.A. Vilgis and G. Heinrich, Macromolecules, 27 (26), 7846 (1994).
68. G. Decher, J.D. Hong, and J. Schmitt, Thin Solid Films, 210/211, 831 (1992).
69. Y. Lvov, G. Decher, and H. Mohwald, Langmuir, 9, 481 (1993).
70. D.S. Yoo, unpublished results, MIT 1994.
71. Y. Lvov, G. Decher, and G. Sukhorukov, Macromolecules, 26 (20), 5396
(1993).
72. M. Li and J.B. Schlenoff, Anal. Chem., 66, 824 (1994).
73. E.R. Kleinfeld and G.S. Ferguson, Science, 265, 370 (1994).
74. J.-C. Chiang and A.G. MacDiarmid, Synth. Met., 13, 193 (1986).
75. C.-H. Hsu, P.M. Peacock, R.B. Flippen, S.K. Manohar, and A.G.
MacDiarmid, Synthetic Metals, 60, 233 (1993).
76. L.J. van der Pauw, Philips Res. Repts., 13, 1 (1958).
77. A. Alix, V. Lemoine, M. Nechtschein, J.P. Travers, and C. Menardo, Synth.
Met., 29, E457 (1989).
78. S.-A. Chen and H.-T. Lee, Synth. Met., 57, 1040 (1993).
79. J.H. Cheung, Ph.D. Thesis, Massachusetts Institute of Technology, 1993.80. M.M. Coleman, K.H. Lee, D.J. Skrovanek, and P.C. Painter, Macromolecules,
19, 2149 (1986).
81. M.M. Coleman, Y. Xu, and P.C. Painter, Macromolecules, 27, 127 (1994).
82. C. Le Menestrel, D.E. Bhagwagar, P.C. Painter, M.M. Coleman, and J.F.
Graf, Macromolecules, 25, 7101 (1992).
83. L. Jong, E.M. Pearce, T.K. Kwei, W.A. Hamilton, G.S. Smith, and G.H.
Kwei, Macromolecules, 25, 6770 (1992).
84. L. Jong, E.M. Pearce, T.K. Kwei, L.C. Dickinson, Macromolecules, 23, 5071
(1990).
85. Ph. Colomban, A. Gruger, A. Novak, and A. Regis, J. Molecular Structure,317, 261 (1994).
86. P. Gramain and P. Myard, J. Colloid and Interface Sci., 84 (1), 114 (1981).
87. M.A. Cohen Stuart and H. Tamai, Macromolecules, 21, 1863 (1988).
88. M.A. Cohen Stuart and H. Tamai, Langmuir, 4, 1184 (1988).
119

89. R.J. Good in Contact Angle. Wettabilitv. and Adhesion, edited by K.L.
Mittal (VSP, The Netherlands, 1993), pp.3 -3 6.
90. R.D. Hazlett in Contact Angle, Wettability. and Adhesion, edited by K.L.
Mittal (VSP, The Netherlands, 1993), pp.1 73 -1 81 .
91. D.S. Yoo and M.F. Rubner, Proc. ANTEC-Boston, 1995.
92. G.J. Kellogg, A.M. Mayes, W.B. Stockton, M. Ferreira, M.F. Rubner, and
S.K. Satija, Mat. Res. Soc. Symp. Proc., 351, 325 (1994).
93. T. Kawai, J. Umemura, and T. Takenaka, Langmuir, 5, 1378 (1989).
94. M. Vandevyver, A. Barraud, R.-Teixier, P. Maillard, and C. Gianotti, J.
Colloid and Interface Sci., 85 (2), 571 (1982).
95. P.-A. Chollet, Thin Solid Films, 52, 343 (1978).
96. D. den Engelsen, J. Phys. Chem., 76 (23), 3390 (1972).
97. A. Redondo, E.A. Ticianelli, and S. Gottesfeld, Mol. Cryst. Liq. Cryst., 160,
185 (1988).
98. C. Barbero and R. Kotz, J. Electrochem. Soc., 141(4), 859 (1994).
99. T. Iyoda, H. Toyoda, M. Fujitsuka, R. Nakahara, K. Honda, T. Shimidzu, S.
Tomita, Y. Hatano, F. Soeda, A. Ishitani, and H. Tsuchiya, Thin Solid Films,
205, 258 (1991).
100. M. Fujitsuka, R. Nakahara, T. Iyoda, T. Shimidzu, S. Tomita, Y. Hatano, F.
Soeda, A. Ishitani, H. Tsuchiya, and A. Ohtani, Synthetic Metals, 53, 1
(1992).
120

MITLibrariesDocument Services
Room 14-055177 Massachusetts AvenueCambridge, MA 02139Ph: 617.253.5668 Fax: 617.253.1690Email: [email protected]://libraries. mit. edu/docs
DISCLAIMER OF QUALITYDue to the condition of the original material, there are unavoidableflaws in this reproduction. We have made every effort possible toprovide you with the best copy available. If you are dissatisfied withthis product and find it unusable, please contact Document Services assoon as possible.
Thank you..
Some pages in the original document containpictures or graphics that will not scan or reproduce well.