signals from the shallows: in search of common patterns in long
TRANSCRIPT

60 (2008) 54–73www.elsevier.com/locate/seares
Journal of Sea Research
Signals from the shallows: In search of common patterns inlong-term trends in Dutch estuarine and coastal fish
Ingrid Tulp ⁎, Loes J. Bolle, Adriaan D. Rijnsdorp
Wageningen IMARES, Institute for Marine Resources and Ecosystem Studies, P.O. Box 68 IJmuiden, 1970 AB, The Netherlands
Received 7 March 2008; received in revised form 29 April 2008; accepted 29 April 2008
Available online 10 May 2008
Abstract
Shallow waters along the North Sea coast provide nursery areas for juveniles of commercially exploited species and naturalhabitat for resident species and seasonal visitors. The areas have gone through major changes in the last decades due to climatechange and human activities such as fishing and eutrophication and changes in abundance of apex predators. Using a long-termdataset we present trends from 1970 to 2006 in 34 fish species in three coastal areas in the Netherlands: the Dutch Wadden Sea, theWesterschelde and the Dutch coastal zone. The patterns varied widely among individual species as well as between the three areas.Total fish biomass showed a dome shape pattern with an increase from 1970 to 1985 and a subsequent decline until the early 2000s.Based on multivariate and time series analyses we explore possible correlations of fish density with a predefined set of threecategories of environmental variables: abiotic, biotic and fisheries related variables. Dynamic factor analysis (DFA) identified onecommon trend for every area: for the Wadden Sea and Westerschelde increasing from the 1970s to the early 1980s followed by asteep decrease until the mid 1990s, a temporary period (until 2002) of increase for the Wadden Sea, and a continuing increase forthe Westerschelde. The common trend in the Dutch coastal zone shows a similar increase but a time lag compared to the estuarineareas, while the distinct decline was absent here. The species that showed the strongest correlation with this common trend differedbetween the areas, and explains the difference between the common trend in the coastal zone with that in the estuarine areas.Common trends were best described by models containing variables from all categories of environmental variables (only maximum2 tested at a time).© 2008 Elsevier B.V. All rights reserved.
Keywords: Fish; Biomass; Wadden Sea; Dutch coast; Westerschelde; Time series analyses; Dynamic factor analysis
1. Introduction
Shallow coastal areas in the Netherlands such as theWadden Sea and Westerschelde have long beenregarded important nursery areas for the juveniles ofmany North Sea fishes (Zijlstra, 1976; Bergman et al.,
⁎ Corresponding author.E-mail address: [email protected] (I. Tulp).
1385-1101/$ - see front matter © 2008 Elsevier B.V. All rights reserved.doi:10.1016/j.seares.2008.04.004
1989; van Beek et al., 1989). Nurseries are areas wherejuveniles aggregate and where survival and growth areenhanced through better feeding conditions, refugeopportunities and high connectivity with other habitats.After they have reached a certain size or age, they leavethe nursery area and recruit to the (sub)adult populations(Pihl et al., 2002). Other species visit these shallow areasonly seasonally. In addition to marine juveniles andseasonal migrants there are also several resident species

Fig. 1. The three coastal areas in the Netherlands used in this study.
55I. Tulp et al. / Journal of Sea Research 60 (2008) 54–73
that inhabit the Wadden Sea and Westerschelde yearround. They entirely depend on the estuarine environ-ment in all life stages. Most non-resident species leavein autumn and migrate to the deeper waters of the NorthSea and return again in spring.
In addition to its natural dynamics, environmentalcharacteristics in the coastal areas have changedconsiderably in the past decades. Long-term data serieshave shown that water temperature has increased (vanAken, 2003), a phenomenon that has been observed atNorth Sea scale as well (Becker and Pauly, 1996).Nutrient loads showed a peak in the seventies of the lastcentury and decreased subsequently (Van Raaphorst andDe Jonge, 2004). Especially in shallow areas suchstrong changes in environmental factors are expected toimpact the ecosystem. Changes in primary production
and bivalve recruitment (Cadee and Hegeman, 2002;Philippart et al., 2003; Philippart et al., 2007) and achange in the composition of the benthic community hasbeen shown (Ens et al., 2004). Fish are in the middle ofthe food web, they feed on zooplankton and benthos andare eaten by predatory fish, birds and sea mammals.Depending on whether the abundance of fish iscontrolled top-down or bottom-up, they are likely torespond to changes in either food availability or predatorabundance.
On top of changes in environmental conditions, alsohuman activities such as shellfish fishing have impactedcoastal waters (Piersma et al., 2001; van Gils et al.,2006). Until 1990 the cockle Cerastoderma edulefisheries was not limited by quota, between 1990 and2003 it was more or less regulated and by 2005 it was

Table 1List of species for which trend data are presented and theirclassification in food groups and biogeographic guild
Species Scientific name Food Biogeographicguild
River lamprey Lampetra fluviatilis Parasitic BorealEel Anguilla anguilla Benthivore AtlanticTwaite shad Allosa fallax Planktivore LusitanianHerring Clupea harengus Planktivore BorealSprat Sprattus sprattus Planktivore LusitanianSmelt Osmerus eperlanus Planktivore BorealCod Gadus morhua Shrimp/fish BorealPoor cod Trisopterus minutus Benthivore LusitanianBib Trisopterus luscus Shrimp/fish LusitanianWhiting Merlangius
merlangusShrimp/fish Lusitanian
Five-beardedrockling
Ciliata mustela Shrimp/fish Boreal
Eelpout Zoarces viviparous Benthivore BorealPipefishes Syngnathus sp. Planktivore LusitanianTub gurnard Trigla lucerna Shrimp/fish LusitanianGrey gurnard Eutrigla gurnardus Shrimp/fish LusitanianBull rout Myoxocephalus
scorpiusShrimp/fish Boreal
Hooknose Agonus cataphractus Shrimp/fish BorealSea snail Liparis liparis Shrimp/fish BorealLumpfish Cyclopterus lumpus Jellyfish BorealSea bass Dicentrarchus labrax Shrimp/fish LusitanianLesser weever Echiichthys vipera Benthivore LusitanianButterfish Pholis gunnellus Benthivore BorealSandeel Ammodytes sp. Planktivore BorealGreater sandeel Hyperoplus
lanceolatusPlanktivore Boreal
Dragonet Callionymus lyra Benthivore LusitanianGobies Pomatoschistus sp. Shrimp/fish LusitanianTurbot Psetta maxima Benthivore LusitanianBrill Scophthalmus
rhombusBenthivore Lusitanian
Scaldfish Arnoglossus laterna Benthivore LusitanianDab Limanda limanda Benthivore BorealFlounder Platichthys flesus Benthivore LusitanianPlaice Pleuronectes platessa Benthivore BorealSole Solea solea Benthivore LusitanianSolenette Buglossidium luteum Benthivore Lusitanian
The classifications are derived from www.fishbase.nl for food typesand Yang (1982) for biogeographic guild.
56 I. Tulp et al. / Journal of Sea Research 60 (2008) 54–73
expelled from the Wadden Sea. Mussel fisheries takeplace on mussel cultivation lots in the Wadden Sea.Shrimp fisheries has traditionally been an importantfisheries in the Wadden Sea and adjacent coastal waters.Although brown shrimp Crangon crangon is the targetspecies of this fisheries, young fish are caught as welland discarded. Due to the fact that brown shrimp is anon-quota species, there is very little information on themagnitude and variations in shrimp fisheries. Theimpact of this type of fisheries on the ecosystem ispoorly known, but bycatch is substantial (van Marlenet al., 1998; Polet, 2003; Doeksen, 2006; Catchpoleet al., 2008). Offshore fisheries will also directly andindirectly impact the coastal fish assemblage throughthe offshore species that utilize coastal waters asnurseries or seasonal feeding areas (Zijlstra, 1976; vanBeek et al., 1989).
The above changes in physical (man-induced or not)and biological factors will likely result in changes in theabundance and species composition. Long-term trendsin the fish assemblage of the Wadden Sea, Wester-schelde and the shallow part of the Dutch coastal zone(Fig. 1) since 1970 are explored using data of theDemersal Fish Survey (DFS). By comparing trends inthe Wadden Sea and Westerschelde to those in theshallow part of the Dutch coast (Fig. 1) we attempt toidentify patterns among species and species groupssharing similar characteristics that could give rise to thehypotheses on the causes of observed trends. Theobjective of this contribution is twofold: (a) to presentlong-term trends in total fish densities together withtrends on individual fish species, (b) to explore the effectof environmental variables, food availability andpredator populations on patterns in changes in the fishcommunity using time series analyses.
2. Methods
2.1. Time series fish
The Dutch Demersal Fish Survey (DFS) is part of aninternational inshore survey carried out by the Nether-lands, England, Belgium and Germany (van Beek et al.,1989). The Dutch survey covers the coastal waters fromthe southern border of the Netherlands to Esbjerg,including the Wadden Sea, the outer part of the Eems-Dollard estuary, theWesterschelde and the Oosterschelde.This survey has been carried out in September–Octobersince 1970. For the purpose of this paper data from threedistinct areas were analysed: the Dutch Wadden Sea(including the outer part of the Eems-Dollard estuary), theDutch coastal zone and the Westerschelde (Fig. 1). Each
year ca 120, 65, and 40 hauls are taken in the three areas,respectively. Sampling effort has been constant over theyears, although in a few years not all sampling pointsweresampled due to adverse weather (e.g. 1976 Dutch coastalarea). For each haul, the position, date, time of day, depthand surface water temperature were recorded. TheWesterschelde and Wadden Sea are sampled with a 3 m-beam trawl, while along the Dutch coast a 6 m beam isused. The beam trawls were rigged with one tickler chain,a bobbin rope, and a fine-meshed cod-end (20 mm).Fishing is restricted to the tidal channels and gullies

57I. Tulp et al. / Journal of Sea Research 60 (2008) 54–73
deeper than 2 m because of the draught of the researchvessel. The combination of low fishing speed (2–3 knots)and fine mesh size results in selection of mainly thesmaller species and younger year classes. Samplelocations are stratified by depth. Fish are sorted andmeasured to the cm below. The mean abundance per areawas calculated for 34 species in the period 1970–2006weighed by surface area for each depth stratum. Specieswere classified according to food types: planktivore,shrimp/fish-eating, benthivore and parasitic; and biogeo-graphical guilds: Lusitanian (preferring warm water),boreal (preferring coldwater) andAtlantic (Table 1). Onlyspecies caught in at least one third of all years wereanalysed. This means that the selection of species maydiffer slightly between the three areas.
2.2. Time series abiotic variables and data on food,predators and fisheries
We used several time series of explanatory variablescomprising abiotic variables, biotic variables and vari-ables related to fisheries. Naturally any choice ofparameters is arbitrary and partly driven by the availability
Table 2Abiotic and biotic parameters used in the time series analyses in the three d
Explanatory variable Wadden Sea
AbioticTemperature (°C) DFSSalinity (Texel: practical salinity
scale of 1978, other areas:‰)NIOZ: Texel, 't Horntje
River runoff (m3/s) www.waterbase.nl: Kornwerderzan
Total phosphate (mg/l) www.waterbase.nl: Marsdiep
Total nitrate (mg/l) www.waterbase.nl: Marsdiep
BioticPiscivorous fish North Sea coast
(kg/ha)SNS: gadoidsN20 cm, within30 m depth
Cormorants (n or n breeding pairs) SOVON non-breeding birdsseals (n) IMARES common and grey seals
Brown shrimp densities (kg/ha) DFS: Wadden Sea
Fishing pressureBrown shrimp effort (see text) ICES WGCRAN: total Dutch
landings corrected for brownshrimp densities
Cockle landings (million kg meat) Ministry LNV: Wadden SeaBeam trawl effort North Sea (hp days) Rijnsdorp et al., 2008
⁎ North of Terschelling and off Goeree mean for September; ⁎⁎ HansweeTerneuzen boei 20.
of the data. That is also the reasonwhywe sometimes useddifferent datasets for different areas (Table 2). In thisexploratory phase we focused on variables potentiallyimpacting fish densities directly, but did not considerindicators of water quality such as pollutants. We didinclude nutrients given the recent discussions on the effectof these on the carrying capacity of the marine system,even though we are aware that nutritional links betweennutrients and fish are still not well understood and onlypartly proven (Philippart et al., 2007; Kuipers and vanNoort, 2008). So besides the direct links in the food web,be it as predator or prey, we included the NAO winterindex, temperature, river runoff, salinity, total phosphateand nitrate.
2.2.1. Abiotic seriesThe NAO winter index (December–March) was
taken from the Internet http://www.cpc.ncep.noaa.gov/products/precip/CWlink/pna/nao_index.html. Duringthe DFS sea surface temperature is recorded at haullevel. For theWadden Sea we used salinity data collectedby NIOZ on Texel, for the other areas, series were takenfrom www.waterbase.nl (mean for September/October).
ifferent areas
Dutch coastal area Westerschelde
DFS DFSwww.waterbase.nl:average 2 stations⁎
www.waterbase.nl:average 2 stations⁎⁎
d www.waterbase.nl: IJmuiden www.waterbase.nl:Schaar van ouden Doel
www.waterbase.nl: Noordwijk www.waterbase.nl:average 2 stations⁎⁎⁎
www.waterbase.nl: Noordwijk www.waterbase.nl:average 2 stations⁎⁎⁎
SNS: gadoidsN20 cm within30 m depth
SNS: gadoidsN20 cm within30 m depth
Breeding birds (M. Leopold pers.) SOVON non-breeding birdsIMARES common and grey seals DELTARES: common and
grey sealsDFS: Dutch coast DFS: Westerschelde
ICES WGCRAN: total Dutchlandings corrected for brownshrimp densities
ICES WGCRAN: total Dutchlandings corrected for brownshrimp densities
Ministry LNV: North Sea coast Ministry LNV: WesterscheldeRijnsdorp et al., 2008 Rijnsdorp et al., 2008
rt geul and Vlissingen boei SSVH; ⁎⁎⁎ Vlissingen boei SSVH and

58 I. Tulp et al. / Journal of Sea Research 60 (2008) 54–73
River runoff was also taken from the same source andwas measured at all major outflows, and we used theannual mean of the series at Kornwerderzand for theWadden Sea, at IJmuiden for the North Sea coast and atthe Schaar van Ouden Doel for theWesterschelde. Theserunoff series are all highly correlated. Total phosphateand nitrate was taken from www.waterbase.nl (annualmeans). Missing values were interpolated based oncorrelations between local values and concentrations inthe Rhine discharge (Van Raaphorst and De Jonge,2004).
Mean temperature during the survey period hasincreased in all three areas, but stronger in the WaddenSea and Westerschelde than along the Dutch coast(Fig. 2). Besides a slow increase in salinity along theDutch coast, no long-term trend seems apparent insalinity in the other areas. River runoff has shown greatannual fluctuations and an increase in all three areas, butsteepest in the Wadden Sea. Total phosphate showed amaximum in the period 1975–1985, and declinedsubsequently. Nitrate showed a similar pattern in theWesterschelde and Dutch coastal zone, while concen-trations in the Wadden Sea concentrations were morestable after an initial decline.
2.2.2. Biotic seriesFor biotic series we used data on predators and prey.
The most common (non-fish) predators are cormorantPhalacrocorax carbo, common Phoca vitulina andgrey seals Halichoerus grypus. For cormorants in theWadden Sea we used number of non-breeding birds,because these numbers are usually larger than thebreeding numbers and the period corresponds betterwith the fish sampling period. For the Dutch coastalzone only breeding numbers were available andcompiled from different sources (M. Leopold pers.comm.). Seals are counted several times per year byairplane and total populations are estimated (monitoringprogram IMARES). Because of their larger numbers theharbour porpoise Phocoena phocoena has probablybeen a more important fish predator in recent times thanseals in the Dutch coastal zone. However, the time serieshas the same signal as that for seals with a steep increasefrom the early 1990s onwards (Camphuysen, 2005) andtherefore we used seal time series for all three areas. As ameasure of predation pressure by fish we have includedgadoid densities (in kg/ha within the 30 m depthcontour, between 52°N and 55°30′N and east of 3°Efrom the Sole Net Survey (SNS) survey) as explanatoryvariables for the three areas. Gadoids are piscivorousalready from lengths of 4 cm onwards (Bromley et al.,1997), but since they generally eat prey about 4 times
smaller than their own size we used a lower size limit of20 cm (Daan, 1973). In the Wadden Sea the number ofnon-fish predators has shown a steep increase since1980 (Fig. 2). Populations of both common and greyseals have increased, although grey seals only appearedin 1979 for the first time in this period. Althoughcommon seals still outnumber grey seals, by 2006 theratio common to grey seals has decreased to 2:1. In theWesterschelde the numbers have shown a similar increasealthough total numbers are an order of magnitude lower.For the Dutch coast no separate line is presented as theseals from both Wadden Sea and Westerschelde visit theNorth Sea to feed and the Dutch coast does not providehaul out sites. Cormorants increased both in the WaddenSea and Westerschelde, but stabilized recently. Thedensities of piscivorous fish in the North Sea hasshown variable densities over the years, with an overalldecrease from the early 1990s onwards.
Fish feed on zooplankton, buried benthic andepibenthic prey. The only food source for whichinformation is available (for all areas and the full timeseries) is brown shrimp abundance. However the role ofbrown shrimp is complicated as brown shrimp can alsopredate on juvenile fish (van der Veer and Bergman,1987; Amara and Paul, 2003). No time series on otherbenthic prey or zooplankton are available for the studyperiod and study area. Brown shrimp densities areoverall highest in the Wadden Sea and show strongannual variation and a long-term decline in theWesterschelde but no clear trend in the Wadden Sea orDutch coastal zone (Fig. 2).
2.3. Fishing pressure
The most important fisheries within the three areasinclude brown shrimp fisheries and shellfish fisheries(Verver et al., 2005). These fisheries are likely to havethe biggest impact on small fish, because of the bycatch,bottom disturbance and removal of possible prey.Because no detailed information on fishing pressureper area is available, we estimated brown shrimp trawleffort by dividing total shrimp landings in the Nether-lands by mean brown shrimp densities in the autumnDFS survey. Cockle fisheries pressure was estimated asthe cockle landings per area. Fishing effort in theoffshore waters bordering our study area was estimatedfrom the Dutch beam trawl effort which dominates thefishing effort in this area (Jennings and Cotter, 1999).Brown shrimp trawl effort has been constant throughoutthe 1970s and 1980s but has shown a steep increasesince the early nineties. Cockle fishing started in theWadden Sea in the mid 1980s and lasted until 2005,

Fig. 2. Time series of (a)biotic factors. See Table 2 for further explanation.
59I. Tulp et al. / Journal of Sea Research 60 (2008) 54–73

Fig. 3. Time series of total biomass (left, kg/ha) and total density (right, n/ha) of fish in the three sub-areas. The dots indicate the mean densities (n/ha)per year. The black line is the smoothed mean number as estimated by Trendspotter. The thin black lines indicate the upper and lower limits of the95% confidence interval.
60 I. Tulp et al. / Journal of Sea Research 60 (2008) 54–73
after which mechanical dredging was prohibited, buthand raking is still permitted on a smaller scale.Currently there is still a cockle fisheries in theWesterschelde, but not as large as the Wadden Seafisheries used to be. Beam trawl effort increased untilthe mid 1990s where after it showed a steep decrease.
2.4. Data analysis
Species that were observed in less than 1/3 of theyears were omitted from any of the analyses. The reasonwhy we did not put a stronger constraint is to includenewcomers among species that may provide valuableinformation. After adding 0.01 to zero observations datawere log-transformed to stabilise the variance. This termwas very close to the lowest densities in the dataset.Occasionally measured values fall below this line, but forreasons of consistency we used the same transformationof log(x+0.01) for all species and areas. In the graphs thesame scale was used per species for all areas to facilitatecomparison among areas.
Time series were analysed for the individual speciestrends in the three different areas separately. First, timeseries of individual species were analysed using
Trendspotter, a program that is based on structuraltime series analysis (Harvey, 1989) in combination withthe Kalman filter. The program identifies periods withsignificant increases or decreases from annual fluctua-tions, by estimating smoothed population numbers for atime series with N equidistant measurements over time.Trendspotter also estimates the standard deviations ofthe smoothed population numbers. Finally, it estimatesthe standard deviations of the differences betweenconsecutive timepoints. The estimation of confidenceintervals is based on the deviations of time point valuesfrom the smoothed line. A more detailed description ofthe method can be found in Visser (2004) and Soldaatet al. (2007). The advantage is that this method takesaccount of serial correlation and provides confidencelimits that enable to test changes in abundance.
Second, dynamic factor analysis (DFA) was used toestimate underlying common patterns within each of thethree regions (Harvey, 1989; Zuur et al., 2003; Zuuret al., 2007). DFA is a multivariate extension ofstructural time series analysis. The 34 time series weremodeled as a function of a linear combination ofcommon trends, an intercept, one or more explanatoryvariables and noise (Zuur et al., 2007). DFA can indicate
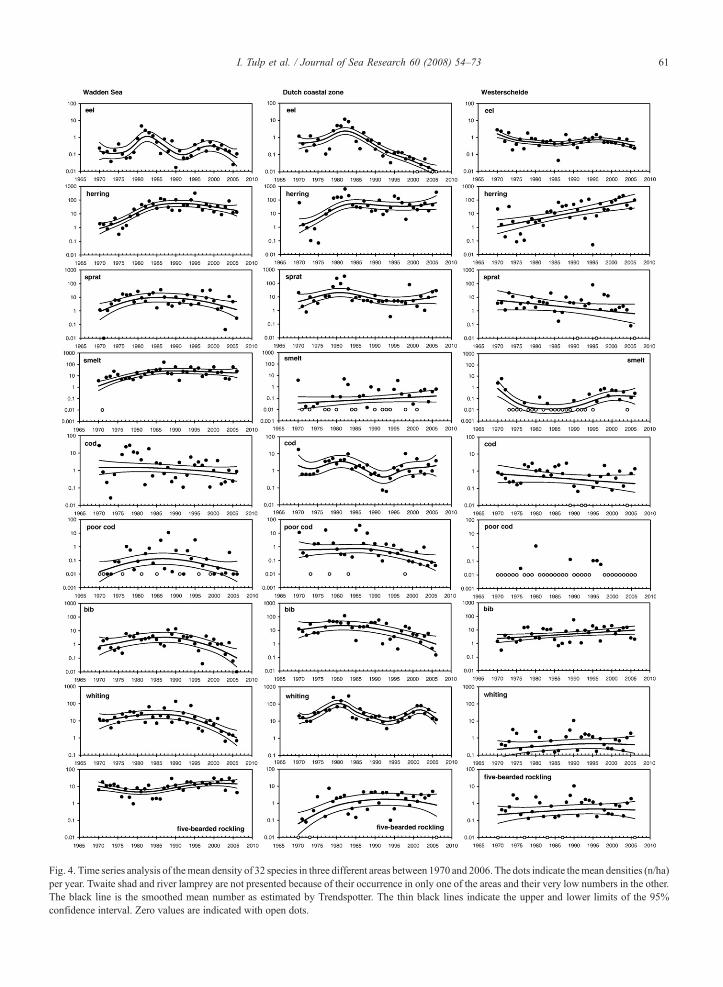
Fig. 4. Time series analysis of themean density of 32 species in three different areas between 1970 and 2006. The dots indicate themean densities (n/ha)per year. Twaite shad and river lamprey are not presented because of their occurrence in only one of the areas and their very low numbers in the other.The black line is the smoothed mean number as estimated by Trendspotter. The thin black lines indicate the upper and lower limits of the 95%confidence interval. Zero values are indicated with open dots.
61I. Tulp et al. / Journal of Sea Research 60 (2008) 54–73

Fig. 4 (continued ).
62 I. Tulp et al. / Journal of Sea Research 60 (2008) 54–73
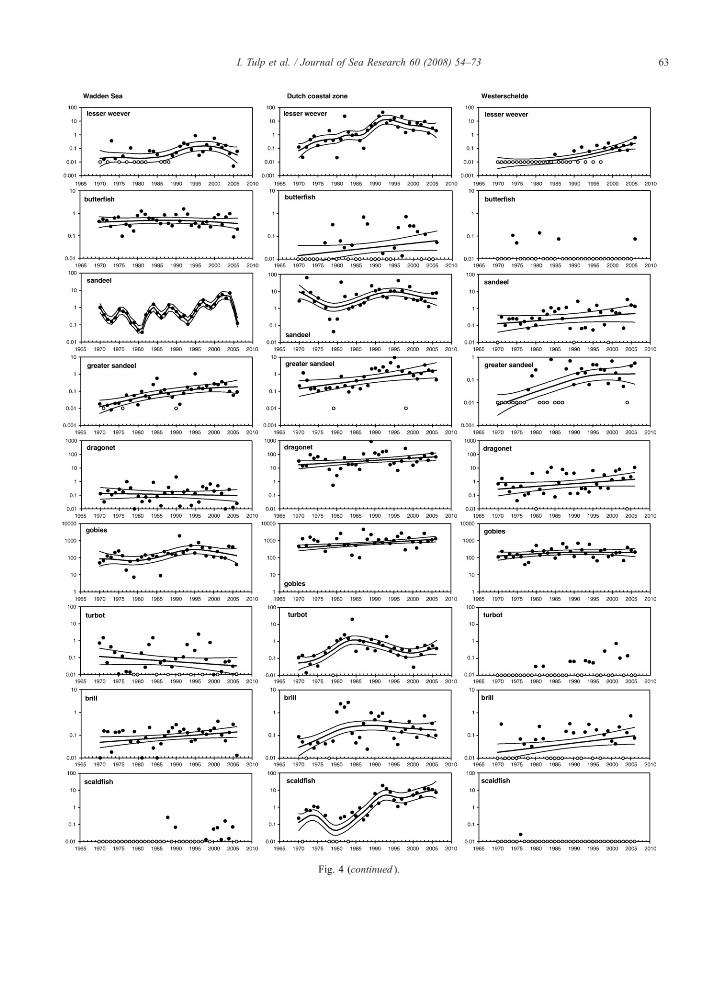
Fig. 4 (continued ).
63I. Tulp et al. / Journal of Sea Research 60 (2008) 54–73

Fig. 4 (continued ).
64 I. Tulp et al. / Journal of Sea Research 60 (2008) 54–73
whether there are any underlying common patterns indifferent time series, whether there are interactionsbetween the response variables, and identify the effectsof explanatory variables. The aim of DFA is to set thenumber of common trends as small as possible but stillhave a reasonable model fit. The magnitude and sign ofthe factor loadings determine how these trends arerelated to the original time series.
One problem with this analysis is that we model fishdensity as a function of biotic variables. This approachassumes that the number of fish is a function of theexplanatory variables used. But for some of the explanatoryvariables, i.e. number of seals, the relationship might alsobe reversed, that the number of seals is a function of fishdensities. This endogeneity is of course a difficult problemand we cannot assume that it does not occur in this set.
Only DFA models with a symmetric, non-diagonalerror covariance matrix could be used, fitted for 1 and 2common trends and with no, 1 or 2 explanatory variables(with 12 possible explanatory variables this results in 92models to be tested for every number of common trendsand area). Analyses were performed on log-transformed
and standardized time series. Explanatory variables werestandardized if they contained large values (in order toarrive at interpretable regression estimates). Modelselection was based on Akaike's information criterion(AIC). Canonical correlations are presented to illustratecorrelations between common trends and original series.Model validation was carried out by comparing the timetrends of the individual species with the original data.Results were obtained with the software packageBrodgar (http://www.brodgar.com).
In summary, in DFA, the trends are the commonsignal in the 34 time series that are not related to theexplanatory variables. The common trend can beinterpreted as a partial, common effect. The trendscalculated by Trendspotter are real trends that capturethe pattern of the data, without taking the effect ofexplanatory variables into account.
Data exploration indicated strong collinearity (corre-lation of N0.80) between the variables cormorants andseals, cormorants and phosphate, and phosphate andnitrate in the Dutch coastal zone, between seals andcormorants, and cormorants and phosphate in the

Table 3Summary of trends in 34 species in the Wadden Sea, Dutch coastal zone and Westerschelde
Years with significant increases are indicated with a dark grey panel, years with significant decreases with a light grey panel, years without significant changes with no shading. Species that do not (orvery rarely) occur in the area (but do occur in the other two coastal areas) are indicated with –. Lusitanian species are printed bold.
65I.Tulp
etal.
/Journal
ofSea
Research
60(2008)
54–73

Table 4Selection of five best models for the common trend in the three areas
Area Numbermodel
Model AIC
Wadden Sea 1 Seals+beam trawl effort 2874.922 Runoff+beam trawl effort 2892.733 Seals+runoff 2924.664 Brown shrimp+beam trawl effort 2930.255 Beam trawl effort+nitrate 2932.04
Dutch coastalzone
1 Brown shrimp+runoff 2638.792 Seals+cockle landings 2667.403 Temp+seals 2678.394 Runoff+phosphate 2698.375 Shrimp effort+phosphate 2702.13
Westerschelde 1 Beam trawl effort+phosphate 2683.602 Cormorants+beam trawl effort 2695.613 Seals+salinity 2710.194 Cormorants+phosphate 2710.855 Cormorants+seals 2717.53
All models included one common trend only.
Fig. 5. Common trends as results of DFA analyses in the three areas.
66 I. Tulp et al. / Journal of Sea Research 60 (2008) 54–73
Wadden Sea and between seals and phosphate, phos-phate and nitrate, and seals and beam trawl effort in theWesterschelde. Because of the almost similar pattern inthe seal and cormorant population for Wadden Sea andDutch coastal zone and the fact that the cormorant serieshad one missing value, we excluded cormorants fromthe analyses for these areas. The choice to exclude anyother variables would be very arbitrary. Instead weincluded all variables in the analyses to see which onesresulted in the best model, keeping the collinearity inmind and not selecting models that contained twocollinear variables.
3. Results
3.1. Trends total fish numbers and biomass
Mean total fish biomass per haul shows a dome-shapedpattern in all three areas with an increase from 1970 to1985 and a subsequent fivefold decline (Fig. 3). Howeverthis dome shape seems most pronounced in the WaddenSea. The decline in the Westerschelde sets in a few yearslater and the decline levels off since 2000. For theWaddenSea and the Westerschelde the pattern in densities reflectsthe same patterns as found in total biomass. Along theDutch coast there is no clear trend in densities. Overall theWesterschelde has the lowest densities of these three areas.
3.2. Individual species trends
Absolute densities of many species differ up to oneorder of magnitude between areas (Fig. 4, plaice,flounder, gobies, dragonet). Some species are only
common in the Wadden Sea (e.g. bull rout, butter fish)or common along the Dutch coast but rare in theWadden Sea and Westerschelde (dragonet, scaldfish,solenette). Individual species show great variation intrends (Fig. 4). Some species show different trends inthe three sub-areas (e.g. plaice, sea snail). Trends andconfidence limits calculated by Trendspotter are highlyinfluenced by zero catches (taken as log(0.01) values inthe analyses). Species that have colonized the Dutchcoastal waters recently include sea bass, lesser weeverand greater sandeel (Westerschelde).
Species that show significant recent declines (since1985) in the Wadden Sea include eel, eelpout, bib,whiting, hooknose, dab and plaice (Table 3), whileperiods with significant increases occurred in five-bearded rockling, pipefishes, tub gurnard, sea bass,greater sandeel and brill. In general the periods withdecreases occurred later than the periods of increases.Along the Dutch coast eight species (twaite shad,pipefishes, tub gurnard, sea bass, sandeel, greatersandeel, dragonet and gobies) show recent extensiveperiods of significant increase and seven (eel, poor cod,bib, hooknose, lumpfish, dab and sole) with periods ofsignificant decrease (Table 3). In the Westerscheldeherring, bib, eelpout, sea bass, lesser weever, greatersandeel, turbot, brill and plaice show long continuousperiods of significant increase, while grey gurnard,hooknose, sea snail and dab show recent significantdecreases (Table 3).
3.3. Common trends
The best DFA fit for all three areas was obtained forone common trend (smallest AIC). For every area thefive best models are presented (Table 4). The maincommon trend for the Wadden Sea and Westerscheldeshows an increase from the mid 1970s to the early 1980sfollowed by a steep decrease in the late 1980s, with a

67I. Tulp et al. / Journal of Sea Research 60 (2008) 54–73
second much smaller peak in the Wadden Sea around2000 and a subsequent decline (Fig. 5). The pattern forthe Dutch coastal zone is different in that the increasestarted years later, followed by a moderate decline in themid 1990s and stabilization in the recent decade (Fig. 5).
Fig. 6. Canonical correlations (= correlation between trends and original ser
The environmental variables involved in the best fivemodels for the Wadden Sea included seals, beam trawleffort, runoff, brown shrimp densities and total nitrate.The model with the best fit included seals and beamtrawl effort (Table 4). For the Dutch coastal zone the
ies) of every species with the DFA common trend for the three areas.

Table 5Estimated regression parameters, standard errors (se) and t-values forthe explanatory variables for the best model in each of the three areas
Wadden Sea
Species Seals Beam trawl effort
Estimate se t-value Estimate se t-value
River lamprey 0.61 0.12 4.85 0.32 0.12 2.54Eel −0.09 0.18 −0.48 −0.16 0.17 −0.96Twaite shad −0.01 0.17 −0.07 −0.11 0.17 −0.64Herring 0.26 0.14 1.78 0.43 0.14 3.17Sprat −0.20 0.15 −1.37 0.36 0.15 2.45Smelt 0.25 0.14 1.85 0.50 0.13 3.73Cod −0.17 0.16 −1.05 −0.14 0.16 −0.88Poor cod −0.22 0.15 −1.50 0.33 0.15 2.22Bib −0.50 0.14 −3.57 0.14 0.14 0.99Whiting −0.66 0.12 −5.69 0.19 0.12 1.615-beardedrockling
0.40 0.15 2.67 0.27 0.15 1.84
Eelpout −0.55 0.16 −3.49 −0.21 0.14 −1.47Pipefishes 0.38 0.14 2.76 0.40 0.14 2.98Red gurnard 0.26 0.16 1.63 0.13 0.16 0.81Grey gurnard −0.22 0.16 −1.37 −0.15 0.16 −0.93Bull rout −0.15 0.18 −0.81 −0.12 0.17 −0.69Hooknose −0.49 0.13 −3.74 0.35 0.13 2.72Sea snail −0.29 0.16 −1.76 −0.12 0.16 −0.78Lumpfish −0.25 0.16 −1.56 0.16 0.15 1.04Lesser weever 0.33 0.14 2.34 0.55 0.14 4.00Butterfish −0.15 0.17 −0.91 −0.01 0.16 −0.05Sandeel 0.56 0.13 4.23 0.27 0.13 2.06Greater sandeel 0.54 0.12 4.51 0.44 0.12 3.81Dragonet −0.09 0.16 −0.59 0.30 0.16 1.88Turbot −0.22 0.16 −1.35 −0.04 0.16 −0.23Gobies 0.19 0.15 1.32 0.53 0.15 3.62Brill 0.18 0.16 1.14 0.36 0.15 2.34Dab −0.87 0.08 −10.84 0.01 0.08 0.17Flounder 0.30 0.16 1.90 0.30 0.15 1.94Plaice −0.34 0.15 −2.31 0.25 0.14 1.77Sole −0.09 0.16 −0.54 −0.61 0.15 −4.05
Dutch coastal zone
Species Brown shrimp density Runoff
Estimate se t-value Estimate se t-value
Eel 0.37 0.13 2.96 −0.09 0.13 −0.70Flounder 0.33 0.15 2.28 0.23 0.15 1.54Butterfish 0.11 0.15 0.69 0.24 0.15 1.57Poor cod 0.04 0.16 0.27 −0.06 0.17 −0.39Solenette 0.07 0.13 0.54 −0.07 0.13 −0.52Grey gurnard −0.20 0.15 −1.34 0.14 0.15 0.93Brill 0.40 0.14 2.87 0.10 0.14 0.74Gobies 0.35 0.13 2.63 −0.45 0.14 −3.30Herring 0.32 0.13 2.38 0.28 0.14 2.09Hooknose 0.03 0.16 0.17 −0.22 0.16 −1.40Cod −0.08 0.16 −0.48 0.18 0.16 1.13Lesser weever 0.07 0.13 0.51 0.09 0.14 0.65Dragonet −0.05 0.14 −0.35 −0.35 0.14 −2.39Eelpout 0.46 0.14 3.35 −0.02 0.14 −0.18Red gurnard 0.31 0.14 2.29 −0.13 0.14 −0.93Dab 0.25 0.16 1.55 0.03 0.16 0.20
Table 5 (continued)
Wadden Sea
Species Seals Beam trawl effort
Estimate se t-value Estimate se t-value
Plaice 0.49 0.14 3.46 −0.22 0.14 −1.53Scaldfish −0.10 0.12 −0.80 −0.20 0.13 −1.53Sea snail 0.19 0.15 1.28 0.33 0.15 2.19Greater sandeel 0.24 0.13 1.85 −0.20 0.14 −1.45Smelt 0.39 0.15 2.69 −0.25 0.15 −1.71Sprat 0.23 0.15 1.53 0.29 0.15 1.93Bib −0.01 0.16 −0.07 0.10 0.16 0.60Turbot 0.25 0.15 1.61 0.06 0.16 0.38Sole 0.40 0.14 2.86 −0.16 0.14 −1.135-beardedrockling
0.22 0.14 1.63 0.36 0.14 2.63
Whiting 0.07 0.14 0.46 0.41 0.15 2.84Sandeel 0.09 0.14 0.68 −0.49 0.14 −3.55Bull rout 0.24 0.13 1.88 0.02 0.13 0.12Pipefishes 0.40 0.13 3.09 0.33 0.13 2.52Sea bass 0.12 0.15 0.79 0.15 0.15 0.97
Westerschelde
Species Beam trawl effort Total phosphate
Estimate se t-value Estimate se t-value
Eel −0.09 0.17 −0.55 −0.06 0.16 −0.36Herring −0.03 0.15 −0.17 −0.47 0.15 −3.24Sprat 0.22 0.16 1.40 0.33 0.16 2.11Smelt −0.42 0.13 −3.26 −0.60 0.13 −4.66Cod −0.25 0.16 −1.64 0.30 0.15 1.97Bib 0.21 0.16 1.30 −0.06 0.16 −0.37Whiting 0.22 0.15 1.48 0.49 0.15 3.335-beardedrockling
0.27 0.16 1.64 −0.07 0.16 −0.41
Eelpout −0.20 0.16 −1.27 −0.35 0.16 −2.25Pipefishes −0.17 0.17 −1.02 0.05 0.16 0.28Tub gurnard −0.19 0.16 −1.21 0.32 0.15 2.08Grey gurnard −0.28 0.14 −1.98 0.40 0.14 2.94Bull rout 0.04 0.17 0.24 −0.09 0.16 −0.54Hooknose −0.08 0.14 −0.57 0.53 0.14 3.76Sea snail −0.11 0.12 −0.93 0.65 0.12 5.47Sea bass −0.02 0.11 −0.22 −0.77 0.10 −7.44Lesser weever −0.19 0.13 −1.54 −0.71 0.12 −5.95Sandeel −0.03 0.17 −0.16 −0.04 0.16 −0.26Greater sandeel 0.24 0.14 1.74 −0.43 0.14 −3.14Dragonet 0.07 0.16 0.41 −0.22 0.16 −1.36Gobies 0.12 0.17 0.73 −0.10 0.17 −0.63Brill −0.12 0.16 −0.76 −0.29 0.16 −1.80Dab 0.36 0.13 2.75 0.65 0.13 5.07Flounder −0.08 0.17 −0.45 0.08 0.17 0.48Plaice 0.09 0.16 0.54 −0.32 0.16 −2.03Sole −0.36 0.16 −2.28 0.13 0.15 0.84
Significant parameters are in bold.
Table 5 (continued )
Dutch coastal zone
Species Brown shrimp density Runoff
Estimate se t-value Estimate se t-value
68 I. Tulp et al. / Journal of Sea Research 60 (2008) 54–73
69I. Tulp et al. / Journal of Sea Research 60 (2008) 54–73
variables in the five best models were brown shrimpdensity, runoff, seals, cockle landings, temperature,phosphate and shrimp effort with the best modelincluding brown shrimp density and runoff. Thecommon trend for the Westerschelde was best explainedby models including beam trawl effort, phosphate,cormorants, beam trawl effort, seals and salinity. Thebest model included beam trawl effort and phosphate.
In the Wadden Sea, river lamprey, sprat, smelt, bullrout, butterfish, greater sandeel, gobies and plaice showstrong positive correlations (N0.4) with the commontrend (Fig. 6), while no species show strong negativecorrelations. The remaining species are moderately orpoorly correlated to the common trend. The Dutch coastalzone shows strong positive correlations with the commontrend for tub gurnard, bull rout, lesser weever, greatersandeel, scaldfish and solenette and strong negativecorrelations for eel and grey gurnard. All other speciesshowmoderate or poor correlationwith the common trend(Fig. 6). In the Westerschelde, bull rout, sandeel and soleare the only three species strongly positively correlated tothe common trend, while none show strong negativecorrelations (Fig. 6). The remaining species have weakercorrelations. Overall the strongest correlationswere foundfor Wadden Sea and the Dutch coastal zone while in theWesterschelde the correlations with the common trendwere less strong.
The estimated regression parameters for the expla-natory variables in the best models are given in Table 5for every area. Significant t-values indicate strongrelationships with the explanatory variables. For theWadden Sea, river lamprey, bib, whiting, five-beardedrockling, eelpout, pipefishes, hooknose, lesser weever,greater sandeel, sandeel, dab and plaice had relativelylarge t-values for the first explanatory variable (seals),of which river lamprey, five-bearded rockling, pipe-fishes, lesser weever, sandeel and greater sandeelincreased with the number of seals and the other speciesdecreased. River lamprey, herring, sprat, smelt, poorcod, pipefishes, hooknose, lesser weever, sandeel,greater sandeel, gobies, brill and sole had relativelylarge t-values for the second explanatory variable (beamtrawl effort). Of these the coefficients were all positiveexcept for sole. Regression parameters for fish in theDutch coastal zone were significant and positive for thefirst explanatory variable (brown shrimp density) foreel, flounder, brill, gobies, herring, eelpout, red gurnard,plaice, smelt, sole and pipefishes indicating an increasein densities with brown shrimp density. Herring, seasnail, five-bearded rockling, whiting and pipefishesshowed significant, positive estimates for the regressioncoefficients of the second explanatory variable (runoff).
For gobies, dragonet and sandeel these regressioncoefficients were negative. The regression parametersfor fish in the Westerschelde showed significant correla-tions with the first explanatory variable (beam trawleffort) for smelt, dab and sole. These were negative forsmelt and sole, pointing at decreasing densities withincreasing beam trawl effort. Significant negative coeffi-cients for the second variable (total phosphate) werefound for herring, smelt, eelpout, sea bass, lesser weever,greater sandeel and plaice. Sprat, whiting, tub gurnard,grey gurnard, hooknose, sea snail and dab showedincreases with total phosphate.
4. Discussion
4.1. Observed patterns
Although the trend analyses for individual speciesshowed large variation, there are several large scalepatterns that emerge from these 37 year time series.Firstly total fish densities expressed both in numbersand biomass have decreased strongly from the mid-1980s after an initial increase between 1970 and 1980.This dome-shaped pattern was apparent in all three areas(Fig. 3). The DFA allowed to investigate the commonsignal in the series of 34 species densities, aftercorrection for the two most dominant explanatoryvariables. Densities showed similar common trends forthe two estuarine areas. The common trend for theDutch coastal zone showed a time lag compared to theWadden Sea and Westerschelde. The canonical correla-tions (Fig. 6) indicate which species contribute most tothe common trend and although the common trend wassimilar for Westerschelde and Wadden Sea, the speciescontributing most to this trend differed. For the Dutchcoastal zone mainly the recently increasing species assolenette, scaldfish and lesser weever contributed to thecommon trend (Fig. 6). This explains why the commontrend differs from that in the estuarine areas, where allthese species are less predominant.
Apart from differences in absolute densities the samespecies sometimes showed different trends in the threeareas (e.g. bib, pipefishes, sandeel, plaice). Of theseplaice is the only species that shows significant oppositetrends (decrease in Wadden Sea and increase inWesterschelde, stable in Dutch coastal zone). The trendsin the Wadden Sea and the coastal zone are consistentwith the offshore movement of juvenile plaice (vanKeeken et al., 2007). Species that showed a decreasingtrend in all three areas were hooknose and dab, althoughthe rate of decrease differed. Lesser weever and greatersandeel increased in all areas. The number of species

70 I. Tulp et al. / Journal of Sea Research 60 (2008) 54–73
showing recent declines was highest in the Wadden Seaand in the Dutch coastal zone (Table 3). The Dutchcoastal zone is characterized by a number of specieswith recent strong increases, part of which can beattributed to relatively new species colonizing the areasuch as lesser weever and sea bass. Solenette andscaldfish show sudden increases since the late 1980s,but inhabited the coastal waters from the start of theseries in low densities. They are completely absent fromthe estuarine areas because they avoid low-salinitywaters (Amara et al., 2004). The recent increases hasbeen assumed to be related to the increase in seawatertemperature, however Amara et al. (2004) showed thatsmall scale solenette distribution was not influenced bytemperature. Species that are practically absent from theWesterschelde but are relatively common in the othertwo areas include poor cod, butterfish and turbot.
4.2. Possible causes of observed patterns
The interpretation of the variables that explained asignificant part of the variation in the time trends of theindividual species in the DFA is complicated by thecollinearity between the variables. In the interpretation,a significant effect of a variable may reflect the role ofanother collinear variable. For example, for the WaddenSea there was strong collinearity between seals andcormorants, and between cormorants and phosphate.Therefore we must keep in mind that any effect foundmight be explained by one of these variables, or evensome other variable not incorporated but related to all ofthese. Other problems with variables used is that shortterm variation can be large and is not captured in overallmeans. Also variables that may be relevant such asturbidity (Bolle et al., 2001) and other food groups suchas zooplankton and benthos were not available andcould not be included. Furthermore the analyses do notgive an explanation for patterns observed, they merelyindicate correlative relations.
Temperature was significant in explaining part of thevariations in the time trends among individual species inthe Dutch coastal zone but not in the Wadden Sea orWesterschelde, while the NAO winter index was notsignificant in any of the five best DFA models. Recentlya large volume of publications has attributed changes infish densities and distributions to climate change andrise of sea water temperature (Roessig et al., 2004; Rose,2005; Harley et al., 2006; Portner and Knust, 2007). Letus first look if we find indications that species with awarm water preference (Lusitanian) show differenttrends from species with a cold water preference(boreal) (Table 1). Recent (since 1985) increases (in
any of the three areas) were observed more often inLusitanian (11; 65%) than in boreal species (7; 47%).Recent declines occurred in 5 Lusitanian (29%) and 8boreal (53%) species (based on the fact that the seriesconsist of 16 boreal and 18 Lusitanian species). Thissuggests that Lusitanian species show a strongerresponse than boreal species. The decline in eelpout inthe Wadden Sea observed since 1985 corroborates thedecline in the coastal waters in Germany that was causedby the increase in temperature above the thermalmaximum of the species (Portner and Knust, 2007).
Another option is to explore if patterns can be detectedin species with different food preferences. As before, wescored the number of species of each food group thatshowed recent in- or decreases in any of the areas(combination of Tables 1 and 3): 0% of planktivoresshowed a recent decrease, while 57% increased, equalnumbers (45%) of shrimp/fisheaters in- and decreased and43% of benthivores decreased while 57% increased(based on 7 planktivores, 11 shrimp/fisheaters and 14benthivores). In conclusion the recent significant in- anddecreases seem to have occurred in all food groups, butrelatively more planktivores and benthivores showedincreases than the other groups. It should be notedhowever that the majority of Lusitanian species is alsobenthivore.
Naturally food and temperature preferences are onlytwo of the possible variables that might explaindifferences in trends between areas and species. Alter-native possibilities can be sought in functional guilds(whether species inhabit the area permanently or only partof the year (Elliott and Dewailly, 1995)), age-groups,thermal tolerance (range of their distribution), longevityof species, whether or not the species is commerciallyexploited and whether or not it concerns species withstrong preferences for bottom structures such as musselbeds. Separate DFA analyses on any of these speciessubgroups may come up with different common trendsand allow better interpretations of observed patterns.
The fact that a similar dome-shaped pattern occurredin the two intertidal areas would suggest similarmechanisms. Also on individual species level, thereare more species declining in the Wadden Sea andWesterschelde than in the Dutch coastal zone. Explana-tions can be sought in factors related to bottom-upprocesses (food), top-down processes (predation, fish-ing) or changes in habitat suitability. In all three areas,DFA showed a significant contribution of variablesrelated to bottom-up (phosphate, run off) and top-downprocesses (fishing effort, seals).
The significant effect of river run off, phosphate andnitrate in the DFA may reflect the effect of eutrophication

71I. Tulp et al. / Journal of Sea Research 60 (2008) 54–73
of the coastal waters. In the 1960s and 1970s,eutrophication has likely resulted in an increase inprimary and secondary production (Beukema andCadee, 1988; Colijn et al., 2002) and may explain theobserved increase in fish biomass (Fig. 3). Also thegrowth rate of plaice is positively related to eutrophica-tion (Rijnsdorp and van Leeuwen, 1996; Teal et al.,2008). It is still debated whether the recent decrease innutrients resulted in a decrease in the productivity of thecoastal waters (Cadee and Hegeman, 2002; Philippartet al., 2007). However, Kuipers and van Noort (2008)recently showed that shortly after 2000 the persistentlyhigh primary production under low P-discharge of theRhine seem to have come to an end, with a time lag ofmore than 10 years.
Because fish are ectoterms, food intake (and alsogrowth) is temperature sensitive (Fonds and Saksena,1978). This complicates the discussion whetherobserved changes relates to decreased carrying capacityor increased temperature. To understand the interplaybetween these, we need temperature sensitivity ofgrowth for each species and information on foodconditions to evaluate whether they are able to fill inthis growth potential (e.g. Teal et al., 2008). Not onlymay the fish themselves be temperature sensitive, butalso potential predators and prey. Crustaceans (brownshrimp and crab) have higher temperature sensitivityand tolerance range than their predators and theirbivalve prey (Freitas et al., 2007). Since mortality of0-group plaice over the season is mainly attributed topredation by brown shrimp (van der Veer and Bergman,1987; Amara and Paul, 2003), an increase in tempera-ture could potentially lead to overall higher predationpressure by crustaceans with negative impacts onflatfish and bivalve recruitment (Freitas et al., 2007).
The significant effect of fishing effort (beam trawl,shrimping) may reflect the impact of fishing on the sizestructure and species composition of the North Sea fishassemblage (Daan et al. 2005). Due to the fisheriesremoval of larger predatory fish, both the abundance ofsmall fish and small sized fish species has increasedover the last 30 years. As several species inhabiting thecoastal waters spent part of their life in offshore areaswhere they are directly or indirectly exposed to fisheries,the changes in the fish assemblage in offshore watersmay affect the coastal fish assemblage as well. It isstriking that shrimping effort did not show anysignificant relation to the time series analysis. Shellfishfisheries did not significantly affect the time seriesanalysis in the Wadden Sea or Westerschelde, althoughit did in the Dutch coastal zone. These fisheries willpossibly influence the fish assemblage by removal of
benthic prey for fish and by the influence on benthichabitats (Piersma et al., 2001; Hiddink, 2003; Kraanet al., 2007).
The increase in fish predators over time (notablyseals and cormorants) coincides with the recent decreasein total fish densities, but whether this correlationreflects a causal relationship is not clear at all.Cormorants are known to feed on juvenile flatfish inthe Wadden Sea (Leopold et al., 1998) and seals feed ona variety of fish species (Brasseur et al., 2004). Morequantitative information on predation mortality andselectivity of fish predators is needed to get more insightin the nature of the correlation.
The current analyses provides a first attempt todescribe the major changes in the fish community inintertidal and coastal areas in the Netherlands and identifypossible causal processes. At this stage the causes forthese changes only remain speculative. Our study showedthat no single or simple set of environmental variables canbe found to explain the observed patterns. It is likely thatmore detailed analyses are needed that are focused onspecific hypotheses and the interaction of the mainenvironmental drivers (increase in temperature, decreasein nutrients and the effects of fishing).
Acknowledgements
Data on predators were obtained from Kees Koffij-berg (SOVON, cormorants), Peter Reijnders (seals), andBas van de Boogaard (seal data Westerschelde). We aregrateful to Niels Daan and Henk Heessen for discus-sions on the approach. Jenny Cremer prepared Fig. 1.Over the years Marcel de Vries, Gerrit Rink, PeterGroot, Simon Rijs and many other field assistantscarefully carried out the monitoring activities duringwhich the data for this paper were collected. This studywas funded through the FP6 project RECLAIM(Contract no. 044133—FISH REG/A3(2006)D/14751)and the program BSIK Klimaat en Ruimte: “Climate-related shifts in the NCP ecosystem, and consequencesfor future spatial planning”. We thank two anonymousreferees and Alain Zuur for critical comments on anearlier version of this manuscript.
References
Amara, R., Paul, C., 2003. Seasonal patterns in the fish and epibenthiccrustaceans community of an intertidal zone with particularreference to the population dynamics of plaice and brown shrimp.Estuarine Coastal and Shelf Science 56, 807–818.
Amara, R., Mahe, K., LePape, O., Desroy, N., 2004. Growth, feedingand distribution of the solenette Buglossidium luteum withparticular reference to its habitat preference. Journal of SeaResearch 51, 211–217.

72 I. Tulp et al. / Journal of Sea Research 60 (2008) 54–73
Becker, G.A., Pauly, M., 1996. Sea surface temperature changes in theNorth Sea and their causes. Ices Journal of Marine Science 53,887–898.
Bergman, M.J.N., Van der Veer, H.W., Stam, A., Zuidema, J.J., 1989.Transport mechanisms of larval plaice (Pleuronectes platessa L.)from the coastal zone into the Wadden Sea nursery area. Rapportset Procès-verbaux des Réunions du Conseil international pourl'Exploration de la Mer 191, 43–49.
Beukema, J.J., Cadee, G.C., 1988. Zoobenthos responses toeutrophication of the Dutch Wadden Sea. Ophelia 26, 55–64.
Bolle, L.J., Rijnsdorp, A.D., van der Veer, H.W., 2001. Recruitmentvariability in dab (Limanda limanda) in the southeastern NorthSea. Journal of Sea Research 45, 255–270.
Brasseur, S.M.J.M., Tulp, I., Reijnders, P.J.H., Smit, C.J., Dijkman,E.M.,Cremer, J., Kotterman, M.J.J., Meesters, H.W.G., 2004. Voedselec-ologie van de gewone en grijze zeehond in de nederlandsekustwateren. Alterra.
Bromley, P.J., Watson, T., Hislop, J.R.G., 1997. Diel feeding patternsand the development of food webs in pelagic 0-group cod (Gadusmorhua L.), haddock (Melanogrammus aeglefinus L.), whiting(Merlangius merlangus L.), saithe (Pollachius virens L.), andNorway pout (Trisopterus esmarkii Nilsson) in the northern NorthSea. Ices Journal of Marine Science 54, 846–853.
Cadee, G.C., Hegeman, J., 2002. Phytoplankton in the Marsdiep at theend of the 20th century; 30 years monitoring biomass, primaryproduction, and Phaeocystis blooms. Journal of Sea Research 48,97–110.
Camphuysen, C.J., 2005. The Return of the Harbour Porpoise(Phocoena phocoena) in Dutch Coastal Waters. Lutra, p. 48.
Catchpole, T.L., Revill, A.S., Innes, J., Pascoe, S., 2008. Evaluatingthe efficacy of technical measures: a case study of selection devicelegislation in the UK Crangon crangon (brown shrimp) fishery.Ices Journal of Marine Science 65, 267–275.
Colijn, F., Hesse, K.J., Ladwig, N., Tillmann, U., 2002. Effects of thelarge-scale uncontrolled fertilisation process along the continentalcoastal North Sea. Hydrobiologia 484, 133–148.
Daan, N., 1973. A quantitative analysis of the food intake of North Seacod,Gadusmorhua. Netherlands Journal of Sea Research 6, 479–517.
Daan, N., Gislason, H., Pope, J.G., Rice, J.C., 2005. Changes in theNorth Sea fish community: evidence of indirect effects of fishing?Ices Journal of Marine Science 62, 177–188.
Doeksen, A., 2006. Ecological perspectives of the north Sea C. Crangonfishery. An Inventory of its Effects on theMarine Ecosystem,NaturalResources Management. Wageningen university, Wageningen.
Elliott, M., Dewailly, F., 1995. The structure and components ofEuropean estuarine fish assemblages. Netherlands Journal ofaquatic ecology 29, 397–417.
Ens, B.J., Smaal, A.C., de Vlas, J., 2004. The Effect of ShellfishFishery on the Ecosystems of the Dutch Wadden Sea andOosterschelde. Alterra/RIVO/RIKZ, Wageningen.
Fonds, M., Saksena, V.P., 1978. The influence of temperature on thedaily food intake of young soles. In: Dankers, N., Wolff, W.J.,Wolff, J.J.Z. (Eds.), Fishes and Fisheries of the Wadden Sea.Balkema Press,, Rotterdam, pp. 132–138.
Freitas, V., Campos, J., Fonds, M., Van der Veer, H.W., 2007. Potentialimpact of temperature change on epibenthic predator–bivalve preyinteractions in temperate estuaries. Journal of Thermal Biology 32,328–340.
Harley, C.D.G., Hughes, A.R., Hultgren, K.M., Miner, B.G., Sorte,C.J.B., Thornber, C.S., Rodriguez, L.F., Tomanek, L., Williams,S.L., 2006. The impacts of climate change in coastal marinesystems. Ecology Letters 9, 228–241.
Harvey, A.C., 1989. Forecasting, Structural Time Series Models andthe Kalman Filter. Cambridge University Press, Cambridge.
Hiddink, J.G., 2003. Effects of suction-dredging for cockles on non-targetfauna in the Wadden Sea. Journal of Sea Research 50, 315–323.
Jennings, S., Cotter, A.J.R., 1999. Fishing effects in northeast Atlanticshelf seas: patterns in fishing effort, diversity and communitystructure. I. Introduction. Fisheries Research 40, 103–106.
Kraan, C., Piersma, T., Dekinga, A., Koolhaas, A., van der Meer, J.,2007. Dredging for edible cockles (Cerastoderma edule) onintertidal flats: short-term consequences of fisher patch-choicedecisions for target and non-target benthic fauna. Ices Journal ofMarine Science 64, 1735–1742.
Kuipers, B.R., van Noort, G.J., 2008. Towards a natural Wadden Sea?Journal of Sea Research. doi:10.1016/j.seares.2008.04.002.
Leopold, M.F., van Damme, C.J.G., van der Veer, H.W., 1998. Diet ofcormorants and the impact of cormorant predation on juvenileflatfish in the Dutch Wadden Sea. Journal of Sea Research 40,93–107.
Philippart, C.J.M., Van Aken, H., Beukema, J.J., Bos, O.G., Cadee,G.C., Dekker, R., 2003. Climate-related changes in recruitmentof the bivalve Macoma balthica. Limnology and Oceanography48, 2171–2185.
Philippart, C.J.M., Beukema, J.J., Cadeé, G.C., Dekker, R., Goedhart,P.W., van Iperen, J.M., Leopold, M.F., Herman, P.M.J., 2007.Impacts of nutrient reduction on coastal communities. Ecosystems10.1007/s10021-006-9006-7.
Piersma, T., Koolhaas, A., Dekinga, A., Beukema, J.J., Dekker, R.,Essink, K., 2001. Long-term indirect effects of mechanical cockle-dredging on intertidal bivalve stocks in the Wadden Sea. Journal ofApplied Ecology 38, 976–990.
Pihl, L., Cattrijsse, A., Codling, I., Mathieson, S., McLusky, D.S.,Roberts, C., 2002. Habitat use by fishes in estuaries and otherbrackish areas. In: Elliott, M., Hemingway, K.L. (Eds.), Fishes inEstuaries. Blackwell Science, Oxford, pp. 10–53.
Polet, H., 2003. Evaluation of Bycatch in the Belgian Brown Shrimp(Crangon crangon L.) Fishery and of Technical Means to ReduceDiscarding. University of Gent, Gent.
Portner, H.O., Knust, R., 2007. Climate change affects marine fishesthrough the oxygen limitation of thermal tolerance. Science 315,95–97.
Rijnsdorp, A.D., van Leeuwen, P.I., 1996. Changes in growth of North Seaplaice since 1950 in relation to density, eutrophication, beam-trawleffort, and temperature. Ices Journal ofMarineScience 53, 1199–1213.
Rijnsdorp, A.D., Poos, J.J., Quirijns, F.J., Hille Ris Lambers, R., DeWilde, J.W., Den Heijer, W.M., 2008. The arms race between fishers.Journal of Sea Research. doi:10.1016/j.seares.2008.1003.1003.
Roessig, J.M., Woodley, C.M., Cech, J.J., Hansen, L.J., 2004. Effectsof global climate change on marine and estuarine fishes andfisheries. Reviews in Fish Biology and Fisheries 14, 251–275.
Rose, G.A., 2005. On distributional responses of North Atlantic fish toclimate change. Ices Journal of Marine Science 62, 1360–1374.
Soldaat, L., Visser, H., van Roomen, M., Van Strien, A., 2007.Smoothing and trend detection in waterbird monitoring data usingstructural time-series analysis and the Kalman filter. Journal ofOrnithology 148, 351–357.
Teal, L.R., De Leeuw, J.J., Rijnsdorp, A.D., 2008. Effects of climatechange on growth of 0-group sole and plaice. Marine EcologyProgress Series 357. doi:10.3354/meps07367.
van Aken, H.M., 2003. 140 years of daily observations in a tidal inlet(Marsdiep). ICES Marine Science Symposia 219, 359–361.
van Beek, F.A., Rijnsdorp, A.D., de Clerck, R., 1989. Monitoringjuvenile stocks of flatfish in the Wadden Sea and the coastal areas

73I. Tulp et al. / Journal of Sea Research 60 (2008) 54–73
of the southeastern North Sea. Helgolandes Meeresuntersuchun-gen 43, 461–477.
van der Veer, H.W., Bergman, M.J.N., 1987. Predation by crustaceanson a newly settled 0-group Plaice Pleuronectes platessa populationin the western Wadden Sea. Marine Ecology Progress Series 35,203–215.
van Gils, J.A., Piersma, T., Dekinga, A., Spaans, B., Kraan, C., 2006.Shellfish dredging pushes a flexible avian top predator out of amarine protected area. Plos Biology 4, 2399–2404.
van Keeken, O.A., van Hoppe, M., Grift, R.E., Rijnsdorp, A.D., 2007.Changes in the spatial distribution of North Sea plaice (Pleuronectesplatessa) and implications for fisheries management. Journal of SeaResearch 57, 187–197.
van Marlen, B., Redant, F., Polet, H., Radcliffe, C., Revill, A.S.,Kristensen, P.S., Hansen, K.E., 1998. Research into CrangonFisheries Unerring Effect (RESCUE)-EU study 94/044, RIVOReport.
Van Raaphorst, W., De Jonge, V.N., 2004. Reconstruction of the totalN and P inputs from the IJsselmeer into the Western Wadden Seabetween 1935–1998. Journal of Sea Research 51, 109–131.
Verver, S., van Willigen, J.A., Bult, T.P., 2005. Verkennendebeschrijving van de kleinschalige Nederlandse kustvisserij,RIVO report.
Visser, H., 2004. Estimation and detection of flexible trends.Atmospheric Environment 38, 4135–4145.
Yang, J., 1982. The dominant fish fauna in the North Sea and itsdetermination. Journal of Fish Biology 20, 635–643.
Zijlstra, J.J., 1976. Vissen, Waddenzee. natuurgebied van Nederland.Duitsland en Denemarken. Landelijke vereniging tot behoud vande waddenzee en vereniging tot behoud van Natuurmnumenten innederland, pp. 133–141.
Zuur, A.F., Fryer, R.J., Jolliffe, I.T., Dekker, R., Beukema, J.J., 2003.Estimating common trends in multivariate time series usingdynamic factor analysis. Environmetrics 14, 665–685.
Zuur, A.F., Ieno, E.N., Smith, G.M., 2007. Analysing Ecological Data.Springer, New York.