signaling specificity in the filamentous growth …
TRANSCRIPT

SIGNALING SPECIFICITY IN THE FILAMENTOUS GROWTH PATHWAY OF
SACCHAROMYCES CEREVISIAE
by
CLAIRE THERESA ROMELFANGER
A DISSERTATION
Presented to the Department of Biology
and the Graduate School of the University of Oregon in partial fulfillment of the requirements
for the degree of Doctor of Philosophy
March 2011

ii
DISSERTATION APPROVAL PAGE Student: Claire Theresa Romelfanger Title: Signaling Specificity in the Filamentous Growth Pathway of Saccharomyces cerevisiae This dissertation has been accepted and approved in partial fulfillment of the requirements for the Doctor of Philosophy degree in the Department of Biology by: Karen Guillemin Chairperson George F. Sprague Jr. Advisor Tom Stevens Member Tory Herman Member Diane Hawley Outside Member and Richard Linton Vice President for Research and Graduate Studies/Dean of
the Graduate School Original approval signatures are on file with the University of Oregon Graduate School. Degree awarded March 2011

iii
© 2011 Claire Theresa Romelfanger

iv
DISSERTATION ABSTRACT Claire Theresa Romelfanger Doctor of Philosophy Department of Biology March 2011 Title: Signaling Specificity in the Filamentous Growth Pathway of Saccharomyces
cerevisiae Approved: _______________________________________________
George F. Sprague Jr.
Cells convey information through signaling pathways. Distinct signaling
pathways often rely on similar mechanisms and may even use the same molecules. With
a variety of signals conveyed by pathways that share components, how does the cell
maintain the integrity of each pathway?
Budding yeast provides an example of multiple signaling pathways utilizing the
same components to transduce different signals. The mating pathway, the high
osmolarity glycerol (HOG) pathway and the filamentous growth (FG) pathway each
respond to different environmental conditions and generate unique cellular responses.
Despite the individuality of the pathways, they each contain a core group of the same
signaling proteins. How does the cell generate a variety or responses utilizing the same
group of proteins? Both the mating and HOG pathways utilize scaffolding factors that
concentrate pathway components to the location of activation and in the case of the
mating pathway alter the kinetics of the interaction. In addition, negative regulatory
mechanisms operate in both the mating and HOG pathways. These negative regulatory
mechanisms are understood in detail for the mating pathway but not for the HOG
pathway. Mechanisms for providing specificity for the FG pathway are as yet unknown.
The purpose of this work is to elucidate the mechanisms that provide specificity
to the FG pathway. The search for specificity factors was done through both a random
mutagenesis screen and a synthetic genetic array screen, looking for mutants in which
activation of the FG pathway led to inappropriate activation of the HOG pathway. The

v
random mutagenesis screen resulted in a large number of mutants that I organized into
five complementation groups. The identity of the gene mutated in the largest
complementation group was sought using a variety of methods including
complementation with the yeast deletion collection and whole genome sequencing. A
synthetic genetic array was screened as an alternative method to identify genes necessary
for FG pathway specificity. These experiments have resulted in a list of candidate genes,
but thus far have not yet led to any discernable mechanism for maintenance of FG
pathway specificity.
vi
CURRICULUM VITAE NAME OF AUTHOR: Claire Theresa Romelfanger
GRADUATE AND UNDERGRADUATE SCHOOLS ATTENDED: University of Oregon, Eugene University of California San Diego DEGREES AWARDED: Doctor of Philosophy, Biology, 2011, University of Oregon Bachelor of Science, Biology, 2004, University of California San Diego AREAS OF SPECIAL INTEREST: Genetics Molecular Biology PROFESSIONAL EXPERIENCE:
Undergraduate Research Assistant, Dr. Roel Nusse, Stanford University, Summer 2002
Undergraduate Researcher, Dr. Manny Ares Undergraduate Lab, University of
California Santa Cruz, Summer 2003 Graduate Teaching Fellow, Department of Biology, University of Oregon, 2004-
2005, 2010-2011 Graduate Research Fellow, Institute of Molecular Biology, University of Oregon
2005-2007, 2010

vii
GRANTS, AWARDS, AND HONORS:
American Heart Association Pre-Doctoral Fellow, University of Oregon, 2007-2009
PUBLICATIONS: Srinivasan K, Shiue L, Hayes JD, Centers R, Fitzwater S, Loewen R, Edmondson LR, Bryant J, Smith M, Rommelfanger C, Welch V, Clark TA, Sugnet CW, Howe KJ, Mandel-Gutfreund Y, Ares M Jr., Detection and measurement of alternative splicing using splicing-sensitive microarrays. Methods, 2005 37(4): p345-59.
Marino S, Romelfanger C, Yokota Y, Nusse R, Wnt1 is epistatic to Id2 in inducing mammary hyperplasia, ductal side-branching, and tumors in the mouse. BMC Cancer, 2004 4: p91.

viii
ACKNOWLEDGMENTS
I want to thank George giving me the opportunity to take on an interesting topic
and for always being the optimist in believing that something would eventually work. I
also want to thank the Stevens Lab, particularly Tom for including me as an adopted
member of the lab and Emily, Glen and Greg for many helpful discussions, both
scientific and not. Charles, I do not know how to thank you enough for everything.
Fellow grad students, Jared, Jen, Bryan, Jana, Jamie and Emily, the best friends I could
have hoped to be lucky enough to meet at any time of my life. I count myself as lucky to
have spent so many years growing and learning together.
I would like to thank my parents for gently pushing me to always live up to what
they knew I was capable of accomplishing. Andy you are the best cheerleader I could
ever hope for.
I would also like to thank the American Heart Association for providing funding for this project.

ix
This manuscript is dedicated to my family, those that are, those to be, and those who remain in my heart.

x
TABLE OF CONTENTS
Chapter Page I. AN INTRODUCTION TO SIGNALING PATHWAYS AND SPECIFICITY
MECHANISMS IN YEAST ................................................................................... 1
Introduction to Yeast MAPK Signaling Pathways ................................................ 1
Specificity Mechanisms for MAPK Pathways in Yeast ........................................ 5 II. RANDOM MUTAGENESIS SCREEN FOR SPECIFICITY FACTORS............. 10
Random Mutagenesis Screen................................................................................. 11
Phenotypic Assessment.......................................................................................... 13
Genetic Assessment ............................................................................................... 17
Complementation Tests ......................................................................................... 19
III. STL1-HIS3 SYNTHETIC GENETIC ARRAY ..................................................... 26
APPENDIX: MATERIALS AND METHODS........................................................... 29
REFERENCES CITED................................................................................................ 38

xi
LIST OF FIGURES Figure Page 1. Proteins in solid black are found in common between multiple pathways. Proteins specific to individual pathways are shown in white ................................ 6 2. A-β galactosidase assay of the STL1-lacZ reporter. The addition of osmolyte to the media activates the reporter resulting in an increase in β galactosidase activity. B-STL1-HIS3 is a growth based reporter. Addition of osmolyte to the medium activates the reporter and generates histidine, allowing for growth on medium lacking histidine....................................................................................... 12 3. A-Invasive growth assay of randomly generated mutants. Mutants that have lost the ability to invade agar fail to leave a scar on the plate as seen in the boxed
section. B-Percent of mutants that activate the STL1-HIS3 reporter enough to grow on various levels of 3-aminotroazole. The majority of mutants are able to grow on 20mM 3-aminotriazole. C-Morphology of various mutants. There are three categories of mutants, those with both phenotypes, elongation and unipolar budding, those that only elongate and finally those with neither .............................. 16
4. A-The presence of a specificity factor prevents the signal from leaking to the HOG pathway. B-Mutation of the specificity factor prevents it from functioning and allows the signal to leak over to the HOG pathway, activating the HOG response. C-Constitutive mutants in the HOG pathway activate the HOG
response without input from the FG pathway........................................................ 18 5. A-Colonies of matings between mutants using the ROTOR robot. The boxes show growing colonies. Mutants strains marked with stars all belong to the same complementation group, group 1. B-Similar results are shown by spot test. C-List of mutants belonging to each complementation group ...................... 20 6. A-List of candidate genes from complementation with the deletion collection. B-Spot test of nrg1Δ strains on SLAG-HIS+15mM 3AT, SD-HIS and Permissive medium (YEPD). C-Alignment of NRG1 sequence at position 210 showing no change in the mutant in relation to the Sigma reference strain (wildtype)............................................................................................................... 24

xii
LIST OF TABLES
Table Page 1. List of Candidate Genes from Genome Sequencing and Alignment.........................33 2. List of Candidates from STL1-HIS3 SGA .................................................................34 3. Yeast Strains ..............................................................................................................35
4. Plasmids .....................................................................................................................37
1
CHAPTER I
AN INTRODUCTION TO SIGNALING PATHWAYS AND SPECIFICITY
MECHANISMS IN YEAST
Mitogen Activated Protein Kinase (MAPK) pathways are found in a wide variety
of eukaryotic organisms where they control responses to numerous physiological signals
and developmental cues. The yeast Saccharomyces cerevisiae has five MAPK pathways
that individually control the mating response, the response to hyperosmolarity (HOG),
aspects of the response to nutrient deprivation (FG), cell wall integrity (CWI) and spore
wall assembly. Each of these pathways responds to unique environmental stimuli and
generates a unique response. In wild type cells the signal in each pathway is insulated
from other pathways; activation of one pathway does not lead to cross-activation of other
pathways.
Introduction to Yeast MAPK Signaling Pathways
The mating pathway, the most thoroughly studied of all yeast MAPK pathways,
controls mating by haploid cells. Haploid yeast cells can reproduce vegetatively,
replicating their chromosomes and budding off new daughter cells (hence budding yeast)
when nutrients are abundant. However, they can also undergo cell fusion to generate a
diploid cell. This mating process involves two distinct haploid cell types, called a and
alpha (α), each of which produces a secreted peptide pheromone and expresses a cell
surface receptor for the cognate pheromone. Binding of pheromone to receptor creates a
transmembrane signal that activates a trimeric G protein. Activation of the trimeric G

2
protein requires exchange of GDP for GTP in the α subunit and dissociation of the βγ
subunits from the complex [1]. This dissociation initiates the signaling cascade
comprised of a series of kinases and a number of other pathway components. The
kinases in the mating pathway are Ste20, Ste11, Ste7 and Fus3 [2]. Cofactors that play a
role in the pathway are Cdc42, Ste50, Ste5 and Dig1/2 [2]. These kinases and other
proteins function together to activate transcription factors and other pathway targets
thereby changing the transcriptional profile, the localization of proteins and the status of
the cell cycle. Activation of the mating MAPK pathway through its extracellular receptor
ensures that the mating responsive genes are only activated under appropriate conditions
for mating.
The HOG pathway functions to maintain the turgor pressure in the cell under
conditions of hyperosmotic stress. The yeast cell needs to maintain solute concentrations
internally to match the extracellular environment. To do so, the HOG pathway senses the
external environment and initiates the production of glycerol to balance the internal
solute concentration with the external solute concentration. This pathway is activated by
a branched MAPK system. There are two different activating receptors and kinase
cascades that coalesce at Pbs2, the MAPKK of the HOG pathway, the Sln/Ssk branch and
the Sho1/Msb2 branch. The Sln/Ssk branch of the pathway is not pertinent to this work
and will not be discussed further. The Sho1/Msb2 branch of the HOG pathway is integral
to this work and will be touched upon throughout this dissertation. The Sho1/Msb2
branch of the HOG pathway contains a number of components similar to the mating
pathway and the filamentous growth pathway. As with the mating pathway there is a
central core kinase cascade consisting of Ste20, Ste11, Pbs2 and Hog1 [2]. The receptors

3
that activate this core cascade are Sho1, Msb2 and Hkr1 [3]. The mechanism by which
the HOG pathway is activated by these receptors is not known at present. Activation of
the kinase cascade results in the activation of a number of transcription factors,
particularly Hot1, which activate genes involved in glycerol production and cell cycle
regulation [4]. Regulation of internal glycerol concentration by the HOG pathway allows
the cell to adjust its internal osmotic content in relation to the external osmotic
environment.
The filamentous growth (FG) pathway enables yeast to respond to nutrient
limitation (glucose and nitrogen deprivation) and alter their growth from vegetative to a
filamentous style [5] [6]. Activation of the filamentous growth pathway changes the
budding pattern and cell shape of yeast. Under nutrient limiting conditions yeast cells
elongate (change from round to more rod shaped) and switch from axial to unipolar
budding [5]. Activation of the filamentous response produces more flocculins, which
cause the daughter cells to stick to their mother cell [7]. Flocculation together with
unipolar budding produces chains of daughter cells growing away from the mother cell;
this growth pattern may enable daughter cells to encounter a new environment with a
greater nutrient supply. It happens that byproducts of normal yeast metabolism (certain
alcohols) also promote filamentous growth as part of a quorum sensing phenomenon [8].
Hence, as population density increases, cells deplete the environment of the preferred
nutrient source, simultaneously generating a secondary energy source and quorum
sensing molecule, the alcohol. This promotes filamentous growth and causes the cells to
bud away from the initial environment towards a possibly more nutrient rich
environment.
4
There are two branches to the filamentous growth pathway, a cAMP pathway that
turns on the transcription factor Flo8 and the MAPK pathway that activates the
transcription factors Ste12 and Tec1 [9]. Both of these pathways converge at the FLO11
locus [9]. The FLO11 gene itself is a member of the flocculin family and is one of the
major players in helping daughter cells stick to their mother cells [7]. The cAMP
pathway, though part of the FG system is not pertinent to this work and will not be
discussed further. The FG MAPK kinase pathway (referred to from this point as the FG
pathway) displays similarities with both the mating and HOG MAPK pathways. The
known receptors for the pathway are Sho1 and Msb2. Msb2 negatively regulates the FG
pathway [10]. Msb2 repression of FG is relieved by cleavage of its mucin domain by a
yapsin, which is upregulated during nutrient limiting conditions [11]. Cleavage of Msb2,
along with activation of Sho1 by an unknown mechanism, activates the MAPK cascade
that includes Ste20, Ste11, Ste7 and Kss1 [2]. Kss1, when phosphorylated, relieves the
inhibition of the Kss1/Dig1/Dig2/Ste12 complex [12]. Unphosphorylated Dig1/Dig2
inhibits Ste12 from positively interacting with filamentous response elements (FRE) in
the promoter region of filamentous responsive genes [13]. When active, Ste12/Tec1
heterodimers regulate the activity of filamentous responsive genes such as FLO11 [14].
Regulation of filamentous responsive genes through the FG pathway allows the cell to
sense the nutrient availability in the environment and respond in the most effective
manner for the propagation of its progeny.

5
Specificity Mechanisms for MAPK Pathways in Yeast
Each of the pathways discussed above recognize an extracellular stimulus and
translates that signal into a unique cellular response. While each of these pathways
(mating, HOG and FG) plays a unique role in the cell, the proteins in each pathway are
not unique. There is significant overlap between the proteins in each of these pathways,
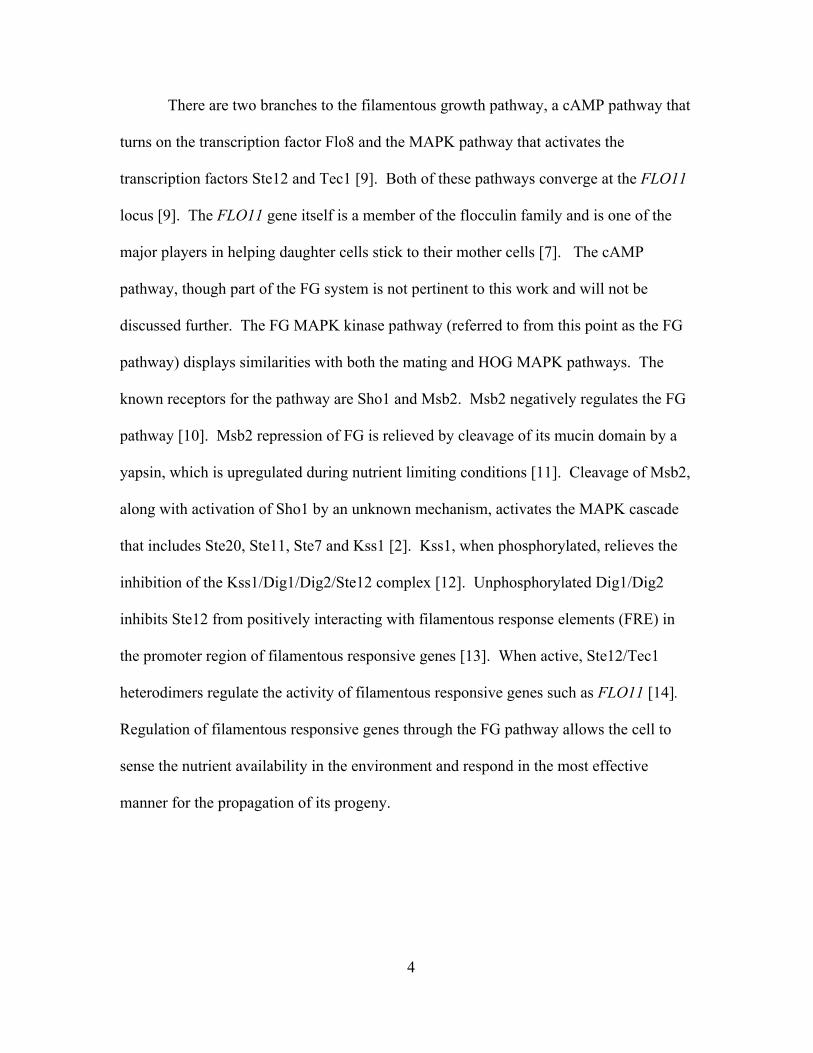
particularly the core MAPK proteins. See figure 1. How is it that the same proteins can
generate a variety of cellular responses? The answer lies in a variety of mechanisms that
provide specificity to each pathway.
There are a number of recurring themes that are known to provide specificity for
various pathways. These themes are scaffolding, negative regulation, localization, and
pathway specific components. Scaffolds, though initially found in yeast, have since been
found in other eukaryotes such as humans. Scaffolds can be simple docking sites for
various pathway components, bringing them in closer proximity to one another to
enhance the processivity of signaling. Some scaffolds play more nuanced roles in their
pathways. Negative regulation of one pathway by another is a different mechanism for
maintaining specificity. By turning off similar pathways farther downstream instead of at
the head of each pathway, the system has more flexibility in the final decision of which
pathway to fully activate. Once the decision to activate one pathway over another has
been made, the cell still has the
6
Figure 1
Proteins in solid black are found in common between multiple pathways. Proteins
specific to individual pathways are shown in white.

7
ability to stop the response of the unwanted pathway. Pathway components can be
isolated from members of other pathways by cellular compartmentalization or
localization to different areas of the cell. Pathways can also take advantage of
components that are specific to one particular pathway. Cells can utilize one or a number
of these mechanisms in the same signaling pathway to ensure that only the proper
pathway responds to a particular stimulus.
The mating pathway utilizes a combination of mechanisms to maintain signaling
specificity. The receptors that recognize pheromone are unique to the mating pathway, as
is the MAPK Fus3. The kinase cascade, though similar to other MAPK pathways,
utilizes an additional factor not present in other pathways, Ste5. Ste5 was identified as
the first scaffolding factor [15]. As a scaffold, it interacts with all three members of the
core kinase cascade and Gβ at the plasma membrane [16]. Initially it was thought of as a
passive factor whose only role was as a docking site for other pathway components to
interact. We have come to learn that Ste5 is more of an active participant in the mating
pathway. Interaction of Fus3 with Ste5 makes Fus3 a better substrate for Ste7 [17]. The
increased kcat for the Ste7-Fus3 phosphorylation reaction when Ste5 is present, along with
the close proximity of the proteins, allows Fus3 to outcompete Kss1 for phosphorylation
by Ste7 during mating conditions [17]. Ste5 has also been implicated in the degradation
of Ste11, thereby negatively regulating the pathway [18].
Besides the scaffolding factor Ste5, the mating pathway also utilizes negative
regulation of the FG pathway to maintain specificity. The MAPK Fus3, once active,
initiates the ubiquitin dependent degradation of Tec1 [19] [20]. Tec1 is part of the
Ste12/Tec1 heterodimeric transcription factor that activates filamentous responsive

8
genes. Degradation of Tec1 prevents activation of any FG responsive genes during the
mating response. This combination of specificity mechanisms functions to ensure that
presence of pheromone in the environment activates only the mating pathway and mating
responsive genes.
Specificity in the HOG pathway is maintained by a number of known
mechanisms, but the full extent of the mechanisms that provide specificity to the HOG
pathway has yet to be elucidated. First, the MAPKK Pbs2 is not only a kinase, but also a
scaffold [21]. As with the mating pathway, the scaffold is thought to bring pathway
components together and localize them at the membrane for optimal interaction between
the activating receptors and the MAPK cascade. Second, there are unique components in
the HOG pathway including the receptor Hkr1, the scaffold/kinase Pbs2 and the MAPK
Hog1 that only function in the HOG pathway [3] [21]. Hog1 has been shown to be
necessary for maintaining specificity of the HOG pathway [22]. In particular, deletion of
Hog1 or Pbs2 causes activation of the mating pathway in the presence of osmolytes [22].
It has been inferred that there may be a negative regulatory mechanism that turns off
other pathways during HOG activation, but such a mechanism has yet to be fully proven
[23]. The HOG pathway utilizes many of the same mechanisms for specificity as the
mating pathway, but the complete picture has yet to be established for the HOG pathway;
how does Hog1 provide specificity and how does the HOG pathway negatively regulate
the other MAPK pathways?
Despite the variety of mechanisms known to provide specificity to MAPK
pathways, it is not known what mechanism(s) are utilized by the FG pathway to prevent
pathways like the mating and HOG pathways from becoming activate during glucose or

9
nitrogen limiting conditions. A large number of FG pathway components are utilized in
either the mating pathway or HOG pathway. There are very few known FG specific
pathway components such as Kss1 that could prevent activation of other pathways. It is
reasonable to predict that mechanisms to prevent the activation of the mating and HOG
pathways by the FG pathway during nutrient limiting conditions do exist. It is possible
that the FG pathway utilizes a known mechanism for specificity through factors as yet
unidentified. It is also within reason to speculate that the FG pathway may utilize a novel
mechanism for specificity. This work has set out to identify factors that are providing
specificity to the FG pathway.

10
CHAPTER II
RANDOM MUTAGENESIS SCREEN FOR SPECIFICITY FACTORS
As an initial step toward discovering the mechanisms that govern signaling
specificity in the filamentous growth pathway I sought mutants in which activation of
that pathway led to inappropriate readout in the HOG pathway. To this end I created a
reporter in which the HIS3 gene was driven by the HOG pathway dependent STL1
promoter. In an otherwise WT strain, the STL1-HIS3 reporter is the only copy of HIS3 in
the cell, thus making the strain his- unless the HOG pathway is activated. The HOG
pathway is typically activated by addition of osmolyte. I reasoned that the HOG pathway
can also be activated by abnormal crosstalk from another MAPK pathway, such as the
FG pathway, in mutants defective for specificity mechanisms. I used reporter-bearing
strains to select for mutants that are histidine prototrophs when cells are exposed to
conditions that activate the FG pathway. I used two different strategies to search for such
mutants. In the first strategy I used a chemical mutagen (EMS) to mutagenize the
genome randomly. In the second strategy I used synthetic genetic analysis (SGA) to
introduce the STL1-HIS3 reporter into the yeast deletion collection. The first strategy
allows not only for isolation of loss of function mutants, but also partial loss of function
mutants and dominant mutants in essential and non-essential genes. The second strategy
only identifies loss of function mutants in non-essential genes, but has the virtue that the
affected gene is identified immediately. I first describe the results obtained with the
random mutagenesis strategy (Chapter II) and then with the SGA strategy (Chapter III).

11
Random Mutagenesis Screen
Taking a forward genetic approach to the issue of specificity factor identification
resulted in a screen for mutants that have lost specificity for the filamentous growth
MAPK pathway. One result of the loss of specificity in the filamentous growth pathway
is the cross activation of other MAPK pathways such as the mating and HOG pathways.
Other labs have used such cross activation based screens to identify factors in pathways
such as the HOG pathway [24]. The logic behind the screen is that specificity mutants
can be identified from a pool of random mutants by the activation of a reporter in another
pathway such as the HOG pathway. The reporter system I choose to utilize is a growth-
based reporter based on the promoter of the STL1 gene. STL1 is a HOG sensitive gene.
Posas et al showed that under salt stress, transcription of the STL1 gene increased by
approximately 90 fold [25]. The basal level of gene expression was also very low [25].
The combination of low basal activity and strong HOG activation makes STL1 an ideal
promoter for use in the screen. The STL1 promoter was fused to the coding region of the
HIS3 gene, generating a growth based reporter (strains SY4316 and SY4318). See figure
2. Mutagenized strains plated on FG pathway activating media lacking histidine will
only grow when the reporter is activated by a mutation that loses specificity to the FG
pathway and produces the HIS3 gene product. Randomly generated mutants were created
in both the a and α mating types. Three independent cultures of the strain SY4316 and
four independent cultures of the strain SY4318 were treated with EMS, plated directly
onto media lacking fermentable carbon and histidine to identify potential mutants (see
materials and methods).

12
Figure 2
A-β galactosidase assay of the STL1-lacZ reporter. The addition of osmolyte to the
media activates the reporter resulting in an increase in β-galactosidase activity. B-STL1-
HIS3 is a growth based reporter. Addition of osmolyte to the medium activates the
reporter and generates histidine, allowing for growth on medium lacking histidine.

13
Of approximately 600 mutants isolated by random mutagenesis and subjected to
phenotypic and genetic assessment, the most robust of the 112 recessive mutants that
grew on 20 mM 3-aminotriazole were chosen for further analysis.
With respect to phenotype, I sought to determine the magnitude of the potential
signal in the HOG pathway by measuring the degree of resistance to 3-aminotriazole. I
also asked whether any elements of filamentous growth were retained by the mutants by
assessing bud pattern, cell elongation and agar invasion. With respect to genetic analysis,
I first determined whether the mutations indeed affected signaling specificity; that is,
actually required signaling in the FG pathway rather than causing constitutive activation
on the STL1 promoter by some other means. Subsequently, I determined if the mutations
were dominant or recessive and grouped the recessive mutants into complementation
groups.
Phenotypic Assessment
It is possible that different mutants activate the STL1-HIS3 reporter to varying
degrees. In order to class mutants together with others of similar activity, I assayed
growth on various levels of 3-aminotriazole. 3-aminotriazole is a competitive inhibitor of
the His3 enzyme. If cells are to grow on media containing 3-aminotriazole, they must
produce enough HIS3 gene product, the enzyme imidazoleglycerol-phosphate
dehydratase that catalyzes the sixth step of histidine biosynthesis, to out compete the
inhibition of 3-aminotriazole [26], [27]. Therefore, the higher the concentration of 3-
aminotriazole that cells can grow on, the more HIS3 gene product they are producing.
The relative activity of the reporter can then be compared among mutants based on the

14
highest level of 3-aminotriazole each mutant can grow on. I screened the mutants on 5,
10, 15, 20 and 40 mM 3-aminotriazole. This allowed for the grouping of the mutants
based on their reporter activities. Most of the mutants fell in the middle of the 3-
aminotriazole range. 51% of α mutants and 44% of a mutants grew on 20 mM 3-
aminotriazole. Very few mutants had either enough reporter activity to grow on 40mM
3-aminotriazole or so little activity that they only grew on 5mM 3-aminotriazole. See
figure 3B. In order to determine the growth phenotype in later genetic experiments, it
became necessary to limit the mutants I worked with to one level of reporter activity.
The group of mutants that were able to grow on 20 mM aminotriazole were chosen for
their robustness of growth and the adequate number of mutants in that group. For the
genetic studies discussed later in this work, all of those experiments were done with the
group of mutants that grew on 20 mM 3-aminotriazole.
I infer from the His+ phenotype of the mutants that signaling has bled from the FG
pathway to the HOG pathway (see below for discussion of this inference). However,
even if this inference is correct, some signaling in the FG pathway may be retained.
Moreover, the architecture of the FG pathway is not known. There may be mutations that
affect one or a few aspects of the filamentous growth phenotype, but not other aspects. I
therefore assayed the mutants for various filamentous phenotypes.
The mutants were assayed for their ability to invade agar using the plate washing
assay (see materials and methods). 23% of a mutants lost the ability to invade agar under
filamentous growth conditions. 28% of α mutants lost their ability to invade agar under
filamentous conditions. For an example of mutants that fail to invade see the boxed
strains in figure 3A. There were a small number of mutants that appeared to have
15
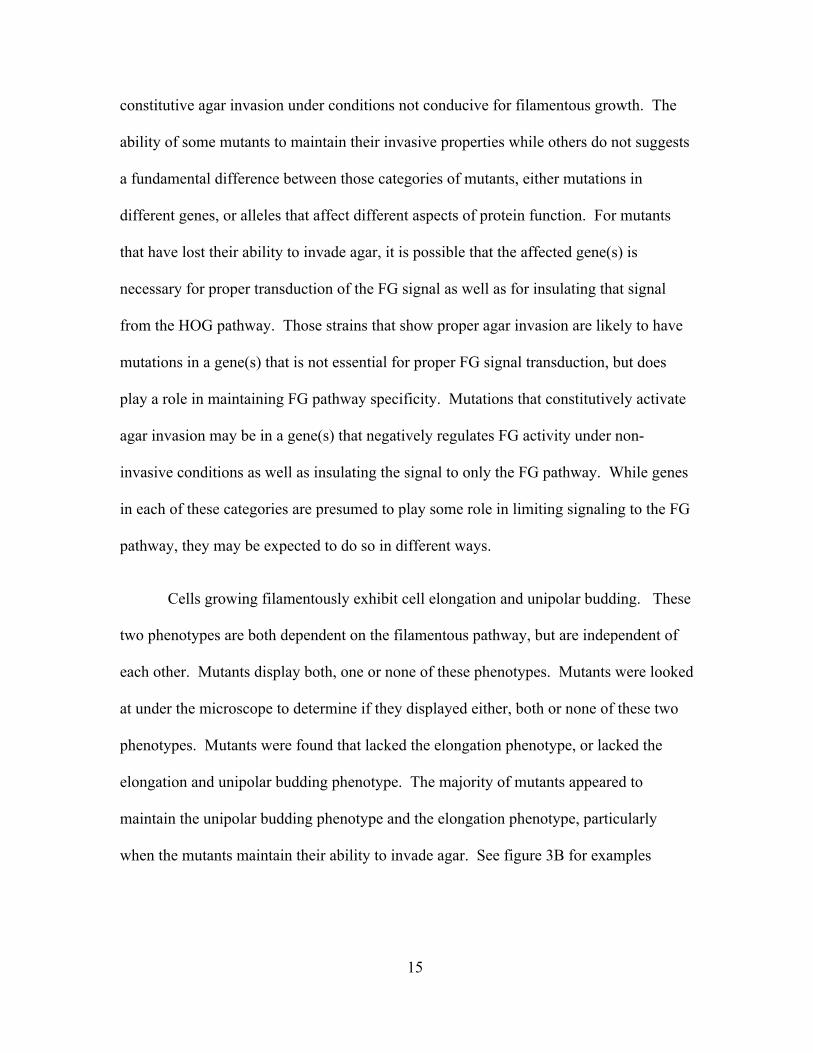
constitutive agar invasion under conditions not conducive for filamentous growth. The
ability of some mutants to maintain their invasive properties while others do not suggests
a fundamental difference between those categories of mutants, either mutations in
different genes, or alleles that affect different aspects of protein function. For mutants
that have lost their ability to invade agar, it is possible that the affected gene(s) is
necessary for proper transduction of the FG signal as well as for insulating that signal
from the HOG pathway. Those strains that show proper agar invasion are likely to have
mutations in a gene(s) that is not essential for proper FG signal transduction, but does
play a role in maintaining FG pathway specificity. Mutations that constitutively activate
agar invasion may be in a gene(s) that negatively regulates FG activity under non-
invasive conditions as well as insulating the signal to only the FG pathway. While genes
in each of these categories are presumed to play some role in limiting signaling to the FG
pathway, they may be expected to do so in different ways.
Cells growing filamentously exhibit cell elongation and unipolar budding. These
two phenotypes are both dependent on the filamentous pathway, but are independent of
each other. Mutants display both, one or none of these phenotypes. Mutants were looked
at under the microscope to determine if they displayed either, both or none of these two
phenotypes. Mutants were found that lacked the elongation phenotype, or lacked the
elongation and unipolar budding phenotype. The majority of mutants appeared to
maintain the unipolar budding phenotype and the elongation phenotype, particularly
when the mutants maintain their ability to invade agar. See figure 3B for examples

16
Figure 3
A-Invasive growth assay of randomly generated mutants. Mutants that have lost the
ability to invade agar fail to leave a scar on the plate as seen in the boxed section. B-
Percent of mutants that activate the STL1-HIS3 reporter enough to grow on various levels
of 3-aminotroazole. The majority of mutants are able to grow on 20mM 3-aminotriazole.
C-Morphology of various mutants. There are three categories of mutants, those with
both phenotypes, elongation and unipolar budding, those that only elongate and finally
those with neither.

17
of the variety of phenotypes found among the mutants. No mutants were found that
maintained the elongation phenotype, but lost the unipolar budding phenotype.
Genetic Assessment
The mutants I am interested in are those that are dependent on activation of the
filamentous growth pathway for reporter activity. It is possible to generate mutants that
activate the HOG pathway independently of FG pathway activity, meaning they turn on
the HOG pathway without a signal from the FG pathway. Such mutants could be
generated by constitutive mutations in HOG pathway components. For example, a
mutation that constitutively activates Pbs2 or Hog1 will activate the reporter without a
signal from the FG pathway. To identify the mutants that are not dependent on the FG
pathway, I plated the mutants on medium that contains fermentable carbon, but lacks
histidine. Those mutants that grow on this type of medium are activating the reporter
without input from the FG pathway and are not specificity mutants. See figure 4. 30% of
a and 13% of α mutants were found to be independent of the filamentous growth
pathway. These mutants were not studied further. The FG pathway dependent mutants
were further characterized.
Random mutagenesis can generate both dominant and recessive mutations. For a
number of genetic experiments described later in this work it is important to know if the
mutation is dominant or recessive. To this end, all mutants were mated to the wild-type
strain of the opposite mating type. The resulting diploids were then screened for STL1-
HIS3 reporter activity. Those mutants that activated the reporter with a single copy of the
mutant gene are dominant. Those mutants that failed to activate the reporter with only a

18
Figure 4
A-The presence of a specificity factor prevents the signal from leaking to the HOG
pathway. B-Mutation of the specificity factor prevents it from functioning and allows the
signal to leak over to the HOG pathway, activating the HOG response. C-Constitutive
mutants in the HOG pathway activate the HOG response without input from the FG
pathway.

19
single mutant gene are recessive. Only the recessive mutants were used for further
genetic tests. Of the mutants screened, 51 a mutants and 34 α mutants were found to
have dominant mutations. 68 a mutants and 171 α mutants were found to have recessive
mutations.
Complementation Tests
Due to the fact that the mutants were generated randomly, the identity and number
of the mutated genes is not known. I performed complementation tests to determine the
number of genes identified by the mutagenesis screen. Mutants in mating type a were
mated to mutants in mating type α and the His phenotype of the resulting diploids
assayed. Diploids that fail to activate the STL1-HIS3 reporter have mutations that
complement each other and are located in distinct genes. Mutants from the 20mM 3-
aminotriazole group were tested in this manner and most of the mutants fell into one
large complementation group, classified as group 1. There were a number of individual
mutants that fell into their own complementation groups, groups 2 through 5. This test
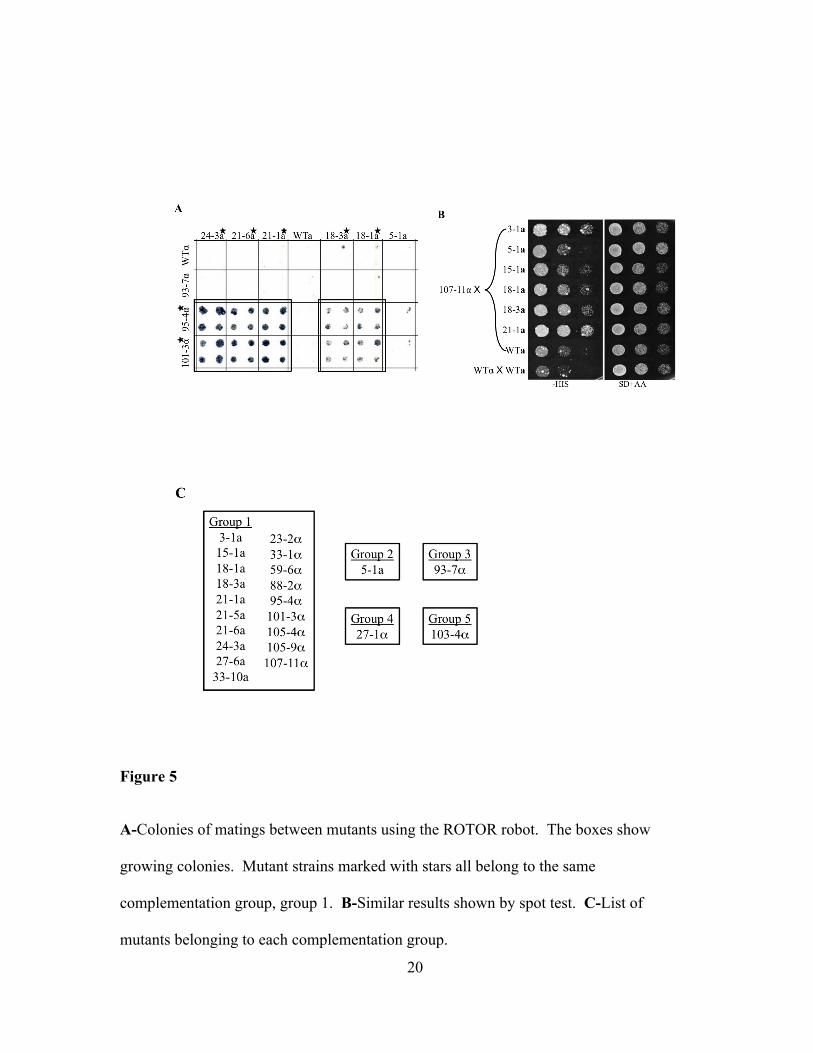
was done on the RoTor robot in four fold coverage for each mating. See figure 5A.
Diploids of mutants that fall in the same complementation group are seen to grow, while
diploids of mutants not in the same complementation group fail to grow. Results were
repeated with spot testing. See figure 5B. Mutant 107-11α was mated to a variety of a
mutants. All diploids grew except that created by mating with strain 5-1a, which does
not belong to complementation group 1. The list of mutants assigned to each
complementation group can be found in figure 5C.
20
Figure 5
A-Colonies of matings between mutants using the ROTOR robot. The boxes show
growing colonies. Mutant strains marked with stars all belong to the same
complementation group, group 1. B-Similar results shown by spot test. C-List of
mutants belonging to each complementation group.

21
These complementation tests suggest the minimum number of genes that were
mutated in the random mutagenesis screen is 5. It is likely that there are a number of
alleles present in the mutant collection for the gene represented in complementation
group 1. This experiment does not determine the actual identity of the gene mutated in
group 1.
An attempt was made to determine the identity of the gene in complementation
group 1 by complementation with a wildtype genomic plasmid library (see materials and
methods). The plasmids isolated in this screen did not generate consistent phenotypes.
The plasmids isolated were those that failed to complement the crosstalk phenotype
(growth on medium lacking fermentable carbon and histidine). Propagation of those
strains, transformation of the plasmids from those strains, and single gene
complementation from those plasmids did not generate a reproducible phenotype (failure
to complement). Due to the lack of reproducibility in the results the screen was
abandoned for other methods of gene identification.
All members of complementation group 1 are predicted to have mutations in the
same gene. It follows that alignment of the genomes from complementation group 1
would show random mutations throughout each genome, but only one gene would have
mutations in all group members. Therefore, sequencing and subsequent alignment of
group 1 genomes should provide an identity for the gene mutated in complementation
group1. Sequencing of seven members of group 1 and background strains of both mating
types was done after re-verification of complementation grouping. Alignment of the
sequencing reads was done against the Sigma (Σ) reference genome sequence provided
by the Boone Lab. A consensus sequence was compiled for each genome. Each mutant

22
genome was compared to the respective background strain sequence and single
nucleotide polymorphisms (SNPs) were identified where the two sequences differed. A
list of all genes containing SNPs was compiled for each member of complementation
group 1 and the lists were cross-referenced between the mutants. Two genes that
contained SNPs in all members of complementation group 1 were identified using this
method, YBL105c and YBR150c.
YBL105c and YBR150c were further analyzed using the Integrated Genome
Browser software to verify the presence and location of the SNPs in the α mutant strains.
No conclusive sequencing of SNPs were found in either of the α mutant strains. Analysis
showed some variation in the sequencing between the wildtype and mutants strains, but
the quality of the sequence was not high enough to verify a SNP. It is likely that many of
the SNPs designated in the original list are incorrect due to the inability of the SNP
calling software to distinguish between high quality sequencing data and low quality
sequencing data. I have been unable at this time to further characterize the other genes
on the SNP list due to time constraints. It is possible that further analysis of the actual
traces for each of the genes on the SNP list may lead to a candidate. For a full list of
genes candidates see Table 1. This effort would be further aided by additional sequence
data. The coverage of each genome varied widely and in some cases was much lower
than expected. Additional coverage of each genome would increase the confidence in the
consensus sequence and in turn SNPs identified from such sequence.
The yeast deletion collection is a collection of approximately 5,000 yeast strains,
each with a different non-essential gene knocked out. I used the collection to attempt to
identify the gene mutated in complementation group 1. A candidate from

23
complementation group one (107-11α) was crossed to the entire collection and the
resulting diploids were screened for their ability to activate the STL1-HIS3 reporter.
Growth of a diploid on FG medium lacking histidine suggests that the particular deletion
and the query mutation affect the same gene. This screen was done with deletion
collections in both the non-filamentous (S288c) and filamentous (Σ) genetic backgrounds
for a total of three screens, resulting in a list of 20 candidate genes. To determine
whether those candidates were real, each gene was then independently knocked out in the
wildtype STL1-HIS3 reporter strain SY4316 and assayed for crosstalk. See figure 6A for
a list of candidates. Of those 20 genes, a number of them were not correctly identified in
their respective collections. That is, the locus that was ostensibly deleted in these strains
did not contain the knockout cassette when tested by PCR. I infer that these candidates
contain a deletion or other mutation that fails to complement the mutant, but the identity
of that gene(s) is unknown. 11 candidates were successfully knocked out in the STL1-
HIS3 reporter strain. Of those 11 candidates, only the nrg1Δ strain showed a significant
level of crosstalk.
The crosstalk generated in the nrg1Δ strain is fairly weak when compared to the
original mutant crosstalk as shown in figure 6B. There are a number of reasons that the
level of crosstalk may be different. One possibility is that the alleles of the gene isolated
by chemical mutagenesis may behave differently than the full knockout. The NRG1
locus was sequenced in the mutant strain used for the complementation test (107-11α) to
identify any mutations that could be causing crosstalk. See figure 6C. The NRG1 locus
from mutant 107-11α from 500bp before the start codon, to 500bp past the stop codon,
did not contain any mutations, insertions or deletions when compared to the Σ

24
Figure 6
A-List of candidate genes from complementation with the deletion collection. B-Spot test
of nrg1Δ strains on SLAG-HIS+15mM 3AT, SD-HIS and permissive medium (YEPD).
C-Alignment of NRG1 sequence at position 210 showing no change in the mutant in
relation to the Sigma reference strain (wildtype).

25
background strain that it was derived from (SY4318). We know that the nrg1Δ strain
failed to complement group 1 mutations and that the knockout generates reporter activity.
However, with no mutation in the NRG1 locus in the original mutants, it is unclear at
present exactly how NRG1 is involved in FG signaling to generate that phenotype. From
the current knowledge of NRG1 there are a number of plausible hypothesis for how
NRG1 can be tied to filamentous growth.
Nrg1 functions as a co-repressor in the presence of glucose to down regulate a
variety of genes that are usually active only in low glucose conditions. Nrg1 has been
implicated in the regulation of FLO11 by its physical interaction with Snf1 [28] and by
binding sites for Nrg1 in the FLO11 promoter [29]. Deletion of nrg1 and its homolog
nrg2 result in hyper-invasive cells [29]. Nrg1 is phosphorylated in response to stresses
including NaCl, Sorbitol, alkaline pH and low glucose [30]. The levels of Nrg1 in the
cell also increase during low glucose conditions, particularly in the presence of ethanol
and glycerol [28]. The most plausible hypothesis is that Nrg1 functions as a negative
regulator of FG pathway activity at the transcriptional level in the presence of glucose. In
the absence of glucose Nrg1 might be necessary in a modified (phosphrylated) form to
alter gene regulation, possibly by releasing co-repressor Cyc8/Tup1 or recruiting
alternative regulatory factors.

26
CHAPTER III
STL1-HIS3 SYNTHETIC GENETIC ARRAY
The technology developed for the yeast synthetic genetic array is a useful tool for
genetic manipulation and screening of the entire yeast genome. Using the yeast deletion
collection and the SGA technology, one can incorporate additional genetic elements into
each of the deletion strains. This technology is usually used for the pairing of additional
gene knockouts with the entire deletion collection. This is done by mating a query strain
containing the gene knockout of interest to the entire collection. Through a series of
sporulation and haploid selection steps, a collection of haploid strains that now contain
the knockout of interest and the original gene knockout are generated (see materials and
methods). I have utilized this technology to insert the STL1-HIS3 reporter into the
filamentous (Σ) yeast deletion collection. This allows for the screening of any non-
essential gene that is necessary for maintaining specificity in the FG pathway. The
collection was mated to two independently isolated query strains (once to one and twice
to the other). Each mated collection was then screened on three concentrations of 3-
aminotriazole (5, 10 and 15 mM) and medium containing fermentable carbon and lacking
histidine (SD-HIS) to eliminate candidates that were generating crosstalk independently
of the FG pathway. Candidates had to grow from two of the three independently mated
collections and fail to grow on the SD-HIS plates to qualify as candidates. 14 strains met
those conditions. Of the 14 strains, all grew on 5 and 10 mM 3-aminotriazole. 5 of the
14 strains also grew on 15 mM 3-aminotriazole. The STL1-HIS3 SGA screen resulted in
14 candidates that generate crosstalk from the FG pathway to the HOG pathway.

27
The location of each strain in the array is annotated for identification purposes.
Cross-referencing the plate number with the row and column location should give an
identity to each candidate. The plate numbers and locations along with the gene
identities given for each location are described in Table 2 along with the screens that the
candidates came from. To verify the phenotype of each candidate, the knockout cassette
and surrounding sequence was to be transferred from the deletion collection strain to the
SY4316 STL1-HIS3 reporter strain. Unique primers were designed for each locus
approximately 600 base pairs upstream and 600 base pairs down stream of the start and
stop sites. The knockout cassette with flanking regions should result in a PCR product of
approximately 2.5kb. The resulting PCR products did not correspond to the knockout
cassette, but instead corresponded with the correct size for each wild-type locus. Each
ORF was checked with PCR for the presence of the knockout cassette. For ORFs whose
wild-type band size was similar to the knockout cassette size (between 2.5 and 3kb)
digests were done to verify the absence of the kanr cassette. No strains showed the
correct size PCR fragment to indicate the presence of the knockout cassette. Those done
by digest also failed to indicate the presence of the knockout cassette.
It is obvious that there is a discrepancy between the stated identity of each
candidate and the actual gene knockout present in each strain. It was presumed that
incorrect arraying of the collection could have altered the location of each strain. A
number of auxotrophic strains and vma- strains were checked for their presence in the
array at both the presumed locations and any location within the respective quadrants.
No strain was found to be correct in any of those locations. The plates were also tested
28
for altered orientation (flipped vertically or horizontally), but no such change in
orientation was found.
It is not possible within the present time restriction to determine the identity of the
14 candidate genes. If one wanted to identify the genes in the 14 candidate strains, those
genes could be identified by PCR. Isolation of genomic DNA from each strain and PCR
using an internal primer for the deletion cassette and a set of randomized primers to
prime from the genome outside the knockout cassette would generate a DNA fragment
containing the genomic DNA on one side of the knockout cassette. Sequencing of the
resulting PCR products would identify the location of one flank of the knockout cassette
in the genome.
Without the identity of said candidate genes, the mechanism by which each
candidate provides specificity to the FG pathway cannot be elucidated. Given that there
are 14 candidates from the screen, it can be stated that there are up to 14 non-essential
genes that are required for maintaining the specificity of the FG pathway. The number of
different mechanisms represented by those 14 candidates is not known, but it is possible
that some of those candidates represent the mechanism by which Nrg1 might provide
specificity to the FG pathway.

29
APPENDIX
MATERIALS AND METHODS
Strains-Strains were propagated and transformations were done as in Burke et al
2000 [31].
Gene knockouts-PCR products were generated from respective strains from the
yeast deletion collection. Each PCR product contained the knockout cassette and ~500
base pairs of locus specific homology on either side of the knockout cassette. Strains
were transformed with PCR products and transformants were selected by expression of
the knockout cassette marker (kanr).
Reporter strain construction-STL1-HIS3 reporter selection was done as in Horecka
and Sprague 2000 [32]. The CYC1 promoter in pSL1470 was swapped for 825 base pairs
of the STL1 promoter. The resulting plasmid was cut with NheI and transformed into
SY3089 and SY3090. Ura+ transformants were selected by growth on SD–Ura.
Candidates were then streaked on 5FOA plates to select for Ura- candidates. Ura-
candidates were tested for growth on SD-His and by PCR. These strains were named
SY4316 and SY4318. Strain SY4318 had the TRP1 locus knocked out with a kanr
cassette as in Longtine et al 1998 [33].
Filamentous media-Two types of filamentous inducing plates were used in
various experiments. The first type, SLAG-His, were made as in Tong and Boone 2001
(SD protocol), substituting 2% glucose for 2% glycerol and using all amino acids
excepting histidine [34]. The second type, SG-His plates, were made as in Burke et al

30
2000 with 2% glycerol and all amino acids except histidine. 0 to 40mM 3-aminotriazole
was added to both types of media depending on the experiment.
SGA Query strain construction and assay-The STL1-HIS3 query strain was
generated by the PCR method. The STL1-HIS3 cassette was created by homologous
recombination between a pRS316 plasmid containing the STL1 promoter and a PCR
fragment from the Stevens lab plasmid 3454 containing HIS3 fused to an HA tag and the
natMX cassette. The resulting plasmid contained 825 base pairs of the STL1 promoter
fused to the HIS3 coding region tagged with HA and natr. A PCR product was generated
from the plasmid with 40 base pairs of homology to the HIS3 locus on either side of the
reporter cassette. The PCR product was transformed into the Sigma WT Y3295 strain
provided by the Boone lab and nat resistant strains were selected. Candidates were tested
for lack of growth on SD-HIS and by PCR. SGA was performed as in Tong and Boone
2001 with the media changed to select for leucine prototrophy [34]. Final analysis of the
STL1-HIS3 geneXΔ collection was done on SLAG-HIS+5/10/15mM 3-aminotriazole
plates incubated at 30 degrees C for 7 days. The collection was also plated on SD-HIS to
remove any candidates that displayed FG independent crosstalk.
Dilution spot tests- 3AT and plate washing assay dilution spot tests were done
with each strain equilibrated to .7 ODs with a final volume of 200 microliters and diluted
1:10 in 96 well plates. Cells were plated with a 48 prong device.
Random Mutagenesis- Reporter strains SY4316 and SY4318 were mutagenized
with EMS according to Lawrence [35]. The mutagenized cells were plated on SG-HIS
and selected for colonies that grew. Candidates were streaked and then patched on SG-

31
HIS plates. Mutants were selected from only those candidates that grew on all three
plates (original, streak and patch).
Invasive Growth Assay-Strains were transferred from 96 well plates to YEPD
plates with a 48 prong device. Plates were grown at 30 degrees Celsius for 3 days. The
plates were then run under a stream of water and rubbed gently with a gloved hand to
remove any cells that had not invaded into the plate.
Microscopy-Strains were grown in YEPD for 2 days. 8 ul of each culture were
pipetted to a slide and viewed by DIC at 20X and 100X.
B-gal Assay- Two 10ml mid-log (.7 OD600) cultures were grown of each strain at
30 degrees C. One culture from each strain was incubated for 10 to 60 minutes with 1M
NaCl at 30 degrees C. Cells were then pelleted and lysed by vortexing each sample in
.4ml buffer (50mM Tris pH8, 20mM NEM, 100mM NaCl, 0.5% Triton X, 1mM PMSF,
Complete Protease Inhibitor) and ~150ul glass beads for 5 minutes. Samples were
centrifuged for 2 minutes at 4 degrees C to remove precipitate. Between 1 and 10ul of
cell prep was added to 190-199ul of Z buffer with CPRG. Each sample and a blank were
assayed at OD578 every 30 seconds for 60 minutes. β-galactosidase units were
caluculated by the following formula- 1000 x OD578 /(elaspsed time x (.1x concentration
factor) x OD600).
Plasmid Library Complementation- was done as in Rose et al 1987. Colonies
were selected that grew on permissive (SD-URA) plates, but failed to grow on restrictive
plates (SG-HIS).

32
Whole Genome Sequencing- Genomic preps were done as in the Yeast Genomic
Prep for high quality DNA from the Hoskins/Hahn Lab 1997. Library construction was
done by Jason Carrier of the Johnson Lab. The actual sequencing was done on an
Illumina sequencer with 80 base single read sequencing by the University of Oregon
sequencing facility. Assembly of the sequencing reads was done by Nicolas Stiffler
using the sigma genome as reference. The Samtools program was used to generate the
consensus sequence for each genome assembled. The genomes of each mutant were then
compared to the WT genome. SNPs were marked when there was at least 10X coverage
of the base and the consensus differed between the WT and mutant. Traces were
analyzed on the Integrated Genome Viewer software.

33
Table 1-List of Candidate Genes from Genome Sequencing and Alignment
All α strains All a
Strains a and α Strains
BAL001C YBR044C YAL026C YBR105c
BAL002C YBR118W YBL105C YBR150c
YAL051W YBR150C YBR128C
YAL024C YBR198C YBR132C
YAR035W BBR010W YBR150C
YAR050W YBR293W YBR155W
YBL107C BBR016W YBR200W
YBL105C BCL018C
YBL103C YCR038C
YBL102W YDR204W
YBL082C YDR247W
YBL064C YGR183C
YBL023C YLR450W

34
Table 2-List of Candidates from STL1-HIS3 SGA
ORF GENE PLATE ROW COLUMN SCREEN 1
SCREEN 2
SCREEN 3
YJL048C UBX6 14 1A 11 ✔ ✔ ✔
YJL101C GSH1 14 2B 2 ✔ ✔ ✔
YJL207C 14 2B 8 ✔ ✔ ✔
YPR067W ISA2 13 5 2 ✔ ✔
YJL088W ARG3 13 6 24 ✔ ✔
YJL175W 13 8 8 ✔ ✔ ✔
YKL189W HYM1 13 12 7 ✔ ✔
YJR017C ESS1 13 16 9 ✔ ✔ ✔
YOL104C NDJ1 12 9 23 ✔ ✔ ✔
YLL012W YEH1 9 16 24 ✔ ✔
YBR037C SCO1 5 7 4 ✔ ✔
YCL011C GBP2 5 16 15 ✔ ✔
YPR098C 4 12 12 ✔ ✔
YBL056W PTC3 1 7 21 ✔ ✔ ✔

35
Table 3-Yeast Strains
Strain Genotype Source
SY3089 Sigma MATa ura3-52 Fink Lab
SY3090 Sigma MATα ura3-52 Fink Lab
SY4316 3089 STL1pr-HIS3 This Study
SY4318 3090 trpΔ::kanr STL1pr-HIS3 This Study
SY4475 4316 mutant 3.1 This Study
SY4476 4316 mutant 5.1 This Study
SY4477 4316 mutant 15.1 This Study
SY4478 4316 mutant 18.1 This Study
SY4479 4316 mutant 18.3 This Study
SY4480 4316 mutant 21.1 This Study
SY4481 4316 mutant 21.5 This Study
SY4482 4316 mutant 21.6 This Study
SY4483 4316 mutant 24.3 This Study
SY4484 4316 mutant 27.7 This Study
SY4485 4316 mutant 33.10 This Study
SY4486 4318 mutant 23.2 This Study
SY4487 4318 mutant 27.1 This Study
SY4488 4318 mutant 59.6 This Study
SY4489 4318 mutant 88.2 This Study
SY4490 4318 mutant 93.7 This Study
SY4491 4318 mutant 95.4 This Study
SY4492 4318 mutant 101.3 This Study
SY4493 4318 mutant 103.4 This Study
SY4494 4318 mutant 105.4 This Study

36
Stain Genotype Source
SY4495 4318 mutant 105.9 This Study
SY4496 4318 mutant 107.11 This Study
Y3295 Sigma MATα his3::hisG leu2Δ ura3Δ ho- Boone Lab
Σ collection Sigma MATa abc1Δ::kanr can1Δ::Ste2pr-spHIS5 lyp1Δ::Ste3pr-LEU2 his3::hisG leu2Δ0 ura3Δ0
Boone Lab
SY4512 4316 ydr049wΔ::kanr This Study
SY4513 4316 ydr043cΔ::kanr This Study
SY4514 4316 yfl033cΔ::kanr This Study
SY4515 4316 yir026cΔ::kanr This Study
SY4516 4316 yor005cΔ::kanr This Study
SY4517 4316 yol114cΔ::kanr This Study
SY4518 4316 ypr098cΔ::kanr This Study
SY4519 4316 ybl103cΔ::kanr This Study
SY4520 4316 yol109wΔ::kanr This Study
SY4521 4316 yol156wΔ::kanr This Study
SY4522 4316 ybr083wΔ::kanr This Study
SY4523 4316 yil151cΔ::kanr This Study
SY4524 4316 ygr271c-AΔ::kanr This Study
SY4525 4316 yjr096wΔ::kanr This Study
SY4526 4316 ymr115wΔ::kanr This Study
SY4527 4316 ybr121cΔ::kanr This Study
SY4528 4316 ypr058wΔ::kanr This Study
SY4529 4316 ynl109wΔ::kanr This Study
SY4530 4316 ynl108cΔ::kanr This Study
SY4531 4316 yfr036wΔ::kanr This Study

37
Table 4-Plasmids
Plasmid Description Source
CY751 pΔSS CYC1-lacZ Johnson and Herskowitz 1985
CY4016 pΔSS STL1-lacZ This Study
CY1845 FUS1-HIS3 Horecka and Sprague 2000
CY4040 STL1-HIS3 This Study
CY3964 pAG25 natMX4 Goldstein et al 1999
S3454 HIS3-HA-natr Stevens Lab
CY4041 STL1-HIS3-HA-natr This Study
CY1464 pRS316 ATCC
[36] [32] [37]

38
REFERENCES CITED
1. Klein, S., H. Reuveni, and A. Levitzki, Signal transduction by a nondissociable heterotrimeric yeast G protein. Proceedings of the National Academy of Sciences of the United States of America, 2000. 97(7): p. 3219-3223.
2. Chen, R.E. and J. Thorner, Function and regulation in MAPK signaling
pathways: Lessons learned from the yeast Saccharomyces cerevisiae. Biochimica et Biophysica Acta (BBA) - Molecular Cell Research, 2007. 1773(8): p. 1311-1340.
3. Tatebayashi, K., et al., Transmembrane mucins Hkr1 and Msb2 are putative
osmosensors in the SHO1 branch of yeast HOG pathway. EMBO J, 2007. 26(15): p. 3521-3533.
4. Alepuz, P.M., et al., Stress-Induced MAP Kinase Hog1 Is Part of Transcription
Activation Complexes. Molecular cell, 2001. 7(4): p. 767-777. 5. Gimeno, C.J., et al., Unipolar cell divisions in the yeast S. cerevisiae lead to
filamentous growth: Regulation by starvation and RAS. Cell, 1992. 68(6): p. 1077-1090.
6. Cullen, P.J. and G.F. Sprague, Glucose depletion causes haploid invasive growth
in yeast. Proceedings of the National Academy of Sciences of the United States of America, 2000. 97(25): p. 13619-13624.
7. Lo, W.-S. and A.M. Dranginis, The Cell Surface Flocculin Flo11 Is Required for
Pseudohyphae Formation and Invasion by Saccharomyces cerevisiae. Mol. Biol. Cell, 1998. 9(1): p. 161-171.
8. Lorenz, M.C., N.S. Cutler, and J. Heitman, Characterization of Alcohol-induced
Filamentous Growth in Saccharomyces cerevisiae. Mol. Biol. Cell, 2000. 11(1): p. 183-199.
9. Sengupta, N., P.K. Vinod, and K.V. Venkatesh, Crosstalk between cAMP-PKA
and MAP kinase pathways is a key regulatory design necessary to regulate FLO11 expression. Biophysical Chemistry, 2007. 125(1): p. 59-71.
10. Cullen, P.J., et al., A signaling mucin at the head of the Cdc42- and MAPK-
dependent filamentous growth pathway in yeast. Genes & Development, 2004. 18(14): p. 1695-1708.

39
11. Vadaie, N., et al., Cleavage of the signaling mucin Msb2 by the aspartyl protease Yps1 is required for MAPK activation in yeast. The Journal of Cell Biology, 2008. 181(7): p. 1073-1081.
12. Cook, J.G., et al., Two novel targets of the MAP kinase Kss1 are negative
regulators of invasive growth in the yeast Saccharomyces cerevisiae. Genes & Development, 1996. 10(22): p. 2831-2848.
13. Bardwell, L., et al., Differential regulation of transcription: Repression by
unactivated mitogen-activated protein kinase Kss1 requires the Dig1 and Dig2 proteins. Proceedings of the National Academy of Sciences of the United States of America, 1998. 95(26): p. 15400-15405.
14. Madhani, H.D. and G.R. Fink, Combinatorial Control Required for the Specificity
of Yeast MAPK Signaling. Science, 1997. 275(5304): p. 1314-1317. 15. Chol, K.-Y., et al., Ste5 tethers multiple protein kinases in the MAP kinase
cascade required for mating in S. cerevisiae. Cell, 1994. 78(3): p. 499-512. 16. Printen, J.A. and G.F. Sprague-Jr., Protein-Protein Interactions in the Yeast
Pheromone Response Pathway: Ste5p Interacts With All Members of the MAP Kinase Cascade. Genetics, 1994. 138(3): p. 609-619.
17. Good, M., et al., The Ste5 Scaffold Directs Mating Signaling by Catalytically
Unlocking the Fus3 MAP Kinase for Activation. Cell, 2009. 136(6): p. 1085-1097. 18. Dard, N. and M. Peter, Scaffold proteins in MAP kinase signaling: more than
simple passive activating platforms. BioEssays, 2006. 28(2): p. 146-156. 19. Bao, M.Z., et al., Pheromone-Dependent Destruction of the Tec1 Transcription
Factor Is Required for MAP Kinase Signaling Specificity in Yeast. 2004. 119(7): p. 991-1000.
20. Chou, S., L. Huang, and H. Liu, Fus3-Regulated Tec1 Degradation through
SCFCdc4 Determines MAPK Signaling Specificity during Mating in Yeast. Cell, 2004. 119(7): p. 981-990.
21. Posas, F., Osmotic activation of the HOG MAPK pathway via Ste11p MAPKKK:
scaffold role of Pbs2p MAPKK. Science, 1997. 276(5319). 22. Westfall, P.J. and J. Thorner, Analysis of Mitogen-Activated Protein Kinase
Signaling Specificity in Response to Hyperosmotic Stress: Use of an Analog-Sensitive HOG1 Allele. Eukaryotic Cell, 2006. 5(8): p. 1215-1228.
23. Shock, T.R., et al., Hog1 Mitogen-Activated Protein Kinase (MAPK) Interrupts
Signal Transduction between the Kss1 MAPK and the Tec1 Transcription Factor To Maintain Pathway Specificity. Eukaryotic Cell, 2009. 8(4): p. 606-616.
40
24. O'Rourke, S.M. and I. Herskowitz, A Third Osmosensing Branch in Saccharomyces cerevisiae Requires the Msb2 Protein and Functions in Parallel with the Sho1 Branch. Mol. Cell. Biol., 2002. 22(13): p. 4739-4749.
25. Posas, F., et al., The Transcriptional Response of Yeast to Saline Stress. Journal of
Biological Chemistry, 2000. 275(23): p. 17249-17255. 26. Klopotowski T, W.A., Synergism of aminotriazole and phosphate on the
inhibition of yeast imidazole glycerol phosphate dehydratase. Archives of Biochemistry and Biophysics, 1965. 112(3).
27. Davis, K.S.a.R.W., Production of a functional eukaryotic enzyme in Escherichia
coli: cloning and expression of the yeast structural gene for imidazole-glycerolphosphate dehydratase (his3). PNAS, 1977. 74(12).
28. Berkey, C.D., V.K. Vyas, and M. Carlson, Nrg1 and Nrg2 Transcriptional
Repressors Are Differently Regulated in Response to Carbon Source. Eukaryotic Cell, 2004. 3(2): p. 311-317.
29. Kuchin, S., V.K. Vyas, and M. Carlson, Snf1 Protein Kinase and the Repressors
Nrg1 and Nrg2 Regulate FLO11, Haploid Invasive Growth, and Diploid Pseudohyphal Differentiation. Mol. Cell. Biol., 2002. 22(12): p. 3994-4000.
30. Berkey, C. and M. Carlson, A specific catalytic subunit isoform of protein kinase
CK2 is required for phosphorylation of the repressor Nrg1 in <i>Saccharomyces cerevisiae</i>. Current Genetics, 2006. 50(1): p. 1-10.
31. Dan Burke, D.D., Tim Stearns, Methods in Yeast Genetics, 2000. 32. Jr., H.J.a.S.G., Use of imidazoleglycerolphosphate dehydratase (His3) as a
biological reporter in yeast. Methods in Enzymology, 2000. 326. 33. Longtine, M.S., et al., Additional modules for versatile and economical PCR-
based gene deletion and modification in Saccharomyces cerevisiae. Yeast, 1998. 14(10): p. 953-961.
34. Tong, A.H.Y., et al., Systematic Genetic Analysis with Ordered Arrays of Yeast
Deletion Mutants. Science, 2001. 294(5550): p. 2364-2368. 35. Lawrence, C.W., Classical Mutagenesis Techniques. Methods in Enzymology-
Guide to Yeast Genetics and Molecular Biology 1991. 194. 36. Johnson, A.D. and I. Herskowitz, A repressor (MAT±2 product) and its operator
control expression of a set of cell type specific genes in yeast. Cell, 1985. 42(1): p. 237-247.

41
37. Goldstein, A.L. and J.H. McCusker, Three new dominant drug resistance cassettes for gene disruption in Saccharomyces cerevisiae. Yeast, 1999. 15(14): p. 1541-1553.