sigma no 1/2012 - swiss re · 2019-12-12 · swiss re, sigma no 1/2012 3 life insurance today plays...
TRANSCRIPT
sigmaNo 1/2012
Understanding profitability in life insurance
1 Executive summary
2 Introduction: life insurance today
4 Historic trends in life profitability
12 Measuring profitability
21 Zooming in on product preformance
31 Conclusion

Published by:Swiss Reinsurance Company LtdEconomic Research & ConsultingP.O. Box 8022 ZurichSwitzerland
Telephone +41 43 285 2551Fax +41 43 282 0075E-mail: [email protected]
New York Office:55 East 52nd Street41st FloorNew York, NY 10055
Telephone +1 212 317 5400Fax +1 212 317 5455
Hong Kong Office:18 Harbour Road, WanchaiCentral Plaza, 61st FloorHong Kong, SAR
Telephone + 852 25 82 5703Fax + 852 25 11 6603
Authors:Dr Milka KirovaTelephone +1 212 317 5639
Dr Lukas SteinmannTelephone +41 43 285 4687
Editor:Jessica VillatTelephone +41 43 285 5189
Managing editor:Dr Kurt Karl, Head of Economic Research & Consulting, is responsible for the sigma series.
The editorial deadline for this study was 31 December 2011.
sigma is available in English (original language), German, French, Spanish, Chinese and Japanese.
sigma is available on Swiss Re’s website: www.swissre.com/sigma
The internet version may contain slightly updated information.
Translations:CLS Communication
Graphic design and production:Swiss Re Logistics / Media Production
© 2012Swiss Reinsurance Company LtdAll rights reserved.
The entire content of this sigma edition is subject to copyright with all rights reserved. The information may be used for private or internal purposes, provided that any copyright or other proprietary notices are not removed. Electronic reuse of the data published in sigma is prohibited.
Reproduction in whole or in part or use for any public purpose is permitted only with the prior written approval of Swiss Re Economic Research & Consulting and if the source reference “Swiss Re, sigma No 1/2012” is indicated. Courtesy copies are appreciated.
Although all the information used in this study was taken from reliable sources, Swiss Reinsurance Company does not accept any responsibility for the accuracy or com-prehensiveness of the information given. The information provided is for informational purposes only and in no way constitutes Swiss Re’s position. In no event shall Swiss Re be liable for any loss or damage arising in connection with the use of this information.
Order no: 270_0112_en

1Swiss Re, sigma No 1/2012
Life insurers create value through insurance and investment operations. There are three principle sources of profits — underwriting results, investment results, and fee income. The underwriting result, although variable over time, is typically a less volatile contribu-tor to earnings than the investment result. Fees for managing policyholder assets fluctuate with the value of assets under management and tend to be more volatile. Investment returns are correlated with financial market performance, which can be extremely volatile in tumultuous times.
Once focused mainly on death protection, life insurers today offer coverage for a spec-trum of life (ie mortality, morbidity and longevity) and financial market risks. Profitability drivers vary considerably per product type. Some products insure mainly life risks. For these products, earnings depend on underwriting performance and investment returns, which are particularly important for the profitability of long-term products. For guaran-teed savings products, investment income is most important. For savings products with no minimum investment guarantee and limited life risk, such as unit-linked policies or variable life contracts, fee income is the main profit driver.
An overview of trends in life insurers’ earnings based on statutory and GAAP/IFRS accounting data reveals that profitability suffers when economic and financial market conditions weaken.1 Volatility in operating performance has stemmed mostly from savings business and exposure to financial guarantees, while life risk products have delivered relatively stable returns over the past ten years. Investment results, which are a key source of earnings for many life insurers, have suffered from declining investment returns over the past decade, making it challenging to earn the return promised to poli-cyholders. The decline in fixed-income yields poses risks to companies with asset-liabil-ity duration mismatches that have sold products with high guarantees. Fee income has increased in importance, due largely to the rapid growth of unit-linked business in many markets.
The ultimate profitability of life insurance policies sold in a given year is subject to a number of variables that take many years to surface. This creates significant complexity for reporting financial results on a regular basis. The accounting-based indicators re-viewed in this sigma generally provide a high-level picture of life insurers’ historical per-formance, but have limitations. Current statutory and GAAP/IFRS accounting-based profitability indicators fail to fully capture the long-term nature of life insurance opera-tions. In addition, comparisons across countries and companies are hampered due to differences in rules and practices between statutory, local GAAP and IFRS accounting.
As a result, some life companies have developed supplementary reporting tools that overcome the shortcomings of statutory and GAAP/IFRS accounting. These embedded value concepts seek to quantify future cash flows of insurance products and the cost of capital for business lines with varying risk profiles. While these concepts are indispen-sable for internal purposes, they have not gained acceptance among investors every-where. This reveals a fundamental problem the life industry must address: investors and top management do not “look through the same lens” when evaluating life insurance operations. It is hence not surprising that investors struggle to understand how profits emerge in life insurance, reducing their willingness to provide capital. The insurance in-dustry should thus promote these concepts and educate investors and, finally, comply with them – in good times and bad.
The latest financial crisis reminded us all that life insurers are not immune to financial market disturbances and the economic cycle. Going forward, more emphasis should be given to product design, pricing, asset-liability management and risk management. Guarantees should be designed in a way that allows hedging at reasonable costs. Some long-term guarantees may prove overly costly and erode profitability, so must be pro-vided only in limited quantities or at appropriate prices.
1 In this sigma accounting refers to statutory accounting and local GAAP or IFRS, as opposed to embedded value concepts.
Life insurers’ earnings are derived from insurance and investment operations.
Earnings drivers vary by product.
An overview of profitability trends in this sigma is based on accounting data.
Reporting profitability of long-term business is challenging.
Embedded value based reporting provides valuable information on value creation and is an indispensable tool for decision making.
The financial crisis revealed product design and risk management deficiencies.
Executive summary

Swiss Re, sigma No 1/20122
Introduction: life insurance today
Life insurance records date back as far as 2500 BC, when stonemasons in Lower Egypt formed funeral cooperatives to provide support in case of the death of a member. These benevolent societies or burial clubs, as they were called, were also common in India around 1000 BC and in ancient Rome. Much later, in the seventeenth century, modern life insurance came into existence. Simple term life contracts were developed and the first modern life insurance company was formed in England in the eighteenth century.
Originally, life insurance’s main value proposition was death protection.2 Today, life insurers offer products that cover many risks, such as the risk of losing the physical capacity to earn one’s living (disability insurance), critical illness, healthcare3 and long-term care costs (medical and LTC insurance). The life insurance industry is also active in helping individuals finance retirement (pension, annuity and savings products)4, and contributes to economic welfare and stability by pooling and offering protection against the financial consequences of individuals’ life risks. Figure 1 illustrates the life insurance product mix in select major markets.
0%
20%
40%
60%
80%
100%
Accident & HealthSavings
ProtectionPension & Annuity
2010200520001995
0%
20%
40%
60%
80%
100%
Accident & Health Annuity Life201020052000199519901985
0%
20%
40%
60%
80%
100%
Accident & HealthSavings
ProtectionPension & Annuity
20102005200019951990
0%
20%
40%
60%
80%
100%
Accident & Health Group Life Individual LifeGroup Annuity Individual Annuity
20102005200019951990
Germany United Kingdom
United States Japan
Note: Premium split by business line is presented as reported in life insurers’ statutory filings. Categories vary by country and include the following products: for Germany, “savings” (endowments), “pension and annuities” (pension and annuity insurance), “protection” (term assurance, mortgage redemption insurance, and payment protection insurance/credit life insurance), and “accident and health” (disability insurance, long-term care insurance). For the UK, “savings” (investment bonds, endowments), “pension and annuities” (individual and group pensions, retirement income products), “protection” (term assurance, group life), “accident and health” (individual and group income protection). For the US, “life” (individual and group term, whole life, universal life, and variable universal life), “annuity” (individual and group, deferred and immediate fixed and variable annuity) “accident and health” (individual and group disability, long-term care, critical illness, and medical indemnity insurance). For Japan, “life” (individual and group term, whole life, endowments, group credit life), “annuity” (individual fixed and variable annuities, group annuities), “accident and health” (medical insurance, cancer insurance, disability insurance, nursing care and juvenile insurance). Sources: Supervisory authorities, insurance associations, Swiss Re Economic Research & Consulting
2 See sigma 4/2004, Mortality protection: the core of life.3 See sigma 6/2007, To your health: diagnosing the state of healthcare and the global private medical
insurance industry.4 See sigma 3/2007, Annuities: a private solution to longevity risk, and sigma 4/2008, Innovative ways
of financing retirement.
Life insurance can be traced back to ancient times.
Modern life insurance covers a variety of risks other than death protection.
Figure 1: Life product mix in major insurance markets, split by premiums

3Swiss Re, sigma No 1/2012
Life insurance today plays an important role in society and the global economy. Global life premiums rose 5% in real terms over the last three decades, reaching USD 2.4 trillion in 2010, or over 3.8% of global gross domestic product (GDP). Life companies are important institutional investors, managing investments of around USD 21.5 trillion in 2010, or roughly 10% of total global investments.
Understanding how the life industry is performing is important for all stakeholders. Investors need to understand profitability to assess investment decisions, judge management and efficiently allocate capital. Policyholders and regulators have a vested interest in the financial viability of life insurers and their ability to pay claims and share earnings through profit-participation features. The financial stability of insurers is also important for society, especially in areas where private life insurance substitutes or complements public social safety provisions. For management, accurately reporting and understanding profitability in various business lines and markets is critical for business steering.
Unlike many other industries, life insurance is a business with long-term products and services whose profitability cannot be measured without a long-term lens. Current real-ised cash flows only provide a narrow and incomplete picture of value creation and profitability. Insurers monitor and manage performance on an ongoing basis, but be-cause life insurance policies normally remain in force for many years, and sometimes decades, the ultimate profitability of the business is only known years later when all policy obligations have been fulfilled.
Life industry stakeholders need regular updates to understand business performance and the quality and sustainability of earnings. However, different profitability measures are used by different stakeholders for different purposes. Currently, stakeholders rely on a wide array of information to obtain a relatively good understanding of competitiveness and operating performance.
The next chapter reviews the historic trends in life performance based on commonly used metrics and discusses the benefits and limits of the accounting approach for tracking profitability. The report then explores embedded value concepts used to meas-ure the value of life insurance business and its profitability. Before drawing final conclu-sions, the study provides an overview of today’s life insurance products and highlights the differences in profitability drivers and patterns depending on product type.
Global life insurance premiums constitute a staggering 4% of world GDP.
Why try to understand profitability?
Because life insurance is a long-term business ...
... it requires multiple measures to complete the profitability picture.
The structure of this sigma.
Swiss Re, sigma No 1/20124
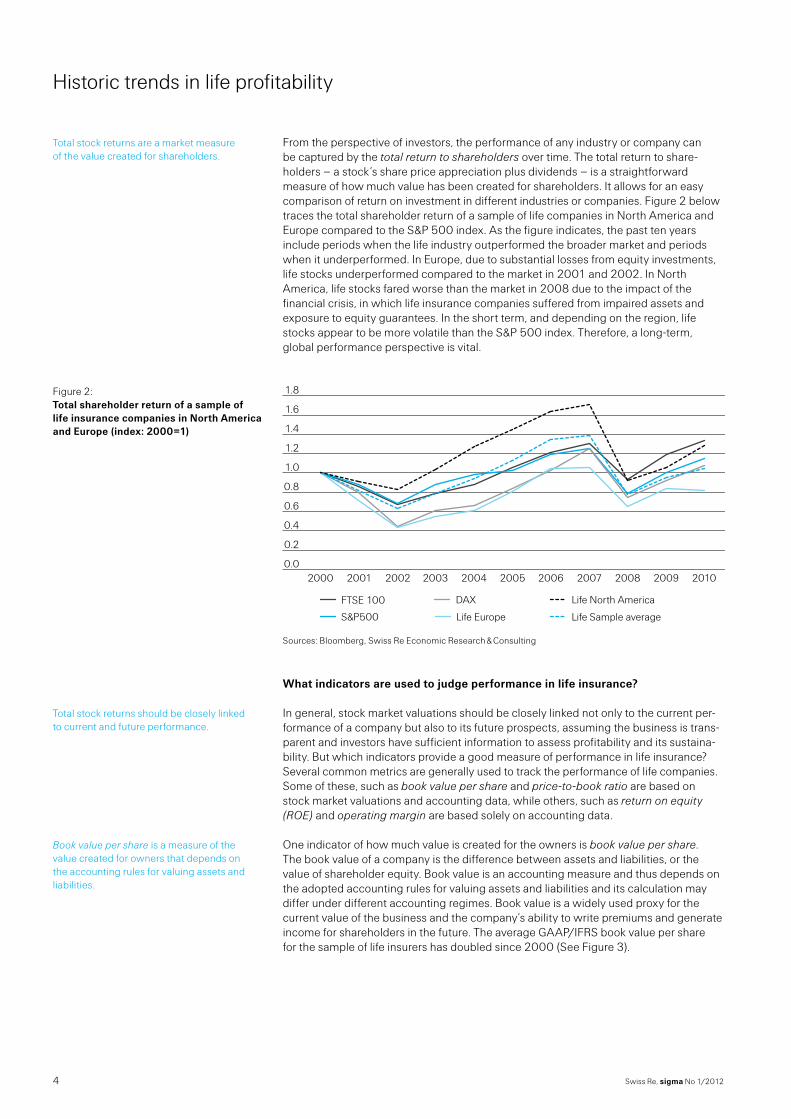
From the perspective of investors, the performance of any industry or company can be captured by the total return to shareholders over time. The total return to share-holders – a stock’s share price appreciation plus dividends – is a straightforward measure of how much value has been created for shareholders. It allows for an easy comparison of return on investment in different industries or companies. Figure 2 below traces the total shareholder return of a sample of life companies in North America and Europe compared to the S&P 500 index. As the figure indicates, the past ten years include periods when the life industry outperformed the broader market and periods when it underperformed. In Europe, due to substantial losses from equity investments, life stocks underperformed compared to the market in 2001 and 2002. In North America, life stocks fared worse than the market in 2008 due to the impact of the financial crisis, in which life insurance companies suffered from impaired assets and exposure to equity guarantees. In the short term, and depending on the region, life stocks appear to be more volatile than the S&P 500 index. Therefore, a long-term, global performance perspective is vital.
0.0
0.2
0.4
0.6
0.8
1.0
1.2
1.4
1.6
1.8
FTSE 100
S&P500
DAX
Life Europe
Life North America
Life Sample average
20102009200820072006200520042003200220012000
Sources: Bloomberg, Swiss Re Economic Research & Consulting
What indicators are used to judge performance in life insurance?
In general, stock market valuations should be closely linked not only to the current per-formance of a company but also to its future prospects, assuming the business is trans-parent and investors have sufficient information to assess profitability and its sustaina-bility. But which indicators provide a good measure of performance in life insurance? Several common metrics are generally used to track the performance of life companies. Some of these, such as book value per share and price-to-book ratio are based on stock market valuations and accounting data, while others, such as return on equity (ROE) and operating margin are based solely on accounting data.
One indicator of how much value is created for the owners is book value per share. The book value of a company is the difference between assets and liabilities, or the value of shareholder equity. Book value is an accounting measure and thus depends on the adopted accounting rules for valuing assets and liabilities and its calculation may differ under different accounting regimes. Book value is a widely used proxy for the current value of the business and the company’s ability to write premiums and generate income for shareholders in the future. The average GAAP/IFRS book value per share for the sample of life insurers has doubled since 2000 (See Figure 3).
Total stock returns are a market measure of the value created for shareholders.
Figure 2: Total shareholder return of a sample of life insurance companies in North America and Europe (index: 2000=1)
Total stock returns should be closely linked to current and future performance.
Book value per share is a measure of the value created for owners that depends on the accounting rules for valuing assets and liabilities.
Historic trends in life profitability

5Swiss Re, sigma No 1/2012
A key driver of the strong rebound in book value following the latest financial crisis was the decline in interest rates and credit spread, which boosted the market value of bond investments. In US GAAP and IFRS (for those IFRS companies that apply US GAAP for their insurance liabilities5) accounting, a decline in interest rates increases the value of bonds since they are marked to market, while the value of liabilities is unaltered.6 If both assets and liabilities were measured at market value and assets and liabilities were du-ration matched, the net impact on book value should be zero. Hence, book value may be a misleading indicator given the current GAAP/IFRS accounting rules.
0.0
0.5
1.0
1.5
2.0
2.5
3.0
Life EuropeLife North AmericaLife Sample average
20102009200820072006200520042003200220012000
Sources: Bloomberg, Swiss Re Economic Research & Consulting
Developments in life insurers’ stock market values relative to their book values are rep-resented by the price-to-book ratio. Figure 4 traces the changes in the average price-to-book ratio for the sample of life companies from 2000 to 2010. The ratio shows that market valuations have fallen behind book values. The life average price-to-book ratio declined steeply during the crises in 2001–2002 and 2008, falling from three in 2000 to nearly one in 2010.
Possible explanations for this decline include investor exuberance in 2000 and scepti-cism about book values in 2010. Life insurers weathered the latest financial crisis with-out any major solvency issues, but the impact of the crisis on the industry weighed on investors’ confidence. Investors today may have lingering doubts that life insurers will be able to achieve attractive earnings if interest rates remain low for a prolonged peri-od. Also, life companies may not have fully realised all coming losses on the asset side of their balance sheets, in particular for residential and commercial real estate in the US and downgraded sovereign debt in Europe. Moreover, as already noted, GAAP and IFRS book values have been boosted by the impact of historically low interest rates on mark-to-market asset valuations, while liabilities stemming from times of high interest rates may eventually result in losses going forward. It could also indicate that investors mistrust GAAP and IFRS figures and make their buy/sell decisions based on a more economic evaluation.
5 Under IFRS (more specifically IFRS 4 Insurance Contracts), there is no specific guidance on the valuation of insurance liabilities. Therefore, companies apply either local or US GAAP until the implementation of IFRS 4 Phase 2.
6 Under US GAAP, reserves are reported at book value (ie mortality, morbidity, expected investment yields, surrenders, and expenses assumed at the policy inception date remain locked in thereafter unless a reserve deficiency occurs).
The decline in interest rates has increased book value.
Figure 3: Book value per share of a sample of life companies in North America and Europe (index: 2000=1)
Price-to-book ratios show the developments in life insurers’ stock market values relative to their book values.
Many factors have contributed to the decline in the price-to-book ratios.
Swiss Re, sigma No 1/20126
Historic trends in life profitability
1.0
1.5
2.0
2.5
3.0
Life EuropeLife North AmericaLife Sample average
20102009200820072006200520042003200220012000
Sources: Bloomberg, Swiss Re Economic Research & Consulting
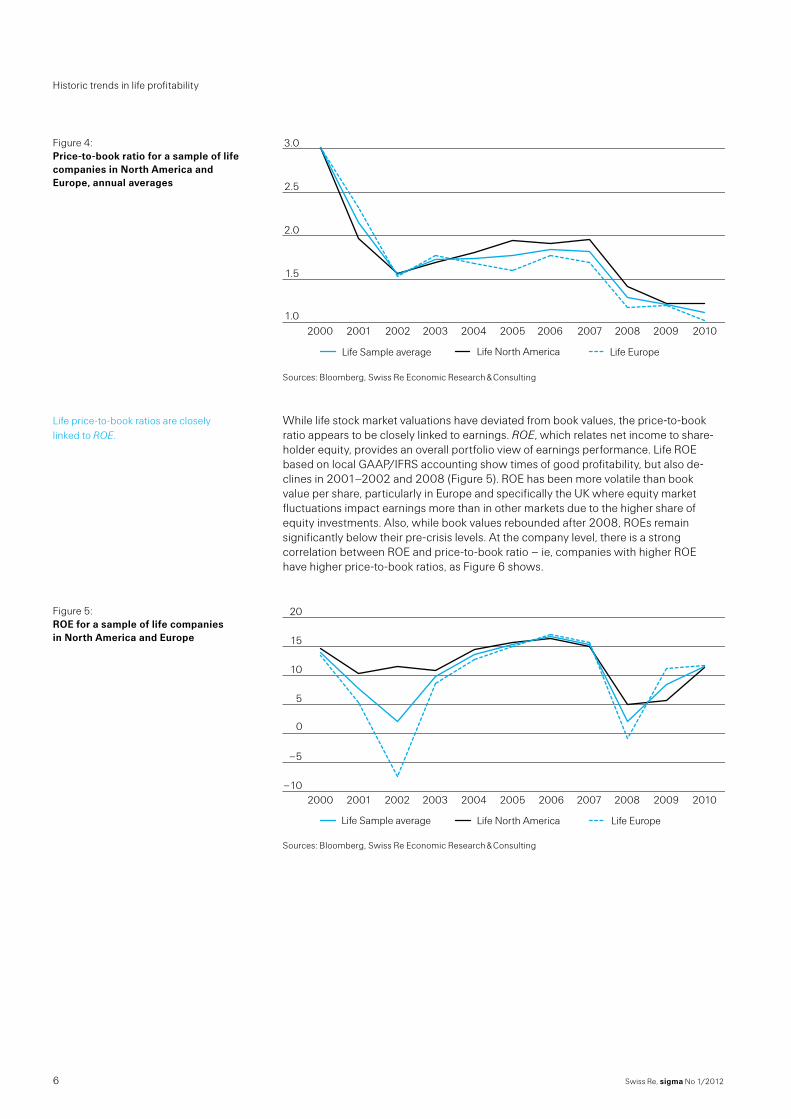
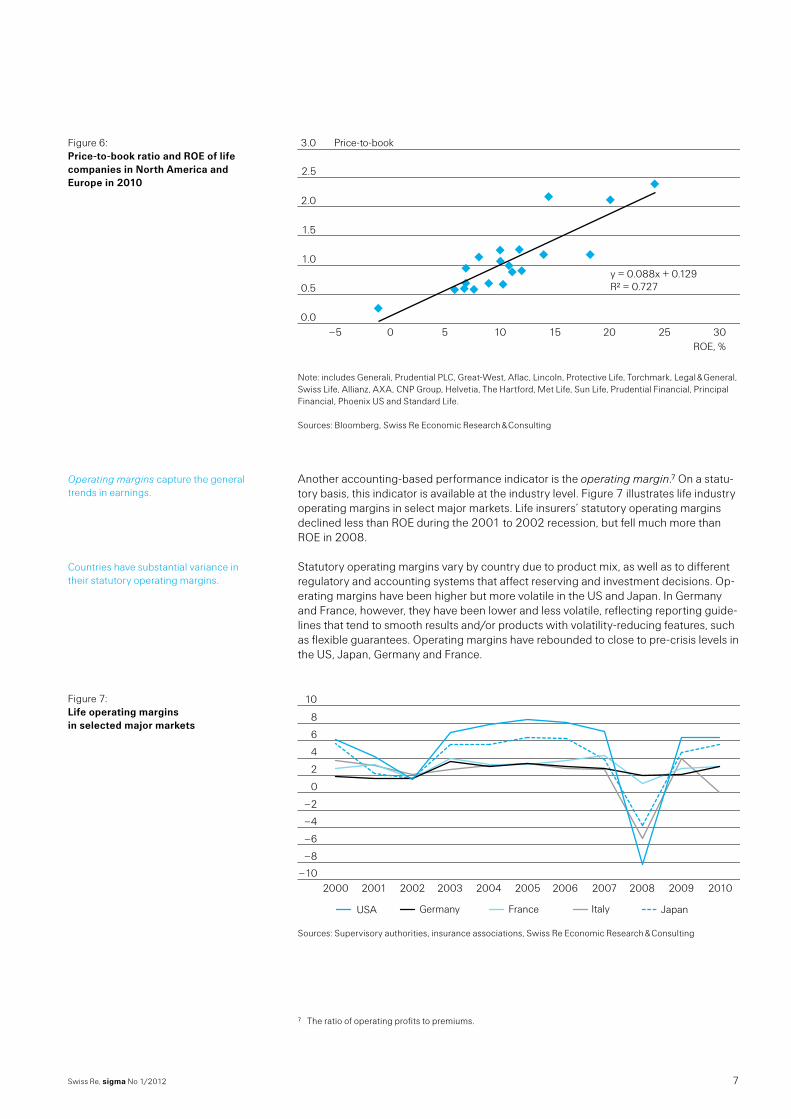
While life stock market valuations have deviated from book values, the price-to-book ratio appears to be closely linked to earnings. ROE, which relates net income to share-holder equity, provides an overall portfolio view of earnings performance. Life ROE based on local GAAP/IFRS accounting show times of good profitability, but also de-clines in 2001–2002 and 2008 (Figure 5). ROE has been more volatile than book value per share, particularly in Europe and specifically the UK where equity market fluctuations impact earnings more than in other markets due to the higher share of equity investments. Also, while book values rebounded after 2008, ROEs remain significantly below their pre-crisis levels. At the company level, there is a strong correlation between ROE and price-to-book ratio – ie, companies with higher ROE have higher price-to-book ratios, as Figure 6 shows.
–10
–5
0
5
10
15
20
Life EuropeLife North AmericaLife Sample average
20102009200820072006200520042003200220012000
Sources: Bloomberg, Swiss Re Economic Research & Consulting
Figure 4: Price-to-book ratio for a sample of life companies in North America and Europe, annual averages
Life price-to-book ratios are closely linked to ROE.
Figure 5: ROE for a sample of life companies in North America and Europe
7Swiss Re, sigma No 1/2012
3.0
2.5
2.0
1.5
1.0
0.5
–5 0 5 10 15 20 25 300.0
Price-to-book
ROE, %
y = 0.088x + 0.129R² = 0.727
Note: includes Generali, Prudential PLC, Great-West, Aflac, Lincoln, Protective Life, Torchmark, Legal & General, Swiss Life, Allianz, AXA, CNP Group, Helvetia, The Hartford, Met Life, Sun Life, Prudential Financial, Principal Financial, Phoenix US and Standard Life. Sources: Bloomberg, Swiss Re Economic Research & Consulting
Another accounting-based performance indicator is the operating margin.7 On a statu-tory basis, this indicator is available at the industry level. Figure 7 illustrates life industry operating margins in select major markets. Life insurers’ statutory operating margins declined less than ROE during the 2001 to 2002 recession, but fell much more than ROE in 2008.
Statutory operating margins vary by country due to product mix, as well as to different regulatory and accounting systems that affect reserving and investment decisions. Op-erating margins have been higher but more volatile in the US and Japan. In Germany and France, however, they have been lower and less volatile, reflecting reporting guide-lines that tend to smooth results and/or products with volatility-reducing features, such as flexible guarantees. Operating margins have rebounded to close to pre-crisis levels in the US, Japan, Germany and France.
–10
–8
–6
–4
–2
0
2
4
6
8
10
JapanItalyFranceGermanyUSA
20102009200820072006200520042003200220012000
Sources: Supervisory authorities, insurance associations, Swiss Re Economic Research & Consulting
7 The ratio of operating profits to premiums.
Figure 6: Price-to-book ratio and ROE of life companies in North America and Europe in 2010
Operating margins capture the general trends in earnings.
Countries have substantial variance in their statutory operating margins.
Figure 7: Life operating margins in selected major markets

Swiss Re, sigma No 1/20128
Historic trends in life profitability
The benefits and limits of accounting-based measures for profitability
The accounting-based indicators reviewed above — ROE and operating margin — pro-vide a high-level picture of life insurers’ historical performance and capture the general trends in profitability. Other accounting-based performance metrics are also used. One advantage of the accounting indicators is that they rely on publicly available, reported data determined by accounting rules. However, these metrics also have deficiencies. Indeed, while there are some benefits, there are also significant limitations to the ac-counting approach.
Life companies are required by regulators to prepare statutory accounting reports. Public companies are also required to report financial results under local GAAP or IFRS. Both statutory and GAAP/IFRS filings contain balance sheet and profit and loss state-ments, providing information that can be used to assess profitability and the value of a company. In both statutory and GAAP/IFRS accounting, earnings are usually aggregated from the income and expenses of policies written in the current and past years.
Statutory accounting rules are developed with a focus primarily on solvency issues and the protection of policyholders’ interests, making sure that contract liabilities will be covered. There are variances in the degree of conservatism applied under different reg-ulatory regimes. In the US, for example, statutory accounting requires reserves to be set at conservative levels and all acquisition costs to be expensed immediately. In Canada and Switzerland, which have adopted principles-based approaches to reserving, statu-tory reserves are closer to reserves determined by economic principles. In Germany, statutory rules allow deferral of acquisition costs. Overall, statutory accounting is de-signed to assess the claims paying ability of the insurer, with less interest in income generation potential as a going concern.
GAAP and IFRS accounting is widely used by senior management, analysts and inves-tors to assess a life insurance company’s financial strength. Local GAAP and IFRS ac-counting rules try to match expenses with revenue and smooth profit patterns of life policies over the years they are in force. Sales commissions are capitalised as assets when policies are written through the deferred acquisition costs (DAC) mechanism and released as expenses over the life of the contract.8 In contrast to statutory accounting, liabilities for life products are based on best-estimate assumptions. Under US GAAP, provisions for adverse deviations are set at inception and adjusted only when forecasts for mortality, morbidity, and market variables change significantly. In other jurisdictions, GAAP requires insurers to update best estimate assumptions on a regular basis.
8 But as always in life insurance accounting, there are exceptions. For example, Japanese GAAP does not allow deferral of acquisition costs.
Accounting indicators can provide a high-level picture of historical performance, but they have serious limitations.
Accounting-based profitability measures rely on balance sheet and profit and loss accounts from statutory and GAAP/IFRS filings.
Statutory accounting is designed to focus on solvency.
GAAP/IFRS accounting aims to reflect income generation potential.
9Swiss Re, sigma No 1/2012
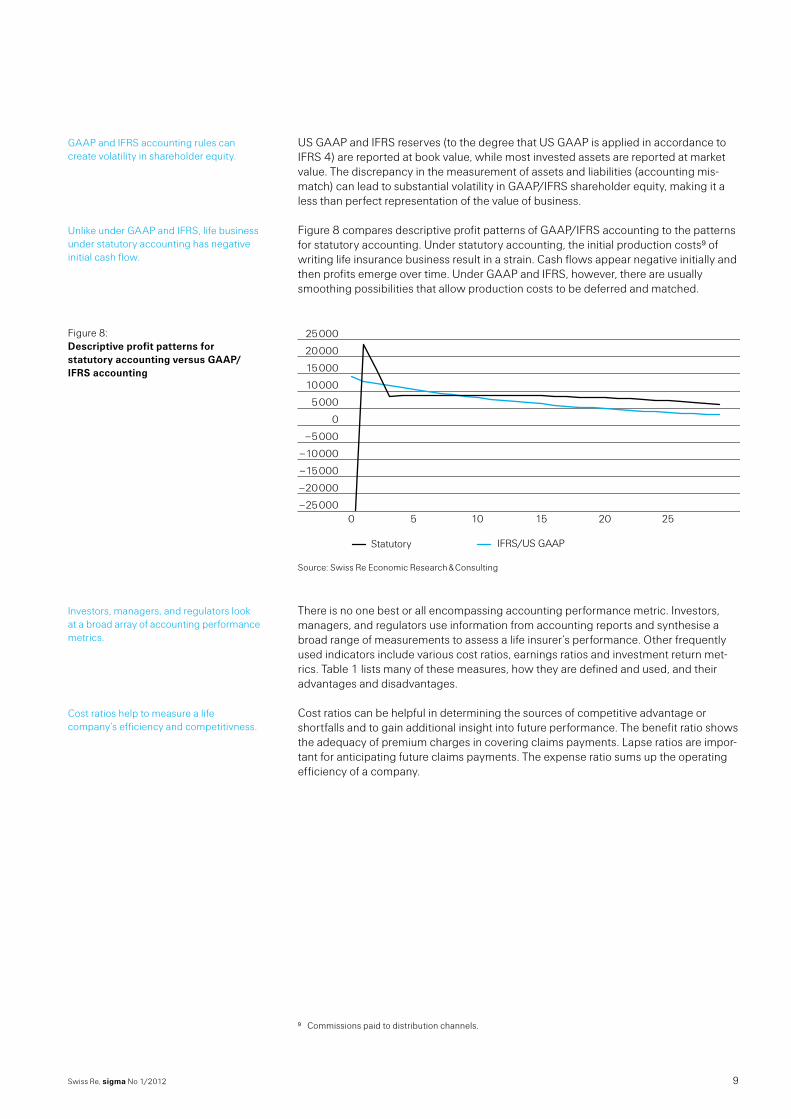
US GAAP and IFRS reserves (to the degree that US GAAP is applied in accordance to IFRS 4) are reported at book value, while most invested assets are reported at market value. The discrepancy in the measurement of assets and liabilities (accounting mis-match) can lead to substantial volatility in GAAP/IFRS shareholder equity, making it a less than perfect representation of the value of business.
Figure 8 compares descriptive profit patterns of GAAP/IFRS accounting to the patterns for statutory accounting. Under statutory accounting, the initial production costs9 of writing life insurance business result in a strain. Cash flows appear negative initially and then profits emerge over time. Under GAAP and IFRS, however, there are usually smoothing possibilities that allow production costs to be deferred and matched.
–25 000
–20 000
–15 000
–10 000
–5 000
0
5 000
10 000
15 000
20 000
25 000
IFRS/US GAAPStatutory
2520151050
Source: Swiss Re Economic Research & Consulting
There is no one best or all encompassing accounting performance metric. Investors, managers, and regulators use information from accounting reports and synthesise a broad range of measurements to assess a life insurer’s performance. Other frequently used indicators include various cost ratios, earnings ratios and investment return met-rics. Table 1 lists many of these measures, how they are defined and used, and their advantages and disadvantages.
Cost ratios can be helpful in determining the sources of competitive advantage or shortfalls and to gain additional insight into future performance. The benefit ratio shows the adequacy of premium charges in covering claims payments. Lapse ratios are impor-tant for anticipating future claims payments. The expense ratio sums up the operating efficiency of a company.
9 Commissions paid to distribution channels.
GAAP and IFRS accounting rules can create volatility in shareholder equity.
Unlike under GAAP and IFRS, life business under statutory accounting has negative initial cash flow.
Figure 8: Descriptive profit patterns for statutory accounting versus GAAP/IFRS accounting
Investors, managers, and regulators look at a broad array of accounting performance metrics.
Cost ratios help to measure a life company’s efficiency and competitivness.

Swiss Re, sigma No 1/201210
Historic trends in life profitability
Table 1: Accounting-based profitability indicators
Areas of use Definition Advantages10 Disadvantages11
Benefits ratio
Financial reporting
The ratio of policyholder benefits and changes in pro-visions to earned premiums, policy charges and fee in-come.
An indicator of mortality, morbidity or longevity claims trends; easy to understand.
Not always a valid representa-tion of claims expenses be-cause of the long-term nature of life business.
Lapse ratio
Pricing and reporting
The ratio of lapsed or surren-dered policies or face amount to total in-force poli-cies or face amount.
An indicator of persistency trends; important for net flows.
Interpretation and impact on profitability can vary depending on the product or the timing of the business.
General expense ratio
Financial reporting
The ratio of general operating expenses to net premiums.
Used to compare companies with regard to their costs, used as an efficiency indica-tor.
Product complexity affects the ratio, thus comparisons are meaningful only for companies with similar books of business.
Operating (or profit) margin
Pricing
The profit a company gener-ates per unit of premiums. It is calculated as operating profit/loss divided by net premiums.
Commonly used for life prod-ucts; allows an easy compar-ison across products.
Does not reflect the timing of profits or losses; cost of capital and the relative riskiness of the business are not taken into account.
Return on equity (ROE)
Financial reporting
Profit or loss attributable to owners/shareholders. Calcu-lated as profit/loss divided by shareholder equity.
Required by financial regula-tors for public companies; well-understood.
Provides an overall portfolio view but not a product view; values depend on target sur-plus and the period used to amortise acquisition costs; may fluctuate due to the dis-crepancies in the measurement of assets and liabilities under GAAP/IFRS.
Return on assets (ROA)
Pricing
Profit/loss relative to the to-tal assets of a company.
Commonly used for deferred annuities; easy to calculate.
Not suitable for mortality prod-ucts; may fluctuate due to the impact of valuing assets to market under GAAP/IFRS.
Net investment result
Financial reporting
The sum of investment in-come and realised invest-ment gains minus impair-ments. Also shown as a ratio to total invested assets.
An important source of earn-ings for life insurers, espe-cially companies with large savings/annuity business and certain health lines.
Less useful in evaluating busi-ness lines where investment performance is a minor source of income.
Source: Swiss Re Economic Research & Consulting
10 Based on publicly available data.11 The metrics are all not risk-adjusted.

11Swiss Re, sigma No 1/2012
Earnings ratios are important to judge the overall performance of the business in a giv-en year. ROE provides an overall view of profitability, but as with all accounting-based profitability indicators, it does not take into account the riskiness of the business. A higher ROE does not necessarily mean that an investment is more attractive to the in-vestor. This would be the case only where there were similar levels of risk. Operating (or profit) margin allows comparison of earnings relative to premiums across business or products lines. For annuity business, where earnings are generated predominantly from investment income and asset management fees, a more appropriate metric is re-turn on assets (ROA). Net investment result sums up the investment performance of a company and is an important indicator of its asset management capabilities. Investors, when allocating capital across the life insurance industry, follow these metrics over time and versus peers to assess whether an insurer is gaining or falling behind in performance.
Overall, performance metrics based on accounting data provide useful information, but also have limitations. As is evident from the myriad of metrics available, there is no one standard measure and the different options make it difficult for stakeholders to analyse data and communicate with each other. Accounting-based metrics reveal little about the profitability of old versus new business. Also, there is limited disclosure of perform-ance at the product level and few insights into a products’ risk profile and its conse-quences for future earnings. In addition, deviations from expectations in mortality or morbidity experience may be overlooked since assumptions are locked-in and revised infrequently, depending on the accounting standard.
Along with these deficits, comparisons across countries and companies are hampered due to differences in the rules and practices in statutory, local GAAP and even IFRS ac-counting. Together, these issues result in rather opaque profitability figures which make it challenging to draw conclusions about drivers and sources of profit. This is certainly not to the advantage of the insurance industry. If investors do not understand a busi-ness, they will require an additional risk premium for this opaqueness and insurers may find it hard to access capital at attractive terms.
Also missing from accounting-based metrics is an account for the cost of capital re-quired to support the business. All these limitations make it difficult for investors to truly understand and judge company earnings. However, a more forward-looking approach to measuring life insurance profitability and value creation for shareholders is available through the embedded value framework, which is discussed in the next section.
Earnings ratios can be used for cross-product comparisons or to judge asset management capabilities.
Performance metrics based on accounting data have limitations.
Also, accounting data make it difficult to compare across countries.
A more forward-looking approach to measuring performance is the embedded value framework.
Swiss Re, sigma No 1/201212
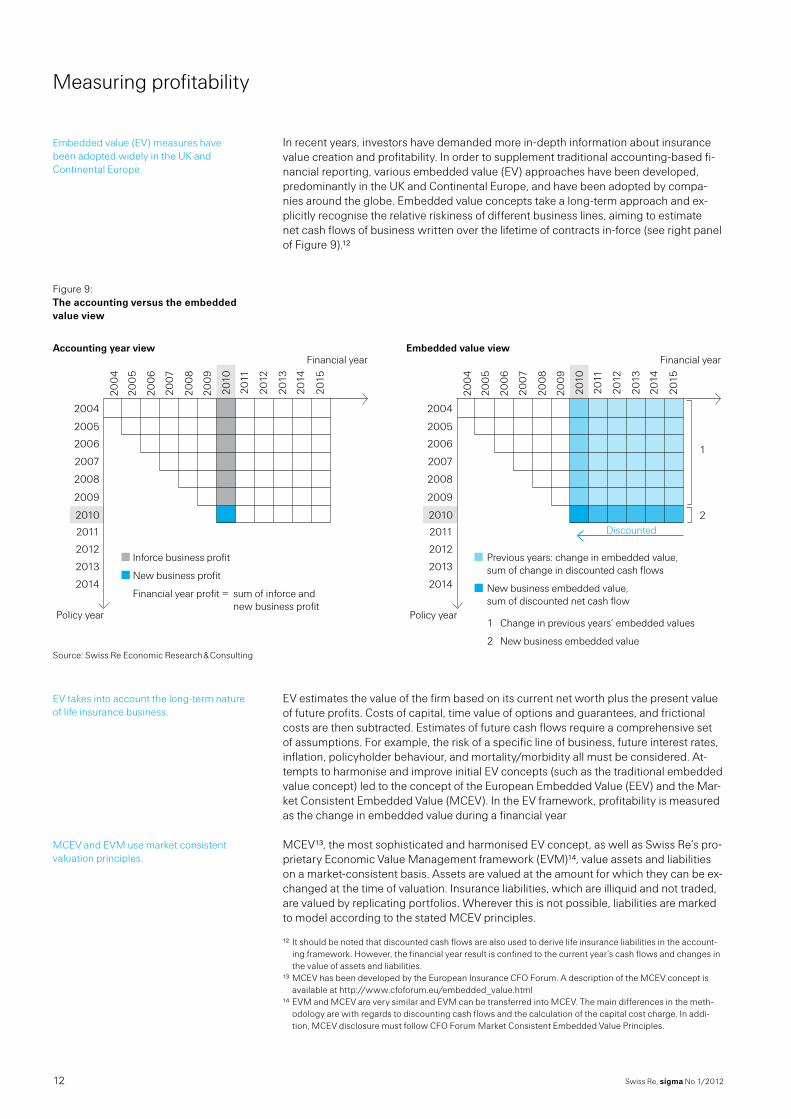
In recent years, investors have demanded more in-depth information about insurance value creation and profitability. In order to supplement traditional accounting-based fi-nancial reporting, various embedded value (EV) approaches have been developed, predominantly in the UK and Continental Europe, and have been adopted by compa-nies around the globe. Embedded value concepts take a long-term approach and ex-plicitly recognise the relative riskiness of different business lines, aiming to estimate net cash flows of business written over the lifetime of contracts in-force (see right panel of Figure 9).12
Financial year
Policy year
2004
2005
2006
2007
2008
2009
2010
2011
2012
2013
2014
200
4
200
5
200
6
2007
200
8
200
9
2010
2011
2012
2013
2014
2015
Accounting year viewFinancial year
Discounted
Policy year
2004
2005
2006
2007
2008
2009
2010
2011
2012
2013
2014
200
4
200
5
200
6
2007
200
8
200
9
2010
2011
2012
2013
2014
2015
Embedded value view
Inforce business profit
New business profit
Financial year profit = sum of inforce and new business profit
Previous years: change in embedded value, sum of change in discounted cash flows
New business embedded value, sum of discounted net cash flow
1 Change in previous years’ embedded values
2 New business embedded value
1
2
Source: Swiss Re Economic Research & Consulting
EV estimates the value of the firm based on its current net worth plus the present value of future profits. Costs of capital, time value of options and guarantees, and frictional costs are then subtracted. Estimates of future cash flows require a comprehensive set of assumptions. For example, the risk of a specific line of business, future interest rates, inflation, policyholder behaviour, and mortality/morbidity all must be considered. At-tempts to harmonise and improve initial EV concepts (such as the traditional embedded value concept) led to the concept of the European Embedded Value (EEV) and the Mar-ket Consistent Embedded Value (MCEV). In the EV framework, profitability is measured as the change in embedded value during a financial year
MCEV13, the most sophisticated and harmonised EV concept, as well as Swiss Re’s pro-prietary Economic Value Management framework (EVM)14, value assets and liabilities on a market-consistent basis. Assets are valued at the amount for which they can be ex-changed at the time of valuation. Insurance liabilities, which are illiquid and not traded, are valued by replicating portfolios. Wherever this is not possible, liabilities are marked to model according to the stated MCEV principles.
12 It should be noted that discounted cash flows are also used to derive life insurance liabilities in the account-ing framework. However, the financial year result is confined to the current year’s cash flows and changes in the value of assets and liabilities.
13 MCEV has been developed by the European Insurance CFO Forum. A description of the MCEV concept is available at http://www.cfoforum.eu/embedded_value.html
14 EVM and MCEV are very similar and EVM can be transferred into MCEV. The main differences in the meth-odology are with regards to discounting cash flows and the calculation of the capital cost charge. In addi-tion, MCEV disclosure must follow CFO Forum Market Consistent Embedded Value Principles.
Embedded value (EV) measures have been adopted widely in the UK and Continental Europe.
Figure 9: The accounting versus the embedded value view
EV takes into account the long-term nature of life insurance business.
MCEV and EVM use market consistent valuation principles.
Measuring profitability
13Swiss Re, sigma No 1/2012
Who’s winning the profitability indicator popularity contest?
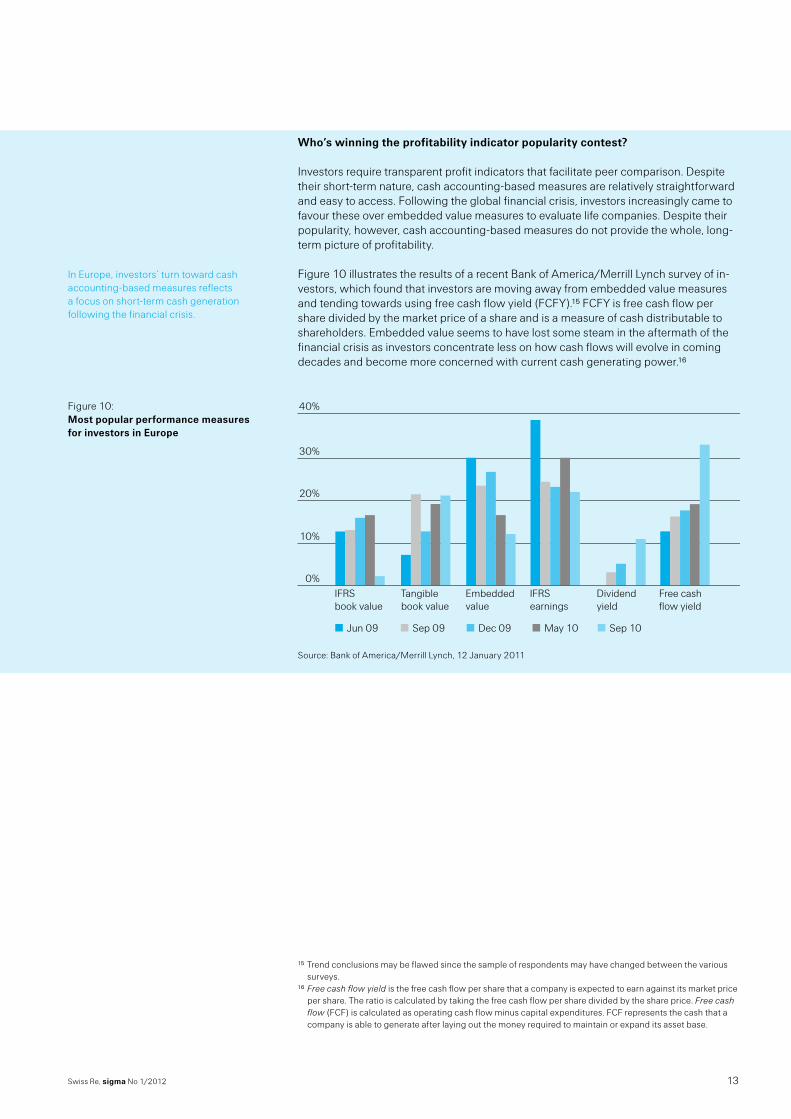
Investors require transparent profit indicators that facilitate peer comparison. Despite their short-term nature, cash accounting-based measures are relatively straightforward and easy to access. Following the global financial crisis, investors increasingly came to favour these over embedded value measures to evaluate life companies. Despite their popularity, however, cash accounting-based measures do not provide the whole, long-term picture of profitability.
Figure 10 illustrates the results of a recent Bank of America/Merrill Lynch survey of in-vestors, which found that investors are moving away from embedded value measures and tending towards using free cash flow yield (FCFY).15 FCFY is free cash flow per share divided by the market price of a share and is a measure of cash distributable to shareholders. Embedded value seems to have lost some steam in the aftermath of the financial crisis as investors concentrate less on how cash flows will evolve in coming decades and become more concerned with current cash generating power.16
40%
30%
20%
10%
0%IFRS book value
Tangible book value
Embedded value
IFRS earnings
Dividend yield
Free cash flow yield
Jun 09 Sep 09 Dec 09 May 10 Sep 10
Source: Bank of America/Merrill Lynch, 12 January 2011
15 Trend conclusions may be flawed since the sample of respondents may have changed between the various surveys.
16 Free cash flow yield is the free cash flow per share that a company is expected to earn against its market price per share. The ratio is calculated by taking the free cash flow per share divided by the share price. Free cash flow (FCF) is calculated as operating cash flow minus capital expenditures. FCF represents the cash that a company is able to generate after laying out the money required to maintain or expand its asset base.
In Europe, investors’ turn toward cash accounting-based measures reflects a focus on short-term cash generation following the financial crisis.
Figure 10: Most popular performance measures for investors in Europe
Swiss Re, sigma No 1/201214
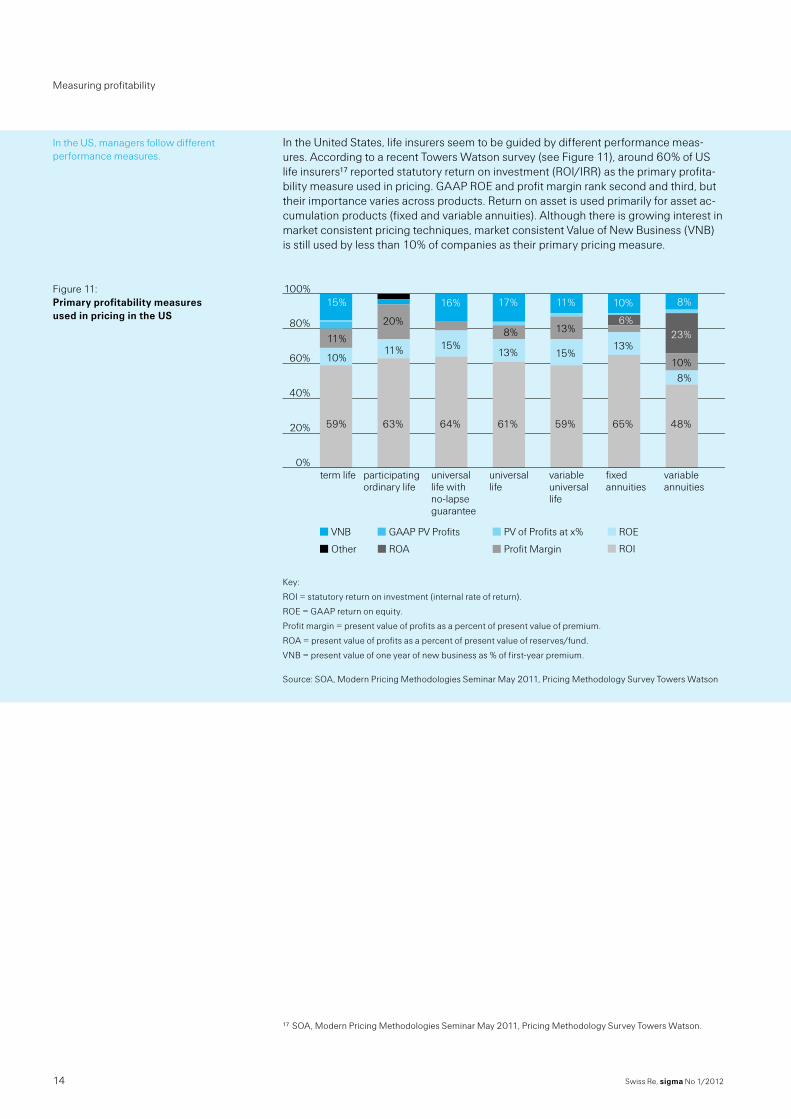
In the United States, life insurers seem to be guided by different performance meas-ures. According to a recent Towers Watson survey (see Figure 11), around 60% of US life insurers17 reported statutory return on investment (ROI/IRR) as the primary profita-bility measure used in pricing. GAAP ROE and profit margin rank second and third, but their importance varies across products. Return on asset is used primarily for asset ac-cumulation products (fixed and variable annuities). Although there is growing interest in market consistent pricing techniques, market consistent Value of New Business (VNB) is still used by less than 10% of companies as their primary pricing measure.
0%
20%
40%
60%
80%
100%
Other
VNB PV of Profits at x%GAAP PV Profits
ROA Profit Margin
ROE
ROI
variable annuities
fixed annuities
variable universal life
universal life
universallife with no-lapse guarantee
participatingordinary life
term life
63%
11%
20%
59%
10%
11%
15%
64%
15%
16%
61%
13%
8%
17%
59%
15%
13%
11%
65%
13%
6%
10%
48%
8%10%
23%
8%
Key:
ROI = statutory return on investment (internal rate of return).
ROE = GAAP return on equity.
Profit margin = present value of profits as a percent of present value of premium.
ROA = present value of profits as a percent of present value of reserves/fund.
VNB = present value of one year of new business as % of first-year premium. Source: SOA, Modern Pricing Methodologies Seminar May 2011, Pricing Methodology Survey Towers Watson
17 SOA, Modern Pricing Methodologies Seminar May 2011, Pricing Methodology Survey Towers Watson.
In the US, managers follow different performance measures.
Figure 11: Primary profitability measures used in pricing in the US
Measuring profitability
15Swiss Re, sigma No 1/2012
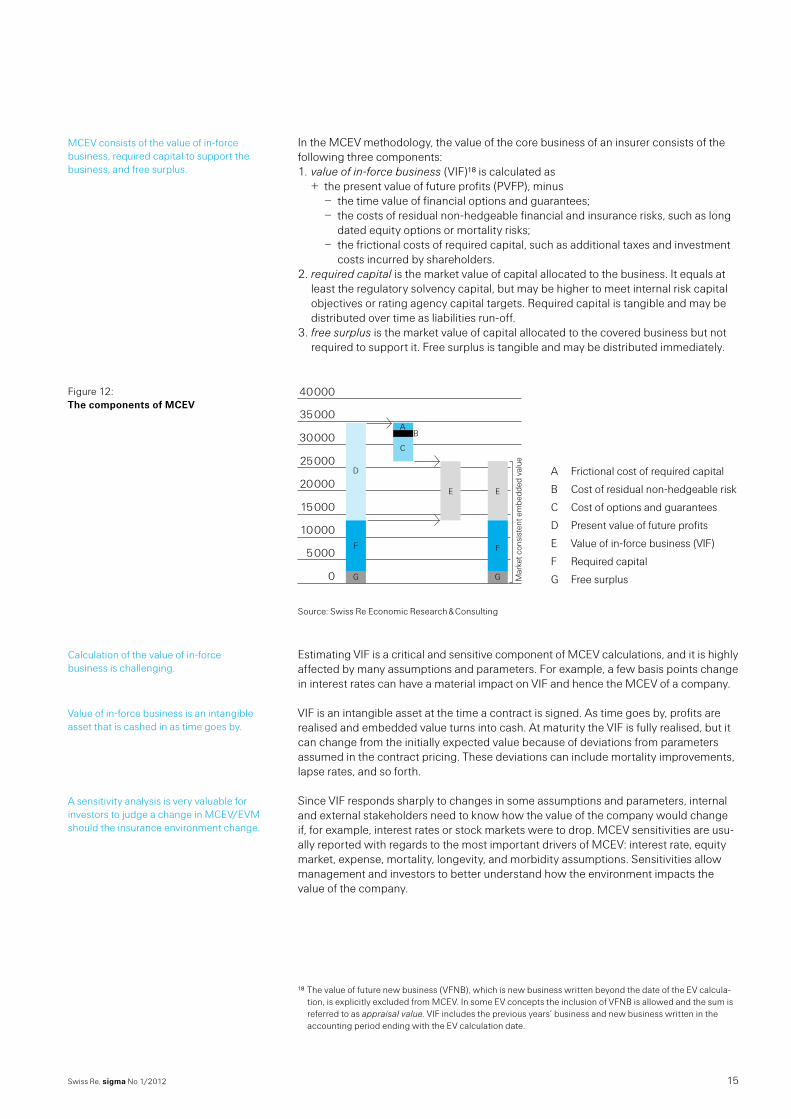
In the MCEV methodology, the value of the core business of an insurer consists of the following three components:
1. value of in-force business (VIF)18 is calculated as + the present value of future profits (PVFP), minus − the time value of financial options and guarantees; − the costs of residual non-hedgeable financial and insurance risks, such as long
dated equity options or mortality risks; − the frictional costs of required capital, such as additional taxes and investment
costs incurred by shareholders. 2. required capital is the market value of capital allocated to the business. It equals at
least the regulatory solvency capital, but may be higher to meet internal risk capital objectives or rating agency capital targets. Required capital is tangible and may be distributed over time as liabilities run-off.
3. free surplus is the market value of capital allocated to the covered business but not required to support it. Free surplus is tangible and may be distributed immediately.
40 000
35 000
30 000
25 000
20 000
15 000
10 000
5 000
0
A Frictional cost of required capital
B Cost of residual non-hedgeable risk
C Cost of options and guarantees
D Present value of future profits
E Value of in-force business (VIF)
F Required capital
G Free surplusMar
ket c
onsi
sten
t em
bedd
ed v
alue
A
C
D
F
G G
F
EE
B
Source: Swiss Re Economic Research & Consulting
Estimating VIF is a critical and sensitive component of MCEV calculations, and it is highly affected by many assumptions and parameters. For example, a few basis points change in interest rates can have a material impact on VIF and hence the MCEV of a company.
VIF is an intangible asset at the time a contract is signed. As time goes by, profits are realised and embedded value turns into cash. At maturity the VIF is fully realised, but it can change from the initially expected value because of deviations from parameters assumed in the contract pricing. These deviations can include mortality improvements, lapse rates, and so forth.
Since VIF responds sharply to changes in some assumptions and parameters, internal and external stakeholders need to know how the value of the company would change if, for example, interest rates or stock markets were to drop. MCEV sensitivities are usu-ally reported with regards to the most important drivers of MCEV: interest rate, equity market, expense, mortality, longevity, and morbidity assumptions. Sensitivities allow management and investors to better understand how the environment impacts the value of the company.
18 The value of future new business (VFNB), which is new business written beyond the date of the EV calcula-tion, is explicitly excluded from MCEV. In some EV concepts the inclusion of VFNB is allowed and the sum is referred to as appraisal value. VIF includes the previous years’ business and new business written in the accounting period ending with the EV calculation date.
MCEV consists of the value of in-force business, required capital to support the business, and free surplus.
Figure 12: The components of MCEV
Calculation of the value of in-force business is challenging.
Value of in-force business is an intangible asset that is cashed in as time goes by.
A sensitivity analysis is very valuable for investors to judge a change in MCEV/EVM should the insurance environment change.
Swiss Re, sigma No 1/201216
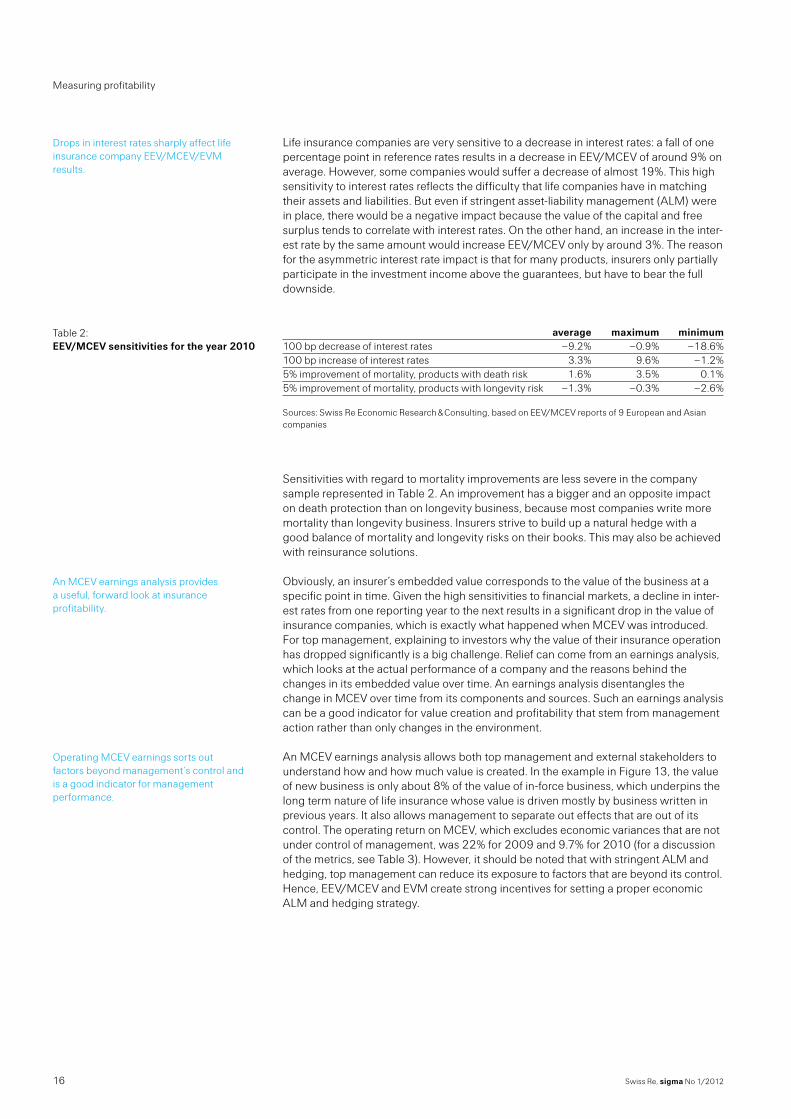
Life insurance companies are very sensitive to a decrease in interest rates: a fall of one percentage point in reference rates results in a decrease in EEV/MCEV of around 9% on average. However, some companies would suffer a decrease of almost 19%. This high sensitivity to interest rates reflects the difficulty that life companies have in matching their assets and liabilities. But even if stringent asset-liability management (ALM) were in place, there would be a negative impact because the value of the capital and free surplus tends to correlate with interest rates. On the other hand, an increase in the inter-est rate by the same amount would increase EEV/MCEV only by around 3%. The reason for the asymmetric interest rate impact is that for many products, insurers only partially participate in the investment income above the guarantees, but have to bear the full downside.
average maximum minimum100 bp decrease of interest rates –9.2% –0.9% –18.6%100 bp increase of interest rates 3.3% 9.6% –1.2%5% improvement of mortality, products with death risk 1.6% 3.5% 0.1%5% improvement of mortality, products with longevity risk –1.3% –0.3% –2.6%
Sources: Swiss Re Economic Research & Consulting, based on EEV/MCEV reports of 9 European and Asian companies
Sensitivities with regard to mortality improvements are less severe in the company sample represented in Table 2. An improvement has a bigger and an opposite impact on death protection than on longevity business, because most companies write more mortality than longevity business. Insurers strive to build up a natural hedge with a good balance of mortality and longevity risks on their books. This may also be achieved with reinsurance solutions.
Obviously, an insurer’s embedded value corresponds to the value of the business at a specific point in time. Given the high sensitivities to financial markets, a decline in inter-est rates from one reporting year to the next results in a significant drop in the value of insurance companies, which is exactly what happened when MCEV was introduced. For top management, explaining to investors why the value of their insurance operation has dropped significantly is a big challenge. Relief can come from an earnings analysis, which looks at the actual performance of a company and the reasons behind the changes in its embedded value over time. An earnings analysis disentangles the change in MCEV over time from its components and sources. Such an earnings analysis can be a good indicator for value creation and profitability that stem from management action rather than only changes in the environment.
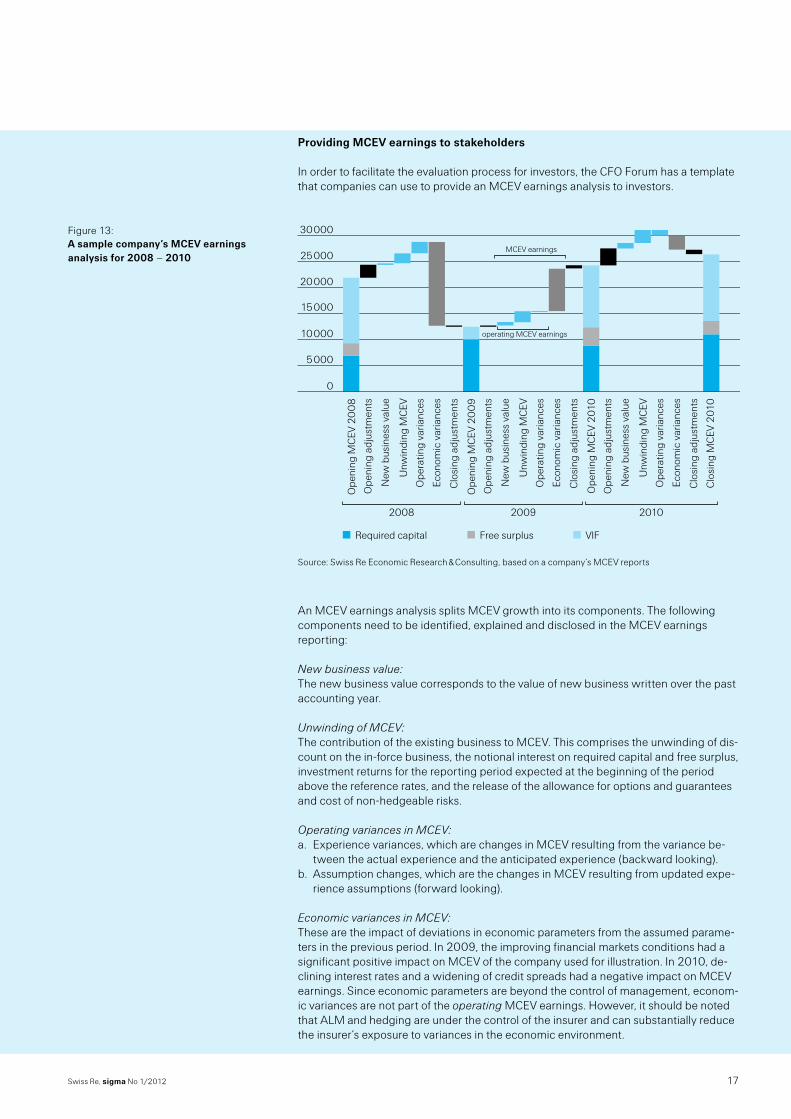
An MCEV earnings analysis allows both top management and external stakeholders to understand how and how much value is created. In the example in Figure 13, the value of new business is only about 8% of the value of in-force business, which underpins the long term nature of life insurance whose value is driven mostly by business written in previous years. It also allows management to separate out effects that are out of its control. The operating return on MCEV, which excludes economic variances that are not under control of management, was 22% for 2009 and 9.7% for 2010 (for a discussion of the metrics, see Table 3). However, it should be noted that with stringent ALM and hedging, top management can reduce its exposure to factors that are beyond its control. Hence, EEV/MCEV and EVM create strong incentives for setting a proper economic ALM and hedging strategy.
Drops in interest rates sharply affect life insurance company EEV/MCEV/EVM results.
Table 2: EEV/MCEV sensitivities for the year 2010
An MCEV earnings analysis provides a useful, forward look at insurance profitability.
Operating MCEV earnings sorts out factors beyond management’s control and is a good indicator for management performance.
Measuring profitability
17Swiss Re, sigma No 1/2012
Providing MCEV earnings to stakeholders
In order to facilitate the evaluation process for investors, the CFO Forum has a template that companies can use to provide an MCEV earnings analysis to investors.
Ope
ning
MC
EV 2
00
8
Ope
ning
adj
ustm
ents
New
bus
ines
s va
lue
Unw
indi
ng M
CEV
Ope
ratin
g va
rianc
es
Econ
omic
var
ianc
es
Clo
sing
adj
ustm
ents
Ope
ning
MC
EV 2
00
9
Ope
ning
adj
ustm
ents
New
bus
ines
s va
lue
Unw
indi
ng M
CEV
Ope
ratin
g va
rianc
es
Econ
omic
var
ianc
es
Clo
sing
adj
ustm
ents
Ope
ning
MC
EV 2
010
Ope
ning
adj
ustm
ents
New
bus
ines
s va
lue
Unw
indi
ng M
CEV
Ope
ratin
g va
rianc
es
Econ
omic
var
ianc
es
Clo
sing
adj
ustm
ents
Clo
sing
MC
EV 2
010
30 000
25 000
20 000
15 000
10 000
5 000
0
operating MCEV earnings
2008 2009 2010
MCEV earnings
Required capital Free surplus VIF
Source: Swiss Re Economic Research & Consulting, based on a company’s MCEV reports
An MCEV earnings analysis splits MCEV growth into its components. The following components need to be identified, explained and disclosed in the MCEV earnings reporting:
New business value:
The new business value corresponds to the value of new business written over the past accounting year.
Unwinding of MCEV: The contribution of the existing business to MCEV. This comprises the unwinding of dis-count on the in-force business, the notional interest on required capital and free surplus, investment returns for the reporting period expected at the beginning of the period above the reference rates, and the release of the allowance for options and guarantees and cost of non-hedgeable risks.
Operating variances in MCEV: a. Experience variances, which are changes in MCEV resulting from the variance be-
tween the actual experience and the anticipated experience (backward looking). b. Assumption changes, which are the changes in MCEV resulting from updated expe-
rience assumptions (forward looking).
Economic variances in MCEV: These are the impact of deviations in economic parameters from the assumed parame-
ters in the previous period. In 2009, the improving financial markets conditions had a significant positive impact on MCEV of the company used for illustration. In 2010, de-clining interest rates and a widening of credit spreads had a negative impact on MCEV earnings. Since economic parameters are beyond the control of management, econom-ic variances are not part of the operating MCEV earnings. However, it should be noted that ALM and hedging are under the control of the insurer and can substantially reduce the insurer’s exposure to variances in the economic environment.
Figure 13: A sample company’s MCEV earnings analysis for 2008 – 2010

Swiss Re, sigma No 1/201218
Table 3: The most important MCEV/EVM-based profitability indicators
Indicator Areas of use Definition Advantages DisadvantagesMCEV of the company, or any line of business
MCEV reporting, business steering
The sum of the value of in-force business, required capital and free surplus.
MCEV based value measure. Probably the most accurate way to assess the value of a life insurance company. Har-monised methodology and reporting.
May be very volatile in times of financial turmoil, requires a myriad of ex ante long-term assumptions (holds for all EV based indicators)
MCEV earnings analysis
MCEV reporting, business steering
The change in MCEV over a period (after initial and clos-ing adjustments, economic variances and other non-op-erating variances, as well as other movements in IFRS net equity).
MCEV-based profitability measure. Indicates how much value has been created dur-ing a period; can be adjusted to take account of control ef-fects (operating MCEV earn-ings)
See above
Value of in-force business (VIF), total or by line of business
MCEV reporting, business steering
The present value of future profits after subtracting the time value of financial options and guarantees, the costs of non-hedgeable financial and insurance risks and the fric-tional costs of required capi-tal.
Expresses the value of a book of insurance contracts, taking into account all relevant costs
See above
Value of new business (VNB), total or by line of business
MCEV reporting, business steering
The additional value to shareholders created through writing new business.
New business value contribu-tion is a good indicator of per-formance during a year
Danger of biases toward overly optimistic VNB, should be ana-lysed together with the MCEV earnings analysis
New business margin, total or by line of business
MCEV reporting, business steering
The value of new business divided by the present value of new business premiums.
Usually by line of business, allows comparison of expect-ed profitability margins
See above
Return on MCEV, total or by line of business
MCEV reporting, business steering
MCEV earnings or operating MCEV earnings as % of MCEV.
MCEV complement to ROE
See above
Source: Swiss Re Economic Research & Consulting
MCEV, EVM, and similar reporting concepts are powerful tools. They better reflect life insurers’ long-term economic value creation than accounting measures. Furthermore, they can be applied internally for pricing, business-steering, and performance measure-ment including management compensation. They also allow insurers to make better decisions and improve the profitability of their business operations. For many external stakeholders, especially outside of Europe, MCEV remains somewhat of a “black box” because of the myriad of assumptions and estimates that go into its calculation. How-ever, more companies are starting to use EEV or MCEV for external reporting.
Although MCEV, EVM, and similar concepts are powerful tools for business steering and performance measurement, they are all too rarely used by both investors and management.
Measuring profitability
19Swiss Re, sigma No 1/2012
0%
10%
20%
30%
40%
MCEVEEV
2010200920082007200620052004
Source: Towers Watson May 2011 Insights 2010 EEV/MCEV: Focus on value and cash flow
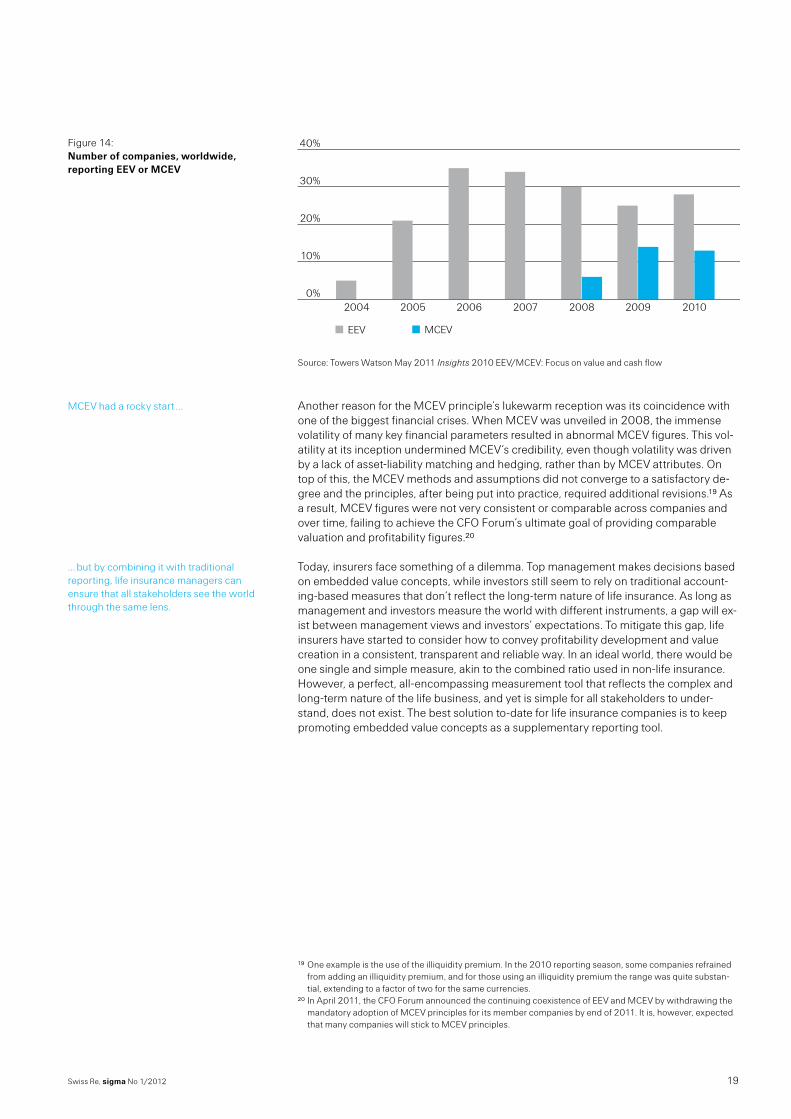
Another reason for the MCEV principle’s lukewarm reception was its coincidence with one of the biggest financial crises. When MCEV was unveiled in 2008, the immense volatility of many key financial parameters resulted in abnormal MCEV figures. This vol-atility at its inception undermined MCEV’s credibility, even though volatility was driven by a lack of asset-liability matching and hedging, rather than by MCEV attributes. On top of this, the MCEV methods and assumptions did not converge to a satisfactory de-gree and the principles, after being put into practice, required additional revisions.19 As a result, MCEV figures were not very consistent or comparable across companies and over time, failing to achieve the CFO Forum’s ultimate goal of providing comparable valuation and profitability figures.20
Today, insurers face something of a dilemma. Top management makes decisions based on embedded value concepts, while investors still seem to rely on traditional account-ing-based measures that don’t reflect the long-term nature of life insurance. As long as management and investors measure the world with different instruments, a gap will ex-ist between management views and investors’ expectations. To mitigate this gap, life insurers have started to consider how to convey profitability development and value creation in a consistent, transparent and reliable way. In an ideal world, there would be one single and simple measure, akin to the combined ratio used in non-life insurance. However, a perfect, all-encompassing measurement tool that reflects the complex and long-term nature of the life business, and yet is simple for all stakeholders to under-stand, does not exist. The best solution to-date for life insurance companies is to keep promoting embedded value concepts as a supplementary reporting tool.
19 One example is the use of the illiquidity premium. In the 2010 reporting season, some companies refrained from adding an illiquidity premium, and for those using an illiquidity premium the range was quite substan-tial, extending to a factor of two for the same currencies.
20 In April 2011, the CFO Forum announced the continuing coexistence of EEV and MCEV by withdrawing the mandatory adoption of MCEV principles for its member companies by end of 2011. It is, however, expected that many companies will stick to MCEV principles.
Figure 14: Number of companies, worldwide, reporting EEV or MCEV
MCEV had a rocky start ...
... but by combining it with traditional reporting, life insurance managers can ensure that all stakeholders see the world through the same lens.
Swiss Re, sigma No 1/201220
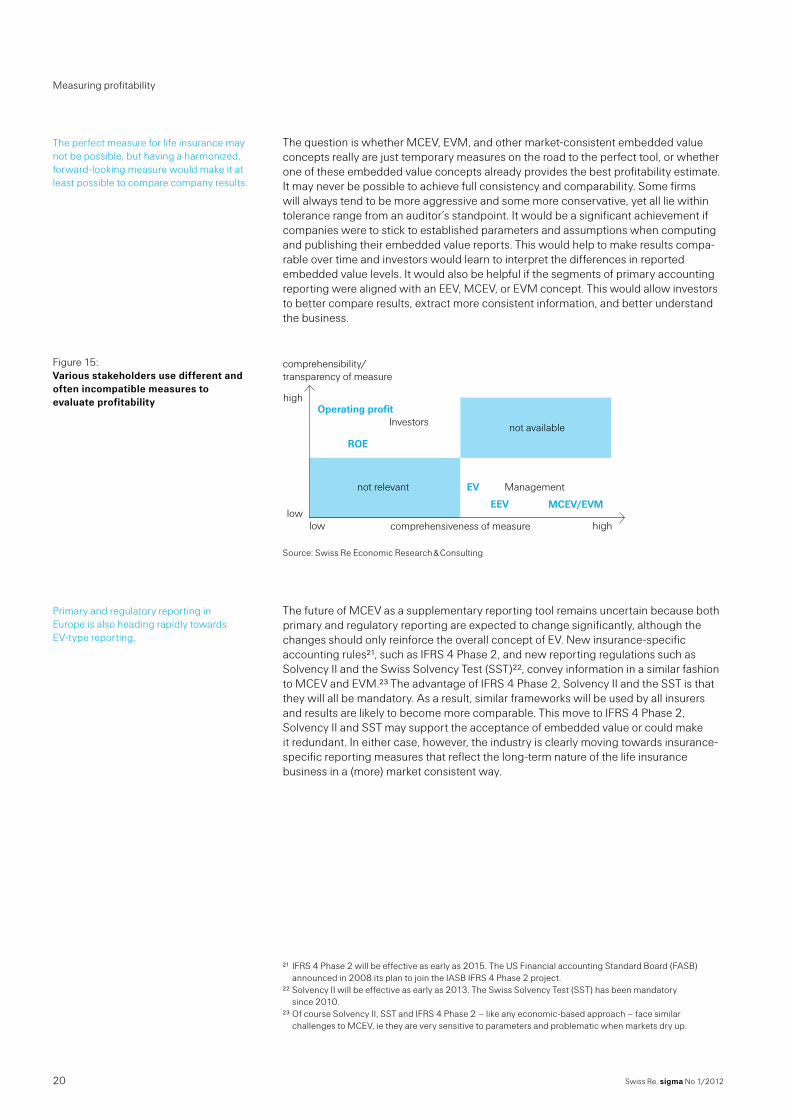
The question is whether MCEV, EVM, and other market-consistent embedded value concepts really are just temporary measures on the road to the perfect tool, or whether one of these embedded value concepts already provides the best profitability estimate. It may never be possible to achieve full consistency and comparability. Some firms will always tend to be more aggressive and some more conservative, yet all lie within tolerance range from an auditor’s standpoint. It would be a significant achievement if companies were to stick to established parameters and assumptions when computing and publishing their embedded value reports. This would help to make results compa-rable over time and investors would learn to interpret the differences in reported embedded value levels. It would also be helpful if the segments of primary accounting reporting were aligned with an EEV, MCEV, or EVM concept. This would allow investors to better compare results, extract more consistent information, and better understand the business.
low
high
low high
not relevant
not available
comprehensibility/transparency of measure
comprehensiveness of measure
Operating profitInvestors
ROE
ManagementEV
EEV MCEV/EVM
Source: Swiss Re Economic Research & Consulting
The future of MCEV as a supplementary reporting tool remains uncertain because both primary and regulatory reporting are expected to change significantly, although the changes should only reinforce the overall concept of EV. New insurance-specific accounting rules21, such as IFRS 4 Phase 2, and new reporting regulations such as Solvency II and the Swiss Solvency Test (SST)22, convey information in a similar fashion to MCEV and EVM.23 The advantage of IFRS 4 Phase 2, Solvency II and the SST is that they will all be mandatory. As a result, similar frameworks will be used by all insurers and results are likely to become more comparable. This move to IFRS 4 Phase 2, Solvency II and SST may support the acceptance of embedded value or could make it redundant. In either case, however, the industry is clearly moving towards insurance-specific reporting measures that reflect the long-term nature of the life insurance business in a (more) market consistent way.
21 IFRS 4 Phase 2 will be effective as early as 2015. The US Financial accounting Standard Board (FASB) announced in 2008 its plan to join the IASB IFRS 4 Phase 2 project.
22 Solvency II will be effective as early as 2013. The Swiss Solvency Test (SST) has been mandatory since 2010.
23 Of course Solvency II, SST and IFRS 4 Phase 2 – like any economic-based approach – face similar challenges to MCEV, ie they are very sensitive to parameters and problematic when markets dry up.
The perfect measure for life insurance may not be possible, but having a harmonized, forward-looking measure would make it at least possible to compare company results.
Figure 15: Various stakeholders use different and often incompatible measures to evaluate profitability
Primary and regulatory reporting in Europe is also heading rapidly towards EV-type reporting.
Measuring profitability

21Swiss Re, sigma No 1/2012
Zooming in on product performance
Life insurers offer a spectrum of products with many different features and characteris-tics. Each product has a different risk profile and can have very different earning drivers. This chapter provides an overview of today’s life insurance products and discusses why it is important to have more transparency and disclosure of results at the product level.
Products have evolved over time in response to demographic, economic, and cultural trends, as well as to household and individual financial needs. Aging populations and recent changes in retirement provisions in many markets have shifted the burden of providing for retirement income from states and employers to individuals. Life insurance products today provide households with a source of income in the case of death or disability, and retirement income to offset the risk that individuals outlive their wealth. Savings products provide a return on investment and tax efficient wealth transfer to the next generation.
Life products protect policyholders against two broad classes of risk. The first is life risk, which includes mortality, morbidity, and longevity. The second class of risk is financial market risk, which includes products that protect policyholders against fluctuations in the stock and bond markets. Each product has a different risk profile. In the case of tra-ditional products, such as term life or disability insurance, the most important risks are mortality and morbidity. More complex products protect policyholders against a combi-nation of life and financial market risks. Universal life policies and endowment policies provide policyholders guaranteed minimum investment returns plus a death benefit. Annuity contracts, depending on their structure, can provide a death benefit in the accumulation phase and a guaranteed, life-long income stream for retirement.
In Figure 16, life products are grouped according to their risk protection and savings characteristics. At the left end of the spectrum, risk protection products provide cover-age against mortality, morbidity and longevity risks. Savings products sit at the right end of the spectrum, where financial market risks are the key variables. Earnings sources depend on how risks along this spectrum are allocated between the insurer and policyholder. In 2010, about 85% of the USD 2.4 trillion of in-force life premiums were directed toward savings products (Figure 17).
Risk protection Savings
Source: Swiss Re Economic Research & Consulting
Reporting at the product level is also important.
What kind of life insurance products are there?
Life products can be categorized into two broad classes of risk.
There are substantial differences in the key sources of earnings by product.
Figure 16: Types of life insurance products and their risk and earnings profile
Products
Term assurance Group life Disability Long-term care Critical Illness Payout annuities Impaired annuities
Whole life Universal life Variable life Endowment insurance Combined life-annuity
Deferred fixed and variable annuities Unit-linked savings Guaranteed interest contracts Defined contribution pension products
Main risks for insurer
Mortality Morbidity Longevity Lapse
Mortality Morbidity Longevity Lapse Interest rate Equity market
Interest rate Equity market Lapse
Main sources of earnings
Underwriting result Investment result
Underwriting result Investment result
Investment result Fee income

Swiss Re, sigma No 1/201222
0
100
200
300
400
500
600
Risk premiumsSavings premiums
GermanyItalyUnited KingdomFranceJapanUnited States
in USD bn
Sources: Supervisory authorities, insurance associations, Swiss Re Economic Research & Consulting
Product trends
Life insurers are actively developing solutions for the retirement needs of aging popula-tions. Current product trends include: Products with more flexible structures that can be unbundled easily: Life insurers
have moved toward unbundled pricing. The insurer provides a pricing schedule that lists separate charges for mortality, expenses, interest credited, etc. Customers se-lect from a large à la carte menu of riders and guarantees to include in a single con-tract. Flexible solutions for consumers make for a considerably more complex con-tract, but customers can tailor products to their individual needs.
Growth of unit-linked products: Unit-linked life insurance policies became popular in developed markets in the 1990s. The product family includes variable annuities in the US, unit-linked insurance contracts in the U.K. and Continental Europe, and seg-regated fund products in Canada. Contracts are often funded with a single premium. Unit-linked insurance contracts are primarily savings vehicles with modest mortality or longevity risk protection.
More variable annuity products with guarantees: In the late 1990s, insurers in the US and Japan began offering variable annuity products that provided a Guaranteed Minimum Death Benefit (GMDB) and periodic payments that varied according to the performance of a pool of asset risks. Products have since been enhanced to provide living benefit guarantees, such as Guaranteed Minimum Income Benefit (GMIB), Guaranteed Minimum Accumulation Benefit (GMAB), Guaranteed Minimum With-drawal Benefit (GMWB), and Guaranteed Lifetime Withdrawal Benefit (GLWB).24
24 For a detailed discussion of variable annuity guarantees see sigma 4/2008, Innovative ways of financing retirement.
Figure 17: Life insurers’ savings and risk premiums, 2010
Zooming in on product performance
23Swiss Re, sigma No 1/2012
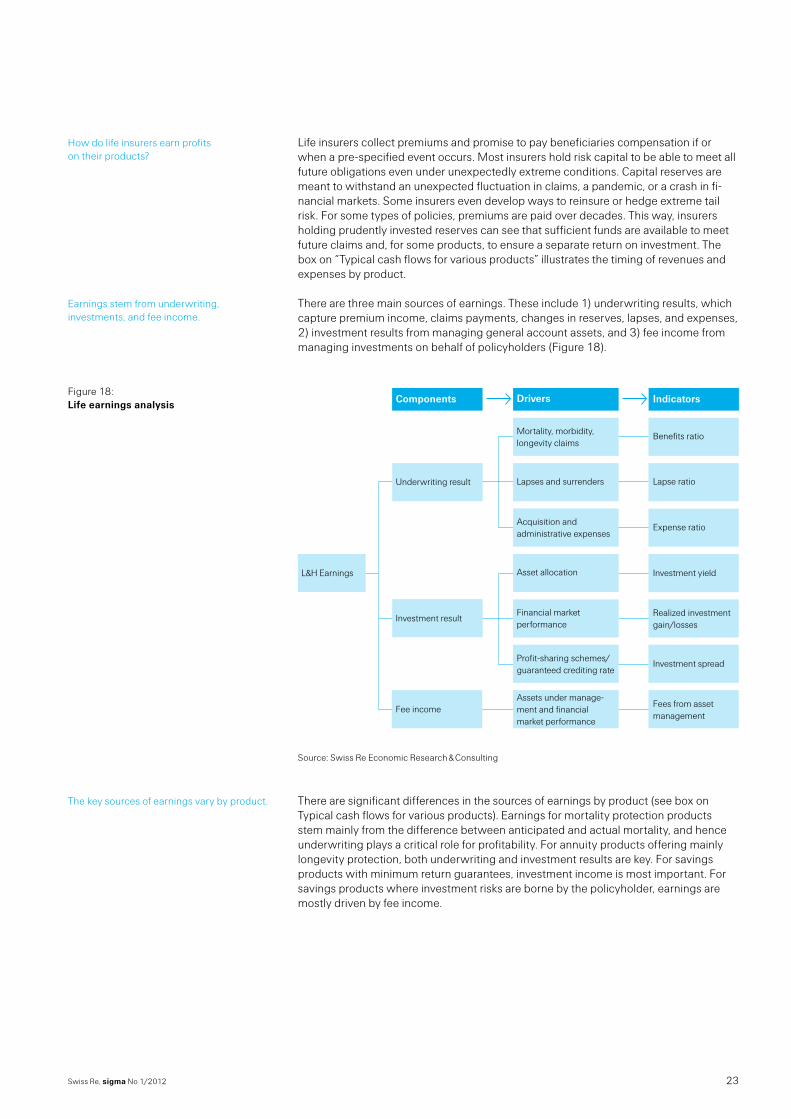
Life insurers collect premiums and promise to pay beneficiaries compensation if or when a pre-specified event occurs. Most insurers hold risk capital to be able to meet all future obligations even under unexpectedly extreme conditions. Capital reserves are meant to withstand an unexpected fluctuation in claims, a pandemic, or a crash in fi-nancial markets. Some insurers even develop ways to reinsure or hedge extreme tail risk. For some types of policies, premiums are paid over decades. This way, insurers holding prudently invested reserves can see that sufficient funds are available to meet future claims and, for some products, to ensure a separate return on investment. The box on “Typical cash flows for various products” illustrates the timing of revenues and expenses by product.
There are three main sources of earnings. These include 1) underwriting results, which capture premium income, claims payments, changes in reserves, lapses, and expenses, 2) investment results from managing general account assets, and 3) fee income from managing investments on behalf of policyholders (Figure 18).
Underwriting result
Mortality, morbidity,longevity claims
Benefits ratio
Investment result
Lapses and surrenders Lapse ratio
Fee income
Acquisition andadministrative expenses
Expense ratio
L&H Earnings Asset allocation Investment yield
Financial market performance
Realized investment gain/losses
Profit-sharing schemes/guaranteed crediting rate
Investment spread
Assets under manage-ment and financial market performance
Fees from asset management
Components Drivers Indicators
Source: Swiss Re Economic Research & Consulting
There are significant differences in the sources of earnings by product (see box on Typical cash flows for various products). Earnings for mortality protection products stem mainly from the difference between anticipated and actual mortality, and hence underwriting plays a critical role for profitability. For annuity products offering mainly longevity protection, both underwriting and investment results are key. For savings products with minimum return guarantees, investment income is most important. For savings products where investment risks are borne by the policyholder, earnings are mostly driven by fee income.
How do life insurers earn profits on their products?
Earnings stem from underwriting, investments, and fee income.
Figure 18: Life earnings analysis
The key sources of earnings vary by product.
Swiss Re, sigma No 1/201224
Typical cash flows for various products
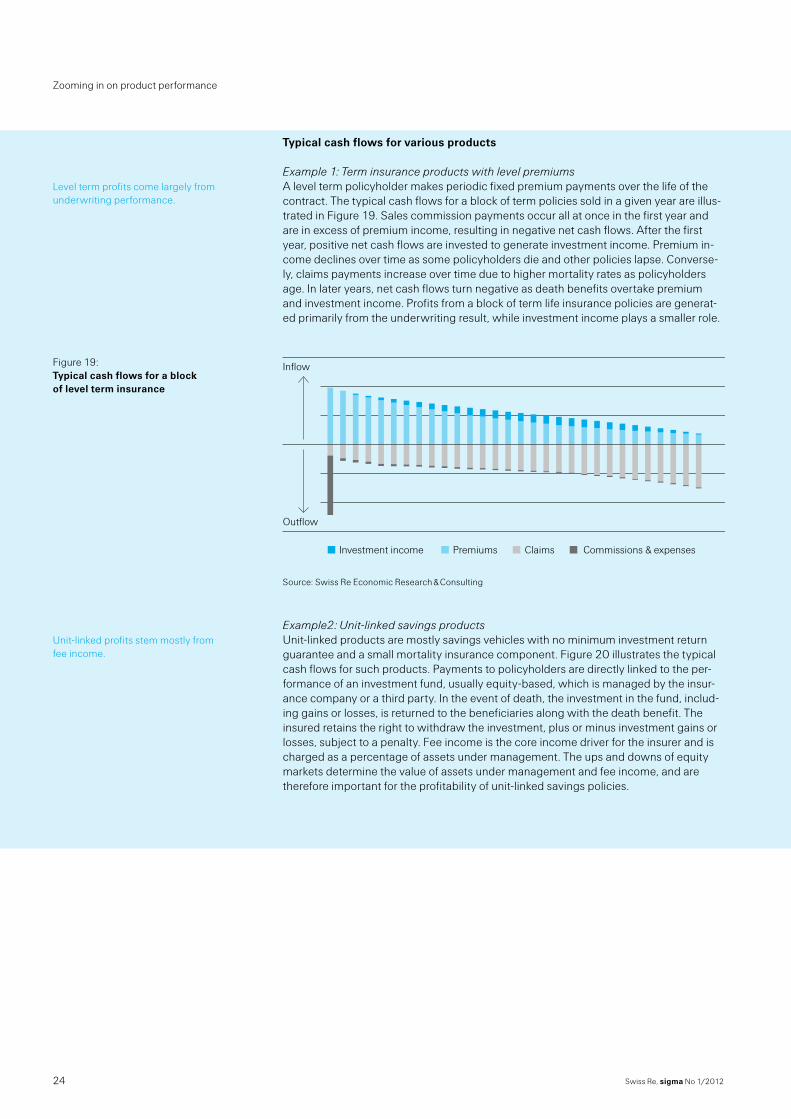
Example 1: Term insurance products with level premiums A level term policyholder makes periodic fixed premium payments over the life of the
contract. The typical cash flows for a block of term policies sold in a given year are illus-trated in Figure 19. Sales commission payments occur all at once in the first year and are in excess of premium income, resulting in negative net cash flows. After the first year, positive net cash flows are invested to generate investment income. Premium in-come declines over time as some policyholders die and other policies lapse. Converse-ly, claims payments increase over time due to higher mortality rates as policyholders age. In later years, net cash flows turn negative as death benefits overtake premium and investment income. Profits from a block of term life insurance policies are generat-ed primarily from the underwriting result, while investment income plays a smaller role.
Inflow
PremiumsInvestment income Claims Commissions & expenses
Outflow
Source: Swiss Re Economic Research & Consulting
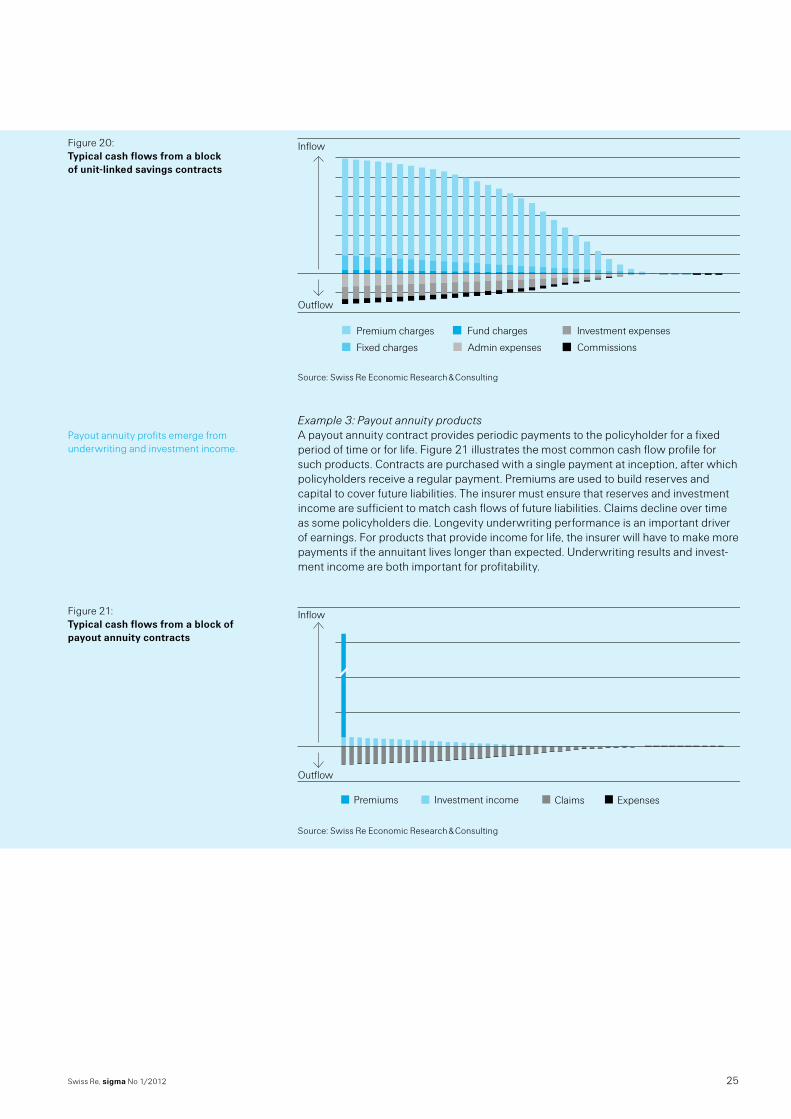
Example2: Unit-linked savings products Unit-linked products are mostly savings vehicles with no minimum investment return
guarantee and a small mortality insurance component. Figure 20 illustrates the typical cash flows for such products. Payments to policyholders are directly linked to the per-formance of an investment fund, usually equity-based, which is managed by the insur-ance company or a third party. In the event of death, the investment in the fund, includ-ing gains or losses, is returned to the beneficiaries along with the death benefit. The insured retains the right to withdraw the investment, plus or minus investment gains or losses, subject to a penalty. Fee income is the core income driver for the insurer and is charged as a percentage of assets under management. The ups and downs of equity markets determine the value of assets under management and fee income, and are therefore important for the profitability of unit-linked savings policies.
Level term profits come largely from underwriting performance.
Figure 19: Typical cash flows for a block of level term insurance
Unit-linked profits stem mostly from fee income.
Zooming in on product performance
25Swiss Re, sigma No 1/2012
-20-10
010203040506070
Premium charges
Fixed charges
Fund charges
Admin expenses
Investment expenses
Commissions
Inflow
Outflow
Source: Swiss Re Economic Research & Consulting
Example 3: Payout annuity products A payout annuity contract provides periodic payments to the policyholder for a fixed
period of time or for life. Figure 21 illustrates the most common cash flow profile for such products. Contracts are purchased with a single payment at inception, after which policyholders receive a regular payment. Premiums are used to build reserves and capital to cover future liabilities. The insurer must ensure that reserves and investment income are sufficient to match cash flows of future liabilities. Claims decline over time as some policyholders die. Longevity underwriting performance is an important driver of earnings. For products that provide income for life, the insurer will have to make more payments if the annuitant lives longer than expected. Underwriting results and invest-ment income are both important for profitability.
-2
0
2
4
6
8
Investment incomePremiums Claims Expenses
Inflow
Outflow
Source: Swiss Re Economic Research & Consulting
Figure 20: Typical cash flows from a block of unit-linked savings contracts
Payout annuity profits emerge from underwriting and investment income.
Figure 21: Typical cash flows from a block of payout annuity contracts

Swiss Re, sigma No 1/201226
What factors affect earnings?
Underwriting results are affected by actuarial factors such as mortality and morbidity, and policyholder behaviour factors such as lapse rates. Distribution and policy adminis-tration costs also affect underwriting results. An insurer needs to accurately forecast and manage these costs to ensure profitability. While various assumptions made at the time the policy is sold may deviate from actual experience later on, very few contracts allow for changes in prices. Thus, adverse deviations in expected and actual experience can cause losses for decades.
Insurers rely on historical data and statistical modelling tools to forecast mortality, morbidity, longevity, and policyholder behaviour. Factors that may cause underwriting experience to deviate from assumptions and reduce insurers’ expected earnings in-clude catastrophic mortality events, such as a pandemic, or unexpected improvements in longevity, such as a new treatment for cancer or heart disease. Asymmetric informa-tion between policyholders and insurers regarding their health status and behaviours (ie adverse selection and moral hazard issues) can also adversely impact underwriting results. In addition, higher-than-expected lapses and frequent churning of products will make it hard to recover acquisition expenses.
Investment performance is a function of insurer asset allocation, financial market per-formance, minimum return guarantees, and investment management skills. Investment gains and losses are shared either symmetrically or asymmetrically with the policyhold-ers, depending on product design. Participating policies use profit (and loss) sharing schemes to share returns symmetrically. Other products provide minimum return guar-antees, rewarding the policyholder for investment gains in an up market, while the in-surer shoulders losses when financial markets decline. Even policies without explicit investment risk-sharing mechanisms implicitly anticipate a certain level of investment return. At the time of pricing, this is reflected in the premium paid by the policyholder.
Investment returns are highly correlated with the performance of the financial markets, which can be extremely volatile. Insurers may fail to achieve investment returns as-sumed at the time of pricing for a variety of reasons. Duration mismatch risk is one such reason. For instance, if interest rates fall, the proceeds from shorter duration investments that support long-duration risk products have to be reinvested with lower returns. Unhedged interest rate or equity guarantees may be another reason for reduced earn-ings. When equity or bond markets fall, life insurers need to provide additional reserves to support the guarantees. Increased surrenders during a period of financial market stress may force a company to sell assets at a loss to confront heavy policyholder re-demptions. In addition, risky, heavy investment concentration in a single company or sector could provide high returns but also produce heavy losses when conditions are challenging. Even if a conservative investment strategy is applied, losses occur if the investment portfolio is not adequately hedged against extreme market events. Finally, changes in the regulatory environment, such as a move to higher regulatory capital requirements may force insurers to hold more capital, use reinsurance, or invest in lower-risk, lower-return assets.
Underwriting performance depends on correct risk assessment at the time of pricing.
What else can cause underwriting loss?
Investment returns are shared with policyholders, either through profit- sharing schemes or through pricing.
Investment results can be unsatisfactory due to financial market performance, investment strategies, pricing, or a changing regulatory environment.
Zooming in on product performance

27Swiss Re, sigma No 1/2012
Fee income in unit-linked business is proportional to the value of assets under manage-ment and sensitive to both financial market volatility and policyholder behaviour. Fee income grows on positive net flows into unit-linked products and equity market gains, but declines when stock prices fall and policyholders withdraw deposits.
The three earnings components (underwriting, investment and fee income) have very different characteristics. The underwriting result for mortality products has typically been a stable contributor to earnings, since mortality experience is fairly steady from year-to-year and sales commissions are known and set in advance. Administration ex-penses are directly controllable and policyholder behaviour is subject to uncertainty but is far more predictable than financial market performance. Moreover, a large portion of mortality risk is reinsured, helping to stabilise insurers’ underwriting results. Fee income for managing policyholders’ assets is more volatile, fluctuating with the value of assets under management. The investment result is the most volatile because life insurers assume the downside risks but share the upside potential through policy-holder profit-sharing features.
The earnings profile of a company is thus influenced by its product mix. The heavier the reliance on investment income, the higher the volatility of earnings will be. In assessing the long term earnings strength of an insurer, rating agencies and investment analysts sometimes compare contributions from investment and fee income to the more stable underwriting income.25
The differences in earnings patterns by product can be illustrated by looking at the statutory operating margins26 of US life insurers over the past few years (Figure 22). Individual and group life businesses have provided steady margins at or near the top of the range since most earnings stem from underwriting results. Operating margins for group and individual annuity business are much more volatile, suffered heavily during the financial market crisis from investment impairments and a sharp increase in re-serves to support equity-linked guarantees. Accident and health (A&H) insurers are less exposed to financial market risks because income comes from the underwriting side and portfolios consist of highly liquid, mostly short term government securities. The 2008 collapse of the US life industry operating margin was due solely to individual and group annuity business, while other lines had fairly stable results.
25 For example, see Bank of America/Merrill Lynch, Quality of Life II, 25 June 2009, or with regards to ratings see S&P, Analysis of North American Life Insurance Operating Performance, 13 May 2009.
26 Statutory earning margins are the ratio of statutory operating profits to premiums.
Fee income can decrease due to policy surrenders or financial market volatility, resulting in lower overall profitability.
The underwriting result for mortality business has typically been the most stable contributor to earnings.
Earnings volatility depends on the product mix.
Operating margins have varied widely by product.
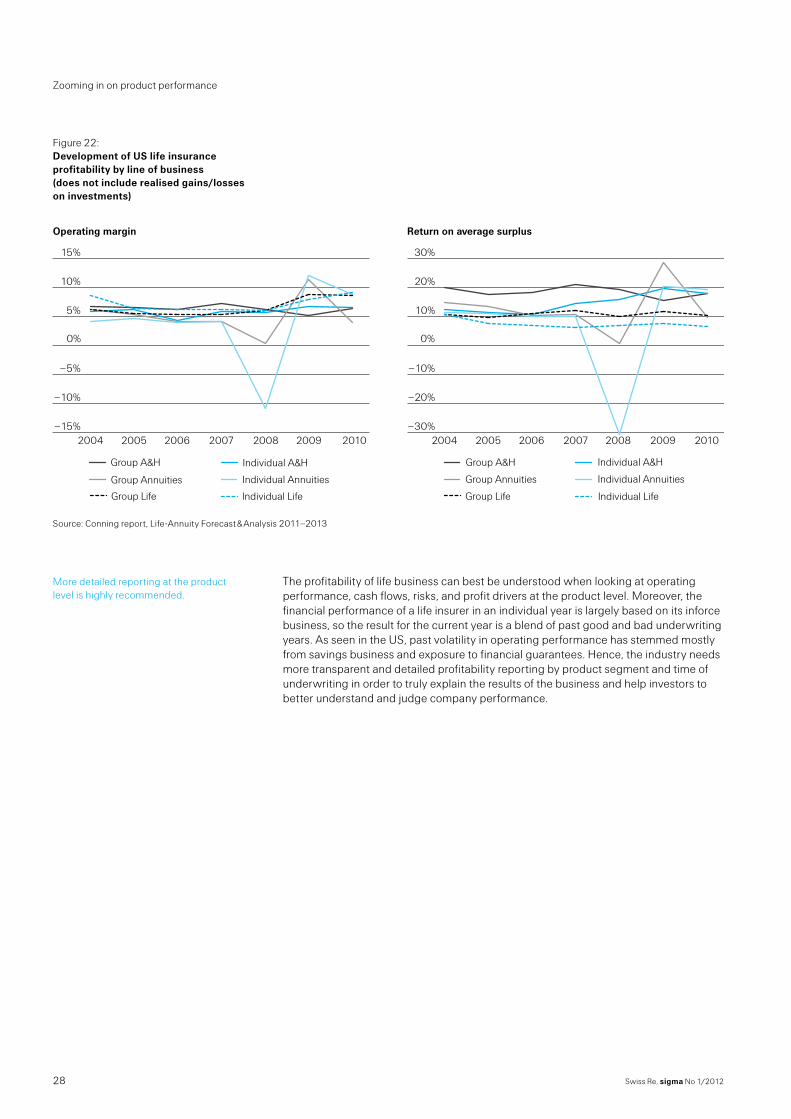
Swiss Re, sigma No 1/201228
Zooming in on product performance
–15%
–10%
–5%
0%
5%
10%
15%
Group A&H Individual A&H
Group Annuities Individual Annuities
Group Life Individual Life
2010200920082007200620052004–30%
–20%
–10%
0%
10%
20%
30%
Group A&H Individual A&H
Group Annuities Individual Annuities
Group Life Individual Life
2010200920082007200620052004
Operating margin Return on average surplus
Source: Conning report, Life-Annuity Forecast & Analysis 2011–2013
The profitability of life business can best be understood when looking at operating performance, cash flows, risks, and profit drivers at the product level. Moreover, the financial performance of a life insurer in an individual year is largely based on its inforce business, so the result for the current year is a blend of past good and bad underwriting years. As seen in the US, past volatility in operating performance has stemmed mostly from savings business and exposure to financial guarantees. Hence, the industry needs more transparent and detailed profitability reporting by product segment and time of underwriting in order to truly explain the results of the business and help investors to better understand and judge company performance.
Figure 22: Development of US life insurance profitability by line of business (does not include realised gains/losses on investments)
More detailed reporting at the product level is highly recommended.
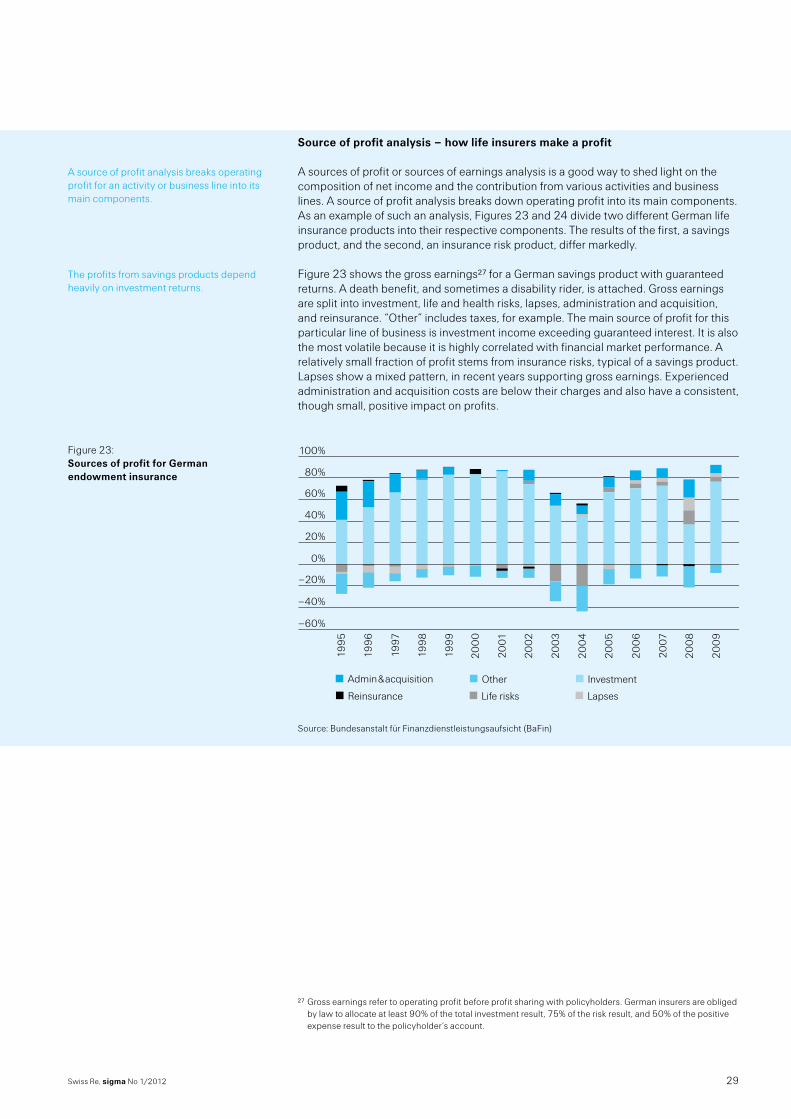
29Swiss Re, sigma No 1/2012
Source of profit analysis – how life insurers make a profit
A sources of profit or sources of earnings analysis is a good way to shed light on the composition of net income and the contribution from various activities and business lines. A source of profit analysis breaks down operating profit into its main components. As an example of such an analysis, Figures 23 and 24 divide two different German life insurance products into their respective components. The results of the first, a savings product, and the second, an insurance risk product, differ markedly.
Figure 23 shows the gross earnings27 for a German savings product with guaranteed returns. A death benefit, and sometimes a disability rider, is attached. Gross earnings are split into investment, life and health risks, lapses, administration and acquisition, and reinsurance. “Other” includes taxes, for example. The main source of profit for this particular line of business is investment income exceeding guaranteed interest. It is also the most volatile because it is highly correlated with financial market performance. A relatively small fraction of profit stems from insurance risks, typical of a savings product. Lapses show a mixed pattern, in recent years supporting gross earnings. Experienced administration and acquisition costs are below their charges and also have a consistent, though small, positive impact on profits.
Investment
Life risks
Admin & acquisition
Reinsurance
Other
Lapses
100%
80%
60%
40%
20%
0%
–20%
–40%
–60%
199
5
199
6
1997
199
8
199
9
200
0
2001
200
2
200
3
200
4
200
5
200
6
2007
200
8
200
9 Source: Bundesanstalt für Finanzdienstleistungsaufsicht (BaFin)
27 Gross earnings refer to operating profit before profit sharing with policyholders. German insurers are obliged by law to allocate at least 90% of the total investment result, 75% of the risk result, and 50% of the positive expense result to the policyholder’s account.
A source of profit analysis breaks operating profit for an activity or business line into its main components.
The profits from savings products depend heavily on investment returns.
Figure 23: Sources of profit for German endowment insurance
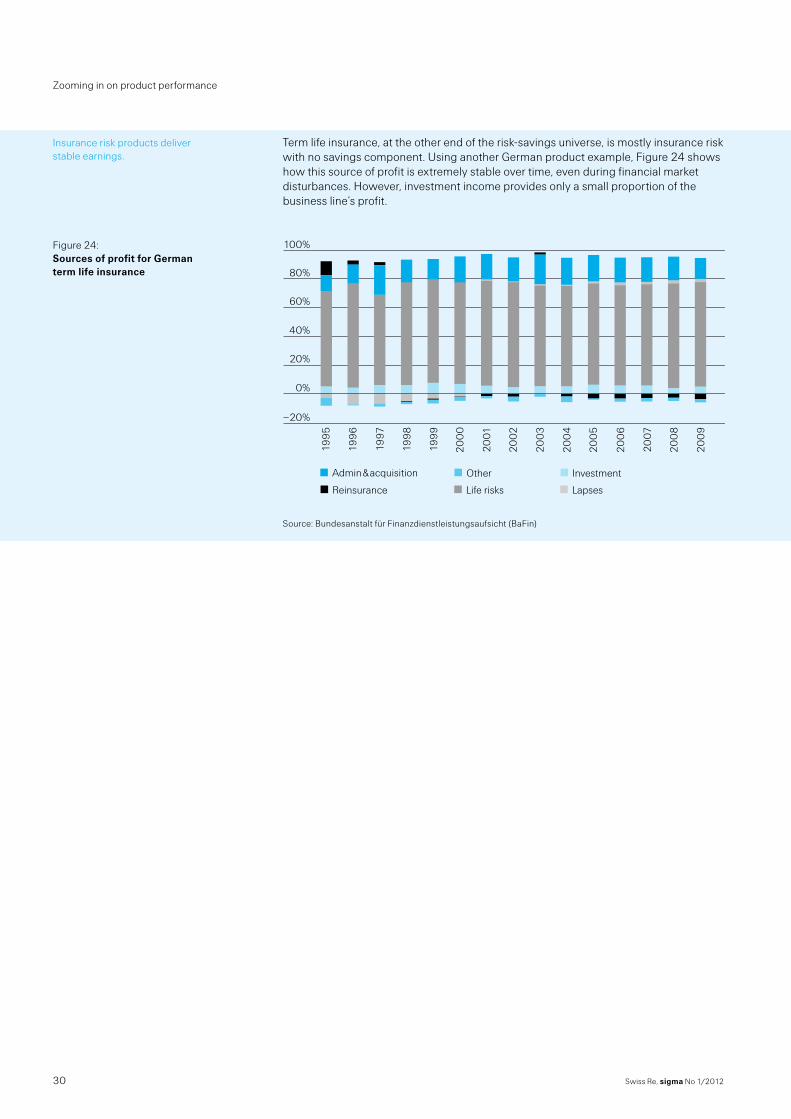
Swiss Re, sigma No 1/201230
Zooming in on product performance
Term life insurance, at the other end of the risk-savings universe, is mostly insurance risk with no savings component. Using another German product example, Figure 24 shows how this source of profit is extremely stable over time, even during financial market disturbances. However, investment income provides only a small proportion of the business line’s profit.
Investment
Life risks
Admin & acquisition
Reinsurance
Other
Lapses
100%
80%
60%
40%
20%
0%
–20%
199
5
199
6
1997
199
8
199
9
200
0
2001
200
2
200
3
200
4
200
5
200
6
2007
200
8
200
9
Source: Bundesanstalt für Finanzdienstleistungsaufsicht (BaFin)
Insurance risk products deliver stable earnings.
Figure 24: Sources of profit for German term life insurance

31Swiss Re, sigma No 1/2012
Conclusion
Life insurance plays a key role in managing risks in modern societies. It can provide in-come to beneficiaries on an income earner’s untimely death or loss of ability to work. Savings vehicles can help policyholders provide for retirement or transfer wealth to the next generation. Retirement products provide for guaranteed retirement income streams no matter how long a policyholder lives. Today, many generations rely on life and health insurance products and this will also be the case in the future as state-fund-ed social health and retirement programmes feel the burden of their ageing societies.
Life insurance has had phases of high profitability, but has also suffered during financial crises. Life insurance performance follows the economic and financial market cycle, and this cycle is difficult to escape because of the large and growing share of savings business with interest rate and equity market guarantees. Life insurers have enjoyed strong premium growth in past decades, but have had to contend with diminishing in-vestment returns in the low interest rate environment that has prevailed in recent years.
As a result of monetary policy easing in developed countries to support the banking sector and to stimulate economic growth, long-term interest rates have fallen to record low levels and will remain low for the foreseeable future. This is a major challenge for life insurers because many insurance products have explicit or embedded interest rate guarantees. While policyholders will still get their guarantees, they will see less profit-sharing. Life companies, on the other hand, will be faced with reduced margins and most likely a long wait before a return to robust profitability.
Life insurers rely on various profitability measures, ranging from standard accounting figures to very sophisticated life insurance specific metrics. Life insurance-specific con-cepts, based on discounting future cash flows, take into account the costs of guaran-tees and options embedded in insurance products. They have become indispensable for top management of certain companies when making decisions on pricing, planning, business steering and management compensation. Thus far, however, embedded value concepts have not been applied widely enough to gain acceptance among investors, who more often use traditional accounting figures due to their availability, despite the fact that these figures are clearly not ideal for tracking the long-term profitability of life insurance.
A growing number of companies are developing and promoting their own performance metrics to supplement traditional financial reporting, but there is a fine line between providing more valuable information and confusing investors with varying profitability measures. The insurance industry should, however, promote harmonised concepts so that investors and top management look through the same lens when evaluating life in-surance profitability. A sophisticated measure such as the market-consistent embedded value concept (MCEV) may be useful if it gains investor acceptance. In the future, insur-ance-specific accounting rules and new regulatory frameworks may also help to stand-ardise financial reporting.
The life industry is aware of investors’ increasing demand for more transparency, as well as more detailed and accurate profitability reporting. As a result, there is a trend towards more detailed disclosure of how value is created. Companies are moving towards segmenting their reporting between regions, new and in-force business, and also various product lines. If market-consistent embedded value concepts gained more acceptance with investors, and life insurance management consistently used them together with accounting reports, the life insurance industry would have a sophisticated toolbox that would allow everyone to view and measure profitability through the same lens.
Life insurance plays an important role in protecting against the financial consequences of uncertain life events.
To be sustainable, the life insurance industry must provide an adequate return on investment to investors.
Prolonged phases of low interest rates are a challenge for life insurers.
Top management relies on sophisticated, embedded value measures for decision making, while investors use accounting measures to judge performance.
A harmonised performance metric could help investors and top management see eye to eye.
The industry needs to move towards more transparent, standardised, and comprehensive profitability reporting that all stakeholders trust and understand.

Recent sigma publications
2012 No 1 Understanding profitability in life insurance
2011 No 1 Natural catastrophes and man-made disasters in 2010: a year of devastating and costly events No 2 World insurance in 2010 No 3 State involvement in insurance markets No 4 Product innovation in non-life insurance markets: where little “i” meets big “I” No 5 Insurance in emerging markets: growth drivers and profitability
2010 No 1 Natural catastrophes and man-made disasters in 2009: catastrophes claim fewer victims, insured losses fall
No 2 World insurance in 2009: premiums dipped, but industry capital improved No 3 Regulatory issues in insurance No 4 The impact of inflation on insurers No 5 Insurance investment in a challenging global environment No 6 Microinsurance – risk protection for 4 billion people
2009 No 1 Scenario analysis in insurance No 2 Natural catastrophes and man-made disasters in 2008:
North America and Asia suffer heavy losses No 3 World insurance in 2008: life premiums fall in the industrialised countries – strong
growth in the emerging economies No 4 The role of indices in transferring insurance risks to the capital markets No 5 Commercial liability: a challenge for businesses and their insurers
2008 No 1 Natural catastrophes and man-made disasters in 2007: high losses in Europe No 2 Non-life claims reserving: improving on a strategic challenge No 3 World insurance in 2007: emerging markets leading the way No 4 Innovative ways of financing retirement No 5 Insurance in the emerging markets: overview and prospects for Islamic insurance
2007 No 1 Insurance in emerging markets: sound development; greenfield for agricultural insurance No 2 Natural catastrophes and man-made disasters in 2006: low insured losses No 3 Annuities: a private solution to longevity risk No 4 World insurance in 2006: premiums came back to “life” No 5 Bancassurance: emerging trends, opportunities and challenges No 6 To your health: diagnosing the state of healthcare and the global private
medical insurance industry
2006 No 1 Getting together: globals take the lead in life insurance M & A No 2 Natural catastrophes and man-made disasters 2005:
high earthquake casualties, new dimension in windstorm losses No 3 Measuring underwriting profitability of the non-life insurance industry No 4 Solvency II: an integrated risk approach for European insurers No 5 World insurance in 2005: moderate premium growth, attractive profitability No 6 Credit and surety: solidifying commitments No 7 Securitization – new opportunities for insurers and investors

Swiss Reinsurance Company LtdEconomic Research & ConsultingMythenquai 50/60P.O. Box8022 ZurichSwitzerland
Telephone +41 43 285 2551Fax +41 43 282 [email protected]