sid 5 research project final report - defra, uk -...
TRANSCRIPT

SID 5 (Rev. 05/09) Page 1 of 26
General enquiries on this form should be made to:
Defra, Procurements and Contracts Division (Science R&D Team)
Telephone No. 0207 238 5734 E-mail: [email protected]
SID 5 Research Project Final Report
Note
In line with the Freedom of Information Act 2000, Defra aims to place the results of its completed research projects in the public domain wherever possible. The SID 5 (Research Project Final Report) is designed to capture the information on the results and outputs of Defra-funded research in a format that is easily publishable through the Defra website. A SID 5 must be completed for all projects.
This form is in Word format and the boxes may be expanded or reduced, as appropriate.
ACCESS TO INFORMATION
The information collected on this form will be stored electronically and may be sent to any part of Defra, or to individual researchers or organisations outside Defra for the purposes of reviewing the project. Defra may also disclose the information to any outside organisation acting as an agent authorised by Defra to process final research reports on its behalf. Defra intends to publish this form on its website, unless there are strong reasons not to, which fully comply with exemptions under the Environmental Information Regulations or the Freedom of Information Act 2000.
Defra may be required to release information, including personal data and commercial information, on request under the Environmental Information Regulations or the Freedom of Information Act 2000. However, Defra will not permit any unwarranted breach of confidentiality or act in contravention of its obligations under the Data Protection Act 1998. Defra or its appointed agents may use the name, address or other details on your form to contact you in connection with occasional customer research aimed at improving the processes through which Defra works with its contractors.
Project identification
1. Defra Project code MH0128
2. Project title
Novel and humane gaseous killing methods for pigs
3. Contractor organisation(s)
University of Bristol Senate House Tyndall Avenue Bristol BS1 8TD
54. Total Defra project costs £ 677,182
(agreed fixed price)
5. Project: start date ................ 01 May 2005
end date ................. 30 April 2010

SID 5 (Rev. 05/09) Page 2 of 26
6. It is Defra’s intention to publish this form.
Please confirm your agreement to do so. ................................................................................... YES NO
(a) When preparing SID 5s contractors should bear in mind that Defra intends that they be made public. They should be written in a clear and concise manner and represent a full account of the research project which someone not closely associated with the project can follow.
Defra recognises that in a small minority of cases there may be information, such as intellectual property or commercially confidential data, used in or generated by the research project, which should not be disclosed. In these cases, such information should be detailed in a separate annex (not to be published) so that the SID 5 can be placed in the public domain. Where it is impossible to complete the Final Report without including references to any sensitive or confidential data, the information should be included and section (b) completed. NB: only in exceptional circumstances will Defra expect contractors to give a "No" answer.
In all cases, reasons for withholding information must be fully in line with exemptions under the Environmental Information Regulations or the Freedom of Information Act 2000.
(b) If you have answered NO, please explain why the Final report should not be released into public domain
Executive Summary
7. The executive summary must not exceed 2 sides in total of A4 and should be understandable to the intelligent non-scientist. It should cover the main objectives, methods and findings of the research, together with any other significant events and options for new work.
The Farm Animal Welfare Council (FAWC) proposed that pigs could be rendered unconscious first by exposing them to a non-aversive gas mixture and subsequently killed by inducing cardiac arrest (cardiac ventricular fibrillation, CVF) with an electric current, which is the basis of this research project. A mixture of 85% nitrogen and 15% carbon dioxide was chosen, on animal welfare grounds, to induce unconsciousness in pigs prior to killing them with an electric current. In this project, the first four Objectives were dedicated to the development, evaluation and refinement of methods and scientific tools to be used to facilitating administration of the gas mixture and implementing 3Rs. Further three Objectives involved studies that are directly related to the development of the novel and humane killing method. The final Objective was designed to prepare guidelines for the commercial implementation of the outcome of this project. The specific objectives were: 1. Evaluation of gas delivery systems via face mask to pigs; 2. Evaluation and development of sub-dermal electrode methodology for recording electroencephalograms (EEGs); 3. Electrode design, construction and evaluation; 4. Determination of trans-thoracic impedance in pigs; 5. Determination of the duration of occurrence of isoelectric EEGs in pigs after various exposure times to a gas mixture; 6. Evaluation and determination of the minimum current and duration of application necessary to induce cardiac ventricular fibrillation (CVF); and 7. Estimation of the maximum permissible time interval between the end of exposure to a gas mixture for various duration and induction of CVF such that humane death occurs in pigs. A mixture of 85% by volume of nitrogen and 15% by volume of carbon dioxide has a relative density of 1.0645 and is marginally denser than air (air = 1.0). Therefore, an anaesthetic face mask was modified and used in this project to administer the gas mixture to pigs restrained in a hammock (Objective 01). This system facilitated easy access to animals and electroencephalograms (EEGs) and electrocardiograms (ECG) recording electrodes during exposure to the gas mixture such that any fault (e.g. detached electrode or cable) could be rectified immediately. Thus, it helped to minimise (3Rs) the number of animals used in this research project.
SID 5 (Rev. 05/09) Page 3 of 26
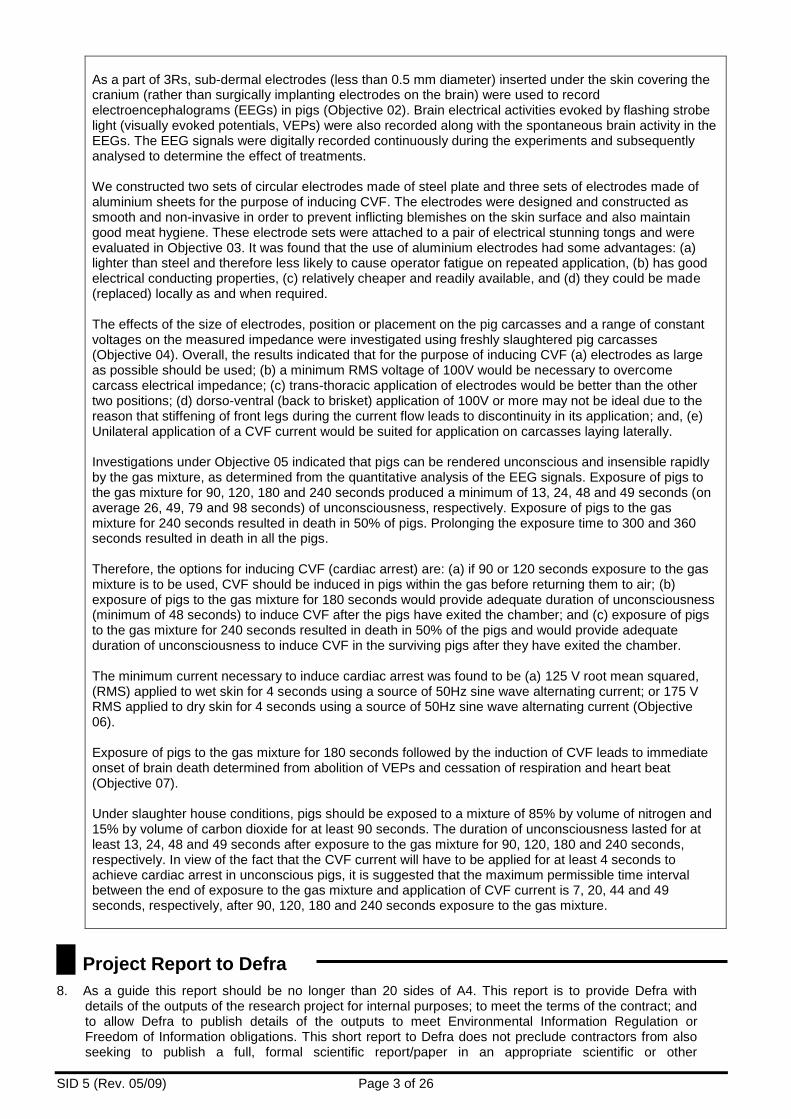
As a part of 3Rs, sub-dermal electrodes (less than 0.5 mm diameter) inserted under the skin covering the cranium (rather than surgically implanting electrodes on the brain) were used to record electroencephalograms (EEGs) in pigs (Objective 02). Brain electrical activities evoked by flashing strobe light (visually evoked potentials, VEPs) were also recorded along with the spontaneous brain activity in the EEGs. The EEG signals were digitally recorded continuously during the experiments and subsequently analysed to determine the effect of treatments. We constructed two sets of circular electrodes made of steel plate and three sets of electrodes made of aluminium sheets for the purpose of inducing CVF. The electrodes were designed and constructed as smooth and non-invasive in order to prevent inflicting blemishes on the skin surface and also maintain good meat hygiene. These electrode sets were attached to a pair of electrical stunning tongs and were evaluated in Objective 03. It was found that the use of aluminium electrodes had some advantages: (a) lighter than steel and therefore less likely to cause operator fatigue on repeated application, (b) has good electrical conducting properties, (c) relatively cheaper and readily available, and (d) they could be made (replaced) locally as and when required. The effects of the size of electrodes, position or placement on the pig carcasses and a range of constant voltages on the measured impedance were investigated using freshly slaughtered pig carcasses (Objective 04). Overall, the results indicated that for the purpose of inducing CVF (a) electrodes as large as possible should be used; (b) a minimum RMS voltage of 100V would be necessary to overcome carcass electrical impedance; (c) trans-thoracic application of electrodes would be better than the other two positions; (d) dorso-ventral (back to brisket) application of 100V or more may not be ideal due to the reason that stiffening of front legs during the current flow leads to discontinuity in its application; and, (e) Unilateral application of a CVF current would be suited for application on carcasses laying laterally. Investigations under Objective 05 indicated that pigs can be rendered unconscious and insensible rapidly by the gas mixture, as determined from the quantitative analysis of the EEG signals. Exposure of pigs to the gas mixture for 90, 120, 180 and 240 seconds produced a minimum of 13, 24, 48 and 49 seconds (on average 26, 49, 79 and 98 seconds) of unconsciousness, respectively. Exposure of pigs to the gas mixture for 240 seconds resulted in death in 50% of pigs. Prolonging the exposure time to 300 and 360 seconds resulted in death in all the pigs. Therefore, the options for inducing CVF (cardiac arrest) are: (a) if 90 or 120 seconds exposure to the gas mixture is to be used, CVF should be induced in pigs within the gas before returning them to air; (b) exposure of pigs to the gas mixture for 180 seconds would provide adequate duration of unconsciousness (minimum of 48 seconds) to induce CVF after the pigs have exited the chamber; and (c) exposure of pigs to the gas mixture for 240 seconds resulted in death in 50% of the pigs and would provide adequate duration of unconsciousness to induce CVF in the surviving pigs after they have exited the chamber. The minimum current necessary to induce cardiac arrest was found to be (a) 125 V root mean squared, (RMS) applied to wet skin for 4 seconds using a source of 50Hz sine wave alternating current; or 175 V RMS applied to dry skin for 4 seconds using a source of 50Hz sine wave alternating current (Objective 06). Exposure of pigs to the gas mixture for 180 seconds followed by the induction of CVF leads to immediate onset of brain death determined from abolition of VEPs and cessation of respiration and heart beat (Objective 07). Under slaughter house conditions, pigs should be exposed to a mixture of 85% by volume of nitrogen and 15% by volume of carbon dioxide for at least 90 seconds. The duration of unconsciousness lasted for at least 13, 24, 48 and 49 seconds after exposure to the gas mixture for 90, 120, 180 and 240 seconds, respectively. In view of the fact that the CVF current will have to be applied for at least 4 seconds to achieve cardiac arrest in unconscious pigs, it is suggested that the maximum permissible time interval between the end of exposure to the gas mixture and application of CVF current is 7, 20, 44 and 49 seconds, respectively, after 90, 120, 180 and 240 seconds exposure to the gas mixture.
Project Report to Defra
8. As a guide this report should be no longer than 20 sides of A4. This report is to provide Defra with details of the outputs of the research project for internal purposes; to meet the terms of the contract; and to allow Defra to publish details of the outputs to meet Environmental Information Regulation or Freedom of Information obligations. This short report to Defra does not preclude contractors from also seeking to publish a full, formal scientific report/paper in an appropriate scientific or other

SID 5 (Rev. 05/09) Page 4 of 26
journal/publication. Indeed, Defra actively encourages such publications as part of the contract terms. The report to Defra should include:
the scientific objectives as set out in the contract;
the extent to which the objectives set out in the contract have been met;
details of methods used and the results obtained, including statistical analysis (if appropriate);
a discussion of the results and their reliability;
the main implications of the findings;
possible future work; and
any action resulting from the research (e.g. IP, Knowledge Transfer).
BACKGROUND Previous research showed that (a) majority of the pigs, given a free choice, avoid an atmosphere containing high concentrations (80 to 90% by volume in air) of carbon dioxide; (b) inhalation of 40% by volume or more of this gas is extremely pungent and induces signs of breathlessness in conscious pigs, and (c) the time to onset of unconsciousness, as determined on the basis of abolition of evoked electrical activity (somatosensory evoked potentials, SEPs) in the brain, can be up to 36 seconds. Various expert groups (e.g. FAWC, EFSA scientific Panel) have concluded that neither electrical nor carbon dioxide stunning of pigs is perfect and called for development of more humane stunning / killing methods for pigs. Previous research also showed that (a) pigs do not avoid a hypoxic atmosphere created using 90% by volume of argon with less than 2% by volume of residual oxygen from air; (b) hypoxia does not induce breathlessness, and (c) unconsciousness, as determined from the time to abolition of evoked activity (SEPs) in the brain, occurs within 21 seconds and loss of spontaneous brain electrical activity (as determined from the occurrence of isoelectric electroencephalogram (EEG)) ensues within 86 seconds of exposure. However, further research carried out under commercial conditions showed that the duration of exposure required to killing 100% of slaughter weight pigs with hypoxia is longer than 7 minutes. Owing to the prolonged exposure time required to killing pigs with hypoxia, it has not been implemented commercially where high throughput rates are required. The Farm Animal Welfare Council (FAWC) proposed that pigs could be rendered unconscious first by exposing them to a non-aversive gas mixture and subsequently killed by inducing cardiac ventricular fibrillation (CVF) with an electric current, which is the basis of this research project. A mixture of 85% nitrogen and 15% carbon dioxide was chosen (by Defra), on animal welfare grounds, to induce unconsciousness in pigs prior to killing them by inducing cardiac ventricular fibrillation (CVF or cardiac arrest) with an electric current. In this project, the first four Objectives were dedicated to the development, evaluation and refinement of methods and scientific tools to be used to facilitating administration of the gas mixture and implementing 3Rs. Further three Objectives involved studies that are directly related to the development of the novel and humane killing method. The final Objective was designed to prepare guidelines for the commercial implementation of the outcome of this project. SPECIFIC OBJECTIVES 1. Evaluation of gas delivery systems via face mask to pigs; 2. Evaluation and development of sub-dermal electrode methodology for recording EEG; 3. Electrode design, construction and evaluation; 4. Determination of trans-thoracic impedance in pigs; 5. Determination of the duration of occurrence of isoelectric EEGs in pigs after various exposure times to a gas mixture; 6. Evaluation and determination of the minimum current and duration of application necessary to induce cardiac ventricular fibrillation (CVF); and 7. Estimation of the maximum permissible time interval between the end of exposure to a gas mixture for various duration and induction of CVF such that humane death occurs in pigs. OBJECTIVE 01: EVALUATION OF GAS DELIVERY SYSTEM VIA FACE MASK TO PIGS The main purpose of this objective was to develop a non re-breathing system for the administration of gas mixtures to pigs restrained in a hammock. A major advantage of such a system is that it would provide easy access to the electroencephalograms (EEGs) and electrocardiograms (ECG) recording electrodes such that any faults (e.g. detached electrode or cable) in the system could be rectified immediately. This would help minimise loss of data and also reduce the number of animals (3Rs) used in this research project.

SID 5 (Rev. 05/09) Page 5 of 26
As a part of this objective, we procured and installed a mobile gantry and a Yale (CPM 2-8; 250kg) electrical chain hoist that complies with the health and safety policy and also meets insurer’s requirements (Picture 1.1). We took measurements of length, width and girth of several pig carcasses in our slaughter house and made a harness that would facilitate lifting live pigs (UK slaughter weight of pigs; about 100kg) off the floor of a transport cage and restrain them with the minimum of discomfort as would be necessary to record EEGs and ECGs. These kinds of harnesses are normally used for lifting and securing ‘downer cows under field conditions. We have assembled a gas mixing panel and series of pressure reducing valves and gas delivery tubes connected to a face mask that would facilitate mixing of 85% by volume of nitrogen and 15% by volume of carbon dioxide from pure sources and administration of the gas mixture to pigs via the face mask. Picture 1.1: Gantry with electrical chain hoist used for lifting and placing pig in hammock
OBJECTIVE 02: EVALUATION AND DEVELOPMENT OF SUB-DERMAL ELECTRODE METHODOLOGY FOR RECORDING ELECTROENCEPHALOGRAM (EEG) This objective involved evaluation and development of sub-dermal electrode methodology for recording EEGs, including visually evoked potentials (VEPs) using conscious pigs (n=13) restrained in a hammock. Implantation of sub-dermal electrodes does not require anaesthetic or analgesic and invasive surgical procedures. Another advantage is that, owing to the lack of medication and surgery, the carcasses of experimental pigs were deemed fit for human consumption. Materials and methods: Two types of sub-dermal electrodes (un-insulated; n = 4; and insulated; n = 9) were evaluated to ascertain the quality of EEG signals obtained with them. Each pig was restrained in the harness, hairs on the forehead was clipped and implanted by gently inserting the EEG sub-dermal electrodes (<0.5 mm diameter, Oxford Instruments, UK). The negative electrode was placed on the right parietal bone covering the right cerebral hemisphere, rostral to the lambdoid suture and 5 to 10mm lateral to the midline, positive electrode was placed 30mm rostral and 5mm lateral to the negative electrode. A common electrode was placed on the left parietal bone at equidistance between the positive and negative electrodes. A ground electrode was inserted 10 mm lateral and left of the common electrode. The EEGs signals were digitally recorded (Gould Instrument Systems, ISO 9001:2000 compliant) at a sampling rate of 1000 samples per second for at least 2 minutes. In order to ascertain the feasibility of recording visually evoked potentials (VEPs) in pigs, VEPs were evoked by using a strobe light at 2 flashes per second and the EEGs including VEPs were recorded at the same sampling rate for further 2 minutes. From the digitally stored EEG data, thirty epochs of one second duration were extracted at 200 samples per second and subjected to Fast Fourier Transformations (FFT, Gould Instrument Systems, ISO 9001:2000 compliant). The average power spectrum was derived to validate the quality of signals recorded using the sub-dermal electrodes.
SID 5 (Rev. 05/09) Page 6 of 26
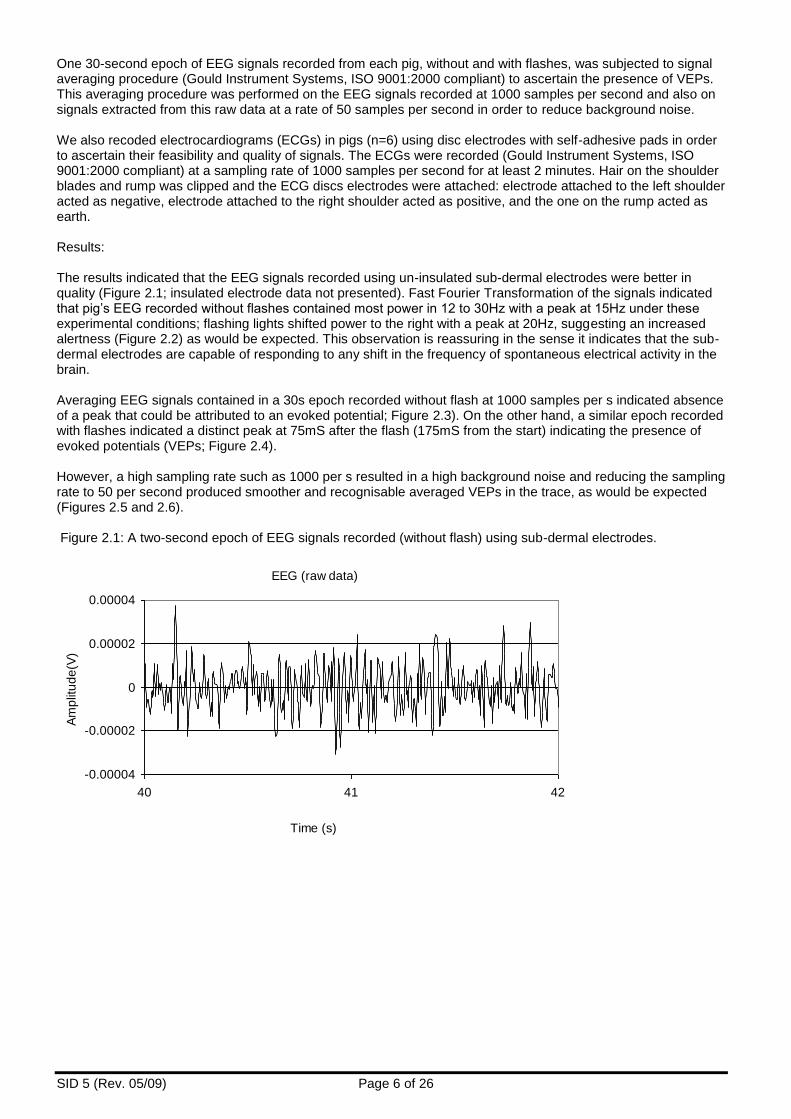
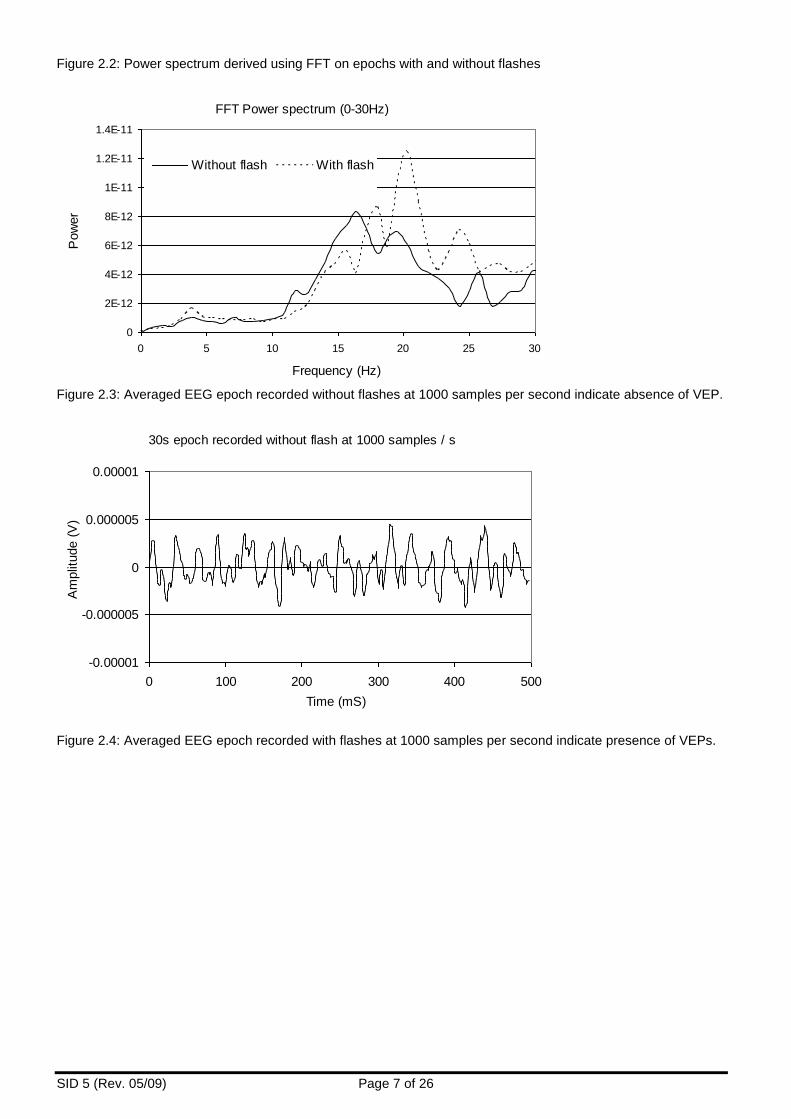
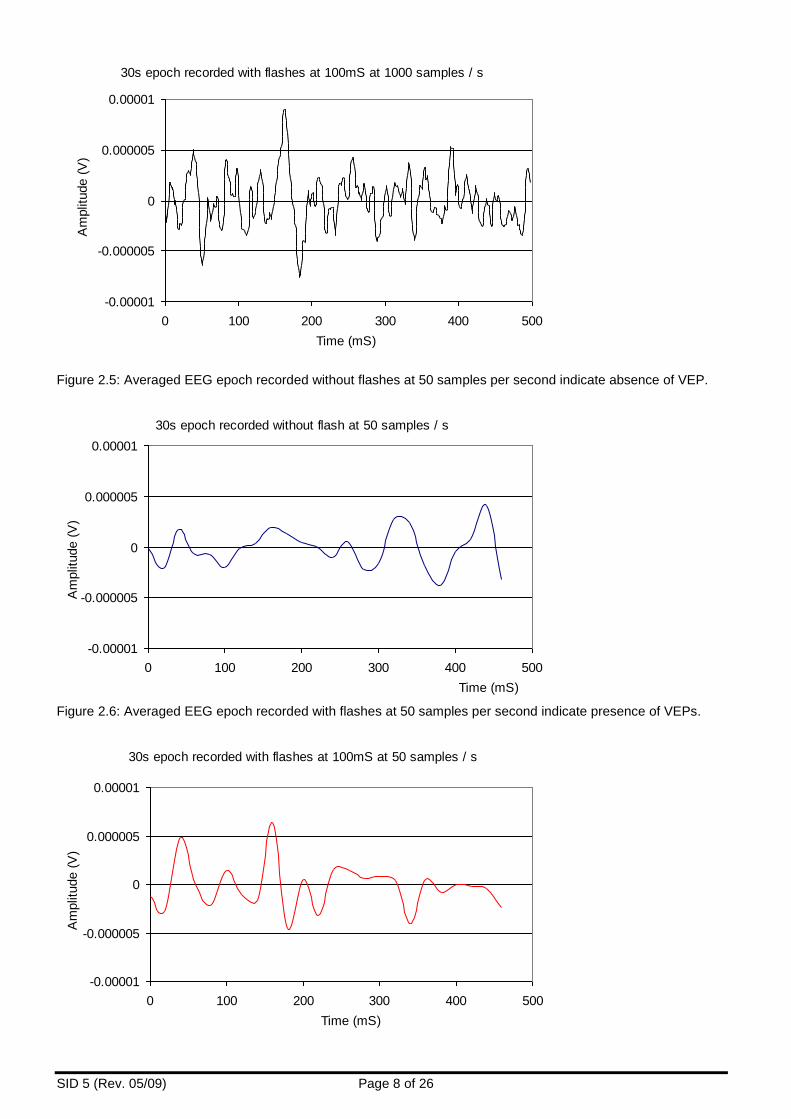
One 30-second epoch of EEG signals recorded from each pig, without and with flashes, was subjected to signal averaging procedure (Gould Instrument Systems, ISO 9001:2000 compliant) to ascertain the presence of VEPs. This averaging procedure was performed on the EEG signals recorded at 1000 samples per second and also on signals extracted from this raw data at a rate of 50 samples per second in order to reduce background noise. We also recoded electrocardiograms (ECGs) in pigs (n=6) using disc electrodes with self-adhesive pads in order to ascertain their feasibility and quality of signals. The ECGs were recorded (Gould Instrument Systems, ISO 9001:2000 compliant) at a sampling rate of 1000 samples per second for at least 2 minutes. Hair on the shoulder blades and rump was clipped and the ECG discs electrodes were attached: electrode attached to the left shoulder acted as negative, electrode attached to the right shoulder acted as positive, and the one on the rump acted as earth. Results: The results indicated that the EEG signals recorded using un-insulated sub-dermal electrodes were better in quality (Figure 2.1; insulated electrode data not presented). Fast Fourier Transformation of the signals indicated that pig’s EEG recorded without flashes contained most power in 12 to 30Hz with a peak at 15Hz under these experimental conditions; flashing lights shifted power to the right with a peak at 20Hz, suggesting an increased alertness (Figure 2.2) as would be expected. This observation is reassuring in the sense it indicates that the sub-dermal electrodes are capable of responding to any shift in the frequency of spontaneous electrical activity in the brain. Averaging EEG signals contained in a 30s epoch recorded without flash at 1000 samples per s indicated absence of a peak that could be attributed to an evoked potential; Figure 2.3). On the other hand, a similar epoch recorded with flashes indicated a distinct peak at 75mS after the flash (175mS from the start) indicating the presence of evoked potentials (VEPs; Figure 2.4). However, a high sampling rate such as 1000 per s resulted in a high background noise and reducing the sampling rate to 50 per second produced smoother and recognisable averaged VEPs in the trace, as would be expected (Figures 2.5 and 2.6). Figure 2.1: A two-second epoch of EEG signals recorded (without flash) using sub-dermal electrodes.
EEG (raw data)
-0.00004
-0.00002
0
0.00002
0.00004
40 41 42
Time (s)
Am
plit
ud
e(V
)
SID 5 (Rev. 05/09) Page 7 of 26
Figure 2.2: Power spectrum derived using FFT on epochs with and without flashes
FFT Power spectrum (0-30Hz)
0
2E-12
4E-12
6E-12
8E-12
1E-11
1.2E-11
1.4E-11
0 5 10 15 20 25 30
Frequency (Hz)
Pow
er
Without flash With flash
Figure 2.3: Averaged EEG epoch recorded without flashes at 1000 samples per second indicate absence of VEP.
30s epoch recorded without flash at 1000 samples / s
-0.00001
-0.000005
0
0.000005
0.00001
0 100 200 300 400 500
Time (mS)
Am
plit
ude (
V)
Figure 2.4: Averaged EEG epoch recorded with flashes at 1000 samples per second indicate presence of VEPs.
SID 5 (Rev. 05/09) Page 8 of 26
30s epoch recorded with flashes at 100mS at 1000 samples / s
-0.00001
-0.000005
0
0.000005
0.00001
0 100 200 300 400 500
Time (mS)
Am
plit
ude (
V)
Figure 2.5: Averaged EEG epoch recorded without flashes at 50 samples per second indicate absence of VEP.
30s epoch recorded without flash at 50 samples / s
-0.00001
-0.000005
0
0.000005
0.00001
0 100 200 300 400 500
Time (mS)
Am
plit
ude (
V)
Figure 2.6: Averaged EEG epoch recorded with flashes at 50 samples per second indicate presence of VEPs.
30s epoch recorded with flashes at 100mS at 50 samples / s
-0.00001
-0.000005
0
0.000005
0.00001
0 100 200 300 400 500
Time (mS)
Am
plit
ude (
V)
SID 5 (Rev. 05/09) Page 9 of 26
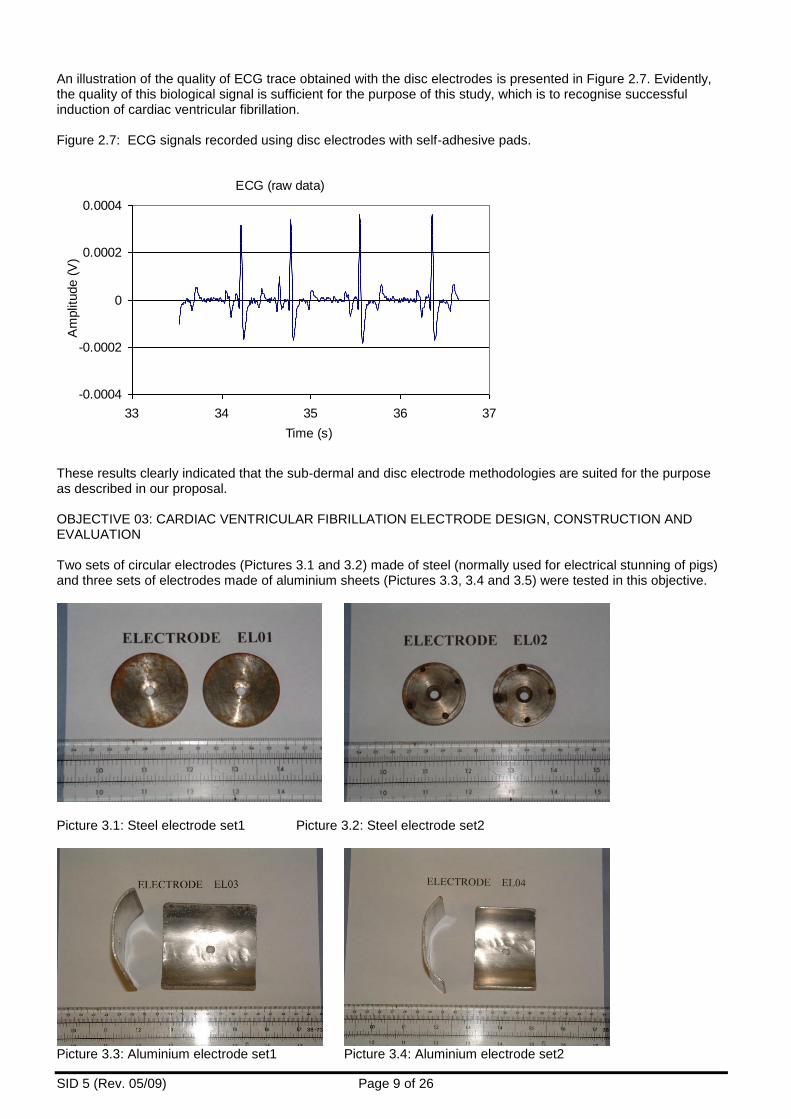
An illustration of the quality of ECG trace obtained with the disc electrodes is presented in Figure 2.7. Evidently, the quality of this biological signal is sufficient for the purpose of this study, which is to recognise successful induction of cardiac ventricular fibrillation. Figure 2.7: ECG signals recorded using disc electrodes with self-adhesive pads.
ECG (raw data)
-0.0004
-0.0002
0
0.0002
0.0004
33 34 35 36 37
Time (s)
Am
plit
ude (
V)
These results clearly indicated that the sub-dermal and disc electrode methodologies are suited for the purpose as described in our proposal. OBJECTIVE 03: CARDIAC VENTRICULAR FIBRILLATION ELECTRODE DESIGN, CONSTRUCTION AND EVALUATION Two sets of circular electrodes (Pictures 3.1 and 3.2) made of steel (normally used for electrical stunning of pigs) and three sets of electrodes made of aluminium sheets (Pictures 3.3, 3.4 and 3.5) were tested in this objective.
Picture 3.1: Steel electrode set1 Picture 3.2: Steel electrode set2
Picture 3.3: Aluminium electrode set1 Picture 3.4: Aluminium electrode set2

SID 5 (Rev. 05/09) Page 10 of 26
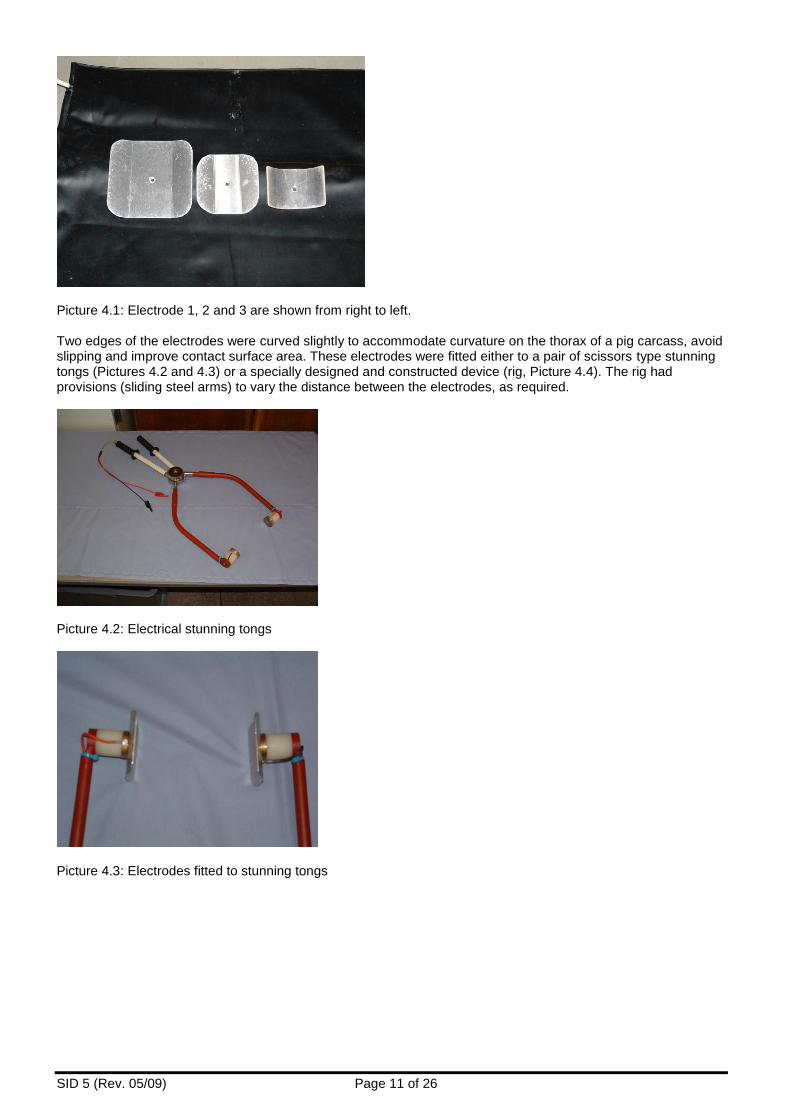
Picture 3.5: Aluminium electrode set3 All the electrode sets were made using readily available materials and were attached to a pair of electrical stunning tongs and applied on 61 freshly slaughtered pig carcasses distributed across the treatments. These were subjectively evaluated for ease of application, ability to grip and maintain good electrical contact during current application. The electrical current was applied in these experiments by gradually raising the voltage from 0 to 300V (wind up) and immediately winding down to 0V (wind down). The voltage and current profiles were recorded digitally to help determine good or bad electrical contact. This practical experience indicated that (a) the circular steel electrodes were not ideal for the purpose as they were difficult to grip on to carcasses and they invariably slipped during current application leading to insufficient electrical contact between the carcass and the electrodes; (b) the rectangular or square electrodes made of aluminium enabled good grip and also maintain good contact; (c) the maximum size for aluminium electrodes would be about 10cm, as electrodes with larger surface areas failed to fully make contact with the carcass surface due the curvature; and (d) the surface area available on the necks of pigs would limit the size of electrode to be placed / used on them. It was thought that the use of aluminium electrodes has some advantages: (a) lighter than steel and therefore less likely to cause operator fatigue on repeated application, (b) has good electrical conducting properties, (c) relatively cheaper and readily available, and (d) they could be made (replaced) locally as and when required. OBJECTIVE 04: DETERMINATION OF TRANS-THORACIC ELECTRICAL IMPEDANCE / RESISTANCE IN PIGS An experiment was designed to investigate the effects of the size of electrodes, position or placement on the pig carcasses and a range of constant voltages on the measured electrical impedance/resistance. Materials and methods: Preliminary experiments were carried out using freshly killed pig carcasses and square aluminium electrodes to determine the threshold voltage level beyond which no significant reduction in the measured trans-thoracic impedance was apparent. The results of these experiments, in which the applied voltage was gradually raised from 0 to 300V (wind up technique) and immediately wound down to 0V, suggested that a minimum root mean squared (RMS) voltage of 100V would be adequate to break down carcass electrical resistance in the pathway between the electrodes within 2 seconds of current application. Nevertheless, it was thought that an evaluation using a wide range of voltages would enable a better prediction / statistical modelling. This experiment involved continuous measurement of electrical impedance in 324 freshly slaughtered pig carcasses (within 10 minutes of slaughter) while spanning the heart with three different sizes of electrodes placed manually over three positions on the carcasses and delivering six voltages of sine wave AC continuously for five seconds (3 electrodes x 3 positions x 6 voltages = 54 treatments x 6 pigs per treatment). The electrodes (Picture 4.1) were made of aluminium sheet and their dimensions were: Electrode 1 - 5.1cm x 7.6cm (38.76 cm2) Electrode 2 - 7.6cm x 7.6cm (57.76 cm2) Electrode 3 - 10.2cm x 10.2cm (122.4 cm2)
SID 5 (Rev. 05/09) Page 11 of 26
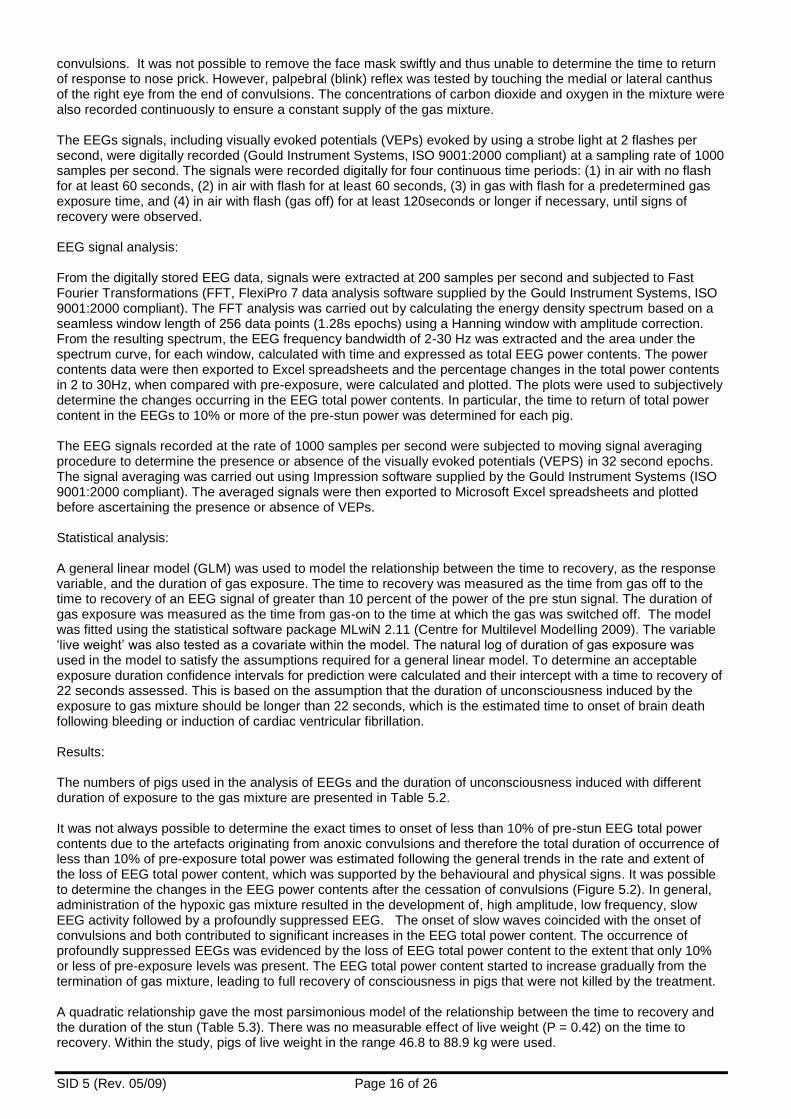
Picture 4.1: Electrode 1, 2 and 3 are shown from right to left. Two edges of the electrodes were curved slightly to accommodate curvature on the thorax of a pig carcass, avoid slipping and improve contact surface area. These electrodes were fitted either to a pair of scissors type stunning tongs (Pictures 4.2 and 4.3) or a specially designed and constructed device (rig, Picture 4.4). The rig had provisions (sliding steel arms) to vary the distance between the electrodes, as required.
Picture 4.2: Electrical stunning tongs
Picture 4.3: Electrodes fitted to stunning tongs

SID 5 (Rev. 05/09) Page 12 of 26
Picture 4.4: A rig designed and constructed for unilateral current application (please see carcass position below) The carcass positions were: Position 1 - Trans-thoracic application behind the shoulder / elbow using a pair of stunning tongs Position 2 - Dorso-ventral (back to brisket) application using a pair of stunning tongs Position 3 - Unilateral application using a hand held device (rig) under which the front electrode was placed on the neck (in front of the shoulder) and the rear electrode was placed on the chest. The distance between the two electrodes was fixed at 31cm and was applied by holding the ear with left hand and pressing the electrodes against the chest on the left hand side of the carcasses. It is worth mentioning that the rig could be pressed, using one hand and minimum of effort, against a carcass if it was presented laterally on a conveyor or any hard surface. When the stunning tongs were applied in trans-thoracic or dorso-ventral positions, both the electrodes were of the same dimension, i.e. 38.76 cm2, 57.76 cm2, or 122.4 cm2. However, size of the front electrode of the rig was restricted to a maximum of 7.6cm x 7.6cm due to the size and curvature of the neck. Therefore, the sizes of front and rear electrodes differed slightly during the application of rig, as shown below: Electrode set 1 Electrode set 2 Electrode set 3 Front 5.1cm x 7.6cm 7.6cm x 7.6cm 7.6cm x 7.6cm Rear 5.1cm x 7.6cm 7.6cm x 7.6cm 10.2cm x 10.2cm A constant voltage sine wave alternating current source (stunning device) was used to supply six voltages to the electrodes: 25, 50, 75, 100, 125 and 150V. The electrodes were applied firmly at appropriate position on the carcass prior to switching the current source on, which was previously calibrated to deliver a pre-set voltage using a dummy load of 330 Ohms. A relay switch was used to apply the voltage for 5 seconds. The root mean squared (RMS) voltage and current profiles were recorded digitally for each pig, using an Elditest Differential Voltage Probe and a Fast Response Current Probe respectively (both supplied by RS Electronics, Corby, Northamptonshire, UK), on to a Vision Data Acquisition system, which was calibrated according to the manufacturer’s guidelines. The data were sampled at 10 samples per second using RMS coupling (sampling at 2.5 kHz over 0.1s). Each set of current and voltage data corresponding to a pig carcass was then exported to Excel spread sheets and the changes occurring in the electrical impedance were calculated for every 0.1s. The relationship between the measured impedance and the applied voltage, position and size of electrodes was modelled using a general linear model (GLM) in the statistics program SPSS (SPSS Inc., v12.0). Impedance was treated as the response variable with electrode size and electrode position as two categorical variables. Terms for voltage, voltage squared and voltage cubed were fitted as covariates. Results: Application 75V or more with all the three electrode sets and three positions on the carcass induced visible tetanus in the carcasses.

SID 5 (Rev. 05/09) Page 13 of 26
The results of a preliminary statistical analysis (ANOVA) indicated that size of the electrodes had a significant effect on the measured impedance (Figure 4.1; P<0.001). Overall, as would be expected according to the law of electricity, increasing the size of electrodes from 38.76cm2 to 57.76cm2 decreased the measured impedance on average about 95 Ohms (LSD = 4.73) and increasing the electrode size to 122.40cm2 resulted in a further reduction in measured impedance of about 39 Ohms (LSD = 4.62). Figure 4.1: Effect of electrode size on measured impedance (pooled data).
0
50
100
150
200
250
300
350
38.76 sq.cm 57.76 sq.cm 122.40 sq.cm
Electrode size
Imped
ance
(O
hm
s)
The position of electrodes had a minor but not significant effect, in this sense, the average impedance for transthoracic, dorso-ventral and unilateral applications were 216, 237, 224 Ohms, respectively. Increasing applied voltage from 25 to 150V had a significant effect on the measured impedance (Table 4.1; P<0.001) and the relationship between these two variables was curvilinear. The decrease in measured impedance due to increasing voltage was found to be greater between 25 and 125V. Table 4.1: Effect of applied voltages on measured impedance (Ohms).
Applied voltage (V) Average impedance (Ohms) Standard error
25 427 3.54
50 273 1.84
75 208 1.32
100 172 1.03
125 148 0.73
150 139 0.78
The analysis of variance table for the final fitted general linear model (GLM) (Table 4.2) showed the measured impedance was significantly affected by the electrode size (P<0.001), applied voltage (P<0.001) and position on the carcass (P<0.05). The parameter estimates, their standard errors and significance are shown in Table 4.3. The GLM was used to model ln(Impedance) (ln = negative logarithm) in terms of ln(Voltage) and an interaction effect between electrode type and position. Table 4.2: Tests of Between-Subjects Effects Dependent Variable: lnImpedance
Source Type III Sum of Squares Df Mean Square F Sig.
Corrected Model 53.86 (a) 9 5.98 139.29 0.000
Intercept 2422.57 1 2422.57 56388.24 0.000
Electrode 13.041 2 6.52 151.78 0.000
Position 0.308 2 0.15 3.58 0.029
Electrode * Position 0.51 4 0.13 2.94 0.021
InVoltage 38.77 1 38.77 902.36 0.000
Error 12.72 296 0.04
Total 8672.82 306
Corrected Total 66.57 305
(a) R Squared = .809 (Adjusted R Squared = .803)

SID 5 (Rev. 05/09) Page 14 of 26
Table 4.3: Parameter Estimates Dependent Variable: lnImpedance
Parameter B Std. Error T Sig 95% Confidence Interval
Lower Upper
Intercept 5.76 0.042 137.41 0.000 5.68 5.84
Electrode = 1 0.47 0.051 9.34 0.000 0.37 0.57
Electrode = 2 0.17 0.051 3.35 0.001 0.07 0.27
Electrode = 3 0 (a)
Position = 1 -0.12 0.051 -2.39 0.017 -0.22 -0.02
Position = 2 0.07 0.05 1.42 0.156 -0.027 0.17
Position = 3 0 (a)
Electrode 1 * Position 1 0.16 0.07 2.26 0.025 0.021 0.305
Electrode 1 * Position 2 -0.08 0.07 -1.09 0.278 -0.22 0.06
Electrode 1 * Position 3 0 (a)
Electrode 2 * Position 1 0.07 0.07 1.02 0.307 -0.07 0.22
Electrode 2 * Position 2 -0.03 0.07 -0.47 0.642 -0.17 0.11
Electrode 2 * Position 3 0 (a)
Electrode 3 * Position 1 0 (a)
Electrode 3 * Position 2 0 (a)
Electrode 3 * Position 3 0 (a)
InVoltage -0.60 0.02 -30.04 0.000 -0.64 -0.56
(a) This parameter is set to zero because it is redundant. Clearly, all the three electrode sizes (P<0.001) and position 1 (trans-thoracic) (P<0.017) had significant effects on the measured impedance values. The interaction between the electrodes and positions was significant only for electrode size 1 and position 1 (P<0.025). Overall, these results indicate that for the purpose of inducing CVF (a) electrodes as large as possible should be used; (b) a minimum RMS voltage of 100V would be required to overcoming the carcass electrical impedance / resistance rapidly (within 0.2 second); and (c) trans-thoracic application of electrodes would be better than then other two positions. However, the true voltage required to creating a current field sufficient to inducing CVF in gas-stunned pigs could be different, which was determined in Objective 06. OBJECTIVE 05: DETERMINATION OF THE EFFECT OF DURATION OF EXPOSURE ON THE DURATION OF UNCONSCIOUSNESS IN PIGS Previous research has indicated that the maximum time to onset of brain death, as determined from the time to abolition of visually evoked potentials (VEPs) in the brain was 22 seconds following the induction of cardiac arrest in unconscious pigs. It was therefore thought at the outset of this project that the minimum duration of unconsciousness induced with the gas mixture should be at least longer than the time interval between the end of exposure to the gas mixture and the application of CVF current plus 22 seconds to ensure good animal welfare at slaughter. More importantly, we need to establish the maximum permissible time, on animal welfare grounds, between the end of exposure to gas mixture and the successful application of the CVF current (see, Figure 5.1). Figure 5.1: Original assumption regarding the relationship between the duration of exposure, induction of CVF and time to onset of brain death.

SID 5 (Rev. 05/09) Page 15 of 26
Materials and methods: The effect of duration of exposure to the gas mixture on the duration of unconsciousness was evaluated on the basis of occurrence of isoelectric EEGs in pigs, which was determine on the basis of the total power content (2 to 30 Hz EEG frequency band) in EEG being 10% or less of pre-exposure levels. In total, 36 pigs were used to standardise administration of gas mixtures and EEG and ECG recording procedures. When satisfactory records were produced, a further 131 pigs were used to evaluate the experimental protocol in this Objective 05. Data concerning 44 out of 131 pigs were either lost or interrupted during recording due to artefacts caused by convulsions and the numbers of pigs included in the evaluation of EEGs (N=87) in each of the treatment and their dressed carcass weights are presented in Table 5.1. Table 5.1: Number of pigs used in the evaluation of the effect of duration of exposure to gas mixture on total power contents in the EEGs.
Duration (seconds) of exposure to a mixture of 85% nitrogen and 15% carbon dioxide
90 s 120 s 180 s 240 s 300 s 360 s
No. of pigs used for EEG analyses
11
17
19
18
13
9
Dressed carcass weight in Kg (mean + S.D.)
77 + 6.4
66 + 12.4
67 + 8.6
69 + 5.8
70 + 7.3
72 + 5.7
Each pig was restrained in a hammock and the fleece over the forehead was clipped and implanted with the sub-dermal EEG recording electrodes (<0.5 mm diameter, Oxford Instruments, UK). The negative electrode was placed on the right frontal bone 10 to 20 mm rostral to the lambdoid suture and 5 to 10mm lateral to the midline, positive electrode was placed 30mm rostral and 5mm lateral to the negative electrode. A common electrode was placed on the left parietal bone at equidistance between the positive and negative electrodes. A fourth one was used as ground electrode and placed 10mm lateral to the common. These sub-dermal electrodes were secured using superglue. A face mask was then fitted to the pig for the purpose of administering the gas mixture. We also recorded electrocardiograms (ECGs) in pigs using disc electrodes with self-adhesive pads in order to ascertain the effect of gaseous exposure on the on heart rate. The ECGs were recorded (Gould Instrument Systems, ISO 9001:2000 compliant) at a sampling rate of 1000 samples per second. Fleece over the shoulder blades and rump was clipped and the ECG discs electrodes were attached: electrode attached to the left shoulder acted as negative, electrode attached to the right shoulder acted as positive, and the one on the rump acted as common. Online ECG monitoring was used, in addition to EEG, to determining death in pigs. Off-line, the heart rate was counted manually and averaged for every 10 second epochs of ECG and plotted using Excel spreadsheets. A mixture containing 15% by volume of carbon dioxide and 85% by volume nitrogen (zero per cent residual oxygen) was prepared with a mixing panel using pure sources of these two gases and administered at the rate of 45 litres per minute using a face mask for 90, 120, 180, 240, 300 or 360 seconds. The face mask was tightly secured to the harness in order to prevent gas leakage and to withstand vigorous head shaking occurring during
SID 5 (Rev. 05/09) Page 16 of 26
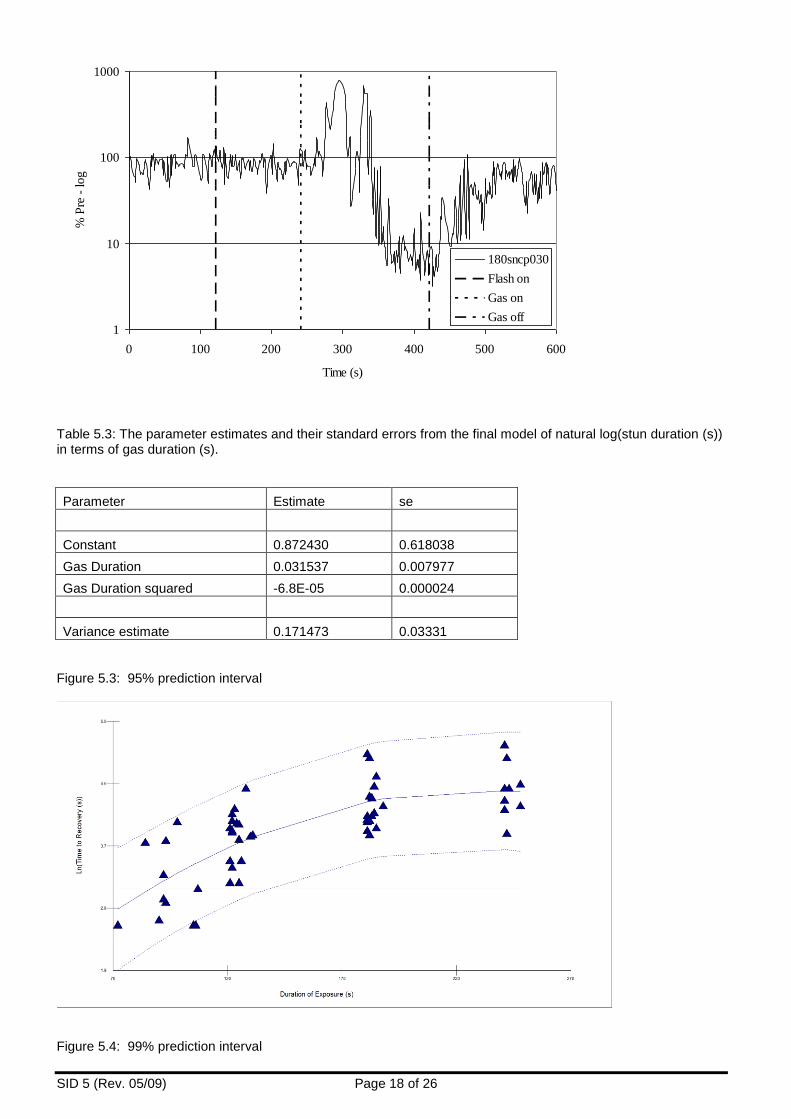
convulsions. It was not possible to remove the face mask swiftly and thus unable to determine the time to return of response to nose prick. However, palpebral (blink) reflex was tested by touching the medial or lateral canthus of the right eye from the end of convulsions. The concentrations of carbon dioxide and oxygen in the mixture were also recorded continuously to ensure a constant supply of the gas mixture. The EEGs signals, including visually evoked potentials (VEPs) evoked by using a strobe light at 2 flashes per second, were digitally recorded (Gould Instrument Systems, ISO 9001:2000 compliant) at a sampling rate of 1000 samples per second. The signals were recorded digitally for four continuous time periods: (1) in air with no flash for at least 60 seconds, (2) in air with flash for at least 60 seconds, (3) in gas with flash for a predetermined gas exposure time, and (4) in air with flash (gas off) for at least 120seconds or longer if necessary, until signs of recovery were observed. EEG signal analysis: From the digitally stored EEG data, signals were extracted at 200 samples per second and subjected to Fast Fourier Transformations (FFT, FlexiPro 7 data analysis software supplied by the Gould Instrument Systems, ISO 9001:2000 compliant). The FFT analysis was carried out by calculating the energy density spectrum based on a seamless window length of 256 data points (1.28s epochs) using a Hanning window with amplitude correction. From the resulting spectrum, the EEG frequency bandwidth of 2-30 Hz was extracted and the area under the spectrum curve, for each window, calculated with time and expressed as total EEG power contents. The power contents data were then exported to Excel spreadsheets and the percentage changes in the total power contents in 2 to 30Hz, when compared with pre-exposure, were calculated and plotted. The plots were used to subjectively determine the changes occurring in the EEG total power contents. In particular, the time to return of total power content in the EEGs to 10% or more of the pre-stun power was determined for each pig. The EEG signals recorded at the rate of 1000 samples per second were subjected to moving signal averaging procedure to determine the presence or absence of the visually evoked potentials (VEPS) in 32 second epochs. The signal averaging was carried out using Impression software supplied by the Gould Instrument Systems (ISO 9001:2000 compliant). The averaged signals were then exported to Microsoft Excel spreadsheets and plotted before ascertaining the presence or absence of VEPs. Statistical analysis: A general linear model (GLM) was used to model the relationship between the time to recovery, as the response variable, and the duration of gas exposure. The time to recovery was measured as the time from gas off to the time to recovery of an EEG signal of greater than 10 percent of the power of the pre stun signal. The duration of gas exposure was measured as the time from gas-on to the time at which the gas was switched off. The model was fitted using the statistical software package MLwiN 2.11 (Centre for Multilevel Modelling 2009). The variable ‘live weight’ was also tested as a covariate within the model. The natural log of duration of gas exposure was used in the model to satisfy the assumptions required for a general linear model. To determine an acceptable exposure duration confidence intervals for prediction were calculated and their intercept with a time to recovery of 22 seconds assessed. This is based on the assumption that the duration of unconsciousness induced by the exposure to gas mixture should be longer than 22 seconds, which is the estimated time to onset of brain death following bleeding or induction of cardiac ventricular fibrillation. Results: The numbers of pigs used in the analysis of EEGs and the duration of unconsciousness induced with different duration of exposure to the gas mixture are presented in Table 5.2. It was not always possible to determine the exact times to onset of less than 10% of pre-stun EEG total power contents due to the artefacts originating from anoxic convulsions and therefore the total duration of occurrence of less than 10% of pre-exposure total power was estimated following the general trends in the rate and extent of the loss of EEG total power content, which was supported by the behavioural and physical signs. It was possible to determine the changes in the EEG power contents after the cessation of convulsions (Figure 5.2). In general, administration of the hypoxic gas mixture resulted in the development of, high amplitude, low frequency, slow EEG activity followed by a profoundly suppressed EEG. The onset of slow waves coincided with the onset of convulsions and both contributed to significant increases in the EEG total power content. The occurrence of profoundly suppressed EEGs was evidenced by the loss of EEG total power content to the extent that only 10% or less of pre-exposure levels was present. The EEG total power content started to increase gradually from the termination of gas mixture, leading to full recovery of consciousness in pigs that were not killed by the treatment. A quadratic relationship gave the most parsimonious model of the relationship between the time to recovery and the duration of the stun (Table 5.3). There was no measurable effect of live weight (P = 0.42) on the time to recovery. Within the study, pigs of live weight in the range 46.8 to 88.9 kg were used.

SID 5 (Rev. 05/09) Page 17 of 26
The final model is shown graphically in Figure 5.3 together with a 95% prediction interval and in Figure 5.4 with a 99% prediction interval. The horizontal line (parallel to X axis) in each graph denotes a time of 22 seconds, which is the estimated time to onset of brain death following cardiac arrest. It can be seen from the graphs that exposure of pigs to the gas mixture for 140 seconds would be expected to lead to fewer than 95% of pigs recovering within 22 seconds and that a 165 second exposure would be expected to lead to less than 99% of pigs recovering within 22 seconds. These results suggest that the duration of unconsciousness induced in pigs with 90 and 120 seconds exposure to the gas mixture may not be adequate to successfully induce cardiac ventricular fibrillation (CVF) in all the pigs in a group stunning situation. However, CVF could be induced in these pigs prior to removal from the gaseous atmosphere. Exposure of pigs to the gas mixture for 180 seconds induced a minimum of 48 seconds of unconsciousness, and therefore, CVF electric current will have to be applied within 26 seconds (i.e. 48-22=26) of pigs exiting the gas mixture, if brain death occurs in these pigs 22 seconds after the induction of CVF. Exposure of pigs to the gas mixture for 240 seconds resulted in death in 50% of the pigs and, induced a minimum of 49 seconds of unconsciousness in the surviving pigs. Since it might be difficult to differentiate between these two groups of pigs, CVF current would have to be applied within 27 seconds (i.e. 49-22=26) of pigs exiting the gas mixture, if brain death occurs in these pigs 22 seconds after the induction of CVF. However, it is worth mentioning that whether successful induction of CVF requires 22 seconds to cause brain death remains to be evaluated under Objective 06. Prolonging the exposure time to 300 and 360 seconds resulted in death in all the pigs, and therefore, do not require CVF treatment. Further analysis of the data revealed that the visually evoked potentials (VEPs) were abolished during the occurrence of quiescent EEGs, as determined using the total power content. In this sense, data concerning the times to onset of 10% or less of pre-exposure EEG total power content and the times to abolition of VEPs revealed a linear relationship between these variables (Figure 5.5). Similarly, there was a linear relationship between the time to recovery of EEG total power content to 10% or more of pre-exposure levels and the time to return of VEPs (Figure 5.6). Palpebral (blink) reflex was absent during the occurrence of quiescent EEGs. Evaluation of ECGs revealed that the heart rate (Figure 5.7) increased during lifting and restraining operations and remained elevated during the initial stages of the inhalation of the gas mixture and started to decrease from 30 seconds of inhalation, reaching a minimum at about 90 seconds post-exposure. In pigs that survived the treatment, the heart rate started to increase from the moment of the termination of the gas mixture ad reached a maximum of three times the pre-exposure levels in some pigs. A closer examination of the ECGs revealed irregular or missing heart beats and abnormal ECG waveforms in pigs that had 180 seconds or more exposure to the gas mixture (Figure 5.8). Table 5.2: Duration of occurrence of less than 10% of pre-stun total EEG power after various exposure times to the gas mixture.
Duration (seconds) of exposure to a mixture of 85% nitrogen and 15% carbon dioxide
90 s 120 s 180 s 240 s 300 s 360 s
No. of pigs died in gas
0 out of 11
0 out of 17
3 out of 19
9 out of 18
13 out of 13
9 out of 9
Duration of occurrence of less than 10% of pre-stun total EEG power after exposure.
Min = 13 Max = 58 Mean= 26
Min = 24 Max = 94 Mean= 49
Min = 48 Max = 155 Mean= 79
Min = 49 Max = 176 Mean= 98
Not applicable [All the pigs died due to exposure to gas mixture]
Not applicable [All the pigs died due to exposure to gas mixture]
Figure 5.2: Changes in the total EEG power content during 180 seconds exposure to gas mixture
SID 5 (Rev. 05/09) Page 18 of 26
1
10
100
1000
0 100 200 300 400 500 600
Time (s)
% P
re -
lo
g
180sncp030
Flash on
Gas on
Gas off
Table 5.3: The parameter estimates and their standard errors from the final model of natural log(stun duration (s)) in terms of gas duration (s).
Parameter Estimate se
Constant 0.872430 0.618038
Gas Duration 0.031537 0.007977
Gas Duration squared -6.8E-05 0.000024
Variance estimate 0.171473 0.03331
Figure 5.3: 95% prediction interval
Figure 5.4: 99% prediction interval

SID 5 (Rev. 05/09) Page 19 of 26
Figure 5.5: Relationship between the time to onset of 10% or less of pre-exposure EEG total power content and time to abolition of VEPs. (Note: Time includes at least 120 seconds prior to gas administration)
Figure 5.6: Relationship between the time to recovery of EEG total power content to 10% or more of pre-exposure levels and time to return of VEPs. (Note: Time includes at least 120 seconds prior to gas administration)
SID 5 (Rev. 05/09) Page 20 of 26
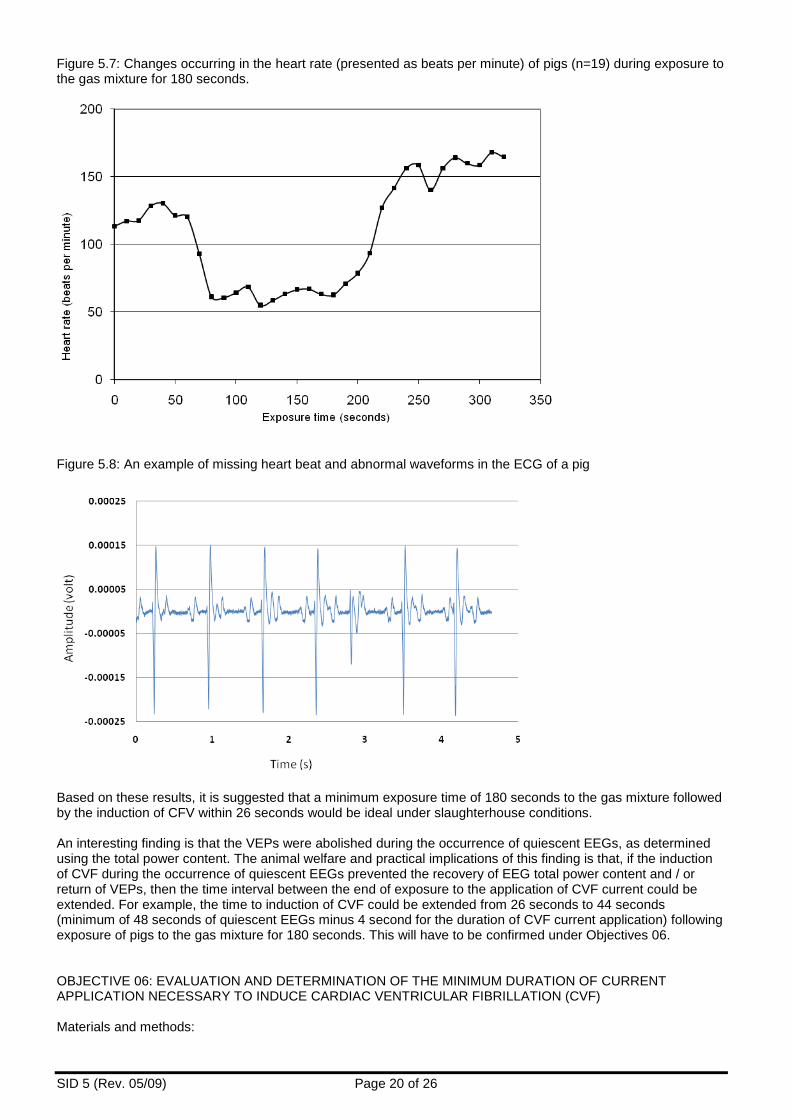
Figure 5.7: Changes occurring in the heart rate (presented as beats per minute) of pigs (n=19) during exposure to the gas mixture for 180 seconds.
Figure 5.8: An example of missing heart beat and abnormal waveforms in the ECG of a pig
Based on these results, it is suggested that a minimum exposure time of 180 seconds to the gas mixture followed by the induction of CFV within 26 seconds would be ideal under slaughterhouse conditions. An interesting finding is that the VEPs were abolished during the occurrence of quiescent EEGs, as determined using the total power content. The animal welfare and practical implications of this finding is that, if the induction of CVF during the occurrence of quiescent EEGs prevented the recovery of EEG total power content and / or return of VEPs, then the time interval between the end of exposure to the application of CVF current could be extended. For example, the time to induction of CVF could be extended from 26 seconds to 44 seconds (minimum of 48 seconds of quiescent EEGs minus 4 second for the duration of CVF current application) following exposure of pigs to the gas mixture for 180 seconds. This will have to be confirmed under Objectives 06. OBJECTIVE 06: EVALUATION AND DETERMINATION OF THE MINIMUM DURATION OF CURRENT APPLICATION NECESSARY TO INDUCE CARDIAC VENTRICULAR FIBRILLATION (CVF) Materials and methods:

SID 5 (Rev. 05/09) Page 21 of 26
In total, 74 slaughter weight pigs were used in this Objective. Pigs were individually restrained in a hammock and the gas mixture was administered at the rate of 45 litres per minute via the face mask for 180 seconds. The concentrations of carbon dioxide (mean +/- s.d. = 15.45 +/- 0.36 and oxygen (zero) in the gas mixture were recorded continuously. Six of these pigs were eliminated from the study mainly due to technical failures with the gas administration. The spontaneous EEGs were recorded, as described under the previous Objectives, for at least 60 seconds in air without strobe light flashes and used as baseline data set. The EEGs, including VEPs evoked with strobe light flashes administered at the rate of two per second, were recorded continuously for at least 60 seconds in air, 180 seconds during the gas administration, during and following the application of the CVF current to unconscious pigs in the hammock and until the carcasses were hoisted and bled out. The ECG was also recorded continuously using adhesive disc electrodes attached to skin over the two shoulder blades and the rump. The carcasses were bled out by severing major vessels at the thoracic inlet (commonly known as chest sticking) and allowed to bleed for at least 60 seconds. Unconscious pigs were subjected to one of the CVF treatments by applying an electric current across the chest (trans-thoracic application). The treatment groups were (2 skin conditions x 4 voltages x 4 duration of application): - dry or wet skin: CVF current applied to dry skin (as they arrived from the farm) or the skin covering the thorax was wetted using water-soaked dish-cloth just prior to the application of CVF current; - application of a constant root means squared (RMS) voltage of 110, 125, 150 or 175 V - the CVF current was applied for 1, 2, 3 or 4 seconds. CVF treatments were applied only if an isoelectric EEG was evident and palpebral and corneal reflexes were absent (indicative of a successful gas stunning). The CVF treatments were recorded as successful when pigs showed sustained loss of EEG and ECG activities, no respiratory movement including gagging, and dilated pupils following the application of the current. Pigs that were successfully killed by the CVF treatments were then hoisted and bled out. On the other hand, a CVF treatment was recorded as unsuccessful if the pig continued or resumed breathing (including gagging) and heart beat was evident in the ECG following the administration of the CVF current. These CVF treatments were deemed unacceptable and unviable under slaughterhouse conditions, on animal welfare grounds, and therefore discontinued if one or more pigs survived the treatment. This stringent approach also helped to fulfil commitment to 3Rs. All the pigs surviving CVF treatments were stunned by using a captive bolt pistol and bled out. The root mean squared (RMS) voltage and current profiles of the CVF treatment were calculated from the waveforms recorded digitally for each pig, using an Elditest Differential Voltage Probe and a Fast Response Current Probe respectively (both supplied by RS Electronics, Corby, Northamptonshire, UK), on to a Vision Data Acquisition system. The CVF treatment voltage and current profiles and the shunting voltage profiles were used to validate CVF treatments (e.g. Figure 6.1) and estimate the amount of voltage (V) and / or current (Amp). In order to determine whether electrical arcing or shunting of current occurred between the CVF electrodes, pair of button-shaped current probes, fixed 3.5 cm apart, were firmly positioned on the vertebral spine and in between the CVF electrodes and the RMS voltage profiles of the electric field on the skin surface was recorded digitally using one of the channels in the Gould digital data logger. Off-line, the EEG signals were subjected to FFT and the VEPs were subjected to moving averaging procedures as stated previously. The complete loss of EEG total power and abolition of VEPs were used to confirm the success of stunning and killing treatments. The ECG traces also plotted to confirm the effect of CVF treatments. Results: As reported in the previous Objective, administration of the gas mixture to pigs resulted in the loss of spontaneous as well as the evoked electrical activities in their brains, and failed to return following the application of successful CVF treatments. The changes occurring in the ECGs during and following the inhalation of the gas mixture were similar to those found the previous Objective and successful CVF treatments induced iso-electric ECGs. The results indicated that 125 V applied for 4 seconds over the wet and 175 V applied for 4 seconds over the dry skin surfaces were effective and induced CVF in all the pigs (n= 25 per treatment; Table 6.1). Possible underlying rate of failure for this sample size (n=25) is statistically estimated to be a minimum of 0% and a maximum of 13.3% at a 95% Confidence Interval and a minimum of 0% and a maximum of 21% at a 99% Confidence Interval.

SID 5 (Rev. 05/09) Page 22 of 26
The CVF treatment voltage and current profiles and the shunting voltage profile recorded for a pig are presented in Figure 6.1. Table 6.1: Parameters recorded for successful CVF treatments.
Dressed carcass wt. (kg)
Duration (s) of gas stun
Time (s) to induction of CVF (a)
Time (s) to bleed (a)
CVF treatment RMS volts
CVF treatment RMS Amps
CVF treatment duration (s)
Shunting RMS volts
125 V / 4 seconds / wet skin surface
Count 25 25 25 25 25 25 25 25
Minimum 56.60 179 4 145 120.10 0.64 4 0.65
Maximum 81.20 232 16 270 128.00 1.24 5 11.54
Average 65.06 185 10 184 123.20 0.95 4.5 4.23
S.D. 5.28 11 3 30 1.64 0.17 0.3 3.18
175 V / 4 seconds / dry skin surface
Count 25 25 25 25 25 25 25 25
Minimum 59.80 180 5 44 171.40 0.33 4 0.22
Maximum 77.20 191 18 238 177.80 1.23 5 11.56
Average 66.98 183 13 177 175.67 0.71 4.5 4.31
S.D. 4.76 3 4 36 1.52 0.19 0.4 2.93
Figure 6.1: Illustration of voltage (top) and current (middle) profiles of a CVF treatment and shunting electrical field (bottom).
The successful induction of unconsciousness by the gas stunning and induction of death by the CVF treatments can be evidenced by the abolition of VEPs (Figures 6.2, 6.3 and 6.4). Figure 6.2: Averaged EEG signals showing presence of VEPs between 100 and 200 milliseconds after flashes delivered in air (pre-exposure to gas).
SID 5 (Rev. 05/09) Page 23 of 26
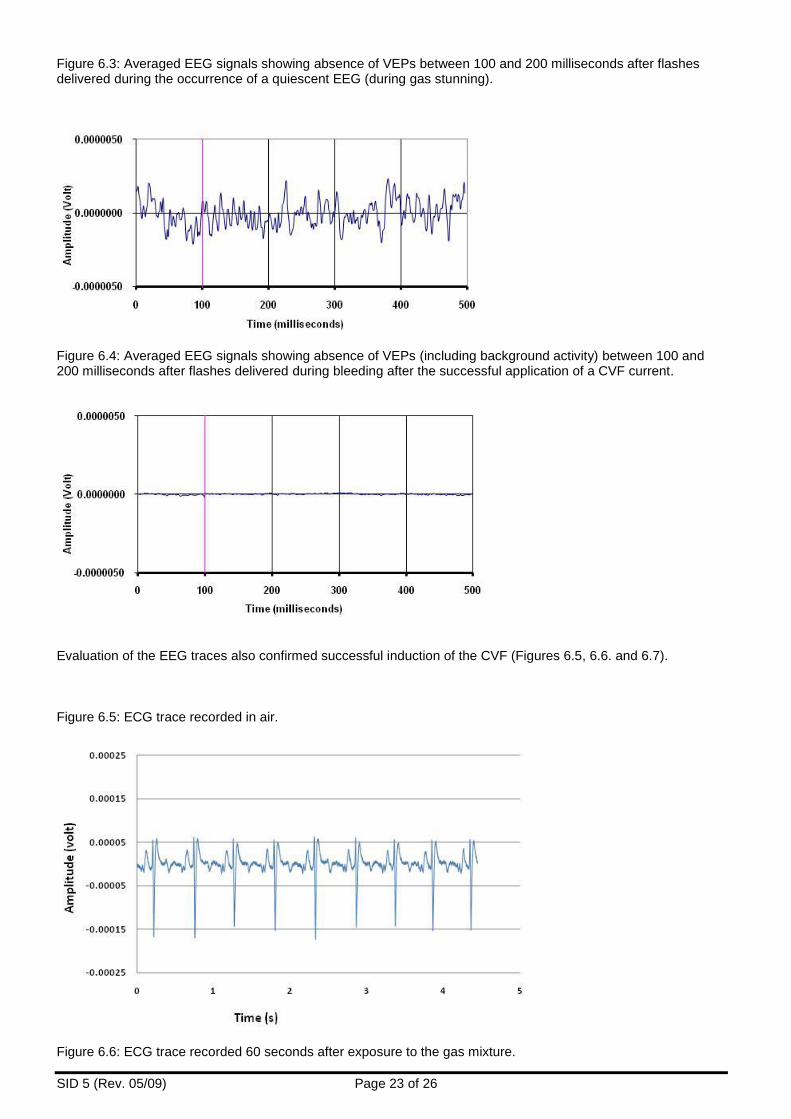
Figure 6.3: Averaged EEG signals showing absence of VEPs between 100 and 200 milliseconds after flashes delivered during the occurrence of a quiescent EEG (during gas stunning).
Figure 6.4: Averaged EEG signals showing absence of VEPs (including background activity) between 100 and 200 milliseconds after flashes delivered during bleeding after the successful application of a CVF current.
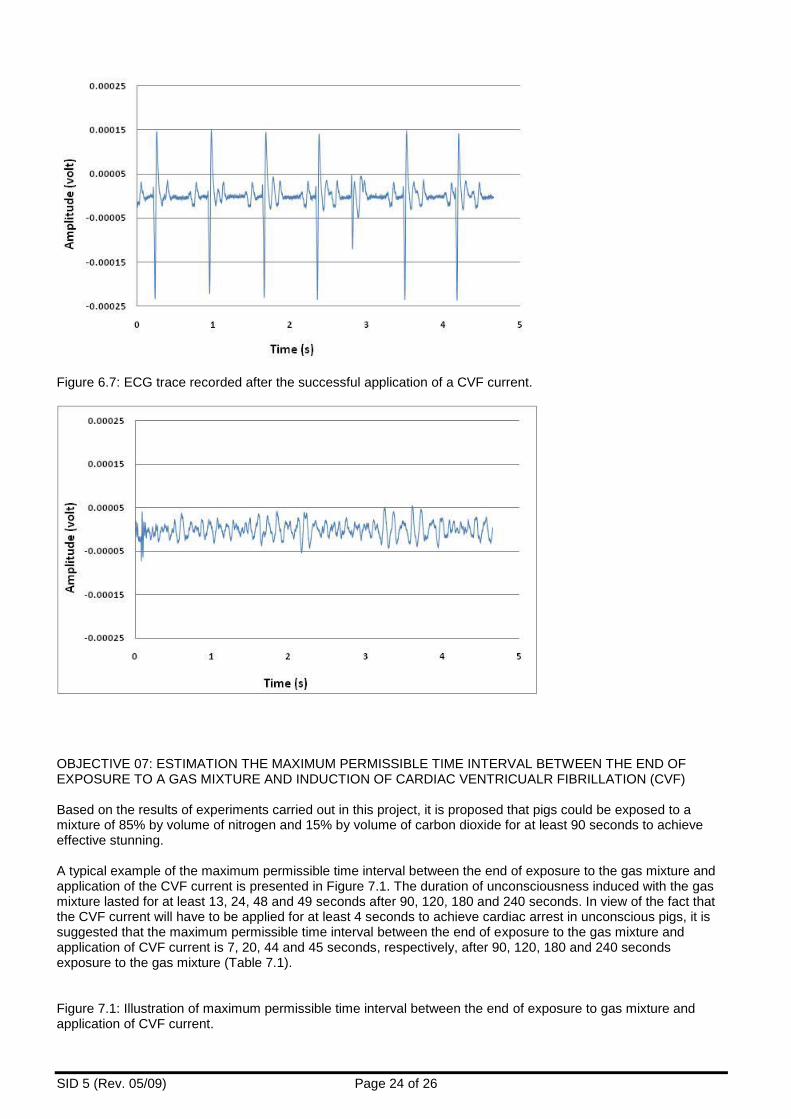
Evaluation of the EEG traces also confirmed successful induction of the CVF (Figures 6.5, 6.6. and 6.7). Figure 6.5: ECG trace recorded in air.
Figure 6.6: ECG trace recorded 60 seconds after exposure to the gas mixture.
SID 5 (Rev. 05/09) Page 24 of 26
Figure 6.7: ECG trace recorded after the successful application of a CVF current.
OBJECTIVE 07: ESTIMATION THE MAXIMUM PERMISSIBLE TIME INTERVAL BETWEEN THE END OF EXPOSURE TO A GAS MIXTURE AND INDUCTION OF CARDIAC VENTRICUALR FIBRILLATION (CVF) Based on the results of experiments carried out in this project, it is proposed that pigs could be exposed to a mixture of 85% by volume of nitrogen and 15% by volume of carbon dioxide for at least 90 seconds to achieve effective stunning. A typical example of the maximum permissible time interval between the end of exposure to the gas mixture and application of the CVF current is presented in Figure 7.1. The duration of unconsciousness induced with the gas mixture lasted for at least 13, 24, 48 and 49 seconds after 90, 120, 180 and 240 seconds. In view of the fact that the CVF current will have to be applied for at least 4 seconds to achieve cardiac arrest in unconscious pigs, it is suggested that the maximum permissible time interval between the end of exposure to the gas mixture and application of CVF current is 7, 20, 44 and 45 seconds, respectively, after 90, 120, 180 and 240 seconds exposure to the gas mixture (Table 7.1). Figure 7.1: Illustration of maximum permissible time interval between the end of exposure to gas mixture and application of CVF current.

SID 5 (Rev. 05/09) Page 25 of 26
Table 7.1: Duration of unconsciousness induced with the gas mixture and maximum permissible time interval between the end of exposure to gas mixture and application of CVF current.
Duration (seconds) of exposure to a mixture of 85% nitrogen and 15% carbon dioxide
90 s 120 s 180 s 240 s 300 s 360 s
Minimum duration of unconsciousness.
13 seconds
24 seconds
48 seconds
49 seconds (50% of the pigs died due to exposure to gas mixture)
Not applicable [All the pigs died due to exposure to gas mixture]
Not applicable [All the pigs died due to exposure to gas mixture]
Maximum permissible time between end of gas stunning and induction of CVF
7 seconds
20 seconds
44 seconds
45 seconds
References to published material
9. This section should be used to record links (hypertext links where possible) or references to other published material generated by, or relating to this project.

SID 5 (Rev. 05/09) Page 26 of 26
References Centre for Multilevel Modelling (2009) http://www.cmm.bristol.ac.uk/MLwiN/index.shtml