sickle cell anemia - charly d. millercharlydmiller.com/lib09/2000sicklecellteachinggenetics.pdf ·...
TRANSCRIPT

Sickle Cell Anemia:A Case Study Approach toTeaching High School Genetics
Developed by:Jeanne Ting Chowning, BioLabin partnership with The GENETICS Project
Provided by:The GENETICS Project andThe Genetics Education PartnershipEducation OutreachDepartment of Molecular BiotechnologyUniversity of Washington
October, 2000
Contents:¥ Sickle Cell Anemia Case Study: Summary¥ Sickle Cell Anemia and Genetics: Background Information¥ Sickle Cell Anemia: Blood Video Questions and Translation Practice
Worksheet¥ Sickle Cell Anemia: Diagnosis Using Simulated Restriction Analysis of
DNA. PreLab Reading and Questions¥ Sickle Cell Disease Diagnosis Lab. Student Instructions and Questions¥ Sickle Cel Anemia Lab: Diagnosis Using Simulated Restriction Analysis of
DNA. Teacher Information¥ Allele Frequencies and Sickle Cell Anemia Lab
Download this document at:http://genetics-education-partnership.mbt.washington.edu/Download/file.html

Contributed by Jeanne Ting Chowning, BioLab, Seattle, WAProvided by the GENETICS Project and the Genetics Education Partnership
University of Washington, Dept. of Molecular Biotechnology
2
Sickle Cell Anemia Case Study: Summary
Teacher: Jeanne Ting ChowningSchool: BioLab, Seattle, WAGrade Level: 10-12
Summary: Sickle cell anemia is an example of a genetic disease that can serve as a vehicle forteaching many biology concepts. Using a case study approach, opportunities arise to makeconnections not only to various aspects of genetics and molecular biology, but to physiology,evolution, and societal and ethical issues as well.
Instructional Materials (included with this Case Study):• Sickle Cell Anemia and Genetics: Background Information.• Allele Frequencies and Sickle Cell Anemia Lab. Student instructions, data sheet, analysis
questions, overhead master.• Sickle Cell Anemia: Blood Video Questions and Translation Practice Worksheet.• Sickle Cell Lab: Diagnosis Using Simulated Restriction Analysis of DNA.
--PreLab reading and questions--Student instructions and questions--Teacher information
List of Classroom Activities:• Mystery of the Crooked Cell PreLab Activities (includes viewing slides of normal and sickled
red blood cells).• Viewing Blood is Life video.• Sickle Cell Anemia: Blood Video Questions and Translation Practice Worksheet.• Sickle Cell Anemia: Diagnosis Using Simulated Restriction Analysis of DNA.• Viewing Children by Design video.• Bioethical Decision-Making.• Allele Frequencies and Sickle Cell Anemia Lab.
Description: Before beginning the unit, briefly review the circulatory system and the normalfunctions of its components, which were covered earlier in the semester. Then begin the sicklecell unit with the prelab activities described in “Mystery of the Crooked Cell.” Students arepresented with the symptoms of a patient with an “unknown” disease and must hypothesize itscause after completing four 10–20 minute prelab exercises, which include: examining slides ofdiseased and normal red blood cells (RBCs), modeling the occlusion of capillaries by sickledRBCs with hands-on manipulatives, using balloons and beads to build simple models of RBCscontaining either normal or mutant hemoglobin, and determining the inheritance pattern of thedisease based on the patient’s family history.
Extending the analysis of blood and hemoglobin in the prelab activities, students view the three-dimensional structure of hemoglobin on the Internet. Students watch Blood is Life, a video thatteaches about blood from the perspective of a young school teacher with sickle cell anemia.Students complete the Sickle Cell Anemia: Blood Video Questions and TranslationPractice, which reviews key concepts in the video and provides practice in conceptualtranscription and translation of the β globin gene, both normal and mutant.
Sickle cell disease provides a clear example of how changes in DNA can result in an alteredprotein. Dry labs or exercises such as the Translation Practice Worksheet can be used to

Contributed by Jeanne Ting Chowning, BioLab, Seattle, WAProvided by the GENETICS Project and the Genetics Education Partnership
University of Washington, Dept. of Molecular Biotechnology
3
illustrate this connection. How can the disease be diagnosed? How can people with a familyhistory of the disease learn whether they carry the trait? Discuss how the answers to thesequestions can be found by using restriction enzymes to analyze the DNA that codes for β globinand how hemoglobin itself can be analyzed by protein electrophoresis. Students can simulate arestriction analysis of wildtype and mutant β globin genes by eletrophoresing dyes through anagarose gel, as described in Sickle Cell Anemia: Diagnosis Using Simulated RestrictionAnalysis of DNA.
These activities lead naturally to the topic of genetic testing and a discussion of the ethicalconcerns that surround such testing. Use current newspaper and magazine articles related togenetics issues to get students thinking and stimulate discussion. Or watch one of several videosthat deal with these issues, such as Children By Design, which includes segments on genetictesting, gene therapy, and medical selection of disease-free early embryos for implantation. Tomake decisions about genetics-related ethical issues, such as denying a person insurancecoverage or employment based on his or her genotype, an ethical decision-making model likethat developed by the Hastings Center can be used (see references).
Sickle cell anemia, which is inherited as an autosomal codominant, also provides the opportunityto discuss classical Mendelian genetics. Further connections can be made to meiosis, gameteformation, and environmental influences that can affect phenotype. Lastly, sickle cell anemiaprovides an outstanding opportunity to build a connection between genetics and evolution.Students learn the mechanisms by which allele frequencies in a population change over time inresponse to selective forces (such as malaria) by using laboratory simulations and analyzingdisease distribution data. In the Allele Frequencies and Sickle Cell Anemia Lab, studentsrandomly draw red and white beans from “gene pool” containers to model the changes in βglobin allele frequencies in a population in response to the selective pressure of malaria.
Genetics Concepts: A number of genetics concepts are covered by state and national sciencestandards. This unit addresses the following concepts:• Classical Genetics/Central Dogma:
Genotype gives rise to phenotype.The two inherited alleles for a gene determine the phenotype for the trait.The DNA information provides instructions for building proteins.
• Molecular BiologyThe genetic information is encoded in DNA.
• Evolution:Changes in DNA, or mutations, cause new alleles to arise, leading to variation amongorganisms within a population.
• Applications:Genetics research has applications in many different fields.
• Ethics:Genetics research raises many ethical, legal, and social issues.
References:*“Teaching Biology Around Themes: Teach Proteins and DNA Together,” S. Offner,American Biology Teacher 54, #2 (1992).*“Making the Chromosome-Gene-Protein Connection,” C. Mulvihill, American BiologyTeacher 58, #6 (1996).*“Mystery of the Crooked Cell: An Investigation and Laboratory Activity About Sickle-CellAnemia,” D. A. DeRosa and B. L. Wolfe, American Biology Teacher 61, #2, 137-148.

Contributed by Jeanne Ting Chowning, BioLab, Seattle, WAProvided by the GENETICS Project and the Genetics Education Partnership
University of Washington, Dept. of Molecular Biotechnology
4
Slides of normal and sickled red blood cells. Order from Triarch Inc. (800-848-0810).Three-dimensional Hemoglobin on the Internet. (Requires the Chime plug-in.)http://info.bio.cmu.edu/Courses/BiochemMols/BuildBlocks/Hb.html.Blood is Life. 45 min. video. Order from Films for the Humanities & Sciences (800-257-5126).Children By Design. Video, Secret of Life series.New Choices, New Responsibilities: Ethical Issues in the Life Sciences. B. Jennings, K. Nolan,C. Campbell, S. Donnelley, E. Parens, L. Turner, E. DeVaro, 1997. Decision-making frameworkfor bioethical issues. Note: a review of this resource and ordering information can be found at:http://genetics-education-partnership.mbt.washington.edu/rev/resource_reviews/newch.html. Abrief description of the decision making template can be found at: http://genetics-education-partnership.mbt.washington.edu/Cool/tools/ethics.html.
*Note: American Biology Teacher has agreed to send out reprints of these articles upon request.To contact ABT, visit their website at: http://www.nabt.org/publications_journals.html.

Contributed by Jeanne Ting Chowning, BioLab, Seattle, WAProvided by the GENETICS Project and the Genetics Education Partnership
University of Washington, Dept. of Molecular Biotechnology
5
Sickle Cell Anemia and Genetics: Background InformationBackground information to accompany the labs: Allele Frequencies and Sickle Cell Anemia Laband Sickle Cell Anemia: Diagnosis Using Restriction Analysis of DNA
Genetics of Sickle Cell AnemiaSickle cell anemia was the first genetic disease to be characterized at the molecular level. Themutation responsible for sickle cell anemia is small—just ONE nucleotide of DNA out of thethree billion in each human cell. Yet it is enough to change the chemical properties ofhemoglobin, the iron and protein complex that carries oxygen within red blood cells.
There are approximately 280 million hemoglobin molecules in each red blood cell (RBC). Theprotein portion of hemoglobin consists of four globin subunits: two alpha (α) and two beta (β).These two types of subunits are encoded by the α and β globin genes, respectively. While thebinding of oxygen actually occurs at the iron sites, all four globin chains must work together inorder for the process to function well.
Sickle cell anemia, also known as sickle cell disease, is caused by a point mutation in the βglobin gene. As a result of this mutation, valine (a non-polar amino acid) is inserted into the βglobin chain instead of glutamic acid (an electrically charged amino acid). The mutation causesthe RBCs to become stiff and sometimes sickle-shaped when they release their load of oxygen.The sickle cell mutation produces a “sticky” patch on the surface of the β chains when they arenot complexed with oxygen. Because other molecules of sickle cell hemoglobin also develop thesticky patch, they adhere to each other and polymerize into long fibers that distort the RBC into asickle shape.
The sickled cells tend to get stuck in narrow blood vessels, blocking the flow of blood. As aresult, those with the disease suffer painful “crises” in their joints and bones. They may alsosuffer strokes, blindness, or damage to the lungs, kidneys, or heart. They must often behospitalized for blood transfusions and are at risk for a life-threatening complication called acutechest syndrome. Although many sufferers of sickle cell disease die before the age of 20, modernmedical treatments can sometimes prolong these individuals’ lives into their 40s and 50s.
There are two β globin alleles important for the inheritance of sickle cell anemia: A and S.Individuals with two normal A alleles (AA) have normal hemoglobin, and therefore normalRBCs. Those with two mutant S alleles (SS) develop sickle cell anemia. Those who areheterozygous for the sickle cell allele (AS) produce both normal and abnormal hemoglobin.Heterozygous individuals are usually healthy, but they may suffer some symptoms of sickle cellanemia under conditions of low blood oxygen, such as high elevation. Heterozygous (AS)individuals are said to be “carriers” of the sickle cell trait. Because both forms of hemoglobinare made in heterozygotes, the A and S alleles are codominant.
About 2.5 million African-Americans (1 in 12) are carriers (AS) of the sickle cell trait. Peoplewho are carriers may not even be aware that they are carrying the S allele!
Sickle Cell Anemia and MalariaIn the United States, about 1 in 500 African-Americans develops sickle cell anemia. In Africa,about 1 in 100 individuals develops the disease. Why is the frequency of a potentially fataldisease so much higher in Africa?
The answer is related to another potentially fatal disease, malaria. Malaria is characterized bychills and fever, vomiting, and severe headaches. Anemia and death may result. Malaria is causedby a protozoan parasite (Plasmodium) that is transmitted to humans by the Anopheles mosquito.

Contributed by Jeanne Ting Chowning, BioLab, Seattle, WAProvided by the GENETICS Project and the Genetics Education Partnership
University of Washington, Dept. of Molecular Biotechnology
6
When malarial parasites invade the bloodstream, the red cells that contain defective hemoglobinbecome sickled and die, trapping the parasites inside them and reducing infection.
Compared to AS heterozygotes, people with the AA genotype (normal hemoglobin) have agreater risk of dying from malaria. Death of AA homozygotes results in removal of A allelesfrom the gene pool. Individuals with the AS genotype do not develop sickle cell anemia and haveless chance of contracting malaria. They are able to survive and reproduce in malaria-infectedregions. Therefore, BOTH the A and S alleles of these people remain in the population. SShomozygotes have sickle cell anemia, which usually results in early death. In this way, S allelesare removed from the gene pool.
In a region where malaria is prevalent, the S allele confers a survival advantage on people whohave one copy of the allele, and the otherwise harmful S allele is therefore maintained in thepopulation at a relatively high frequency. This phenomenon will be examined in the AlleleFrequencies and Sickle Cell Anemia Lab, which relates the change in allele frequency in apopulation to evolution.
The frequency of the S allele in malaria-infected regions of Africa is 16%. The sickle cell alleleis also widespread in the Mediterranean and other areas where malaria is or used to be a majorthreat to life. In contrast, the S allele frequency is only 4% in the United States, where malariahas been virtually eliminated. Malaria was once common in the United States, but effectivemosquito control caused the number of cases to drop. Recently, however, there has been anincrease in the number of malarial cases because of increased travel, immigration, and resistanceto medication. In Southern California there was a 1986 outbreak of nearly 30 cases of malariatransmitted by local mosquitos!
Sickle Cell Anemia and Current ResearchThe oxygen requirements of a fetus differ from those of an adult, and so perhaps notsurprisingly, prenatal blood contains a special hemoglobin. Fetal hemoglobin contains twogamma (γ) globin polypeptide chains instead of two adult β chains. After birth, the genesencoding γ globin switch off, and the ones encoding β globin switch on. Understanding how thisgenetic switch works could allow researchers to understand much about the control of genes ingeneral and sickle cell anemia in particular.
Indian and Saudi Arabian people have a milder variation of sickle cell anemia, sometimes with nosymptoms. In this population twenty-five percent of each person’s hemoglobin is the fetal kind.Similarly, the blood of adults with an inherited condition called “hereditary persistence of fetalhemoglobin” also contains fetal hemoglobin and these individuals are healthy. Some peoplewith this condition completely lack adult hemoglobin and still show no ill effects. Biochemicalexperiments have demonstrated that, in a test tube, fetal hemoglobin inhibits polymerization ofsickle cell hemoglobin. These observations suggest that increasing fetal hemoglobin levels maybe an effective treatment for sickle cell anemia. There are a number of lines of research related toactivation of fetal hemoglobin as a therapy for sickle cell anemia:
• Some infants whose mothers suffered from diabetes during pregnancy have unusually highconcentrations of the biochemical butyrate in their blood plasma. Butyrate is a natural fattyacid that stimulates RBCs to differentiate from their precursors (reticulocytes). Butyrate alsoprevents the γ globin gene from switching off and the β globin gene from switching on in theseinfants, who are healthy despite lacking adult hemoglobin. When butyrate is given to patientswith sickle cell anemia, the γ globin mRNA levels in reticulocytes increase significantly.Perhaps butyrate or other chemicals that stimulate fetal hemoglobin production could be usedto treat sickle cell anemia.

Contributed by Jeanne Ting Chowning, BioLab, Seattle, WAProvided by the GENETICS Project and the Genetics Education Partnership
University of Washington, Dept. of Molecular Biotechnology
7
• In 1983, a drug called hydroxyurea (HU) was first used on sickle cell patients to try to activatetheir fetal globin genes. By 1995, clinical trials had demonstrated that HU could increase fetalhemoglobin levels in patients’ RBCs and prevent the cells from sickling. Patients treated withHU experienced less frequent and severe painful crises. However, hydroxyurea can be quitetoxic when used continuously to maintain elevated levels of fetal hemoglobin and can increasethe risk of leukemia.
• In 1992, it was found that alternating hydroxyurea with erythropoiten and providing dietaryiron raised the percentage of RBCs with fetal hemoglobin and relieved the joint and bone painof sickle cell disease. Erythropoiten is made in the kidneys and helps anemic patients replenishtheir RBCs. It can be manufactured for therapeutic use with recombinant DNA technology.
• Mice that have been genetically engineered to contain a defective human β globin gene havesymptoms typical of sickle cell anemia, making them an ideal model for laboratoryexperimentation. In 2000, these mice were mated to another transgenic mouse line expressinghuman fetal hemoglobin. When compared to their sickle cell parents, the offspring had greatlyreduced numbers of abnormal and sickled RBCs, increased numbers of RBCs overall (reducedanemia), and longer lifespans. These experiments established that only 9-16% of hemoglobinneed be the fetal type in order to ameliorate the sickle cell symptoms, and are an important firststep in a gene therapy solution to sickle cell disease.
Disclaimer:As with many “home-grown” resources teachers use in their classrooms, this backgroundmaterial was culled from a variety of sources and has been written, rewritten, and adapted byseveral people and then passed on to the next user. The exact, original source material is not at allclear, but some of the references below were used. We apologize if a source has beenunwittingly plagiarized.
References:Karlsson, S. The first steps on the gene therapy pathway to anti-sickling success. Nature Medicine6, 139-140, 2000.Blouin, M.-J., Beauchemin, H., Wright, A., De Paepe, M., Sorette, M., Bleau, A.-M., Nakamoto, B.,Ou, C.-N., Stamatoyannopoulos, G., and Trudel, M. Genetic correction of sickle cell disease:Insights using transgenic mouse models. Nature Medicine 6, 177-182.Keeton, W., and J. Gould. Biological Science, W.W. Norton and Co., NY, NY, 1986.Leary, W. Sickle Cell Trial Called Success, Halted Early, NY Times, January 31, 1995. pp. B5, B8.Lewis, R. Human Genetics: Concepts and Applications, 3rd ed., pp. 334-335, WCB/McGraw-Hill,Boston, 1999.Lewis, R. Case Workbook in Human Genetics, pp. 113-114, Wm C. Brown Publishers, Dubuque,IA, 1994.Micklos, D., and G. Freyer. DNA Science, Cold Spring Harbor Laboratory Press, Burlington, NC,1990.Modern Biology Inc. Catalog, Dayton, Indiana, 1995.National Heart, Lung, and Blood Institute. Clinical Alert - Drug Treatment for Sickle Cell Anemia.January 30. 1995. PharmInfoNet, http://pharminfo.com/drugdb/hydru_alert.html.Pines, M. Blood: The Bearer of Life and Death, Howard Hughes Medical Institute, Chevy Chase,MD, 1993.Tortora, G., B. Funke, and C. Case. Microbiology, Benjamin Cummings Publishing Co., Inc.,Redwood City, CA, 1992.

Contributed by Jeanne Ting Chowning, BioLab, Seattle, WAProvided by the GENETICS Project and the Genetics Education Partnership
University of Washington, Dept. of Molecular Biotechnology
8
Sickle Cell Anemia: Blood Video Questions and TranslationPractice Worksheet
Blood video/Sickle Cell BackgroundAfter watching the video Blood is Life and reading the handout Sickle Cell Anemia and Genetics:Background Information, answer the following questions.
1. Rosalyn has sickle cell anemia. Describe her symptoms.
2. Describe the structure of hemoglobin. (How many chains are there? What types? Why isiron necessary for blood?)
3. How does sickle hemoglobin differ from normal hemoglobin?
Sickle Cell at the Molecular LevelIn sickle cell anemia, there is a mutation in the gene that encodes the β chain of hemoglobin.Within this gene (located on Chromosome 11), ONE BASE in the DNA is replaced with anotherbase, and this mutation causes the normal amino acid #6 to be replaced by another amino acid.
1. Making a Normal Beta Chain of HemoglobinThe sequence below is the first part of the DNA sequence for the β chain of normal hemoglobin.Fill in the complementary DNA strand using the base-pairing rules for making DNA (A pairswith T, C pairs with G).
DNA: GTG CAC CTG ACT CCT GAG GAGDNA:
Now make the messenger RNA from the new, complementary strand of DNA that you justwrote down. Use the RNA base-pairing rules (same as DNA but use U instead of T).
mRNA:
Now, using the Genetic Code chart in your textbook, translate this mRNA into a sequence ofamino acids.
Amino Acids:
2. Making Sickle Cell HemoglobinIn sickle cell anemia, there is a mutation at the seventeenth nucleotide of DNA in this gene; thenucleotide is changed from A to T. Fill in the complementary DNA strand, mRNA, and aminoacid sequence in the hemoglobin protein.
DNA: GTG CAC CTG ACT CCT GTG GAG
DNA:
mRNA:
Amino Acids:
Contributed by Jeanne Ting Chowning, BioLab, Seattle, WAProvided by the GENETICS Project and the Genetics Education Partnership
University of Washington, Dept. of Molecular Biotechnology
9
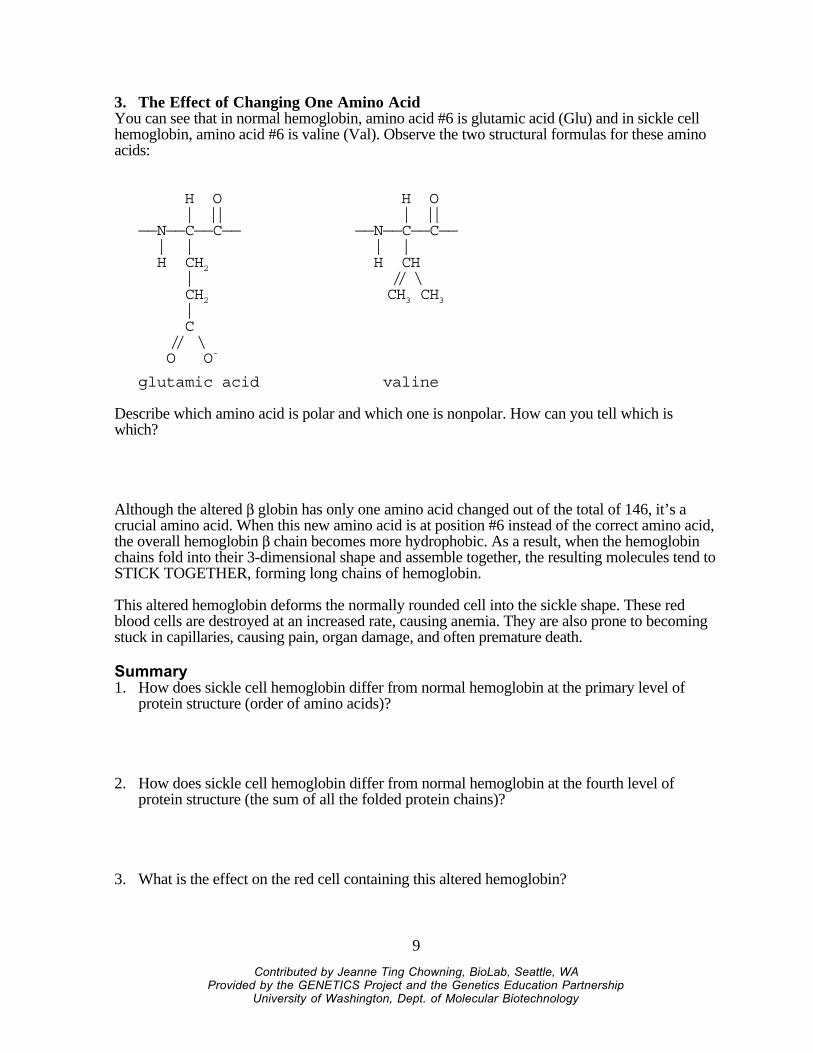
3. The Effect of Changing One Amino AcidYou can see that in normal hemoglobin, amino acid #6 is glutamic acid (Glu) and in sickle cellhemoglobin, amino acid #6 is valine (Val). Observe the two structural formulas for these aminoacids:
H O | ||——N——C——C—— | | H CH2 | CH2 | C // \ O O-
glutamic acid
H O | ||——N——C——C—— | | H CH // \ CH3 CH3
valine
Describe which amino acid is polar and which one is nonpolar. How can you tell which iswhich?
Although the altered β globin has only one amino acid changed out of the total of 146, it’s acrucial amino acid. When this new amino acid is at position #6 instead of the correct amino acid,the overall hemoglobin β chain becomes more hydrophobic. As a result, when the hemoglobinchains fold into their 3-dimensional shape and assemble together, the resulting molecules tend toSTICK TOGETHER, forming long chains of hemoglobin.
This altered hemoglobin deforms the normally rounded cell into the sickle shape. These redblood cells are destroyed at an increased rate, causing anemia. They are also prone to becomingstuck in capillaries, causing pain, organ damage, and often premature death.
Summary1. How does sickle cell hemoglobin differ from normal hemoglobin at the primary level of
protein structure (order of amino acids)?
2. How does sickle cell hemoglobin differ from normal hemoglobin at the fourth level ofprotein structure (the sum of all the folded protein chains)?
3. What is the effect on the red cell containing this altered hemoglobin?

Contributed by Jeanne Ting Chowning, BioLab, Seattle, WAProvided by the GENETICS Project and the Genetics Education Partnership
University of Washington, Dept. of Molecular Biotechnology
10
Genetics reviewLet A=allele for normal hemoglobin and S=allele for sickle hemoglobin.
1. What inheritance pattern does sickle cell anemia follow? (dominant, recessive, or other?)
2. What is Rosalyn’s genotype?
3. If Rosalyn has a child, what are the chances the child would have sickle cell anemia if thefather was a sickle cell carrier? Show using a Punnett square.

Contributed by Jeanne Ting Chowning, BioLab, Seattle, WAProvided by the GENETICS Project and the Genetics Education Partnership
University of Washington, Dept. of Molecular Biotechnology
11
Sickle Cell Anemia: Diagnosis Using Simulated RestrictionAnalysis of DNA.PreLab Reading and Questions
Background, Sickle Cell Anemia: Read the background information provided in the handout,Sickle Cell Anemia and Genetics: Background Information.
Background, DNA Restriction Analysis as a Diagnostic Tool:DNA obviously differs from one individual to another. However, some areas of DNA containquite a bit of sequence variation due to point mutations, deletions, insertions, and repetitions.These areas are often referred to as polymorphic regions (or “many-form places”). Alleles of agene are a familiar example of a polymorphism, for example, the A and S alleles of the β globingene. However, polymorphic regions usually do not code for peptide products.
When human DNA is digested with a particular restriction enzyme, a polymorphic region yieldsfragments of different sizes, called RFLPs (pronounced “riflips”, meaning “restrictionfragment length polymorphisms” -whew!). The fragments are separated by gel electrophoresis.In a technique called Southern Analysis, special probes are then used to bind to these fragments.(A probe is a molecule that can help you find the molecule you are interested in by binding to it.Often, probes are ‘tagged’ with a label such as radioactivity.) The patterns resulting on the gelcan be used to identify criminals or settle paternity cases. They can also be used in captivebreeding programs of endangered species (cheetahs and California condors, for example) toidentify genetically dissimilar parents and avoid inbreeding.
Another use of RFLP analysis is diagnosis of genetic diseases and identification of diseasecarriers. If a polymorphic region is close to the area responsible for a disease, they are said to belinked. Sometimes the polymorphic region that is capable of being cut with a restriction enzymeis known WITHIN the gene responsible for a disease. This is the case with sickle cell anemia. In1978, Yuet Wai Kan and Andrees Dozy of the University of California-San Francisco showedthat the restriction enzyme Mst II, which cuts normal β globin DNA at a particular site, will notrecognize (and therefore will not cut) DNA that contains the sickle cell mutation.
Mst II recognized the sequence CCTNAGG (where N = any nucleotide). Sickle cell disease isdue to a single point mutation in the β globin gene on chromosme 11 that changes CCTGAGGto CCTGTGG. Therefore, the A to T mutation that causes sickle cell anemia also causesthe loss of the recognition site for the restriction enzyme Mst II!
Thus, the DNA from normal homozygous individuals (AA), heterozygous carriers of the trait(AS), and homozygous sickle cell patients (SS) produces different sizes of restriction fragmentswhen cut with Mst II. In Southern blot analysis, these RFLPs are detected as characteristicbanding patterns, using a radioactive β globin gene probe.
PreLab Questions: Answer the following questions in your lab notebook in complete thoughts:
1. What are RFLPs and how are they used?
2. How can a restriction enzyme help identify carriers of sickle cell anemia?
3. If a person has sickle cell anemia and his or her beta globin DNA is cut with Mst II, will thefragments be longer or shorter than those from an individual without the disease? Explain!

Contributed by Jeanne Ting Chowning, BioLab, Seattle, WAProvided by the GENETICS Project and the Genetics Education Partnership
University of Washington, Dept. of Molecular Biotechnology
12
Sickle Cell Disease Diagnosis LabStudent Instructions and Questions
Objective: To simulate the diagnosis of sickle cell anemia with DNA restriction analysis.
Background: The “DNA” you will receive has, in this simulation, already been “cut” by theMst II restriction enzyme. You will separate the resulting fragments of DNA by gelelectrophoresis in order to diagnose the genotypes of all members of a family (mother, father,teenager, and fetus). Known samples will also be run for comparison.
DNA and dyes are ‘charged’ molecules that can be separated by gel electrophoresis. The dyeswe will use are charged in solution, just as DNA is. They will therefore move from the BLACKcathode (- end) to the RED anode (+ end). (Remember, negatively charged molecules such asDNA “run towards the red.”)
Procedure:1. Receive the seven “DNA” samples from your teacher. Record whether you have Family #1
or Family #2 in your lab notebook. The tubes are coded in the following manner:
Mother MFather FTeenager TFetus OKnown Normal NKnown Carrier CKnown Sickle Cell Patient S
2. Slide the gel into the box, wells facing up and closest to the black electrode.
3. Using a P-20 micropipet set to 8 µl, load each well in the gel with the samples. Take turnsloading with others in your group, making sure to use a new tip each time.
4. Draw a gel as shown below and indicate in your lab notebook which sample you put inwhich lane. Label this RESULTS. Draw the + and - ends of your gel so you remember theorientation.
1 2 3 4 etc.
Key1 = Mother2 = Father3 = Teenageretc.
-
+
RESULTS
Figure 1. Sample Resultsdiagram for lab notebook.

Contributed by Jeanne Ting Chowning, BioLab, Seattle, WAProvided by the GENETICS Project and the Genetics Education Partnership
University of Washington, Dept. of Molecular Biotechnology
13
5. If necessary, add more 1X TAE Buffer to the gel box so that the gel is adequately covered.(The buffer should cover the gel by about 1-2 mm.) Connect the electrodes to the gel boxand to the power supply (red to red, black to black).
6. Turn on the power supply and set it at about 120V. Run the gel for at least 10 minutes. Whileyour gel is running, make a second drawing of a gel showing what results you expect for thethree known samples. Label this PREDICTIONS.
7. Turn off the power supply, unplug the electrodes, and open the gel box. Lift the gel and deckand slide the gel back into the dish, pouring off extra buffer. For better viewing, place thedish on white paper. Color the pattern observed into your RESULTS drawing.
8. Throw away the gel and pour back buffer!! Put all equipment back into the supply box.
Analysis:1. Intrepret the results of the tests:
• Which family members have the sickle cell genotype (SS)?• Which family members have the carrier genotype (AS)?• Which family members have the normal genotype (AA)?
2. Draw a pedigree showing inheritance of sickle cell anemia in the family you analyzed.
3. Make a Punnett Square and explain the probabilities of various genotypes and phenotypesfor offspring given the parents’ genotypes. (Be sure that your square includes a key;A=normal allele, S=sickle allele).
4. Imagine that you are a genetic counselor. Based on your results, write a dialog between youand the parents of your family as you present them with the results of their genetic testing.Explain to them what their options are, both now and in the future. Use an understandingtone, and be aware of sensitive issues.
5. Should genetic changes that cause hereditary problems be diagnosed before birth? (For yourinformation, scientists estimate that each of us has at least six lethal recessive genes!)
6. What are some possible sources of error in this lab?

Contributed by Jeanne Ting Chowning, BioLab, Seattle, WAProvided by the GENETICS Project and the Genetics Education Partnership
University of Washington, Dept. of Molecular Biotechnology
14
Sickle Cell Anemia Lab: Diagnosis Using Teacher InformationSimulated Restriction Analysis of DNA.
Materials, per team:•gel electrophoresis box with casting tray andcomb
•power supply•P-20 micropipet and tips•rack for tubes•250 ml beaker for used tips•permanent marker•agarose (1%)
•“DNA” samples (dye mixtures of xylenecyanole and napthol blue)*
•1X TAE buffer, 150 ml (more if making a gelalso)
•acetate and blotter paper•plastic wrap•gloves and goggles
*To make dye mixtures, dissolve 0.025 grams xylene cyanole or napthol blue in 10 ml water and1 ml glycerol. For the heterozygote mixture, mix together equal amounts of each dye solution.
In most cases, you should pour and set up gels before class starts. However, depending on thelength of your class period, you may be able to make and run the gels on the same day. For thislab, it is assumed that students have prior knowledge of the principles behind electrophoresis andrestriction enzymes.
Napthol blue and xylene cyanole are dyes that are similar in color yet run differently enoughthrough the gel such that two distinct bands can be seen. They are both negatively charged andthus ‘run towards the red’ as DNA does. The dyes will diffuse quickly so make sure studentsrecord their results right away!
Xylene cyanole (XC) mimics the larger-fragment band (1350 bp, representing the S allele).Napthol blue (NB) mimics the smaller-fragment band (1150 bp, representing the A allele).A 1:1 mixture (XC + NB) of the two dyes mimics the carrier heterozygous genotype.
Individual Label Family 1 Key Family 2 KeyMother M Carrier (XC+NB) Carrier (XC+NB)
Father F Carrier (XC+NB) Normal (NB)
Teenager T Carrier (XC+NB) Normal (NB)
Fetus O Sickle (XC) Carrier (XC+NB)
Known Normal N Normal (NB) Normal (NB)
Known Carrier C Carrier (XC+NB) Carrier (XC+NB)
Known Sickle Cell Patient S Sickle (XC) Sickle (XC)
Extension Ideas:For ease of lab preparation, only two families have been included; however, more variationscould be created.
Have students try to determine the mode of inheritance of a disease based on restriction analysisof members of a large family.

Contributed by Jeanne Ting Chowning, BioLab, Seattle, WAProvided by the GENETICS Project and the Genetics Education Partnership
University of Washington, Dept. of Molecular Biotechnology
15
Use a hypothetical/imaginary disease and actual DNA to model disease diagnosis. Have studentscreate diagnostic tests using available enymes and the sequence of the disease gene.
Sources:Keeton, W., and J. Gould, Biological Science, W.W. Norton and Co., NY, NY, 1986.Leary, W., Sickle Cell Trial Called Success, Halted Early, New York Times, January 31, 1995.pp. B5, B8.Lewis, R., Case Workbook in Human Genetics, Wm C. Brown Publishers, Dubuque, IA, 1994.Micklos, D., and G. Freyer, DNA Science, Cold Spring Harbor Laboratory Press, Burlington,NC, 1990.Modern Biology Inc. Catalog, Dayton Indiana, 1995.Pines, M., Blood: The Bearer of Life and Death, Howard Hughes Medical Institute, ChevyChase, MD, 1993.Tortora, G., B. Funke, and C. Case, Microbiology, Benjamin Cummings Publishing Co., Inc.,Redwood City, CA, 1992.

Contributed by Jeanne Ting Chowning, BioLab, Seattle, WAProvided by the GENETICS Project and the Genetics Education Partnership
University of Washington, Dept. of Molecular Biotechnology
16
Allele Frequencies and Sickle Cell Anemia LabStudent Instructions
Objective: To observe how selective forces can change allele frequencies in a population andcause evolution to occur.
Background: Read the background information provided in the handout, Sickle Cell Anemiaand Genetics: Background Information.
Introduction: Allele frequency refers to how often an allele occurs in a population. Allelefrequencies can change in a population over time, depending on the ‘selective forces’ shapingthat population. Predation, food availability, and disease are all examples of selective forces.Evolution occurs when allele frequencies change in a population!
In this activity, red and white beans are used to represent two alleles of β globin. The RED beansrepresent gametes carrying the β globin A allele, and the WHITE beans represent gametescarrying the β globin S allele. The Gene Pool exists in a region of Africa that is infested withmalaria. You are simulating the effects of a high frequency of malaria on the allele frequencies ofa population.
Materials:75 red beans, 25 white beans, 5 containers (e.g. paper cups)
Hypothesis/Prediction:What do you think will happen to the frequencies of the A and S alleles as a result of thepresence of malaria? (Will the frequency of A increase or decrease? What about S?) Formulate ahypothesis and corresponding prediction. Be sure to explain your reasoning.
Procedure:
1. Together with your lab partner, obtain five containers and label them as follows:1) AA 2) AS 3) SS 4) Non-surviving alleles 5) Gene Pool
2. Place the 75 red and 25 white beans in the Gene Pool container and mix the beans up.
3. Simulate fertilization by PICKING OUT two ‘alleles’ (beans) WITHOUT LOOKING.
4. For every two beans that are chosen from the gene pool, another person will FLIP A COINto determine whether that individual is infected with malaria.
5. Using the table below, the coin flipper tells the bean picker in which containers to put thebeans.
Genotype Phenotype Malaria (Heads) Not infected (Tails)A A(Red-Red).
No sickle cell disease.Malaria susceptibility.
Die: place in Non-surviving Live: place in AA
A S(Red/White).
No sickle cell disease.Malaria resistance.
Live: place in AS Live: place in AS
S S(White/White)
Sickle cell disease. Die: place in Non-surviving Live for a brief time:place in SS

Contributed by Jeanne Ting Chowning, BioLab, Seattle, WAProvided by the GENETICS Project and the Genetics Education Partnership
University of Washington, Dept. of Molecular Biotechnology
17
6. Repeat steps 3–5 until all the beans in the Gene Pool are used up.
7. At the end of the round, COUNT the number of individual red beans (A alleles) and whitebeans (S alleles) in the containers labeled AA and AS. These individuals survive toreproduce. RECORD those numbers in the F1 TOTAL SURVIVING ALLELES table. Putthem in the gene pool afterwards.
8. Because SS individuals do not survive to reproduce, move all beans from the SS allelescontainer into the Non-surviving alleles container.
STOP AFTER ONE GENERATION.CHECK WITH YOUR TEACHER BEFORE GOING ON!
9. Repeat the procedure for the F2 generation. Record your results in the F2 TOTALSURVIVING ALLELES table.

Contributed by Jeanne Ting Chowning, BioLab, Seattle, WAProvided by the GENETICS Project and the Genetics Education Partnership
University of Washington, Dept. of Molecular Biotechnology
18
Data Sheet for Allele Frequencies and Sickle Cell Anemia Lab(All students need to record the data in their notebooks.)
F1 TOTAL SURVIVING ALLELES: (very important to record)Number of A (RED) alleles surviving (Count out of AA and AS containers)
Number of S (WHITE) allele surviving (Count out of AS container)
Put the survivors in the gene pool and create the next generation.
F2 TOTAL SURVIVING ALLELES: (very important to record)Number of A (RED) alleles surviving (Count out of AA and AS containers)
Number of S (WHITE) allele surviving (Count out of AS container)
Class ResultsOn the class overhead, record your number of A alleles surviving for the next generation andnumber of S alleles surviving from both the F1 TOTAL SURVIVING ALLELES and F2TOTAL SURVIVING ALLELES tables. Then record the class totals below and calculate thefrequencies using the formula below.
Using the formulas below, calculate the % allele frequency for each allele in each generation:
Total A x 100 = % Allele A Total S x 100 = % Allele STotal A+S Total A+S
Class Results TableParents F1 F2
A S A S A S
Class Total
Allele Frequency

Contributed by Jeanne Ting Chowning, BioLab, Seattle, WAProvided by the GENETICS Project and the Genetics Education Partnership
University of Washington, Dept. of Molecular Biotechnology
19
Analysis QuestionsAllele Frequencies and Sickle Cell Anemia Lab
Answer in complete thoughts!
1. What do the red and white beans represent in this simulation? What does the coin represent?(See background information.)
2. What do you think “allele frequency” means? How are allele frequencies related toevolution? (See background information.)
3. What are the “selective forces” in this simulation (the forces changing the allelefrequencies)?
4. What was the general trend you observed for Allele A over the three generations (did itincrease or decrease)? What was the general trend for Allele S over time? Was yourhypothesis supported?
5. Do you anticipate that the trends in question 4 will continue for many generations? Why orwhy not?
6. Since few people with sickle cell anemia (SS) are likely to survive to have children of theirown, why hasn’t the mutant allele (S) been eliminated? (Hint: what is the benefit of keepingit in the population?)
7. Why is the frequency of the sickle cell allele so much lower in the United States than inAfrica?
8. Scientists are working on a vaccine against malaria. What impact might the vaccine have inthe long run on the frequency of the sickle cell allele in Africa? (Would it increase ordecrease? Why?)
Challenge Question:What difference might the advent of new tecnology to diagnose and treat sickle cell disease andtrait make on the frequencies of the A and S alleles in the population?
Contributed by Jeanne Ting Chowning, BioLab, Seattle, WAProvided by the GENETICS Project and the Genetics Education Partnership
University of Washington, Dept. of Molecular Biotechnology
20
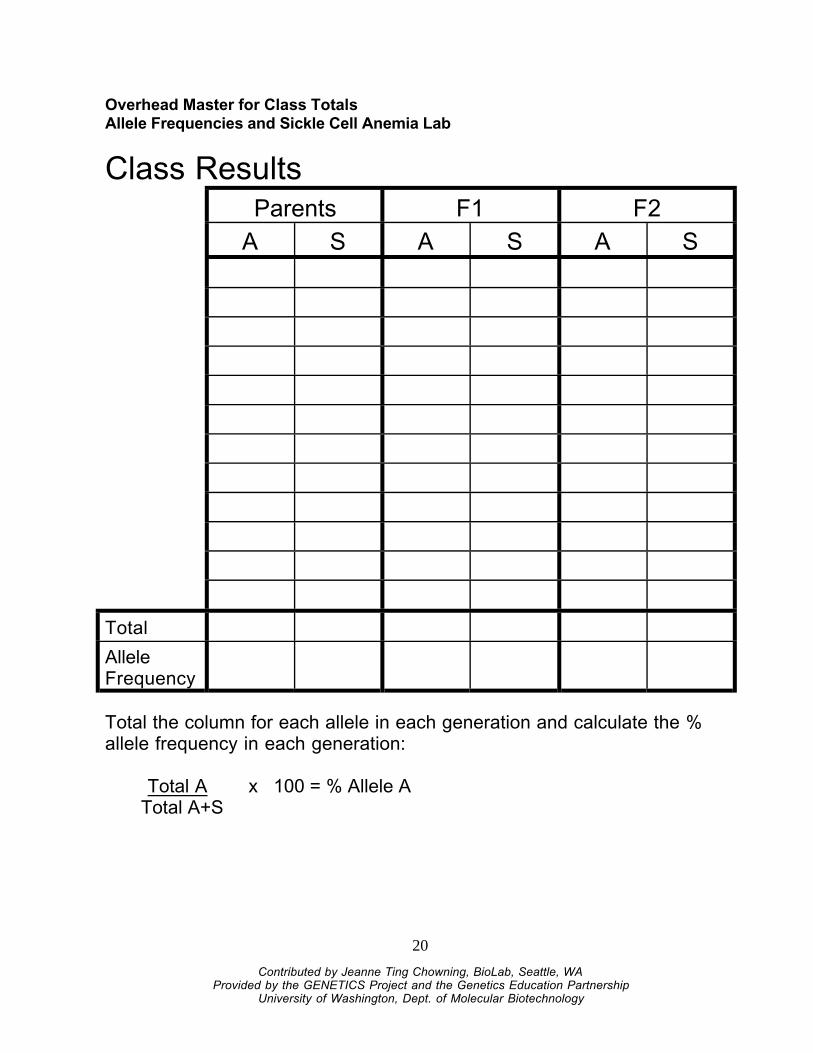
Overhead Master for Class TotalsAllele Frequencies and Sickle Cell Anemia Lab
Class ResultsParents F1 F2
A S A S A S
Total
AlleleFrequency
Total the column for each allele in each generation and calculate the %allele frequency in each generation:
Total A x 100 = % Allele ATotal A+S

Contributed by Jeanne Ting Chowning, BioLab, Seattle, WAProvided by the GENETICS Project and the Genetics Education Partnership
University of Washington, Dept. of Molecular Biotechnology
21