shrub effects on carbon dioxide and water vapor fluxes over grasslands
TRANSCRIPT
BioOne sees sustainable scholarly publishing as an inherently collaborative enterprise connecting authors, nonprofit publishers, academic institutions, researchlibraries, and research funders in the common goal of maximizing access to critical research.
Shrub Effects on Carbon Dioxide and Water Vapor Fluxes Over GrasslandsAuthor(s): A. B. Frank and J. F. KarnSource: Rangeland Ecology & Management, 58(1):20-26. 2005.Published By: Society for Range ManagementDOI: http://dx.doi.org/10.2111/04.05.1URL: http://www.bioone.org/doi/full/10.2111/04.05.1
BioOne (www.bioone.org) is a nonprofit, online aggregation of core research in the biological, ecological, andenvironmental sciences. BioOne provides a sustainable online platform for over 170 journals and books publishedby nonprofit societies, associations, museums, institutions, and presses.
Your use of this PDF, the BioOne Web site, and all posted and associated content indicates your acceptance ofBioOne’s Terms of Use, available at www.bioone.org/page/terms_of_use.
Usage of BioOne content is strictly limited to personal, educational, and non-commercial use. Commercial inquiriesor rights and permissions requests should be directed to the individual publisher as copyright holder.

Rangeland Ecol Manage 58:20–26 | January 2005
Shrub Effects on Carbon Dioxide and Water VaporFluxes Over Grasslands
A. B. Frank1 and J. F. Karn2
Authors are 1Plant Physiologist and 2Animal Scientist, USDA-ARS, Box 459, Hwy 6 S, Mandan, ND 58554.
Abstract
Temperate grasslands are a species-rich ecosystem that may be important in mitigating the increase in atmospheric CO2. Theeffect of shrub invasion on CO2 fluxes in Northern Great Plains grasslands is not known. The objectives of this research were todetermine CO2 and water vapor fluxes over a grazed mixed-grass prairie (prairie site) and a mixed-grass prairie that hasextensive invasion of shrubs (shrub prairie site). The Bowen ratio/energy balance (BREB) technique was used to determine CO2
and water vapor (ET) fluxes during a 4-year period from 1 May to 17 October in 1999, 2000, 2001, and 2002. Abovegroundbiomass and leaf area index (LAI) were measured about every 21 days throughout the growing season. Peak biomass occurredduring July to early August and averaged 1 763 kg � ha�1 for the prairie and 1 808 kg � ha�1 for herbaceous locations in the shrubprairie site. LAI of the herbaceous locations averaged 0.39 for the prairie site and 0.56 for the shrub prairie site. LAI for theshrubs in the shrub prairie site averaged 4.28. Total growing season CO2 fluxes were similar in prairie and shrub prairie sites,averaging about 350 g CO2 � m�2 (positive flux is CO2 uptake). However, the presence of shrubs altered the seasonal pattern offluxes. Carbon dioxide fluxes over the shrub prairie site were higher than over the prairie site early in the growing season in Mayand June, and were often lower than those of the prairie site late in the growing season in August, September, and October.Evapotranspiration rates from May to mid-October were higher in the prairie (521 mm) than the shrub prairie site (461 mm).These results suggest that shrub invasion on Northern Great Plains grasslands does not reduce the potential of grasslands tosequester atmospheric CO2.
Resumen
Los pastizales templados son ecosistemas ricos en especies que pueden ser importantes en mitigar el incremento del CO2
atmosferico. El efecto de la invasion de arbustos en los flujos CO2 de los Pastizales de las Grandes Planicies del Norte no esconocido. Los objetivos de esta investigacion fueron determinar los flujos de CO2 y vapor de agua en una pradera de zacatesmixtos apacentada (sitio de pradera) y en una pradera de zacates mixtos con una fuerte invasion de arbustos (sitio de praderacon arbustos). Para determinar los flujos de CO2 y vapor de agua (ET) se uso la tecnica de balance de la relacion Bowen/energıay el estudio se condujo durante un periodo de 4 anos del 1 de Mayo al 17 de Octubre de 1999, 2000, 2001 y 2002. La biomasaaerea y el indice de area foliar (LAI) se midieron aproximadamente cada 21 dıas a lo largo de la estacion de crecimiento. El picode produccion de biomasa ocurrio de Julio a inicios de Agosto y promedio 1 763 kg ha�1 para la pradera y 1 808 kg ha�1 paralas localidades herbaceas del sitio de pradera con arbustos. El LAI de las localidades herbaceas promedio 0.39 en el sitio depradera y 0.56 en el de pradera con arbustos. El LAI de los arbustos en el sitio de pradera con arbustos promedio 4.28. Losflujos totales de CO2 durante la estacion de crecimiento fueron similares en los sitios de pradera y de pradera con arbustos,promediando aproximadamente 350 g CO2 m�2 (el flujo positivo es la toma de CO2); sin embargo, la presencia de arbustosaltero el patron estacional de los flujos. A inicios de la estacion de crecimiento, en Mayo y Junio, los flujos de dioxido decarbono del sitio de pradera con arbustos fueron mayores que los del sitio de pradera, y a fines de la estacion de crecimiento, enAgosto, Septiembre y Octubre, a menudo fueron mas bajos que los del sitio de pradera. Las tasas de evapotranspiracion deMayo a mediados de Octubre fueron mayores en la pradera (521 mm) que en el sitio de pradera con arbustos (461 mm). Estosresultados sugieren que la invasion de arbustos en los pastizales de las Grandes Planicies del Norte no reducen el potencial de lospastizales para secuestrar CO2 atmosferico.
Key Words: rangeland, carbon sequestration, carbon budget, Bowen ratio, natural ecosystems
INTRODUCTION
Land-use changes and increasing fossil fuel use have contrib-uted to increased atmospheric CO2 concentrations (Watsonet al. 1996). To better understand the cycling of carbon (C),researchers have identified some natural and human-influencedC sources and sinks (Rastetter et al. 1992; Schimel 1995; Fan etal. 1998). Grassland ecosystems generally have been consideredan example of agricultural systems where soils are marginallyproductive yet contain high amounts of soil organic C, because
US Department of Agriculture, Agricultural Research Service, Northern Plains Area, is an
equal opportunity/affirmative action employer and all agency services are available without
discrimination.
The mention of commercial products in this paper is solely to provide specific
information for the reader. It does not constitute endorsement by the USDA Agricultural
Research Service over other products.
Correspondence: A. B. Frank, USDA-ARS, Box 459, Hwy 6 S, Mandan, ND 58554.
Email: [email protected]
Manuscript received 5 January 04; manuscript accepted 23 March 2004.
20 Rangeland Ecology & Management

the extensive fibrous root systems of grasses are effectiveaccumulators of C. Tropical forests are the largest terrestrialbiomass sinks for C, containing about 40% of the total Cstored in terrestrial ecosystems (Dixon et al. 1994). Temperategrassland ecosystems are a vast area comprising about 32% ofthe earth’s natural vegetation (Adams et al. 1990) and may havea significant role in the global C budget (Sundquist 1993; Batjes1998). Temperate region ecosystems, of which grasslands area part, also may be functioning as important C sinks that couldcontribute to reducing the rate of increase in atmospheric CO2
(Rastetter et al. 1992; Gifford 1994; Schimel 1995; Keeling etal. 1996; Fan et al. 1998). Globally, grasslands have thepotential to store 54 MMT C � yr�1 (Follett 2001).
The perennial nature of most grasslands along with the usuallow productivity of grassland soils raise questions about thepotential of grassland ecosystems to sequester and store C (Cole1996; Houghton et al. 1999). Measurements of CO2 fluxes overgrasslands provide important databases to evaluate this issue.The large diversity in vegetation and variability in climatepresent in grassland ecosystems suggest that CO2 fluxes must bemeasured across a wide range of grassland to accuratelyestimate their role in the global C budget. Flux measurementsfor the tallgrass prairie of eastern Texas (Dugas et al. 1999) andOklahoma (Suyker and Verma 2001), the mixed-grass prairie ofOklahoma (Sims and Bradford 2001), and the mixed-grassprairie of North Dakota (Frank and Dugas 2001) show thatgrasslands can be annual sinks for CO2. Generally, maximumCO2 flux coincides with periods of maximum leaf area andaboveground biomass accumulation. The size of the C sink ingrasslands is strongly affected by the high soil organic Ccontent typical of well-managed grasslands and precipitation.Soil C losses during the dormant season (nongrowing season)have been shown to be important in determining the amount ofC stored on an annual basis (Frank and Dugas 2001).
The objectives of this research were to determine themagnitude of CO2 and water vapor fluxes over a grazedmixed-grass prairie site and a grazed mixed-grass prairie sitethat has extensive invasion of shrubs. It is hypothesized thatCO2 fluxes for the 2 sites would be similar for the growingseason even though vegetation differs. This research is partof the USDA-Agricultural Research Service’s Rangeland CO2
Flux Project (Svejcar et al. 1997), which addresses the roleof grasslands in the global C cycle.
MATERIALS AND METHODS
The 2 sites in this study are located at the Northern GreatPlains Research Laboratory, Mandan, North Dakota (lat468469N, long 1008559W, elevation 518 m) on slopes of 2 to10%. One site is a typical mixed-grass prairie (prairie site) thathas been grazed by livestock at 2.6 ha � steer�1 from mid-Mayto mid-October each year since 1916. The second site (shrubprairie site) is a grazed mixed-grass prairie site locatedapproximately 1000 m north of the prairie site. The shrubprairie site has been grazed annually at about 2–3 ha � steer�1
from mid-May to mid-October since about 1970. Photographsof the shrub prairie site in 1923 showed the complete absenceof shrubs on the landscape. Shrub invasion likely occurredmainly from lack of fire and frequent light to no grazing from1923 until approximately 1970. The herbaceous vegetation at
each site is typical of the northern mixed-grass prairie and istypical of an Agropyron-Bouteloua-Stipa grassland (Whitmanand Barker 1994). The shrub prairie site differs from the prairiesite in that the landscape relief is more variable and about 32%of the surface area within a 200-m radius of the flux towersconsists of dense shrub patches that vary in size up to 30 m indiameter. Although this research was conducted on sites wheremanagement and aspect may have contributed to shrub in-vasion, the sites were otherwise typical of northern mixed-grassprairie. Because these factors resulted in natural shrub invasionon the shrub prairie site, and not the prairie site, suggests thatonly relative comparisons of these sites are acceptable. Thedominant shrub present was silver buffaloberry (Sheperdiaargentea Nutt) with smaller patches of western snowberry(Symphoricarpos occidentalis Hook.). Other species present,mostly as isolated individuals, were honeysuckle (Loniceraspp.), Russian olive (Elaeagnus angustifolia L.), and green ash(Fraxinus pennsylvanica Sarg.). The average height of theherbaceous canopy was 0.3 to 0.5 m, and height of shrubpatches ranged from 1 to 2.5 m. The soil at the sites isa Werner-Sen-Chama complex (loamy, mixed, superactive,frigid shallow Entic Haplustoll; fine-silty, mixed, superactive,frigid Typic Haplustoll; fine-silty, mixed, superactive, frigidTypic Calciustoll). Soil organic carbon to 1.1-m depth for theprairie site in 1993 was 11.7 kg � C � m�2 (Frank et al. 1995).These sites had not been fertilized, treated with herbicides, orburned for at least 30 years prior to the initiation of fluxmeasurements.
Plant biomass and green leaf area of the herbaceouscomponent within the prairie and shrub prairie sites weremeasured by surface clipping 4 representative 0.25-m2 quadratslocated about 20–60 m in each direction from the flux towersabout every 21 days beginning in mid-April through mid-October each year in 1999, 2000, 2001, and 2002. Leaves weremanually separated from stems, and leaf area was measuredusing a belt-driven photoelectric area meter. Green leaves, greenstems, and dead material were oven dried at 708C for 72 hoursand weighed to obtain total aboveground live and deadbiomass. Leaf area of the shrub component within the shrubprairie site was measured each year in mid-July by clipping 4representative 1-m2 quadrats in shrub patches near the herba-ceous vegetation sample locations. The shrub biomass sampleswere processed the same as the herbaceous samples.
Soil water content (SWC) was monitored to 1.2-m depth byneutron attenuation on 8 dates in 1999 and 10 dates in 2000,2001, and 2002. Two access tubes were located within 5 m ofthe instrument towers to measure SWC of representativeherbaceous locations in the prairie and shrub prairie sites.Two access tubes were also located in shrub patches in theshrub prairie site.
Twenty-minute averages of CO2 and water vapor fluxeswere measured from 1 May through 17 October in 1999, 2000,2001, and 2002 using Bowen ratio/energy balance (BREB)instrumentation (Model 023/CO2 Bowen ratio system, Camp-bell Scientific, Inc., Logan, Utah) mounted on a flux tower ateach site to provide at least 200 m of fetch in all directions fromthe towers. The flux tower in the shrub prairie site was locatedin an exposed, slightly elevated area to reduce the effects of thecanopy roughness created by the shrub patches. Fluxes werecalculated using methods described by Dugas (1993) and Dugas
58(1) January 2005 21

et al. (1999). Bowen ratios were calculated from temperatureand humidity gradients measured every 2 seconds from arms at1 and 2 m above the canopy. Sensible heat flux was calculatedfrom the Bowen ratio, average net radiation (Model Q�7 netradiometer, REBS, Seattle, Washington), and average soil heatflux calculated from 2 soil heat flux plates (Model HFT, REBS)and soil temperatures measured above the plates. The netradiometer was calibrated against a laboratory standard overgrass vegetation each year before use. Calibrations showed thatsensor sensitivities were constant over years. The turbulentdiffusivity, assumed equal for heat, water vapor, and CO2, wascalculated using the 20-minute sensible heat flux and temper-ature gradient measurements. Twenty-minute averages of CO2
flux, corrected for vapor density differences at the 2 heights(Webb et al. 1980), were calculated as a product of turbulentdiffusivity and the 20-minute average CO2 gradient that wasmeasured along with the humidity. When the BREB method forcalculating turbulent diffusivity was not valid because ofdifferences in the sign of the sensible/latent heat flux and thetemperature/humidity gradient, turbulent diffusivity was cal-culated using wind speed, atmospheric stability, and canopyheight (Dugas et al. 1999). Canopy height of the herbaceouscomponent of the vegetation was measured at least 3 times eachgrowing season. The alternative method was used approxi-mately 10% of the time and those instances occurred almostexclusively at night, when CO2 and water vapor gradients weresmall (Dugas et al. 1999). Carbon dioxide and water vaporconcentration gradients between the 2 heights were measuredwith an infrared gas analyzer (Model 6262, Li-Cor, Inc.,Lincoln, Nebraska). The airstream from each arm was switchedbetween the 2 analyzer cells every 2 minutes. Analyzers werecalibrated weekly using a gas mixture of near-ambient CO2
concentration. Fluxes were not corrected for temperaturedifferences in the 2 airstreams, because in tests described byAngell et al. (2001), fine wire thermocouple measurementsindicated air temperatures from the 2 arms were not differentwhen entering the sample and reference chambers of theanalyzer. Measurements from the BREB system were averagedevery 20 minutes and stored with a data logger (Model 21X,Campbell Scientific, Inc.).
Over the course of the study, equipment malfunction causedthe loss of some 20-minute flux averages. The longest period ofdata loss occurred during a 5-day period from 24 June to 29June 2000 due to instrument malfunction. Average daily CO2
and water vapor fluxes over 10-day periods were calculated andreported here. Standard errors of the mean were calculated for
the 10-day means and for the seasonal fluxes. Missing dayswere not included in daily flux averages. Positive CO2 fluxesrepresent uptake by the vegetation.
RESULTS AND DISCUSSION
The long-term (85 years) annual precipitation at a weatherstation located about 4 km north from the field sites is 404 mm.Annual precipitation totals during this study were greatest in2001 when the prairie site received 534 mm and the shrubprairie site received 541 mm, and lowest in 2002 whenprecipitation totals at both sites were about half of the 2001totals (Table 1). Precipitation during the flux measurementperiods each year from 1 May to 17 October was similar for
Table 1. Precipitation during the flux measurement period of 1 May to17 October during 1999, 2000, 2001, and 2002. Numbers in parenthesesare annual precipitation for each year.
Year Prairie Shrub Prairie
(mm)
1999 493 (511) 475 (493)
2000 305 (492) 310 (497)
2001 375 (534) 382 (541)
2002 166 (288) 150 (212)
Means 335 (456) 347 (436)
Figure 1. Seasonal measurements of aboveground green biomass forprairie and shrub prairie sites. The clippings were made about every 21days beginning in mid-April to mid-October in 1999, 2000, 2001, and2002. Vertical bars on the symbols are standard errors of the mean.
Figure 2. Seasonal measurements of leaf area index (LAI) for a prairieand shrub prairie site. The clippings were made about every 21 daysbeginning in mid-April to mid-October in 1999, 2000, 2001, and 2002.Vertical bars on the symbols are standard errors of the mean.
22 Rangeland Ecology & Management
both sites and ranged from 150 mm for the shrub prairie site in2002 to a high of 493 mm for the prairie site in 1999. The long-term average precipitation for 1 May to 17 October is 321 mm.An unusually high amount of precipitation received in a single-day, high-intensity event in August 1999 was not effectiveprecipitation for biomass accumulation. Historically, the great-est mean monthly precipitation occurs in June when 21% of theannual precipitation is received.
Peak photosynthesizing green biomass typically occurredduring July to early August for both sites (Fig. 1). Within yearsbiomass was similar for both sites, whereas among sites andyears peak biomass was greatest in the shrub prairie site in1999 (2649 kg � ha�1) and least in the prairie site during thedrought year of 2002 (796 kg � ha�1). Peak abovegroundbiomass across the 4 years averaged 1763 kg � ha�1 for theprairie site and 1808 kg � ha�1 for the shrub prairie site. Thevariation in biomass across the 4-year period is supported bythe results of Rogler and Haas (1947) who reported thataboveground biomass production from mixed-grass prairiegrasslands is primarily a function of timing and quantity ofprecipitation.
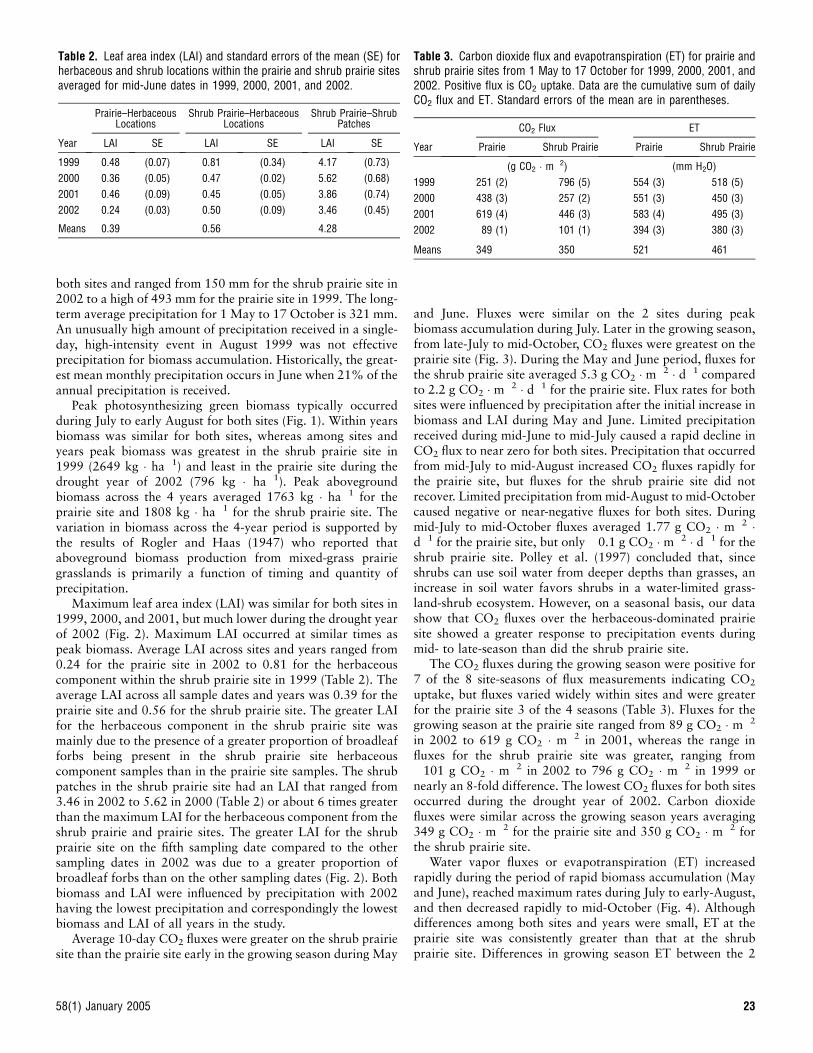
Maximum leaf area index (LAI) was similar for both sites in1999, 2000, and 2001, but much lower during the drought yearof 2002 (Fig. 2). Maximum LAI occurred at similar times aspeak biomass. Average LAI across sites and years ranged from0.24 for the prairie site in 2002 to 0.81 for the herbaceouscomponent within the shrub prairie site in 1999 (Table 2). Theaverage LAI across all sample dates and years was 0.39 for theprairie site and 0.56 for the shrub prairie site. The greater LAIfor the herbaceous component in the shrub prairie site wasmainly due to the presence of a greater proportion of broadleafforbs being present in the shrub prairie site herbaceouscomponent samples than in the prairie site samples. The shrubpatches in the shrub prairie site had an LAI that ranged from3.46 in 2002 to 5.62 in 2000 (Table 2) or about 6 times greaterthan the maximum LAI for the herbaceous component from theshrub prairie and prairie sites. The greater LAI for the shrubprairie site on the fifth sampling date compared to the othersampling dates in 2002 was due to a greater proportion ofbroadleaf forbs than on the other sampling dates (Fig. 2). Bothbiomass and LAI were influenced by precipitation with 2002having the lowest precipitation and correspondingly the lowestbiomass and LAI of all years in the study.
Average 10-day CO2 fluxes were greater on the shrub prairiesite than the prairie site early in the growing season during May
and June. Fluxes were similar on the 2 sites during peakbiomass accumulation during July. Later in the growing season,from late-July to mid-October, CO2 fluxes were greatest on theprairie site (Fig. 3). During the May and June period, fluxes forthe shrub prairie site averaged 5.3 g CO2 � m�2 � d�1 comparedto 2.2 g CO2 � m�2 � d�1 for the prairie site. Flux rates for bothsites were influenced by precipitation after the initial increase inbiomass and LAI during May and June. Limited precipitationreceived during mid-June to mid-July caused a rapid decline inCO2 flux to near zero for both sites. Precipitation that occurredfrom mid-July to mid-August increased CO2 fluxes rapidly forthe prairie site, but fluxes for the shrub prairie site did notrecover. Limited precipitation from mid-August to mid-Octobercaused negative or near-negative fluxes for both sites. Duringmid-July to mid-October fluxes averaged 1.77 g CO2 � m�2 �d�1 for the prairie site, but only �0.1 g CO2 � m�2 � d�1 for theshrub prairie site. Polley et al. (1997) concluded that, sinceshrubs can use soil water from deeper depths than grasses, anincrease in soil water favors shrubs in a water-limited grass-land-shrub ecosystem. However, on a seasonal basis, our datashow that CO2 fluxes over the herbaceous-dominated prairiesite showed a greater response to precipitation events duringmid- to late-season than did the shrub prairie site.
The CO2 fluxes during the growing season were positive for7 of the 8 site-seasons of flux measurements indicating CO2
uptake, but fluxes varied widely within sites and were greaterfor the prairie site 3 of the 4 seasons (Table 3). Fluxes for thegrowing season at the prairie site ranged from 89 g CO2 � m�2
in 2002 to 619 g CO2 � m�2 in 2001, whereas the range influxes for the shrub prairie site was greater, ranging from�101 g CO2 � m�2 in 2002 to 796 g CO2 � m�2 in 1999 ornearly an 8-fold difference. The lowest CO2 fluxes for both sitesoccurred during the drought year of 2002. Carbon dioxidefluxes were similar across the growing season years averaging349 g CO2 � m�2 for the prairie site and 350 g CO2 � m�2 forthe shrub prairie site.
Water vapor fluxes or evapotranspiration (ET) increasedrapidly during the period of rapid biomass accumulation (Mayand June), reached maximum rates during July to early-August,and then decreased rapidly to mid-October (Fig. 4). Althoughdifferences among both sites and years were small, ET at theprairie site was consistently greater than that at the shrubprairie site. Differences in growing season ET between the 2
Table 2. Leaf area index (LAI) and standard errors of the mean (SE) forherbaceous and shrub locations within the prairie and shrub prairie sitesaveraged for mid-June dates in 1999, 2000, 2001, and 2002.
Prairie–HerbaceousLocations
Shrub Prairie–HerbaceousLocations
Shrub Prairie–ShrubPatches
Year LAI SE LAI SE LAI SE
1999 0.48 (0.07) 0.81 (0.34) 4.17 (0.73)
2000 0.36 (0.05) 0.47 (0.02) 5.62 (0.68)
2001 0.46 (0.09) 0.45 (0.05) 3.86 (0.74)
2002 0.24 (0.03) 0.50 (0.09) 3.46 (0.45)
Means 0.39 0.56 4.28
Table 3. Carbon dioxide flux and evapotranspiration (ET) for prairie andshrub prairie sites from 1 May to 17 October for 1999, 2000, 2001, and2002. Positive flux is CO2 uptake. Data are the cumulative sum of dailyCO2 flux and ET. Standard errors of the mean are in parentheses.
CO2 Flux ET
Year Prairie Shrub Prairie Prairie Shrub Prairie
(g CO2 � m�2) (mm H2O)
1999 251 (2) 796 (5) 554 (3) 518 (5)
2000 438 (3) 257 (2) 551 (3) 450 (3)
2001 619 (4) 446 (3) 583 (4) 495 (3)
2002 89 (1) �101 (1) 394 (3) 380 (3)
Means 349 350 521 461
58(1) January 2005 23
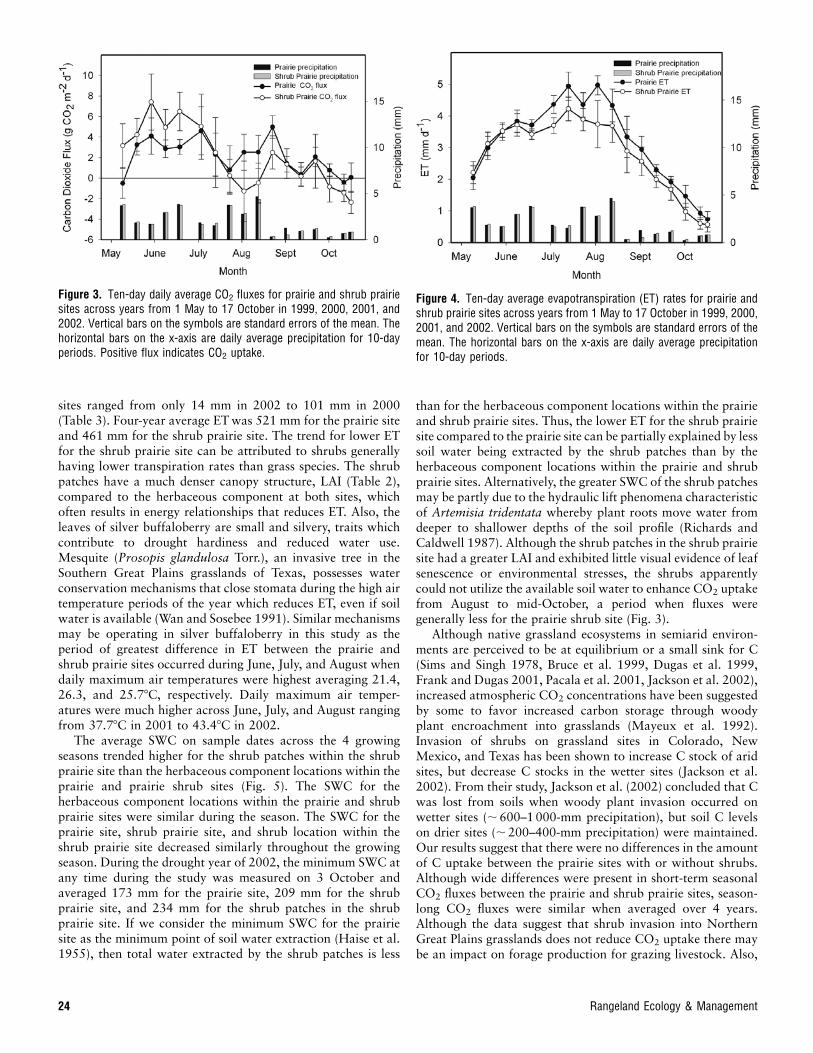
sites ranged from only 14 mm in 2002 to 101 mm in 2000(Table 3). Four-year average ETwas 521 mm for the prairie siteand 461 mm for the shrub prairie site. The trend for lower ETfor the shrub prairie site can be attributed to shrubs generallyhaving lower transpiration rates than grass species. The shrubpatches have a much denser canopy structure, LAI (Table 2),compared to the herbaceous component at both sites, whichoften results in energy relationships that reduces ET. Also, theleaves of silver buffaloberry are small and silvery, traits whichcontribute to drought hardiness and reduced water use.Mesquite (Prosopis glandulosa Torr.), an invasive tree in theSouthern Great Plains grasslands of Texas, possesses waterconservation mechanisms that close stomata during the high airtemperature periods of the year which reduces ET, even if soilwater is available (Wan and Sosebee 1991). Similar mechanismsmay be operating in silver buffaloberry in this study as theperiod of greatest difference in ET between the prairie andshrub prairie sites occurred during June, July, and August whendaily maximum air temperatures were highest averaging 21.4,26.3, and 25.78C, respectively. Daily maximum air temper-atures were much higher across June, July, and August rangingfrom 37.78C in 2001 to 43.48C in 2002.
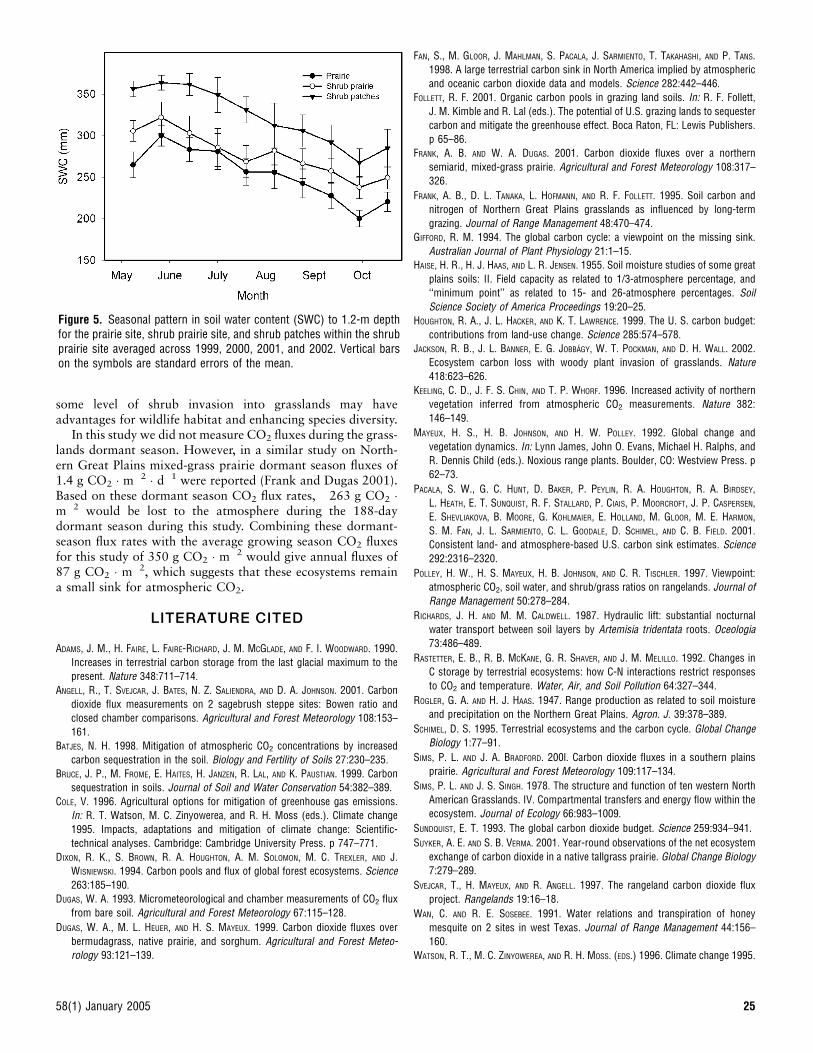
The average SWC on sample dates across the 4 growingseasons trended higher for the shrub patches within the shrubprairie site than the herbaceous component locations within theprairie and prairie shrub sites (Fig. 5). The SWC for theherbaceous component locations within the prairie and shrubprairie sites were similar during the season. The SWC for theprairie site, shrub prairie site, and shrub location within theshrub prairie site decreased similarly throughout the growingseason. During the drought year of 2002, the minimum SWC atany time during the study was measured on 3 October andaveraged 173 mm for the prairie site, 209 mm for the shrubprairie site, and 234 mm for the shrub patches in the shrubprairie site. If we consider the minimum SWC for the prairiesite as the minimum point of soil water extraction (Haise et al.1955), then total water extracted by the shrub patches is less
than for the herbaceous component locations within the prairieand shrub prairie sites. Thus, the lower ET for the shrub prairiesite compared to the prairie site can be partially explained by lesssoil water being extracted by the shrub patches than by theherbaceous component locations within the prairie and shrubprairie sites. Alternatively, the greater SWC of the shrub patchesmay be partly due to the hydraulic lift phenomena characteristicof Artemisia tridentata whereby plant roots move water fromdeeper to shallower depths of the soil profile (Richards andCaldwell 1987). Although the shrub patches in the shrub prairiesite had a greater LAI and exhibited little visual evidence of leafsenescence or environmental stresses, the shrubs apparentlycould not utilize the available soil water to enhance CO2 uptakefrom August to mid-October, a period when fluxes weregenerally less for the prairie shrub site (Fig. 3).
Although native grassland ecosystems in semiarid environ-ments are perceived to be at equilibrium or a small sink for C(Sims and Singh 1978, Bruce et al. 1999, Dugas et al. 1999,Frank and Dugas 2001, Pacala et al. 2001, Jackson et al. 2002),increased atmospheric CO2 concentrations have been suggestedby some to favor increased carbon storage through woodyplant encroachment into grasslands (Mayeux et al. 1992).Invasion of shrubs on grassland sites in Colorado, NewMexico, and Texas has been shown to increase C stock of aridsites, but decrease C stocks in the wetter sites (Jackson et al.2002). From their study, Jackson et al. (2002) concluded that Cwas lost from soils when woody plant invasion occurred onwetter sites (;600–1000-mm precipitation), but soil C levelson drier sites (;200–400-mm precipitation) were maintained.Our results suggest that there were no differences in the amountof C uptake between the prairie sites with or without shrubs.Although wide differences were present in short-term seasonalCO2 fluxes between the prairie and shrub prairie sites, season-long CO2 fluxes were similar when averaged over 4 years.Although the data suggest that shrub invasion into NorthernGreat Plains grasslands does not reduce CO2 uptake there maybe an impact on forage production for grazing livestock. Also,
Figure 4. Ten-day average evapotranspiration (ET) rates for prairie andshrub prairie sites across years from 1 May to 17 October in 1999, 2000,2001, and 2002. Vertical bars on the symbols are standard errors of themean. The horizontal bars on the x-axis are daily average precipitationfor 10-day periods.
Figure 3. Ten-day daily average CO2 fluxes for prairie and shrub prairiesites across years from 1 May to 17 October in 1999, 2000, 2001, and2002. Vertical bars on the symbols are standard errors of the mean. Thehorizontal bars on the x-axis are daily average precipitation for 10-dayperiods. Positive flux indicates CO2 uptake.
24 Rangeland Ecology & Management
some level of shrub invasion into grasslands may haveadvantages for wildlife habitat and enhancing species diversity.
In this study we did not measure CO2 fluxes during the grass-lands dormant season. However, in a similar study on North-ern Great Plains mixed-grass prairie dormant season fluxes of1.4 g CO2 � m�2 � d�1 were reported (Frank and Dugas 2001).Based on these dormant season CO2 flux rates, �263 g CO2 �m�2 would be lost to the atmosphere during the 188-daydormant season during this study. Combining these dormant-season flux rates with the average growing season CO2 fluxesfor this study of 350 g CO2 � m�2 would give annual fluxes of87 g CO2 � m�2, which suggests that these ecosystems remaina small sink for atmospheric CO2.
LITERATURE CITED
ADAMS, J. M., H. FAIRE, L. FAIRE-RICHARD, J. M. MCGLADE, AND F. I. WOODWARD. 1990.
Increases in terrestrial carbon storage from the last glacial maximum to the
present. Nature 348:711–714.
ANGELL, R., T. SVEJCAR, J. BATES, N. Z. SALIENDRA, AND D. A. JOHNSON. 2001. Carbon
dioxide flux measurements on 2 sagebrush steppe sites: Bowen ratio and
closed chamber comparisons. Agricultural and Forest Meteorology 108:153–
161.
BATJES, N. H. 1998. Mitigation of atmospheric CO2 concentrations by increased
carbon sequestration in the soil. Biology and Fertility of Soils 27:230–235.
BRUCE, J. P., M. FROME, E. HAITES, H. JANZEN, R. LAL, AND K. PAUSTIAN. 1999. Carbon
sequestration in soils. Journal of Soil and Water Conservation 54:382–389.
COLE, V. 1996. Agricultural options for mitigation of greenhouse gas emissions.
In: R. T. Watson, M. C. Zinyowerea, and R. H. Moss (eds.). Climate change
1995. Impacts, adaptations and mitigation of climate change: Scientific-
technical analyses. Cambridge: Cambridge University Press. p 747–771.
DIXON, R. K., S. BROWN, R. A. HOUGHTON, A. M. SOLOMON, M. C. TREXLER, AND J.
WISNIEWSKI. 1994. Carbon pools and flux of global forest ecosystems. Science
263:185–190.
DUGAS, W. A. 1993. Micrometeorological and chamber measurements of CO2 flux
from bare soil. Agricultural and Forest Meteorology 67:115–128.
DUGAS, W. A., M. L. HEUER, AND H. S. MAYEUX. 1999. Carbon dioxide fluxes over
bermudagrass, native prairie, and sorghum. Agricultural and Forest Meteo-
rology 93:121–139.
FAN, S., M. GLOOR, J. MAHLMAN, S. PACALA, J. SARMIENTO, T. TAKAHASHI, AND P. TANS.
1998. A large terrestrial carbon sink in North America implied by atmospheric
and oceanic carbon dioxide data and models. Science 282:442–446.
FOLLETT, R. F. 2001. Organic carbon pools in grazing land soils. In: R. F. Follett,
J. M. Kimble and R. Lal (eds.). The potential of U.S. grazing lands to sequester
carbon and mitigate the greenhouse effect. Boca Raton, FL: Lewis Publishers.
p 65–86.
FRANK, A. B. AND W. A. DUGAS. 2001. Carbon dioxide fluxes over a northern
semiarid, mixed-grass prairie. Agricultural and Forest Meteorology 108:317–
326.
FRANK, A. B., D. L. TANAKA, L. HOFMANN, AND R. F. FOLLETT. 1995. Soil carbon and
nitrogen of Northern Great Plains grasslands as influenced by long-term
grazing. Journal of Range Management 48:470–474.
GIFFORD, R. M. 1994. The global carbon cycle: a viewpoint on the missing sink.
Australian Journal of Plant Physiology 21:1–15.
HAISE, H. R., H. J. HAAS, AND L. R. JENSEN. 1955. Soil moisture studies of some great
plains soils: II. Field capacity as related to 1/3-atmosphere percentage, and
‘‘minimum point’’ as related to 15- and 26-atmosphere percentages. Soil
Science Society of America Proceedings 19:20–25.
HOUGHTON, R. A., J. L. HACKER, AND K. T. LAWRENCE. 1999. The U. S. carbon budget:
contributions from land-use change. Science 285:574–578.
JACKSON, R. B., J. L. BANNER, E. G. JOBBAGY, W. T. POCKMAN, AND D. H. WALL. 2002.
Ecosystem carbon loss with woody plant invasion of grasslands. Nature
418:623–626.
KEELING, C. D., J. F. S. CHIN, AND T. P. WHORF. 1996. Increased activity of northern
vegetation inferred from atmospheric CO2 measurements. Nature 382:
146–149.
MAYEUX, H. S., H. B. JOHNSON, AND H. W. POLLEY. 1992. Global change and
vegetation dynamics. In: Lynn James, John O. Evans, Michael H. Ralphs, and
R. Dennis Child (eds.). Noxious range plants. Boulder, CO: Westview Press. p
62–73.
PACALA, S. W., G. C. HUNT, D. BAKER, P. PEYLIN, R. A. HOUGHTON, R. A. BIRDSEY,
L. HEATH, E. T. SUNQUIST, R. F. STALLARD, P. CIAIS, P. MOORCROFT, J. P. CASPERSEN,
E. SHEVLIAKOVA, B. MOORE, G. KOHLMAIER, E. HOLLAND, M. GLOOR, M. E. HARMON,
S. M. FAN, J. L. SARMIENTO, C. L. GOODALE, D. SCHIMEL, AND C. B. FIELD. 2001.
Consistent land- and atmosphere-based U.S. carbon sink estimates. Science
292:2316–2320.
POLLEY, H. W., H. S. MAYEUX, H. B. JOHNSON, AND C. R. TISCHLER. 1997. Viewpoint:
atmospheric CO2, soil water, and shrub/grass ratios on rangelands. Journal of
Range Management 50:278–284.
RICHARDS, J. H. AND M. M. CALDWELL. 1987. Hydraulic lift: substantial nocturnal
water transport between soil layers by Artemisia tridentata roots. Oceologia
73:486–489.
RASTETTER, E. B., R. B. MCKANE, G. R. SHAVER, AND J. M. MELILLO. 1992. Changes in
C storage by terrestrial ecosystems: how C-N interactions restrict responses
to CO2 and temperature. Water, Air, and Soil Pollution 64:327–344.
ROGLER, G. A. AND H. J. HAAS. 1947. Range production as related to soil moisture
and precipitation on the Northern Great Plains. Agron. J. 39:378–389.
SCHIMEL, D. S. 1995. Terrestrial ecosystems and the carbon cycle. Global Change
Biology 1:77–91.
SIMS, P. L. AND J. A. BRADFORD. 200l. Carbon dioxide fluxes in a southern plains
prairie. Agricultural and Forest Meteorology 109:117–134.
SIMS, P. L. AND J. S. SINGH. 1978. The structure and function of ten western North
American Grasslands. IV. Compartmental transfers and energy flow within the
ecosystem. Journal of Ecology 66:983–1009.
SUNDQUIST, E. T. 1993. The global carbon dioxide budget. Science 259:934–941.
SUYKER, A. E. AND S. B. VERMA. 2001. Year-round observations of the net ecosystem
exchange of carbon dioxide in a native tallgrass prairie. Global Change Biology
7:279–289.
SVEJCAR, T., H. MAYEUX, AND R. ANGELL. 1997. The rangeland carbon dioxide flux
project. Rangelands 19:16–18.
WAN, C. AND R. E. SOSEBEE. 1991. Water relations and transpiration of honey
mesquite on 2 sites in west Texas. Journal of Range Management 44:156–
160.
WATSON, R. T., M. C. ZINYOWEREA, AND R. H. MOSS. (EDS.) 1996. Climate change 1995.
Figure 5. Seasonal pattern in soil water content (SWC) to 1.2-m depthfor the prairie site, shrub prairie site, and shrub patches within the shrubprairie site averaged across 1999, 2000, 2001, and 2002. Vertical barson the symbols are standard errors of the mean.
58(1) January 2005 25

Impacts, adaptations, and mitigation of climate change: scientific-technical
analyses. Contribution of working group II to the second assessment report of
the Intergovernmental-Panel on Climate Change. Cambridge: Cambridge
University Press.
WEBB, E. K., G. I. PEARMAN, AND R. LEUNING. 1980. Correction of flux measurements
for density effects due to heat and water vapor transfer. Quarterly Journal of
the Royal Meteorological Society 106:85–100.
WHITMAN, W. C. AND W. T. BARKER. 1994. Wheatgrass-grama-needlegrass SRM 608.
In: Thomas N. Schiflet [ed.]. Rangeland cover types of the United States.
Denver, CO: Society for Range Management. p 77–78.
26 Rangeland Ecology & Management