shrinking to grow - j.p. morgan · shrinking to grow: evolving trends in corporate spin-offs | 3 2....
TRANSCRIPT

Shrinking to grow Evolving trends in corporate spin-offs
JUNE 2015

Published by Corporate Finance Advisory
For questions or further information, please contact:
Corporate Finance Advisory
Marc Zenner [email protected] (212) 834-4330
Evan Junek [email protected] (212) 834-5110
Ram Chivukula [email protected] (212) 622-5682

SHRINKING TO GROW: EVOLVING TRENDS IN CORPORATE SPIN-OFFS | 1
1. Spin-offs are comingCorporate focus is “in.” In ever greater numbers, firms have been announcing spin-offs. With historically strong balance sheets, most firms are not divesting to finance growth or reduce leverage. Rather, they are spinning off and divesting to achieve the valuation benefits commonly associated with corporate focus and clarity. The pace of corporate separation announcements has rebounded significantly since the end of the financial crisis, highlighted by recent front page announcements by blue chip firms. The pace of separations by S&P 500 firms over the last few years has exceeded the level of any period since 2000 (Figure 1).
Figure 1
The pace of separation announcements by S&P 500 companies has rebounded
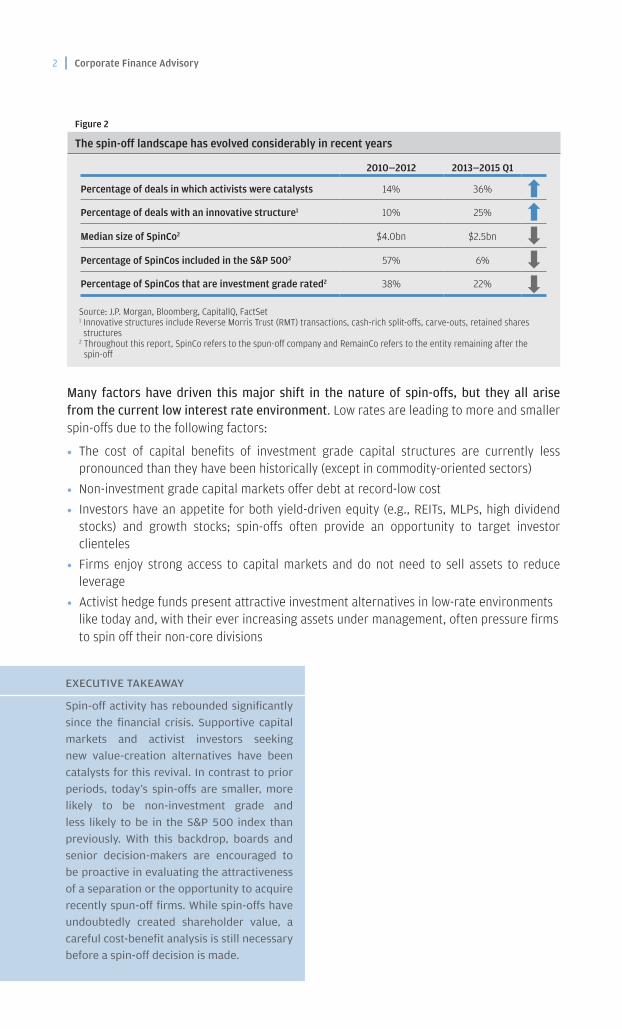
While capital markets observers recognize that the number of spin-offs has increased materially, and that investors have generally responded well to spin-off announcements, the remarkable differences between yesterday’s and today’s spin-offs are not often well understood. As we show in Figure 2, S&P 500 firms are now spinning off smaller, lower-rated firms and, not surprisingly, spin-off decisions are now more likely to be driven by activists than in years past. Recent spin-offs are also more likely to include innovative structures, such as Reverse Morris Trusts (RMTs), cash-rich split-offs, retained shares, etc., suggesting that senior executives leave no stone unturned in their quest to create value.
6 per year
12 per year
4 per year
7 per year
15 per year
Post-dot com recovery(2000—2004)
Pre-crisis peak(2005—2007)
Crisis lows(2008—2009)
Making of a recovery(2010—2012)
Dawn of a new era(2013—2015 Q1)
Source: J.P. Morgan, Bloomberg as of 3/31/2015Note: Includes all spin-off and split-off announcements of S&P 500 firms excluding RMT transactions and cancelled deals; 2015 based on annualized figure
2 | Corporate Finance Advisory
Figure 2
The spin-off landscape has evolved considerably in recent years
Many factors have driven this major shift in the nature of spin-offs, but they all arise from the current low interest rate environment. Low rates are leading to more and smaller spin-offs due to the following factors:
• The cost of capital benefits of investment grade capital structures are currently less pronounced than they have been historically (except in commodity-oriented sectors)
• Non-investment grade capital markets offer debt at record-low cost
• Investors have an appetite for both yield-driven equity (e.g., REITs, MLPs, high dividend stocks) and growth stocks; spin-offs often provide an opportunity to target investor clienteles
• Firms enjoy strong access to capital markets and do not need to sell assets to reduce leverage
• Activist hedge funds present attractive investment alternatives in low-rate environments like today and, with their ever increasing assets under management, often pressure firms to spin off their non-core divisions
EXECUTIVE TAKEAWAY
Spin-off activity has rebounded significantly since the financial crisis. Supportive capital markets and activist investors seeking new value-creation alternatives have been catalysts for this revival. In contrast to prior periods, today’s spin-offs are smaller, more likely to be non-investment grade and less likely to be in the S&P 500 index than previously. With this backdrop, boards and senior decision-makers are encouraged to be proactive in evaluating the attractiveness of a separation or the opportunity to acquire recently spun-off firms. While spin-offs have undoubtedly created shareholder value, a careful cost-benefit analysis is still necessary before a spin-off decision is made.
2010—2012 2013—2015 Q1
Percentage of deals in which activists were catalysts 14% 36%
Percentage of deals with an innovative structure1 10% 25%
Median size of SpinCo2 $4.0bn $2.5bn
Percentage of SpinCos included in the S&P 5002 57% 6%
Percentage of SpinCos that are investment grade rated2 38% 22%
Source: J.P. Morgan, Bloomberg, CapitallQ, FactSet1 Innovative structures include Reverse Morris Trust (RMT) transactions, cash-rich split-offs, carve-outs, retained shares structures
2 Throughout this report, SpinCo refers to the spun-off company and RemainCo refers to the entity remaining after the spin-off

SHRINKING TO GROW: EVOLVING TRENDS IN CORPORATE SPIN-OFFS | 3
2. Firms executing spins typically outperform in both the short- and long-term
Anticipating the potential benefits of corporate separations, investors have historically rewarded companies announcing spin-offs. These firms have experienced positive reactions across sectors and company size. More importantly, these announcements are well-received both over the short- and long-term. Upon announcement, the market-adjusted reaction is a 2-4% upswing for the parent company. Intriguingly, this figure (measured post-spin as the combined return of the RemainCo and SpinCo) rises to 15%-20% over the subsequent two years (Figure 3). These numbers suggest that the recent wave of separation announcements has the potential to create value of approximately $300bn, approximately 2% of the market capitalization of all U.S. firms. This outperformance is in addition to any pre-announcement rise in stock price due to investor anticipation of such a transaction (for example when the market hears either through rumor or by a formal statement that a firm is examining the pros and cons of a separation). Note that while the initial reactions are material, on average they are a fraction of the eventual long-term value creation. The market may not fully price in all the advantages accruing from the spin, either because of insufficient information or due to a lack of confidence in the successful execution of the spin-off and the harvest of its potential benefits.
Figure 3
Parents and RemainCos + SpinCos tend to outperform both in the short-run and long-run
A common misperception of separations is that the value creation comes from the independence of high-growth subsidiaries. One would, therefore, expect that the separation of a high-growth subsidiary would lead to a decline in the valuation multiple of the RemainCo relative to the parent company (Figure 4, left panel). This intuition does not, however, play out in practice. We find that the valuation multiples of both RemainCo and SpinCo increase relative to the pre-spin company (Figure 4, right panel). We estimate the uptick in valuation multiples post-separation to be over 20%. Admittedly, broader market multiples also increased during that period, but after controlling for this general uplift in multiples, we still find the difference to be material, remaining in the 10%–20% range.
Average time until spin completion
$64bn
$98bn
$150bn
$312bn
Post-spinexcess return: 8%
Pre-spinexcessreturn: 8%
Value creation potential2
3%
16%
0%
2%
4%
6%
8%
10%
12%
14%
16%
18%
0 100 200 300 400 500
Exce
ss re
turn
s
Trading days post-announcement
Source: J.P. Morgan, FactSet, Company Filings, Bloomberg as of 3/31/2015 Note: Includes all spin-off and split-off announcements by S&P 500 firms with size greater than $500mm and at least two years since announcement, excluding RMT transactions and canceled deals 1 Market reaction based on the total return in company stock less beta * total return on the S&P 500; compound total return is based on price appreciation with dividends reinvested by default on the exdate
2 Value creation potential is based on average excess return and pre-announcement equity value for all announced spin-offs since 2009; actual realized value creation for all completed spin-offs since 2009 with at least two years since announcement was $106bn

4 | Corporate Finance Advisory
Figure 4
A significant source of the long-term value creation comes from multiple expansion
Several factors may explain this multiple expansion, including:
• Increased business line transparency
• Enhanced growth expectations
• More attractive acquisition currency (or more attractive target)
• Clearer alignment of management incentives
• Growth/risk/capital allocation profile tailored to differing investor preferences and clienteles
This last point has become particularly important because the ongoing low interest rate environment has driven investors to yield-oriented equity securities. The increasing trend of firms spinning off REITs and other yield-oriented entities is one example of how this phenomenon has manifested itself.
Pre-spin RemainCo SpinCo Post-spin weighted average
Expected Actual (EV/EBITDA)
Post-spin
Multiple expansion
Multiple erosion 0.5x
6.9x 6.9x 6.9x 6.9x
0.6x
Pre-spin RemainCo SpinCo Post-spin weighted average
Pre-spin Pre-spin Post-spin
General market expansion
Excess expansion
0.5x
8.0x 8.6x
0.5x 1.3x 0.9x
6.9x
8.3x
Pre-spin to post-spin: Firm: +22% S&P 500: +8%
Source: J.P. Morgan, FactSet, Bloomberg Note: Includes all completed spin-off deals since 2009 by S&P 500 firms with size greater than $500mm and at least six months since completion; figures refer to median of deals; analysis based on next 12-month multiples based on IBES consensus estimates
EXECUTIVE TAKEAWAY
Investors continue to embrace firms announcing separations, not only in the short-term but also over the long-term. The returns are largely attributable to the higher valuation multiples that both the RemainCo and SpinCo command after the spin-off. There is dispersion in the data, however, and firms announcing separations should have clear plans with a credible execution strategy to maximize investor reception to the transaction. In our experience, where such a strategy was not available, firms have typically declined to pursue spin-offs as an avenue for creating value shareholder.

SHRINKING TO GROW: EVOLVING TRENDS IN CORPORATE SPIN-OFFS | 5
3. From conglomerate discount to focus premiumFirms with operations spanning disparate sectors (such as energy, banking and retail) have historically traded at a discount to stand-alone peers. This discount has been referred to as the “conglomerate discount” and has been well-documented. Interestingly, the nature of the valuation differential has evolved in recent years to now encompass firms operating in segments in the same general sector (such as operating in various subsectors within technology or branded food). With greater investable wealth and more technological resources, today’s investors tend to seek greater optionality in portfolio creation. As a result, investors now place a premium on firms targeting narrower subsectors within a broader industry. We refer to this preference as the “focus premium” (Figure 5).
Figure 5
Evolving investor preferences give rise to a “focus premium”
The focus premium captures the valuation benefit attributed to firms, even those wholly in a particular sector, with a more concentrated focus. We compute it as the percentage difference in the median P/E ratios between firms with 1–3 segments and those with 4+ segments (as illustrated in Figure 6). As expected, the focus premium is generally correlated with spin-off activity. Spin-off activity and the focus premium have been elevated in recent years, indicating that firms proactively contemplating separations can benefit from investor preferences.
Conglomerate discount Focus premium
Historically Today
Segment A
Segment B
Segment C
Segment A
Segment B
Segment C
Segment A1
Segment A2
Source: J.P. Morgan

6 | Corporate Finance Advisory
Figure 6
The focus premium indicates strong investor appetite for corporate clarity
EXECUTIVE TAKEAWAY
Firms operating in what traditionally
seem to be related areas and hence
unaffected by the conglomerate discount
are now turning to spin-offs as a method to
capture the focus premium. This premium
has risen sharply in the past few years,
suggesting that investors currently reward
corporate clarity more than they have in
the past.
3%
1%
6%
14%
Pre-crisis peak(2005–2007)
Crisis lows(2008–2009)
Making of a recovery(2010–2012)
Dawn of a new era(2013–2015 Q1)
Source: J.P. Morgan, Bloomberg, FactSet Note: The focus premium is computed, for S&P 500 firms, as the % difference in the median EV/EBITDA ratios between firms with 1—3 and 4+ “key” segments. “Key” segments are those that: (i) do not have the word “other” in their name and (ii) have at least $1bn in revenue or 10% of total revenue

SHRINKING TO GROW: EVOLVING TRENDS IN CORPORATE SPIN-OFFS | 7
4. Structural innovations continue to evolveAs firms have continued to embrace the theme of corporate clarity, separation strategies have generally become more sophisticated and innovative, with Figure 7 illustrating a few popular approaches. For example, Reverse Morris Trust (RMT) transactions, essentially a spin-off coupled with a merger, have doubled, reflecting the positive trends in both corporate clarity and M&A.
Similarly, carve-outs, where firms first “IPO” the entity to be subsequently spun or split off to shareholders, have also seen an uptick in popularity. This approach provides RemainCo with additional firepower to maximize benefits arising from the focus premium. Retained shares structures, whereby firms keep a stake in the SpinCo equity for later sell-down have emerged as a common alternative to the carve-out structure, without much of the associated market timing and risk associated with an IPO. Cash-rich splits, whereby firms contribute assets and cash to a subsidiary which is subsequently exchanged for shares of the parent company, effectively resulting in a buyback of parent company shares, have also been more frequent.
Not all structures have seen a significant pick-up in activity, however. Debt-for-debt exchanges —whereby firms may tax-efficiently monetize an asset in a spin-off above tax basis—have declined from five in 2010–2012 to just one since. This trend has been driven by a 2013 IRS proclamation that significantly complicates debt-for-debt transactions.
There are many tools that provide firms contemplating separations with additional flexibility to raise funds, optimize their capital structures, and seek strategic and valuation benefits in conjunction with greater corporate clarity. The evolving use of these structures underscores the willingness to pursue more complex strategies to maximize shareholder value creation.
Figure 7
Separation transactions have increasingly used various structural innovations
0 0
2 3
5
3 4 4
6
1
Cash-rich splits Retained shares Carve-out spins Reverse Morris Trusts Debt-for-debt exchanges
2010—2012 2013—Q1 2015
Source: J.P. Morgan, Bloomberg as of 3/31/2015 Note: Includes all spin-off and split-off announcements of S&P 500 firms; cash-rich split defined as split co-asset value consisting of at least one-third cash
EXECUTIVE TAKEAWAY
Firms evaluating potential separations
have numerous tools at their disposal
to maximize both the strategic and
monetization potential of separations. The
evolving use of these techniques suggests
firms are more willing to subject themselves
to modestly greater complexity to create
more shareholder value.

8 | Corporate Finance Advisory
Source: J.P. Morgan
5. Strike the iron while it’s hotA confluence of economic factors is driving the resurgence in separation activity today: primarily a sluggish growth environment, low interest rates and attractive capital markets (Figure 8). In addition, the focus premium is at an all-time high, drawing the attention of both traditional and activist investors. Accordingly, management teams, even of firms that operate in one general sector, should continue to assess the value-creation potential from spin-offs. Assuming value can be ascertained, these senior decision-makers should then actively discuss the pros and cons of a separation with their boards.
We caution, however, that not all spin-offs are created equal. Despite investor pressures for more spin-off activity, boards and management teams, in conjunction with their financial advisors, should continue to consider both the short-term and long-term value benefits of separations. Separations are associated with friction costs, and if the value benefits are low or short-lived, the decision not to separate may create more long-term value. In cyclical sectors, a return to more volatile capital market environments may make spin-offs less attractive. In those sectors, it is important to evaluate the benefits of a spin-off through the economic cycle.
Figure 8
A historic time for corporate separations
Catalyst Present historically Present today
Equity investor preference for focus
Low-growth environment
Dividend premium
Supportive high yield debt capital markets
Activist pressure
Willingness to explore new structures
Investors today understand that economic factors are uniquely conducive to separations and expect
companies to take advantage of these conditions. This environment indicates that at the very least,
firms should explore whether some of their businesses would perform better, or at a minimum
be valued more, on a stand-alone basis. Potential operating and financial synergies of combined
businesses, whether across or within sectors, are often smaller than expected. When that fact pattern
is present, it can be worth capitalizing on supportive economic and corporate finance conditions
while simultaneously satisfying investor expectations. Further, decision-makers should also ensure
that a separation guarantees value creation in both the short and long run. This is imperative because
separations are associated with friction costs, and not all possible separations are created equal.

SHRINKING TO GROW: EVOLVING TRENDS IN CORPORATE SPIN-OFFS | 9
This material is not a product of the Research Departments of J.P. Morgan and is not a research report. Unless otherwise specifically stated, any views or opinions expressed herein are solely those of the authors listed, and may differ from the views and opinions expressed by J.P. Morgan’s Research Departments or other departments or divisions of J.P. Morgan and its affiliates.
RESTRICTED DISTRIBUTION: Distribution of these materials is permitted to investment banking clients of J.P. Morgan. Distribution of these materials to others is not permitted unless specifically approved by J.P. Morgan. These materials are for your personal use only. Any distribution, copy, reprints and/or forward to others is strictly prohibited. Information has been obtained from sources believed to be reliable but J.P. Morgan does not warrant its completeness or accuracy. Information herein constitutes our judgment as of the date of this material and is subject to change without notice.
This material is not intended as an offer or solicitation for the purchase or sale of any financial instrument. In no event shall J.P. Morgan be liable for any use by any party of, for any decision made or action taken by any party in reliance upon, or for any inaccuracies or errors in, or omissions from, the information contained herein and such information may not be relied upon by you in evaluating the merits of participating in any transaction.
J.P. Morgan is the marketing name for the investment banking activities of JPMorgan Chase Bank, N.A., J.P. Morgan Securities LLC (member, NYSE), J.P. Morgan Securities plc (authorized by the FSA and member, LSE) and their investment banking affiliates.
Copyright 2015 JPMorgan Chase & Co. All rights reserved.
We would like to thank Stephen Berenson, Albert Chang, Mark De Rocco, Darren Heil, Sarah Hellman, Rob Stuhr, Vikas Vavilala and Chris Ventresca for their invaluable comments and suggestions. We also thank Jennifer Chan, Sarah Farmer, Lynn Kohn and the Creative Services group for their help with the editorial process. We are particularly grateful to Noam Gilead and Nicholas Kordonowy for their tireless contributions to the analytics in this report as well as for their invaluable insights.
