should i stay or should i go? an examination of the factors effecting the length of stay of patients...
TRANSCRIPT

Should I stay or should I go?
An examination of the factors effecting the length of stay of patients in a Geriatric Medicine
Department of a London Hospital

Presentation Outline Introduction
Descriptive Statistics
Statistical Tests
Survival Analysis & Conclusion

The Variables 7 Variables
Admission reason1. Urine Incontinence2. Stroke3. Rehab4. Other5. Diabetic6. Fall7. Decreased Mobility8. Confusion
Age Sex Year of admission
1994 / 1995 / 1996 / 1997 Barthel score Destination (when leaving hospital) Length of stay (LOS) in hospital.

Rationale for focusing on LOS Our research highlighted that the key variable
was length of stay. Length of Stay is a contentious issue in the
NHS – the economical advantages are clear but Ministers, hospital staff, patients and the public are concerned that patients should not be discharged until they are ready.
Budgets £400/day per patient Outpatient programmes
The Task To assess the effects of a patient’s
admission reason, age, sex, year of admission, Barthel score, destination (when leaving hospital), on their length of stay in hospital.

Descriptive Statistics
By Tara O’Hare

Basic Information about the elderly dataset
● There are 4722 patients in our data, of which,
● 1537 are male● 3185 are female
● 7 Variables
● Admin group● Age● Sex● Year● Barthel Score● Destination● Length of Stay (LOS)


Descriptive Statistics● The average age of patients in data set is:
● 81.1 years for males● 83.52 years for females
● 21 patients where under the age of 48 years old.
● Approx 71% went home after departure from hosptial
● One year old girl was admitted to the geriatric ward, Admin reason was confusion
Age Barthel LOS
Mean 82.74 8.97 85.41
Median 84 9 17
Mode 84 0 15
Range of values
1 - 106 1 - 20 1 - 10453
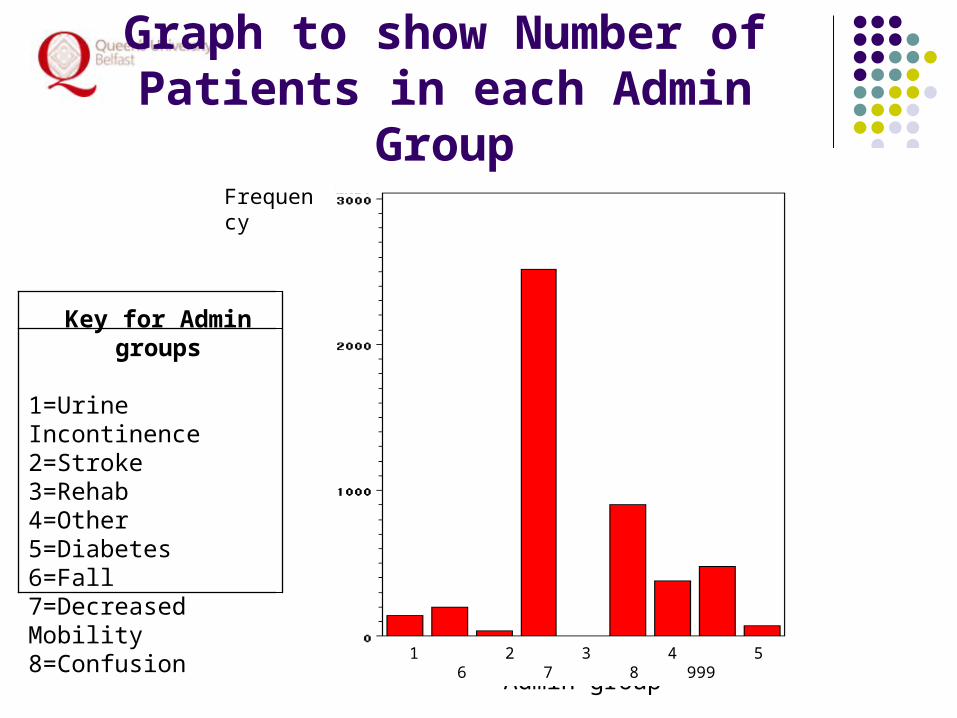
Key for Admin groups
1=Urine Incontinence2=Stroke3=Rehab4=Other5=Diabetes6=Fall7=Decreased Mobility8=Confusion
Admin group 1 2 3 4 5 6 7 8 999
Frequency
Graph to show Number of Patients in each Admin Group

Destination of Patients
Destination
1 2 3 999
Frequency
Key
1=Died
2=Home
3=Transfer
Bar Chart to show Destination of patients
Age Barthel LOS
Died 84 2.05 16
Home 83 16 16
Transfer 85 6.97 34.5
999 83 0 959
Table to show median values for different Destinations

● 1097 Patients have a Barthel score of 19 or 20
● LOS : median=14
mode=8
● 0.64% of patients died
● 93.98% of patients went home
● 4.56% of patients where transferred
● 2022 Patients have a Barthel score of 0 or 1
● LOS : median= 17
mode= 15
● 40.36% of patients died.
● 41.59% of patients went home
● 9.35% of patients where transferred
Analysis of Barthel, LOS and Destination

Length of stay
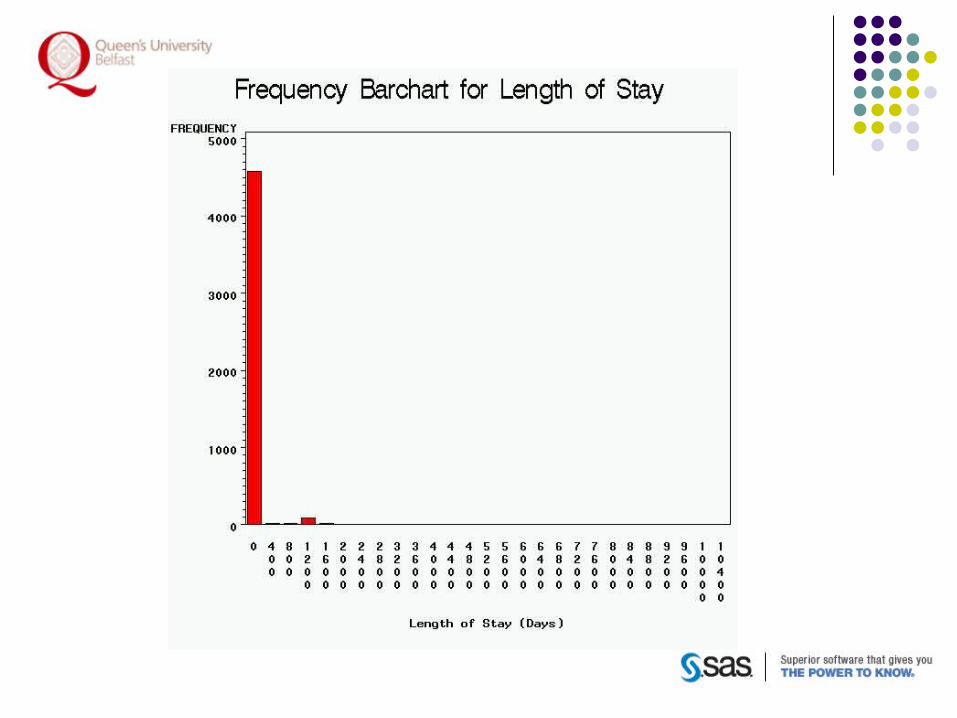
● Outliers present in LOS
● Looked at extreme values for LOS>9677 days.
●13 Patients had a LOS > 9677 days
●The Year in which these patients were admitted is missing
Admin group
LOS
Box plots to show the LOS for the different Admin groups
1 2 3 4 5 6 7 8 999

Barthel Scores for the different Los groups
Los ≤ 14 Los 15 - 48 Los > 48
Mean 9.54 9.48 5.90
Median 11 11 0
Mode 0 0 0
Patients with an LOS of greater than 48 days are very dependent, evident as both median and mode are zero
The mean value for the barthel score decreases as the LOS increases for the different groups

Statistical Tests
By Lisa Mc Crink
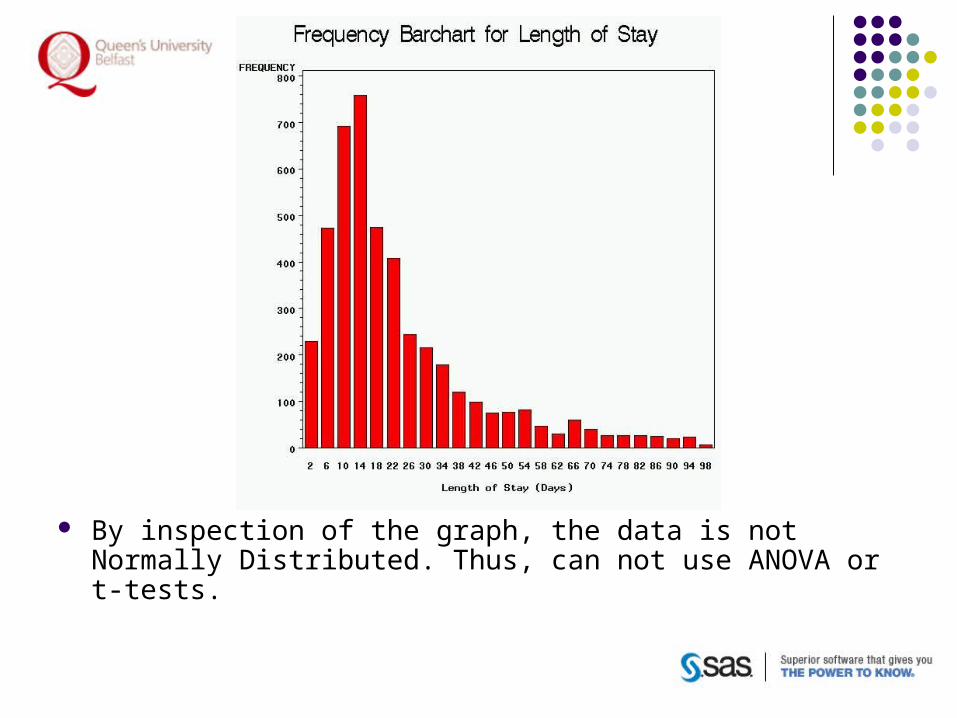
By inspection of the graph, the data is not Normally Distributed. Thus, can not use ANOVA or t-tests.

Kolmogorov-Smirnov Test:
H0: Data set is normally Distributed H1: Data set is not normally distributed
This gave us a P-value<0.01. Thus, the test is significant at 5% level of
significance. We reject H0, in favour of H1. The data is not normally distributed.

The Chi-Squared Distribution H0: No association between the variables and length of stay of a Geriatric
patient H1: Association between each variable and length of stay
Variable Chi Squared Degrees of P-ValueValue Freedom
Destination 3990 822 <0.0001Admgrp 3497 2192 <0.0001Barthel 6501.9 5280 <0.0001
Sex 321.6 274 0.0254Year 965.5 783 <0.0001Age 47712.1 15618 <0.0001
Each variable has significant association with the length of stay of a patient.
proc freq data=work.elderly;
tables los*barthel/chisq;run;

Interpreting Results of Chi-Squared Distribution
We are 99.9% confident that each variable, excluding sex, has an association with a patient’s length of stay.
Sex has a P-Value greater than that of other variables, indicating that association between sex of a patient and their length of stay is not as significant as that of other variables.
From this, it is evident that each variable effects a patients length of stay and so would be important to include in any model to predict a patients length of stay.
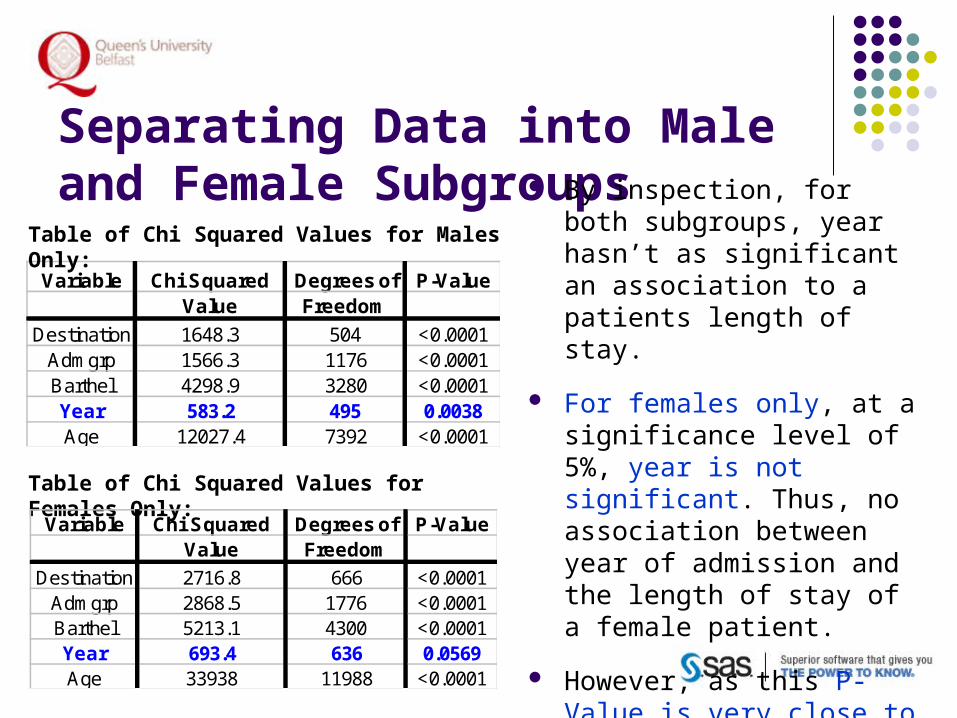
Separating Data into Male and Female Subgroups By inspection, for both
subgroups, year hasn’t as significant an association to a patients length of stay.
For females only, at a significance level of 5%, year is not significant. Thus, no association between year of admission and the length of stay of a female patient.
However, as this P-Value is very close to 0.05, more investigation into this is required.
Variable Chi Squared Degrees of P-ValueValue Freedom
Destination 1648.3 504 <0.0001Admgrp 1566.3 1176 <0.0001Barthel 4298.9 3280 <0.0001Year 583.2 495 0.0038Age 12027.4 7392 <0.0001
Table of Chi Squared Values for Females Only:
Variable Chi Squared Degrees of P-ValueValue Freedom
Destination 2716.8 666 <0.0001Admgrp 2868.5 1776 <0.0001Barthel 5213.1 4300 <0.0001Year 693.4 636 0.0569Age 33938 11988 <0.0001
Table of Chi Squared Values for Males Only:

The Importance of Year to the Length of Stay of Patients
In fact, this is contrary to previous research completed on this. Over the last century, there is a dramatic increase in the proportion
of elderly people in the population. Due to this, Geriatric units are struggling to provide enough beds for
those who need them. Previous research indicates that hospitals are actively trying to
decrease the length of stay of patients in an aid to solve the bed capacity problems.
The result we obtained can be explained due to the data being collected over a short duration from 1994 to 1997.

The Kruskal-Wallis Test It is a non-parametric test which is applied when ANOVA normality
assumptions may not apply. H0: Median length of stay of different subgroups of variables are
equal H1: Median length of stay of different subgroups vary
As the data is skewed, it is more useful to test for significant differences in the median instead of the mean length of stay of patients. This test was chosen for this purpose.
proc npar1way data=work.elderly;
class destinat;
var los;
run;

Interpreting Results of Kruskal-Wallis Test
The subgroups of each variable have significant difference in a patients median length of stay.
Variable Kruskal-Wallis Degrees of P-ValueValue Freedom
Destination 403.52 3 <0.0001Admgrp 230.37 8 <0.0001Barthel 265.6 20 <0.0001
Sex 9.8288 1 0.0017Year 43.4469 3 <0.0001Age 128.02 57 <0.0001
Table of Kruskal-Wallis values for whole data set:

Interpreting Results of Kruskal-Wallis Test
As each variable, excluding sex, has a p-value<0.0001, there is a 99.9% level of confidence in this difference in median length of stay.
Sex is shown not to have as significant a difference between the median length of stay of the different subgroups.
For example, the median length of stay of males and females separately is less significantly different than the median length of stay of patients admitted due to confusion and those admitted due to a stroke.
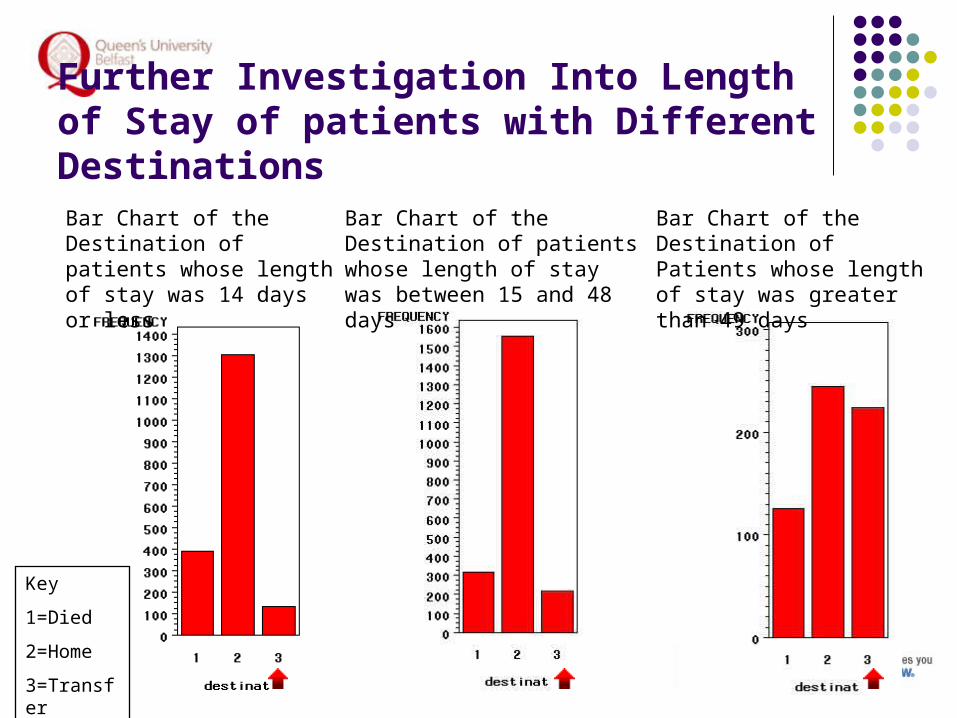
Further Investigation Into Length of Stay of patients with Different Destinations
Bar Chart of the Destination of patients whose length of stay was between 15 and 48 days
Bar Chart of the Destination of Patients whose length of stay was greater than 49 days
Bar Chart of the Destination of patients whose length of stay was 14 days or less
Key
1=Died
2=Home
3=Transfer
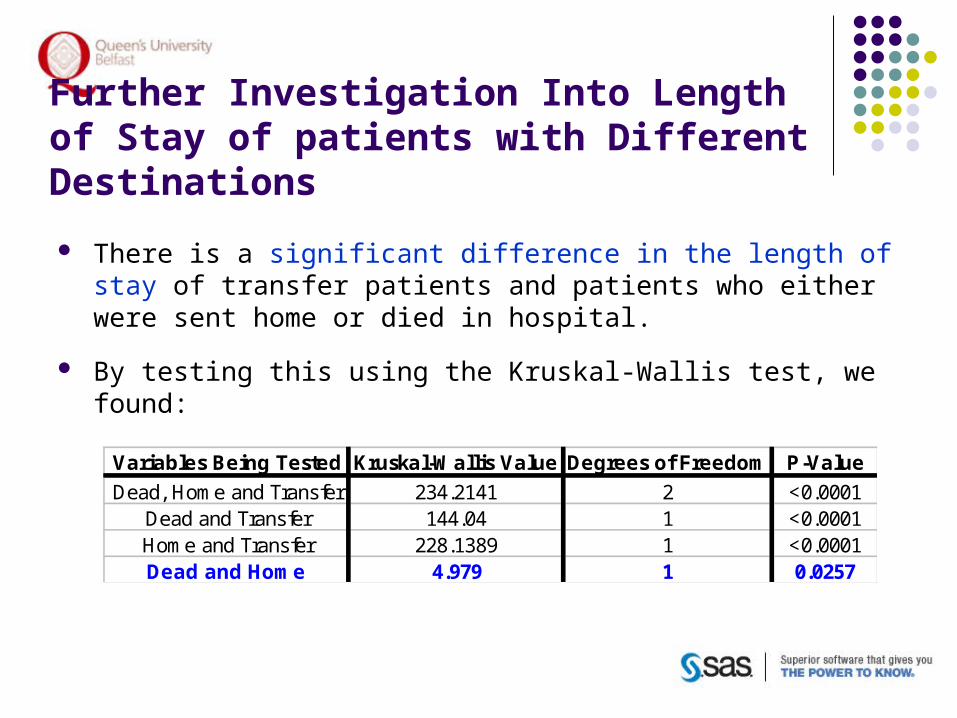
Further Investigation Into Length of Stay of patients with Different Destinations
There is a significant difference in the length of stay of transfer patients and patients who either were sent home or died in hospital.
By testing this using the Kruskal-Wallis test, we found:
Variables Being Tested Kruskal-Wallis Value Degrees of Freedom P-Value
Dead, Home and Transfer 234.2141 2 <0.0001Dead and Transfer 144.04 1 <0.0001Home and Transfer 228.1389 1 <0.0001Dead and Home 4.979 1 0.0257

It is evident that there is less significance
in the difference between median length of
stay of patients who were sent home or died
than that of transfer patients, and this is
supported by the graphs.
This agrees with previous studies, in which it was found that transfer patients had increased lengths of stays when compared to those who died or were sent home.
Further Investigation Into Length of Stay of patients with Different Destinations

Survival Analysis& Conclusion
By Mike Rigby

Survival Analysis
What is Survival Analysis?
Basic Survival Analysis functions
How does Survival Analysis apply to our problem?
Survival Analysis and SAS The long way and the SAS way
Survival functions
What is Survival Analysis?
What is Survival Analysis? A branch of statistics that deals with death in
biological organisms and failure in mechanical systems.
Death or failure is called an ‘event’ Time to event models
Basic Survival Analysis Functions
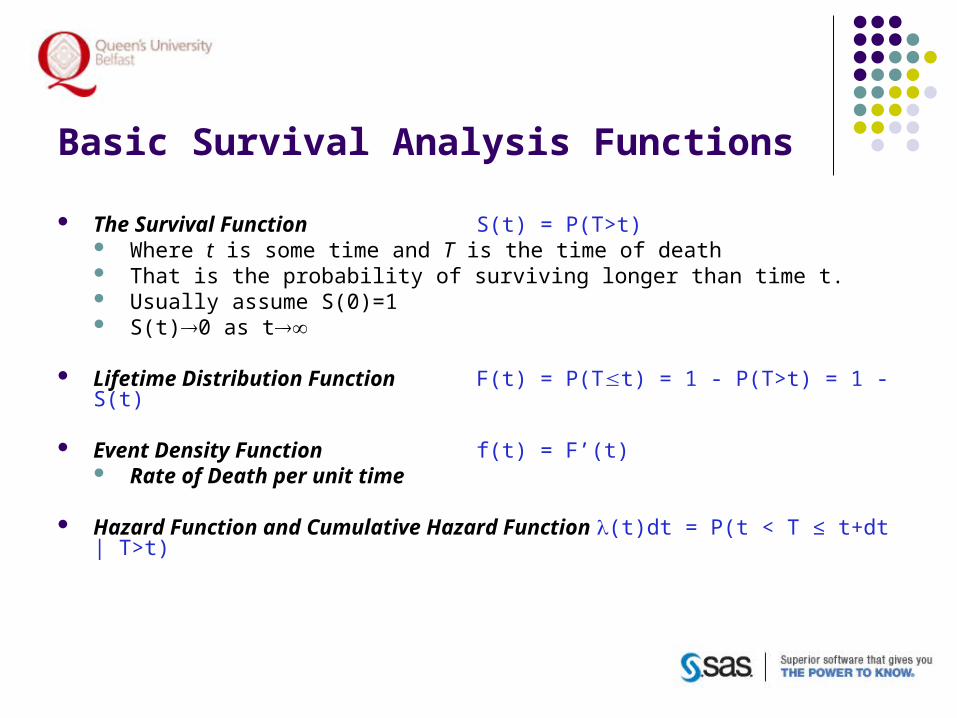
The Survival Function S(t) = P(T>t) Where t is some time and T is the time of death That is the probability of surviving longer than time t. Usually assume S(0)=1 S(t)0 as t
Lifetime Distribution Function F(t) = P(Tt) = 1 - P(T>t) = 1 - S(t)
Event Density Function f(t) = F’(t) Rate of Death per unit time
Hazard Function and Cumulative Hazard Function (t)dt = P(t < T ≤ t+dt | T>t)
How does Survival Analysis apply to our problem?
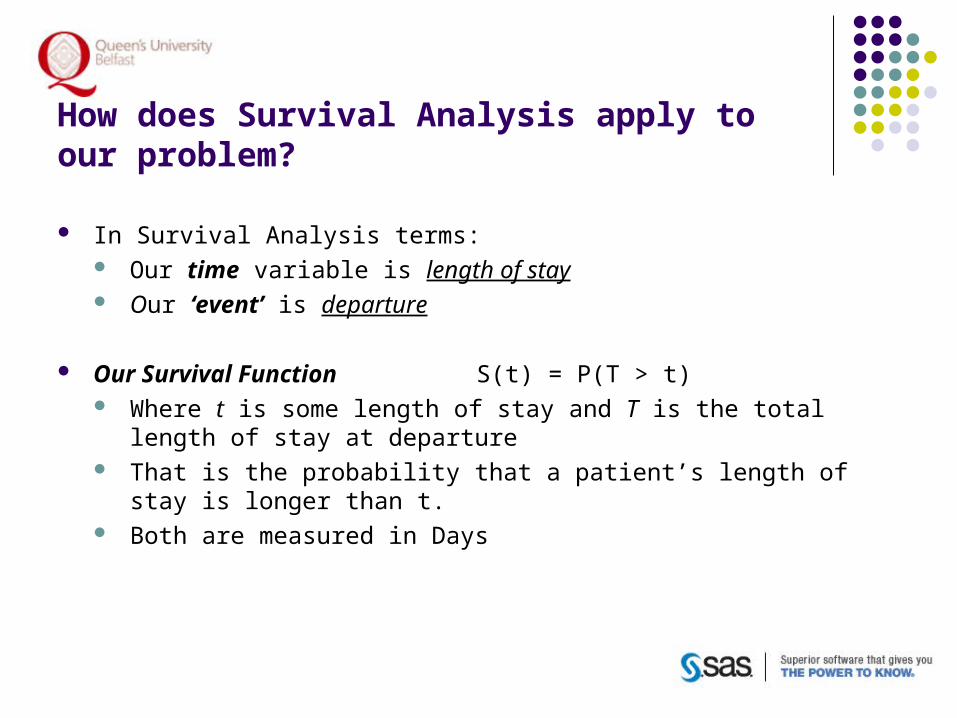
In Survival Analysis terms: Our time variable is length of stay Our ‘event’ is departure
Our Survival Function S(t) = P(T > t) Where t is some length of stay and T is the total length of stay at
departure That is the probability that a patient’s length of stay is longer than t. Both are measured in Days
The Long Way:Converting Raw Data into Survival Data
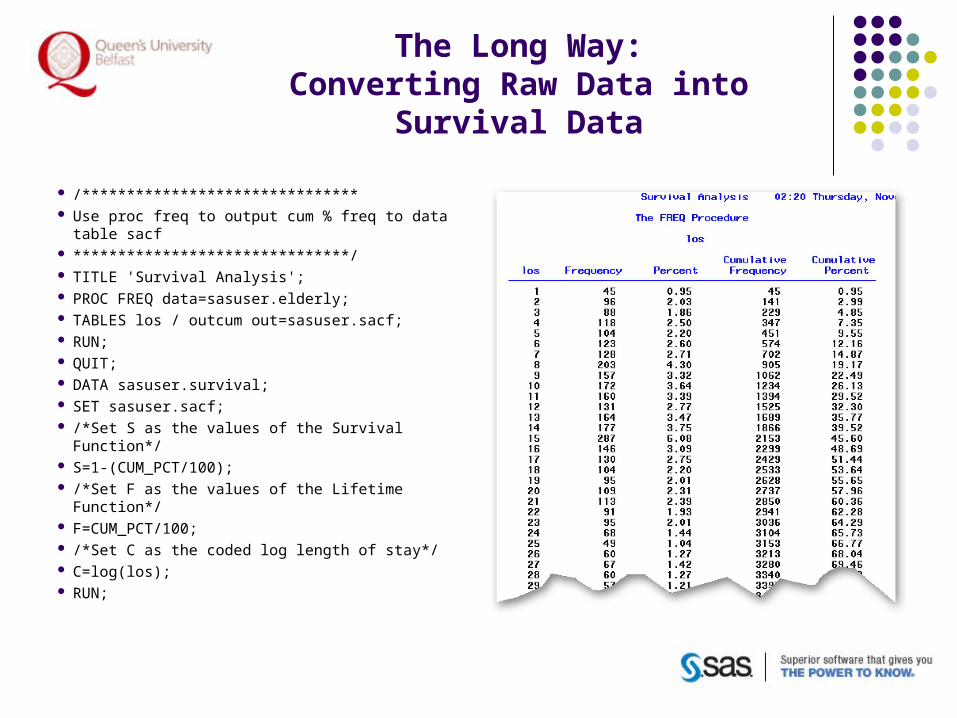
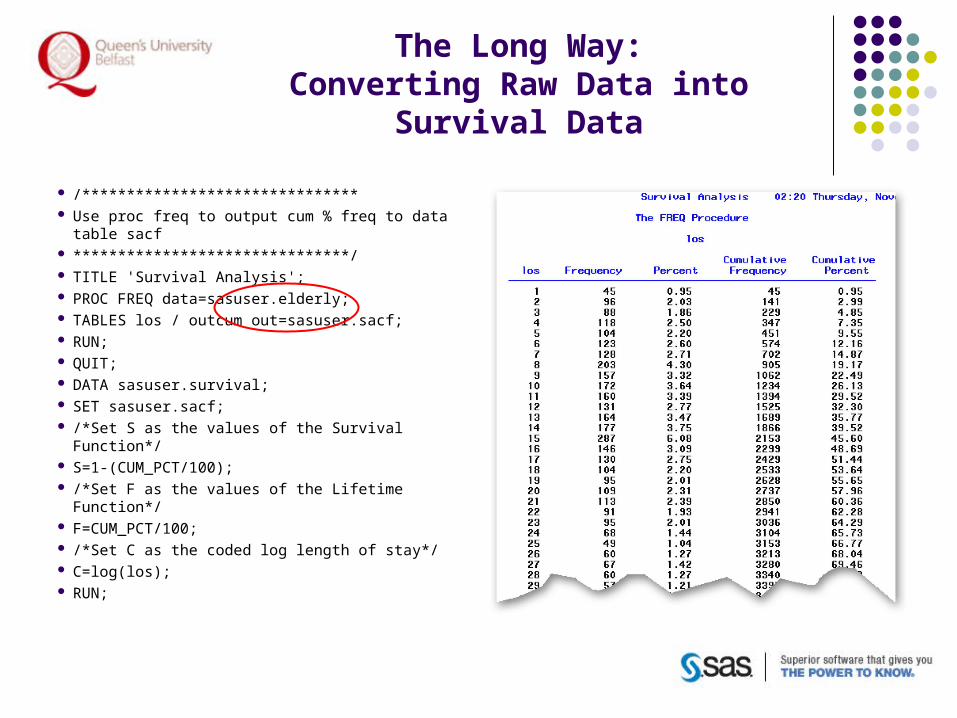
/******************************* Use proc freq to output cum % freq to data table
sacf *******************************/ TITLE 'Survival Analysis'; PROC FREQ data=sasuser.elderly; TABLES los / outcum out=sasuser.sacf; RUN; QUIT; DATA sasuser.survival; SET sasuser.sacf; /*Set S as the values of the Survival Function*/ S=1-(CUM_PCT/100); /*Set F as the values of the Lifetime Function*/ F=CUM_PCT/100; /*Set C as the coded log length of stay*/ C=log(los); RUN;
The Long Way:Converting Raw Data into Survival Data

The Long Way:Converting Raw Data into Survival Data
/******************************* Use proc freq to output cum % freq to data table
sacf *******************************/ TITLE 'Survival Analysis'; PROC FREQ data=sasuser.elderly; TABLES los / outcum out=sasuser.sacf; RUN; QUIT; DATA sasuser.survival; SET sasuser.sacf; /*Set S as the values of the Survival Function*/ S=1-(CUM_PCT/100); /*Set F as the values of the Lifetime Function*/ F=CUM_PCT/100; /*Set C as the coded log length of stay*/ C=log(los); RUN;
The Long Way:Converting Raw Data into Survival Data
/******************************* Use proc freq to output cum % freq to data table
sacf *******************************/ TITLE 'Survival Analysis'; PROC FREQ data=sasuser.elderly; TABLES los / outcum out=sasuser.sacf; RUN; QUIT; DATA sasuser.survival; SET sasuser.sacf; /*Set S as the values of the Survival Function*/ S=1-(CUM_PCT/100); /*Set F as the values of the Lifetime Function*/ F=CUM_PCT/100; /*Set C as the coded log length of stay*/ C=log(los); RUN;
The Long Way:Converting Raw Data into Survival Data
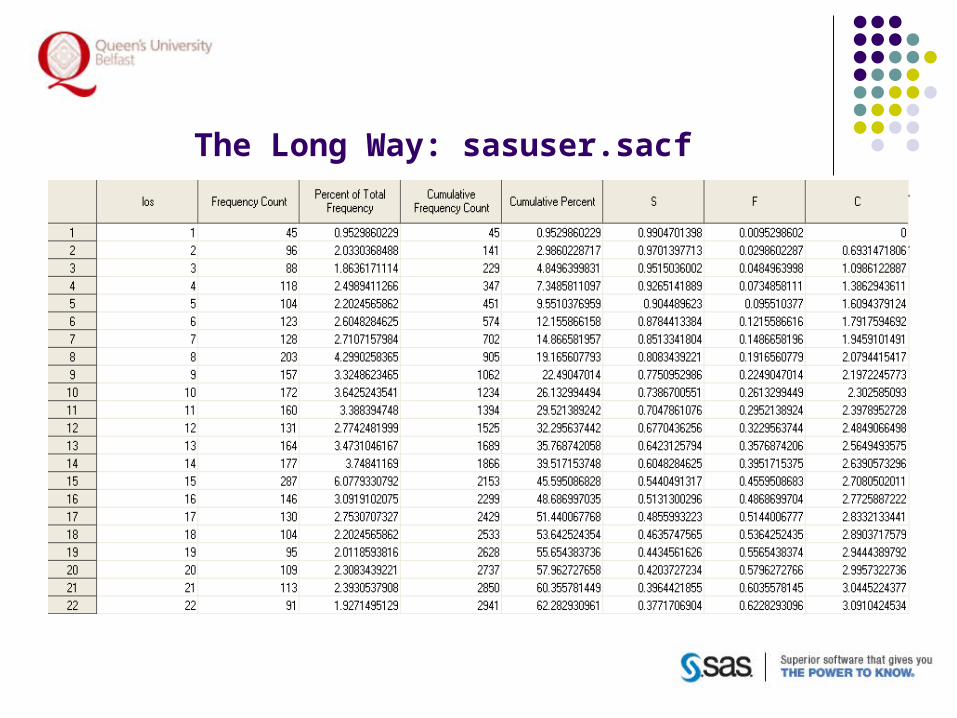
The Long Way: sasuser.sacf
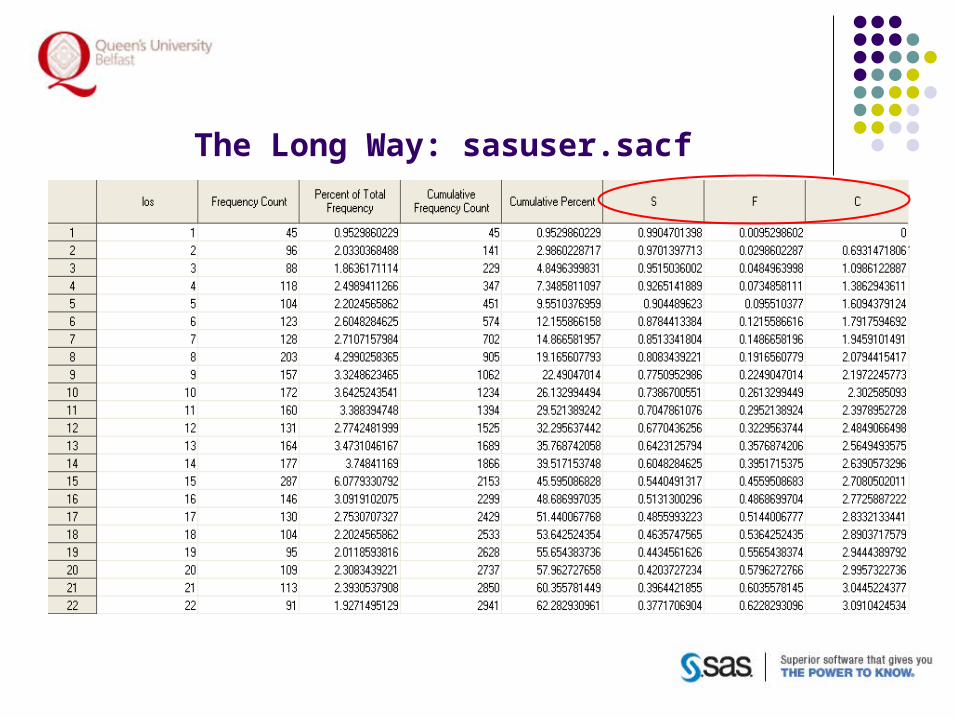
The Long Way: sasuser.sacf
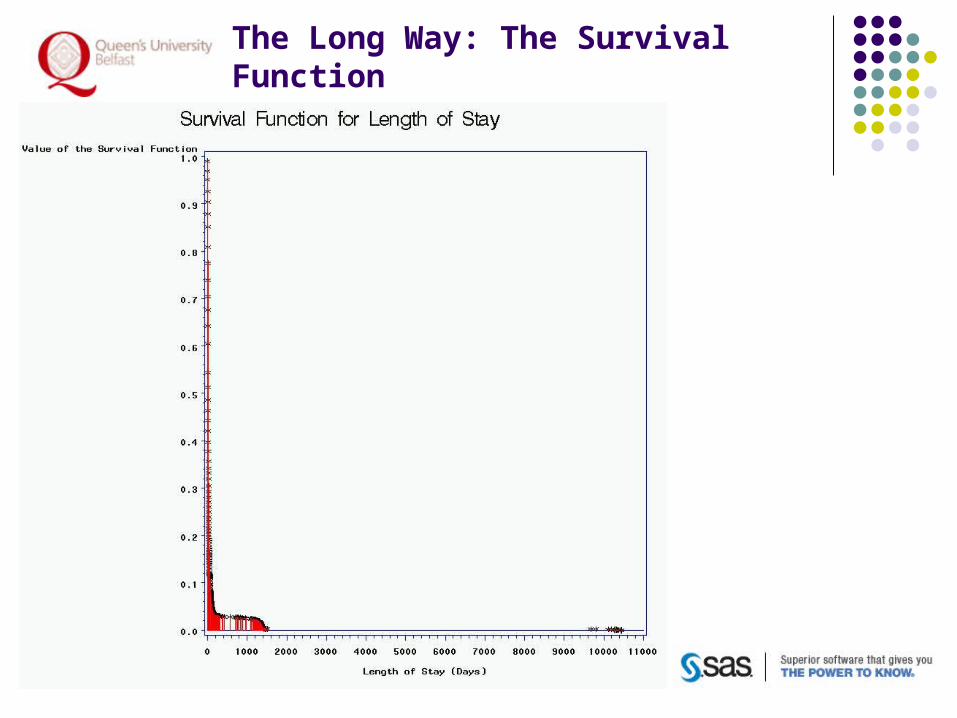
The Long Way: The Survival Function

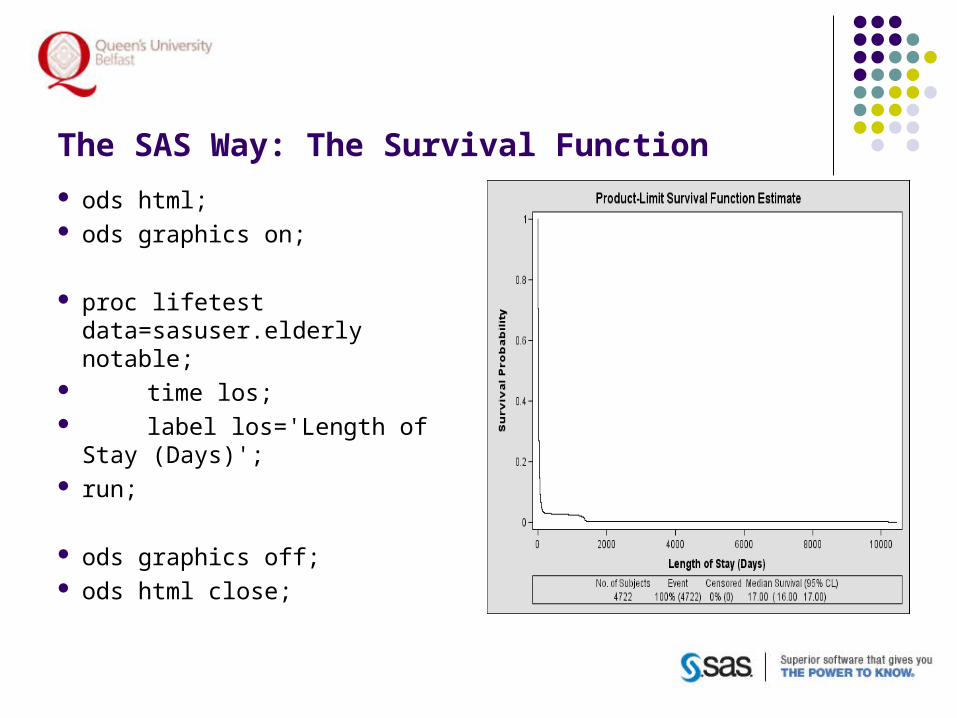
The SAS Way: The Survival Function
ods html; ods graphics on;
proc lifetest data=sasuser.elderly notable;
time los; label los='Length of Stay
(Days)'; run;
ods graphics off; ods html close;

The Long Way
The SAS Way
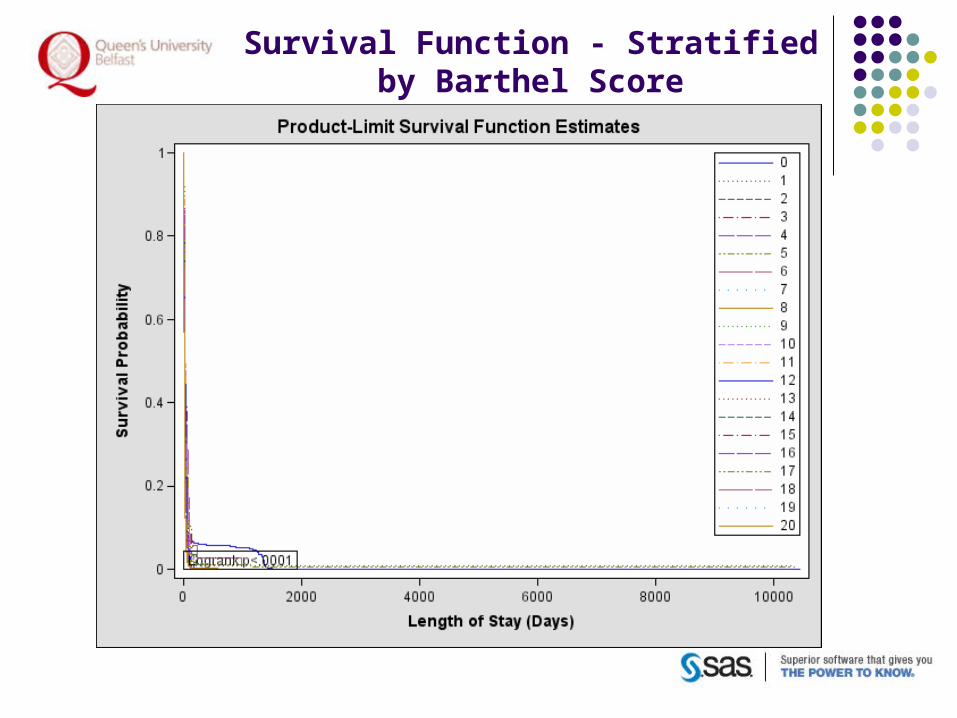
Survival Function - Stratified by Barthel Score

Survival Function - Stratified by Barthel Score
ZOOMED

Conclusion After initial examination and discussion we identified length of stay as
the main variable because its analysis could help hospital managers with resource management.
We examined the elderly dataset with particular attention to the effects of other variables on the response variable, length of stay, for this reason.
Length of Stay The Frequency Barchart indicated a positively skewed distribution. Non-normality was confirmed by the Kolmogorov Smirnov Test Non-normality informed the decision to use non-parametric tests,
survival analysis and the median. Wilcoxon, even though a non-parametric test, was out of reach as it
requires a symmetric p.d.f.
Kruskal-Wallis told us that the median length of stay for each of the other 6 variables (Admission Reason, Age, Barthel Score, Destination, Sex, Year of Admission ) is not the same.
Conclusion Discretising Length of Stay into classes of 1-14 days, 15-48 days, 49+ days revealed
that those patients who stay in hospital for a long time (49+) are much more likely to be transferred than those who stay in hospital for a shorter stint (48 days or less).
Survival Analysis Survival Functions stratified by Barthel Score surprisingly told us that those with a
Barthel score of 12 were more likely to stay in hospital for up to around 1400 days than any other Barthel score, including low Barthel scores, which indicate highly dependent patients. That said, after 1400 days in hospital those with low Barthel scores, were the most likely to stay in hospital.

ReferencesBooks Lindsey, J.K., Statistical Analysis of Stochastic Processes in Time, (2004), Cambridge University
Press, Chapter 3 - Survival Processes, pp39-70 Spiegel, M.R., et al., Schaum’s Outlines: Statistics, (1999), 3rd ed., McGraw Hill
Journals Marshall, A., et al., Modelling Patient Duration of Stay to Facilitate Resource Management of
Geriatric Hospitals, Health Care Management Science 5, 313-319, (2002) Marshall, A., et al., Developing a Bayesian belief network for the management of geriatric
hospital care, Health Care Management Science 4, 25-30, (2001)
Web http://www.reducinglengthofstay.org.uk/ http://www.patient.co.uk/showdoc/40001654/ - Barthel Score http://en.wikipedia.org/wiki/Survival_analysis http://en.wikipedia.org/wiki/Weibull_distribution
Miscellaneous SAS Help Lecture Notes

For more information, including a download ofthis powerpoint presentation, which includes
research references and web links, visit:
www.mikerigby.net
Thanks for Listening!

From Team Elderly
Santa loves SAS!
Survival Analysis
Why use Survival Analysis for the elderly data? The data is heavily positively skewed. Answer questions about the data
What fraction of the population will survive past a certain time? Death Rates for those who survive. Taking into account multiple causes of death
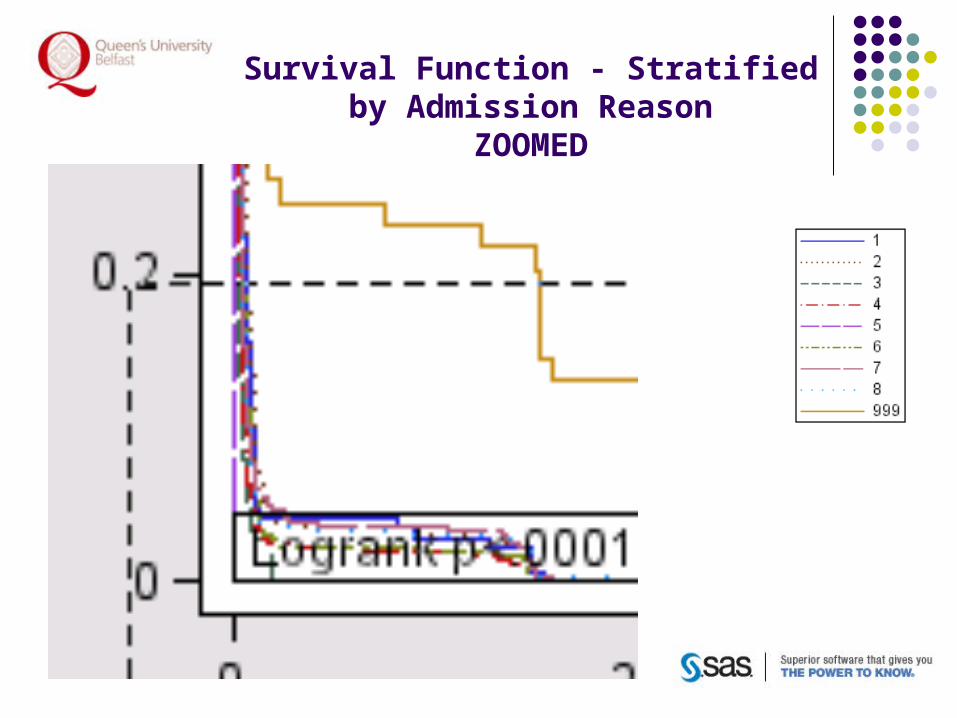
Survival Function - Stratified by Admission Reason
ZOOMED