short-term variability in primary productivity during a wind-driven
TRANSCRIPT
AQUATIC MICROBIAL ECOLOGYAquat Microb Ecol
Vol. 56: 205–215, 2009doi: 10.3354/ame01321
Printed September 2009Published online June 30, 2009
INTRODUCTION
During the 8th International Workshop of the Groupon Aquatic Primary productivity (GAP) that took placeat the Interuniversity Institute in Eilat (northern RedSea, Israel), concomitant measurements of primary
productivity were conducted in accordance with thephilosophy and practice of GAP (Bar Zeev et al. 2009,this Special Issue). Here we describe an unexpectedevent that occurred while measuring planktonic pri-mary productivity in the Gulf of Eilat (Aquaba), andwhich exposes potential underestimation resulting
© Inter-Research 2009 · www.int-res.com*Email: [email protected]
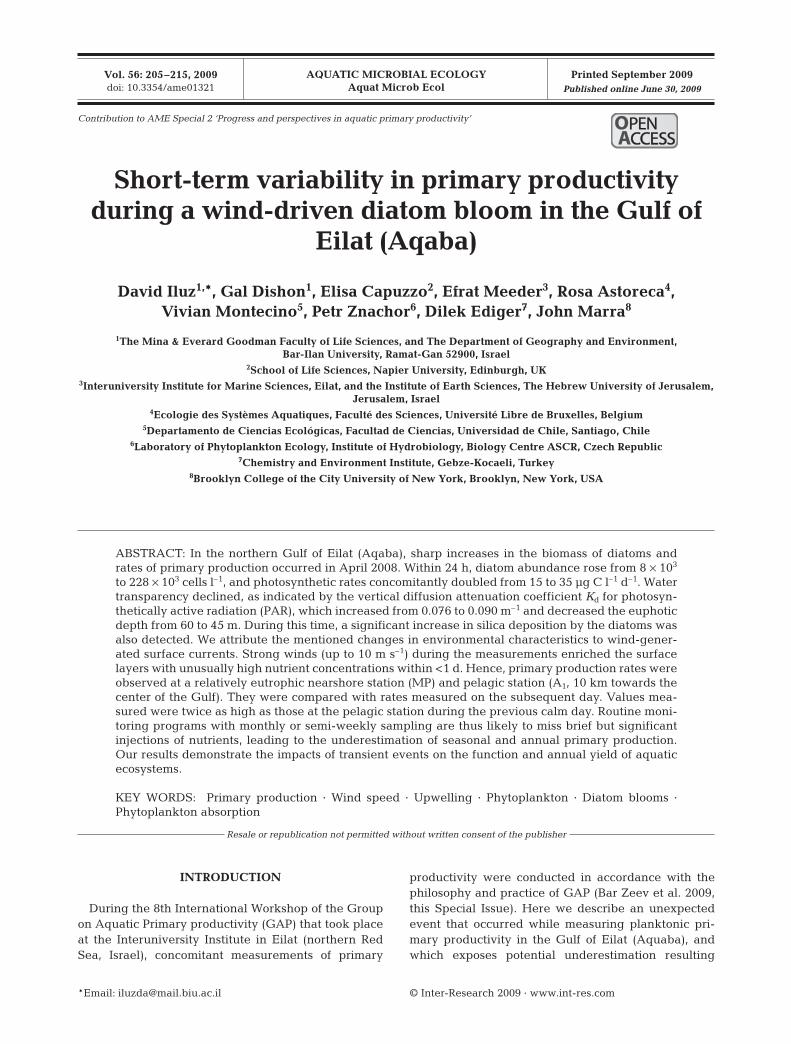
Short-term variability in primary productivityduring a wind-driven diatom bloom in the Gulf of
Eilat (Aqaba)
David Iluz1,*, Gal Dishon1, Elisa Capuzzo2, Efrat Meeder3, Rosa Astoreca4, Vivian Montecino5, Petr Znachor6, Dilek Ediger7, John Marra8
1The Mina & Everard Goodman Faculty of Life Sciences, and The Department of Geography and Environment,Bar-Ilan University, Ramat-Gan 52900, Israel
2School of Life Sciences, Napier University, Edinburgh, UK 3Interuniversity Institute for Marine Sciences, Eilat, and the Institute of Earth Sciences, The Hebrew University of Jerusalem,
Jerusalem, Israel 4Ecologie des Systèmes Aquatiques, Faculté des Sciences, Université Libre de Bruxelles, Belgium
5Departamento de Ciencias Ecológicas, Facultad de Ciencias, Universidad de Chile, Santiago, Chile6Laboratory of Phytoplankton Ecology, Institute of Hydrobiology, Biology Centre ASCR, Czech Republic
7Chemistry and Environment Institute, Gebze-Kocaeli, Turkey 8Brooklyn College of the City University of New York, Brooklyn, New York, USA
ABSTRACT: In the northern Gulf of Eilat (Aqaba), sharp increases in the biomass of diatoms andrates of primary production occurred in April 2008. Within 24 h, diatom abundance rose from 8 × 10³
to 228 × 103 cells l–1, and photosynthetic rates concomitantly doubled from 15 to 35 µg C l–1 d–1. Watertransparency declined, as indicated by the vertical diffusion attenuation coefficient Kd for photosyn-thetically active radiation (PAR), which increased from 0.076 to 0.090 m–1 and decreased the euphoticdepth from 60 to 45 m. During this time, a significant increase in silica deposition by the diatoms wasalso detected. We attribute the mentioned changes in environmental characteristics to wind-gener-ated surface currents. Strong winds (up to 10 m s–1) during the measurements enriched the surfacelayers with unusually high nutrient concentrations within <1 d. Hence, primary production rates wereobserved at a relatively eutrophic nearshore station (MP) and pelagic station (A1, 10 km towards thecenter of the Gulf). They were compared with rates measured on the subsequent day. Values mea-sured were twice as high as those at the pelagic station during the previous calm day. Routine moni-toring programs with monthly or semi-weekly sampling are thus likely to miss brief but significantinjections of nutrients, leading to the underestimation of seasonal and annual primary production.Our results demonstrate the impacts of transient events on the function and annual yield of aquaticecosystems.
KEY WORDS: Primary production · Wind speed · Upwelling · Phytoplankton · Diatom blooms ·Phytoplankton absorption
Resale or republication not permitted without written consent of the publisher
Contribution to AME Special 2 ‘Progress and perspectives in aquatic primary productivity’ OPENPEN ACCESSCCESS

Aquat Microb Ecol 56: 205–215, 2009
from the current routine practices of primary produc-tivity monitoring.
Spatial and temporal distributions of primary pro-duction (PP) are consistent with limitations by light,nutrients, and temperature (Field et al. 1998). Nitrogen(N) limitation characterizes large areas of the world’soceanic, coastal, and estuarine waters (Dugdale 1967,Ryther & Dunstan 1971, Codispoti 1989, Mackey et al.2006), and the supply rate of biologically available N tothese waters is a key control of PP and the resultanttrophic state (Ryther & Dunstan 1971, Eppley & Peter-son 1979, D’Elia et al. 1986, Nixon 1986, Tyrrell 1999,Chen et al. 2008).
While nutrient limitation of PP in the ocean has tradi-tionally been attributed to N, iron (Fe) availability hasmore recently been found to be important (Chase et al.2006, Chen et al. 2008), and phosphorus (P) has beensuggested as the ultimate limiting nutrient over geo-logical timescales (Redfield 1958, Follmi 1996, Tyrrell1999, Mackey et al. 2006, 2007). The major source of Pin the ocean is the weathering of minerals on land andtheir subsequent introduction into the ocean by fluvialand aeolian transport (Filippelli & Delaney 1996, Ben-itez-Nelson 2000, Chen et al. 2008). Because there isno P input process analogous to N fixation, marine pro-ductivity over geological timescales is considered to bea function of the supply rate of P from continentalweathering and the rate at which P is recycled in theocean (Scanlan & Wilson 1999, Mackey et al. 2007).
There are a few events that can significantlyincrease oceanic PP. Hans (1997) found that atmos-pheric deposition (AD) contributes from 300 to>1000 mg N m–2 yr–1 to coastal waters in the biologi-cally available forms NOx
–, NH3/NH4+, and dissolved
organic N; and groundwater (GW) can jointly accountfor 20 to >50% of total exogenous or ‘new’ N loadingand may uniquely mediate coastal eutrophication bybypassing estuarine filters of terrigenous N inputs.Trace metal enrichment (e.g. Fe) in AD and GW mayinteract synergistically with N to stimulate coastal pro-duction. In deep (>200 m) oceanic regions away fromland masses, much of the PP is dependent on regener-ated ammonium derived from organic matter mineral-ization. Exceptions include production supported by Nfixation or NO3 from upwelled deep water, both ofwhich are considered new N sources. Coastal andestuarine environments are heavily influenced by newN, which is supplied either naturally by weathering ofminerals, decomposition, lightning, and geothermalemissions, or anthropogenically (Hans 1997).
Increasing quantities of atmospheric anthropogenicfixed N entering the open ocean could account for upto 1⁄3 of the ocean’s external (non-recycled) N supplyand up to ~3% of the annual new marine biologicalproduction of ~0.3 Pg C yr–1 (Duce et al. 2008).
In the Gulf of Eilat, aerosol-borne trace elementdeposition has an impact on the surface water chem-istry (Chen et al. (2008) and may thus affect PP in thesurface water by supplying important macro- andmicronutrients or, possibly, high levels of toxic ele-ments. The study by Chen et al. (2008) shows that,even in an area dominated by mineral dust depositionand surrounded by deserts, anthropogenic air emis-sions may make a significant contribution to the levelsof various trace elements such as Cu, Cd, Ni, Zn, and P.The estimated residence time of a few years for mosttrace elements underscores the importance of atmos-pheric fluxes to the Gulf ecosystem and the episodicnature of such deposition events demonstrates thatthese may have a large impact.
Other phenomena that can change nutrient avail-ability include the El Niño–Southern Oscillation(ENSO) and cyclones. Between September 1997 andAugust 2000, biospheric net PP varied by 6 Pg C yr–1
(from 111 to 117 Pg C yr–1) (Behrenfeld et al. 2001). Thepassage of cyclone Wasa in December 1991 led toincreases in biomass and PP that were related to nutri-ent enrichment either from terrestrial runoff or resus-pended sediments. The predominance of diatoms dur-ing cyclones seems to be a general pattern that can berelated to their higher growth rates compared to otherphytoplankters (Delesalle et al. 1993).
Episodic eddy-driven upwelling may supply a signif-icant fraction of the nutrients required to sustain PP ofthe subtropical ocean. Mode-water eddies can gener-ate extraordinary diatom biomass and PP at depth rel-ative to the time series near Bermuda. These bloomsare sustained by eddy–wind interactions that amplifythe eddy-induced upwelling (McGillicuddy et al.2007).
The Gulf of Eilat, which is an arm of the Red Sea, is anoligotrophic region with predictable seasonal cycles inmacronutrient concentrations and phytoplankton com-munity structure that are similar to other oligotrophicareas of the world’s oceans, such as the open oceangyres. Changes in the dominance of different phyto-plankton groups occur as the deep mixing conditions inwinter relax, and stratification intensifies beginning inearly spring and continuing through summer. Specifi-cally, a bloom of eukaryotic nanophytoplankton charac-teristic of the winter–summer transition is replaced by asummer community dominated by picophytoplankton(<5 µm), of which Prochlorococcus and Synechococcusare the most numerous (Lindell & Post 1995).
Atmospheric inputs of other nutrients graduallyincrease the likelihood of P limitation in the Gulf (Chenet al. 2007). Simultaneously, these atmospheric inputsprovide an important source of seawater-soluble iron(Chase et al. 2006), which appears to remain in excessof that required for microbial growth throughout the
206
Iluz et al.: Wind-driven productivity spike
year (Chen et al. 2007). During summer and fall, strati-fied surface waters are depleted of nutrients and pico-phytoplankton populations comprise the majority ofcells (80 and 88%, respectively). In winter, surfacenutrient concentrations are higher and larger phyto-plankton are more abundant (63%) (Mackey et al.2007).
The aim of the present study was to describe a wind-driven transient high primary productivity event in theGulf of Eilat that was associated with a diatom bloom.The mechanism by which winds brought about thephytoplankton response is shown, and the implicationsof such dramatic spikes for estimates and models of PPare discussed.
MATERIALS AND METHODS
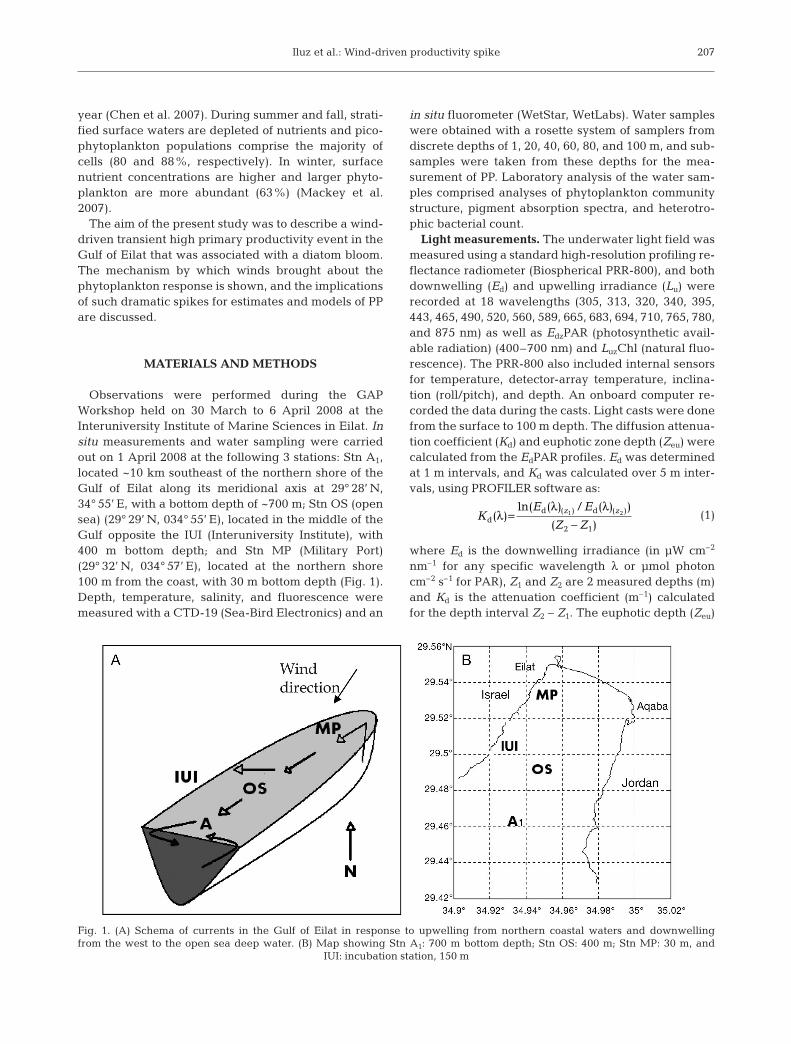
Observations were performed during the GAPWorkshop held on 30 March to 6 April 2008 at theInteruniversity Institute of Marine Sciences in Eilat. Insitu measurements and water sampling were carriedout on 1 April 2008 at the following 3 stations: Stn A1,located ~10 km southeast of the northern shore of theGulf of Eilat along its meridional axis at 29° 28’ N,34° 55’ E, with a bottom depth of ~700 m; Stn OS (opensea) (29° 29’ N, 034° 55’ E), located in the middle of theGulf opposite the IUI (Interuniversity Institute), with400 m bottom depth; and Stn MP (Military Port)(29° 32’ N, 034° 57’ E), located at the northern shore100 m from the coast, with 30 m bottom depth (Fig. 1).Depth, temperature, salinity, and fluorescence weremeasured with a CTD-19 (Sea-Bird Electronics) and an
in situ fluorometer (WetStar, WetLabs). Water sampleswere obtained with a rosette system of samplers fromdiscrete depths of 1, 20, 40, 60, 80, and 100 m, and sub-samples were taken from these depths for the mea-surement of PP. Laboratory analysis of the water sam-ples comprised analyses of phytoplankton communitystructure, pigment absorption spectra, and heterotro-phic bacterial count.
Light measurements. The underwater light field wasmeasured using a standard high-resolution profiling re-flectance radiometer (Biospherical PRR-800), and bothdownwelling (Ed) and upwelling irradiance (Lu) wererecorded at 18 wavelengths (305, 313, 320, 340, 395,443, 465, 490, 520, 560, 589, 665, 683, 694, 710, 765, 780,and 875 nm) as well as EdzPAR (photosynthetic avail-able radiation) (400–700 nm) and LuzChl (natural fluo-rescence). The PRR-800 also included internal sensorsfor temperature, detector-array temperature, inclina-tion (roll/pitch), and depth. An onboard computer re-corded the data during the casts. Light casts were donefrom the surface to 100 m depth. The diffusion attenua-tion coefficient (Kd) and euphotic zone depth (Zeu) werecalculated from the EdPAR profiles. Ed was determinedat 1 m intervals, and Kd was calculated over 5 m inter-vals, using PROFILER software as:
(1)
where Ed is the downwelling irradiance (in µW cm–2
nm–1 for any specific wavelength λ or µmol photoncm–2 s–1 for PAR), Z1 and Z2 are 2 measured depths (m)and Kd is the attenuation coefficient (m–1) calculatedfor the depth interval Z2 – Z1. The euphotic depth (Zeu)
KE E
Z Zz z
dd d( )
ln( ( ) / ( ) )
( )( ) ( )λ
λ λ=
−1 2
2 1
207
Fig. 1. (A) Schema of currents in the Gulf of Eilat in response to upwelling from northern coastal waters and downwellingfrom the west to the open sea deep water. (B) Map showing Stn A1: 700 m bottom depth; Stn OS: 400 m; Stn MP: 30 m, and
IUI: incubation station, 150 m

Aquat Microb Ecol 56: 205–215, 2009
was calculated as the depth where 1% of EdPAR at 1 mwas measured. The EdPAR values at 1 m were usedinstead of subsurface values since the latter wereunusable due to high surface noise.
Nutrients. Nitrites and nitrates were analyzed usingthe colorimetric method described by Grasshoff et al.(1999) using a flow injection autoanalyzer (FIA, LachatInstruments Model QuikChem 8000). The analysis wasfully automated and peak areas were calibrated usingstandards prepared in ‘low nutrient’ filtered seawater(surface seawater sampled during the oligotrophic sea-son in the Gulf of Aqaba) over a range of 0 to 5 µmol l–1.The precision of this method is ±0.02 µmol l–1 fornitrites and ±0.05 µmol l–1 for nitrates.
Chl a. Chl a was estimated using natural fluores-cence, i.e. Lu from the PRR-800 at 683 nm. Chl a con-centration (mg m–3) may be calculated from the naturalfluorescence flux (Ff, nmol photon m–3 s–1), and thescalar irradiance (E0, µmol photon m–2 s–1), i.e. lightflux from all directions:
(2)
Two important optical assumptions are used in thisequation: °acPAR is the chl a-specific absorption coeffi-cient (absorption normalized to chl a concentration)and φf is the quantum yield of fluorescence. Theseparameters are treated as constants in the software forthe PRR-800, with respective values of 0.04 m2 mg–1
and 0.045 µmol photon fluoresced m–2 s–1 (µmol photonabsorbed)–1 cm–2 s–1.
High-resolution measurements (4 to 6 times per day)resulted in a map of chl a values during the periodbefore and after the study period. Data were plottedand interpolated using Ocean Data View (ODV) soft-ware (Schlitzer 2008). Since the chl a estimation algo-rithm is based on empirical constants (the chl a-specificabsorption coefficient and the quantum yield of fluo-rescence), which were not derived specifically for ourphytoplankton assemblages, we calibrated the esti-mated chl a against extracted chl a concentrationsthroughout 2008 (including profiles acquired duringthe present study), using 51 samples over a range of0.01 to 1.14 mg chl a m–3. The calibration factor wascalculated as chl a (mg m–3) = 0.04 Ff chl – 0.0192 (R2 =0.804).
Absorption spectra. In vivo phytoplankton absorp-tion was measured using the filter-pad method(Mitchell et al. 2000) from the discrete samples col-lected at different depths. Amounts of 600 to 2000 mlwater were filtered onto 25 mm GF/F (Whatman). Thefilters were placed in histoprep tissue capsules (FisherScientific) and stored at –20°C until analysis 1 or 2 dlater. The filters were scanned at 350 to 750 nm using aUV-visible spectrophotometer (Cary 50) to obtain total
particulate optical density (ODpart). After pigmentextraction with methanol, the filters were rescanned toobtain the optical density of the detrital material(ODdet). OD spectra were then corrected for pathlengthamplification (Cleveland & Weidemann 1993) and con-verted to absorption coefficient (apart/det) using:
(3)
where the subscript x denotes either particulate ordetrital OD (λ) and X is the ratio of the filtered volumeto the filter clearance area.
The absorption spectra were then corrected forresidual scattering by subtracting the average over748–752 nm from all measured spectra.
Phytoplankton absorption (aph) was calculated as thedifference between total particulate (apart) and detritalabsorption (adet):
(4)
Phytoplankton enumeration. Samples (100 ml) forphytoplankton enumeration were collected at 5 mdepth and fixed with 100 µl of a 25% glutaraldehydesolution. Samples were kept in low light and countedwithin 2 d of collection. For each sample, a 50 ml sub-sample was counted using a phase contrast invertedmicroscope (Utermöhl 1958). Only phytoplankton cellswith >5 µm diameter were identified (Tomas 1996).Phytoplankton biomass was estimated according toEdler (1979) and Menden-Deuer & Lessard (2000).
Flow cytometry. Samples (1.8 ml) for ultraphyto-plankton were preserved with 1% glutaraldehyde(final concentration) and immediately frozen in liquidN and stored at –80°C. Before analysis, samples werequickly thawed at 37°C and counted in a flow cytome-ter (FACScalibur, Becton & Dickinson). Phytoplanktonsamples were run at approximately 60 µl min–1 and10 000 events were acquired in log mode. We addedyellow-green latex beads (0.93 µm, Polysciences) toeach sample as an internal standard.
Silica deposition. Biogenic silica deposition wasmeasured in natural phytoplankton assemblages usingPDMPO (2-(4-pyridyl)-5-((4-(2-dimethylaminoethyl-aminocarbamoyl) methoxy)phenyl)oxazole) labelingfollowing the modified protocol of Leblanc & Hutchins(2005). On 1 to 3 April, fresh surface and deepwatersamples were incubated with PDMPO (final concentra-tion of 0.125 µM) using 250 ml flasks. The sampleswere incubated in water tables with flowing seawater,and the tables were covered with window screening toreduce surface irradiance to ~25%. After a 24 h incu-bation, samples were brought to the laboratory and fil-tered through 2 µm pore size polycarbonate filters(Osmonics, Poretics). Filters were rinsed with distilledwater to eliminate any unbound PDMPO, placed on adrop of immersion oil on a glass slide and sealed under
a a aph part= − det
aX
xx
OD( )
. ( )λ λ= ×2 303
ChlPAR PAR
f
c f o=
° × ×F
a Eφ
208

Iluz et al.: Wind-driven productivity spike
a glass cover with another drop of oil above the filter. Aportion of cells actively depositing silica was countedimmediately after filter preparation; PDMPO fluores-cence was measured later. Epifluorescence microscopycoupled with digital image analysis was used for quan-titative evaluation of PDMPO fluorescence (FPDMPO),which was expressed in relative fluorescence units(RU) cell–1 and calculated as described in Znachor &Nedoma (2008). A paired 2-tailed Student’s t-test wasperformed to examine differences in Si incorporationbetween surface populations and those at the deepchlorophyll maximum (DCM), with differencesaccepted as significant when p < 0.05.
Productivity (carbon assimilation). PP measure-ments were made using the 14C uptake methoddescribed by Steeman-Nielsen (1952) and modified byStrickland & Parsons (1968). Bottles containing 50 mlsamples of seawater were incubated in situ for 24 h attheir original sampling depth after addition of ~5 µCi ofcarrier-free NaH14CO3 (New England Nuclear). Themooring line with the incubation bottles was deployed~1 km offshore of the IUI (Fig. 1) at a bottom depth of140 to 150 m before first light (~04:00 h), and retrievedat the same time the following morning.
Upon retrieval, the incubation bottles were kept in ablack box until filtration. The contents of the bottleswere GF/F (Gelman) filtered with a Millipore glass fil-tration system under light vacuum (15 cm Hg). Thesefilters were then treated with HCl vapors to removetraces of inorganic carbon. The filters were placed inglass vials with 10 ml Insta Gel (Packard) and countedin a liquid scintillation counter (Packard 3255) for10 min each. Added activity was measured by sam-pling 50 µl from each bottle and placing it on a GF/Ffilter soaked with NaOH to trap the CO2. The added-activity samples were counted in the manner describedabove. The total inorganic carbon was determinedfrom alkalinity (Strickland & Parsons 1968). Productiv-ity rates were then estimated using the JGOFS (JointGlobal Ocean Flux Study) protocol (UNESCO 1994).
Estimated productivity (Fc-683). Productivity esti-mated was estimated based on chlorophyll natural flu-orescence at 683 nm wavelength, measured with anunderwater spectro-radiometer (Biospherical PRR-800). Natural fluorescence per volume (Ff) was derivedfrom Lu in the chlorophyll emission spectrum. Fc-683
productivity estimation uses the volume fluorescence(Ff, nmol photon m–3 s–1) and the scalar irradiance(EoPAR, µmol photon m–2 s–1) as well as photosyntheticparameters such as the maximal ratio of the quantumyields of photosynthesis to fluorescence (φrmax, C atomphoton–1) and the irradiance at which this ratio is 1⁄2 ofthe maximum (kcf, µmol photon m–2 s–1]). These para-meters were determined empirically and assigned asφrmax = 4 C atom photon–1 and kcf = 133 µmol photon
m–2 (Kiefer et al. 1989, Chamberlin et al. 1990, Cham-berlin & Marra 1992).
(5)
Fc-683 estimations were made using PROFILER soft-ware (Biospherical Instruments). An onboard computerrecorded the data online. Measurements were donefrom the surface down to 100 m at 13:00 to 14:00 h.
Regression of PP (estimated using in situ 14C uptake)against estimated productivity based on fluorescence(Fc-683, measured in 3 profiles on different dates)showed a significant correlation: Y (mg C m–3 d–1) =1.469 + 0.592 X (Fc-683 units); r2 = 0.823; p < 0.0001; n =24. Each profile was taken from 5 to 100 m; no fluores-cence readings were recorded in the upper 5 m becauseof the high ambient irradiance interference with read-ings from the PRR-800 reflectance radiometer.
Wind speed and direction data were obtained fromthe meteorological database maintained at the IUI.
RESULTS
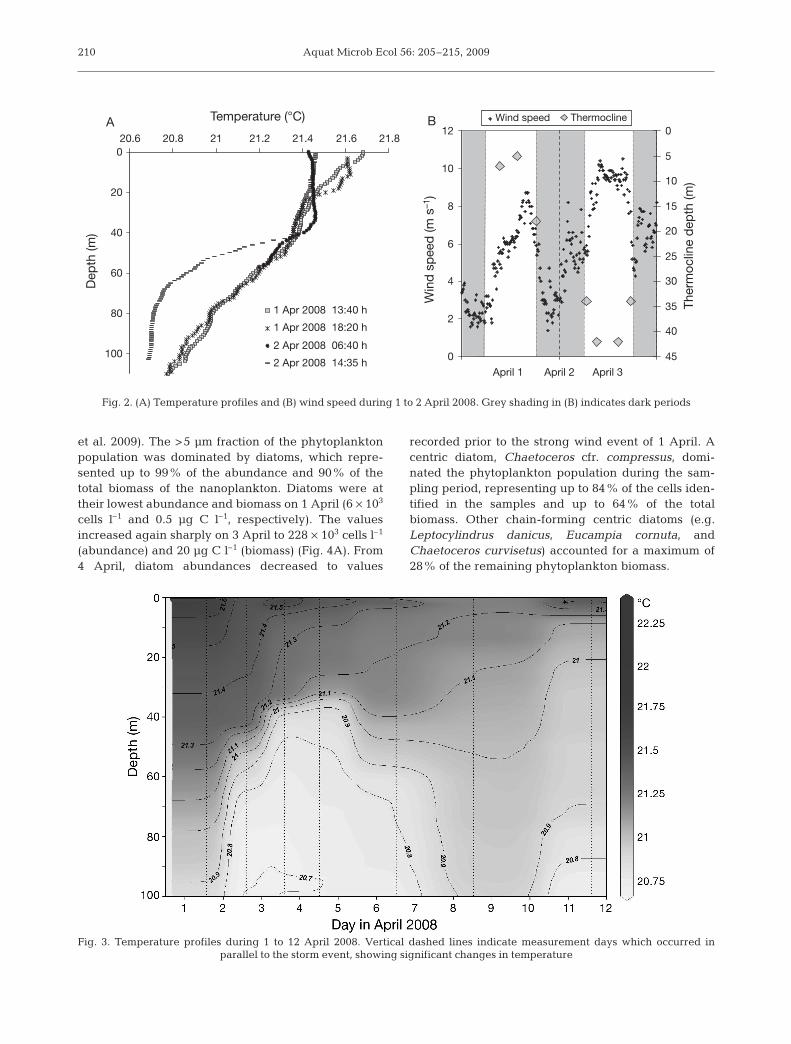
Wind velocity changed dramatically throughout thestudy period and showed a diurnal variation of mainlyhigh values during the day and low values at night. Windspeed was ~3 m s–1 at midnight prior to sampling and in-creased to almost 10 m s–1 the next day (2 April 2008)(Fig. 2B). The changes in wind speed also affected thetemperature profiles, which displayed a sharp decrease(from 21.7 to 21.4°C in 15 h) at the surface (Fig. 2A).The thermocline, which was at 5 m on 1 April at 13:40 h,moved to a depth of ~35 m the following day (Fig. 2B).Temperature profiles during 20 March to 7 May 2008showed significant changes in temperature duringthe storm event (Fig. 3). Following the strong wind eventon 1 April, water transparency declined; Kd(PAR) in-creased from 0.076 to 0.090 m–1 and Zeu increased from60 m to 45 m, which is shallower than typically observedat this time of the year (Iluz 1997). Zeu continued to de-crease for 4 d showing high diel variability, and in-creased once again by 6 April (Fig. 4).
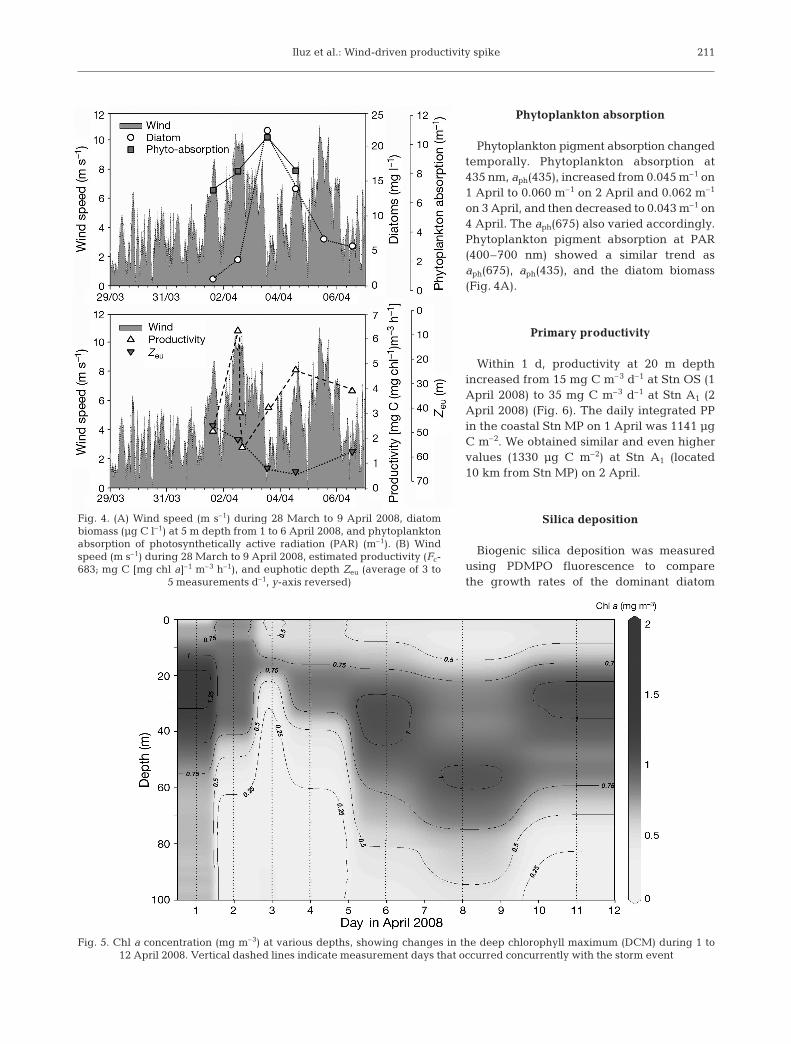
Chl a concentration was low and showed the typicalvertical variation for the study area. The deep chlorophyllmaximum (DCM) was at 30 m on 31 March, with a maxi-mum value of ~1.5 µg l–1, but deepened during the re-mainder of the observation period, with declining chl aconcentrations that reached a minimum on 8 April (Fig. 5).
Phytoplankton community structure
Throughout the experiment, picophytoplankton(<5 µm) increased from 25 to 50 µg C l–1 (see Bar Zeev
F Fk
k Er
c fcf
cf oPAR=
+φ max
209
Aquat Microb Ecol 56: 205–215, 2009
et al. 2009). The >5 µm fraction of the phytoplanktonpopulation was dominated by diatoms, which repre-sented up to 99% of the abundance and 90% of thetotal biomass of the nanoplankton. Diatoms were attheir lowest abundance and biomass on 1 April (6 × 10³
cells l–1 and 0.5 µg C l–1, respectively). The valuesincreased again sharply on 3 April to 228 × 103 cells l–1
(abundance) and 20 µg C l–1 (biomass) (Fig. 4A). From4 April, diatom abundances decreased to values
recorded prior to the strong wind event of 1 April. Acentric diatom, Chaetoceros cfr. compressus, domi-nated the phytoplankton population during the sam-pling period, representing up to 84% of the cells iden-tified in the samples and up to 64% of the totalbiomass. Other chain-forming centric diatoms (e.g.Leptocylindrus danicus, Eucampia cornuta, andChaetoceros curvisetus) accounted for a maximum of28% of the remaining phytoplankton biomass.
210
0
2
4
6
8
10
12
April 1 April 2 April 3
Win
d s
pee
d (m
s–1
)
0
5
10
15
20
25
30
35
40
45
Ther
moc
line
dep
th (m
)
Wind speed Thermocline
0
20
40
60
80
100
20.6 20.8 21 21.2 21.4 21.6 21.8
Temperature (°C) A B
Dep
th (m
)
1 Apr 2008 13:40 h
1 Apr 2008 18:20 h
2 Apr 2008 06:40 h
2 Apr 2008 14:35 h
Fig. 2. (A) Temperature profiles and (B) wind speed during 1 to 2 April 2008. Grey shading in (B) indicates dark periods
Fig. 3. Temperature profiles during 1 to 12 April 2008. Vertical dashed lines indicate measurement days which occurred inparallel to the storm event, showing significant changes in temperature
Iluz et al.: Wind-driven productivity spike
Phytoplankton absorption
Phytoplankton pigment absorption changedtemporally. Phytoplankton absorption at435 nm, aph(435), increased from 0.045 m–1 on1 April to 0.060 m–1 on 2 April and 0.062 m–1
on 3 April, and then decreased to 0.043 m–1 on4 April. The aph(675) also varied accordingly.Phytoplankton pigment absorption at PAR(400–700 nm) showed a similar trend asaph(675), aph(435), and the diatom biomass(Fig. 4A).
Primary productivity
Within 1 d, productivity at 20 m depthincreased from 15 mg C m–3 d–1 at Stn OS (1April 2008) to 35 mg C m–3 d–1 at Stn A1 (2April 2008) (Fig. 6). The daily integrated PPin the coastal Stn MP on 1 April was 1141 µgC m–2. We obtained similar and even highervalues (1330 µg C m–2) at Stn A1 (located10 km from Stn MP) on 2 April.
Silica deposition
Biogenic silica deposition was measuredusing PDMPO fluorescence to comparethe growth rates of the dominant diatom
211
Fig. 4. (A) Wind speed (m s–1) during 28 March to 9 April 2008, diatombiomass (µg C l–1) at 5 m depth from 1 to 6 April 2008, and phytoplanktonabsorption of photosynthetically active radiation (PAR) (m–1). (B) Windspeed (m s–1) during 28 March to 9 April 2008, estimated productivity (Fc-683; mg C [mg chl a]–1 m–3 h–1), and euphotic depth Zeu (average of 3 to
5 measurements d–1, y-axis reversed)
Fig. 5. Chl a concentration (mg m–3) at various depths, showing changes in the deep chlorophyll maximum (DCM) during 1 to12 April 2008. Vertical dashed lines indicate measurement days that occurred concurrently with the storm event

Aquat Microb Ecol 56: 205–215, 2009
Chaetoceros spp. during the study period. Due to lowabundance of the other diatom species, their contribu-tion to Si deposition could not be measured. In general,Si deposition of Chaetoceros was significantly higher atthe DCM depth than at the surface (t = 2.9, p < 0.01). On1 April, low abundance of Chaetoceros spp. concurredwith low silica deposition rates (FPDMPO = 0.07 RUcell–1). During a peak in the Chaetoceros bloom on2 April, Si deposition rates markedly increased (FPDMPO
= 0.38 RU cell–1) and most of the population was in-volved in Si deposition at both the surface and the
DCM, indicating high growth rates. However, the dayafter the bloom, Chaetoceros growth rates droppeddown to previous values, most likely due to nutrient de-pletion. On 1 April, concentrations of dissolved inor-ganic nitrogen (DIN) (nitrite and nitrate) ranged be-tween 0.01 and 0.02 µM N, while it increased abruptlyin near-surface waters on 2 April, reaching concentra-tions of 0.08 to 0.1 µM N. The day after the bloom, DINlevels decreased to 0.01 to 0.03 µM N.
DISCUSSION
Daily PP and chl a concentration during the studyperiod were the highest ever recorded in the Gulf ofEilat: 1330 mg C m–2 d–1 and up to 1.5 µg chl a l–1,respectively, which is almost 3× higher than averagechl a values at this time of year in this area. Our resultssuggest an abrupt increase in mixing. The data show asharp increase in the biomass of diatoms and in therates of PP over a short time. Wind direction was fromthe coast towards the open Gulf, and upwelling wasinduced. PP is usually higher in the northern andcoastal stations than in the open Gulf (Iluz 1997), butin the experiment reported here, we observed that on1 April 2008 and the following day, the rates at Stn A1
(10 km from MP) increased to a level similar to that ofthe coastal Stn MP. The changes were limited to theupper 40 m (Fig. 6), with no significant increase ineither biomass or productivity below this depth. Weassume that the increased wind speed induced thetransfer of a coastal water mass from the northernshore towards the open sea. This water is more nutri-ent rich than that of the open sea, and thus supports
212
0
20
40
60
80
100
120
0 10 20 30 40 50
Productivity (mg C m–3 d–1)
Dep
th (m
)
Stn OS (1 Apr)
Stn MP (1 Apr)
Stn A1 (2 Apr)
Fig. 6. In situ primary production profiles at Stns MP (MilitaryPort, 1 April), OS (open sea, 1 April), and A1 (2 April). The
incubation at Stn A1 was on 2 April 2008
0
20
40
60
80
100
120
20.6 20.8 21 21.2 21.4 21.6Temperature (°C) TON (µM l–1)
Dep
th (m
)
1 Apr 2008 13:34 h
2 Apr 2008 14:30 h
3 Apr 2008 14:24 h
4 Apr 2008 12:26 h
6 Apr 2008 12:18 h
0
20
40
60
80
100
120
0 1 2 3 4
1 Apr 2008
2 Apr 2008
3 Apr 2008
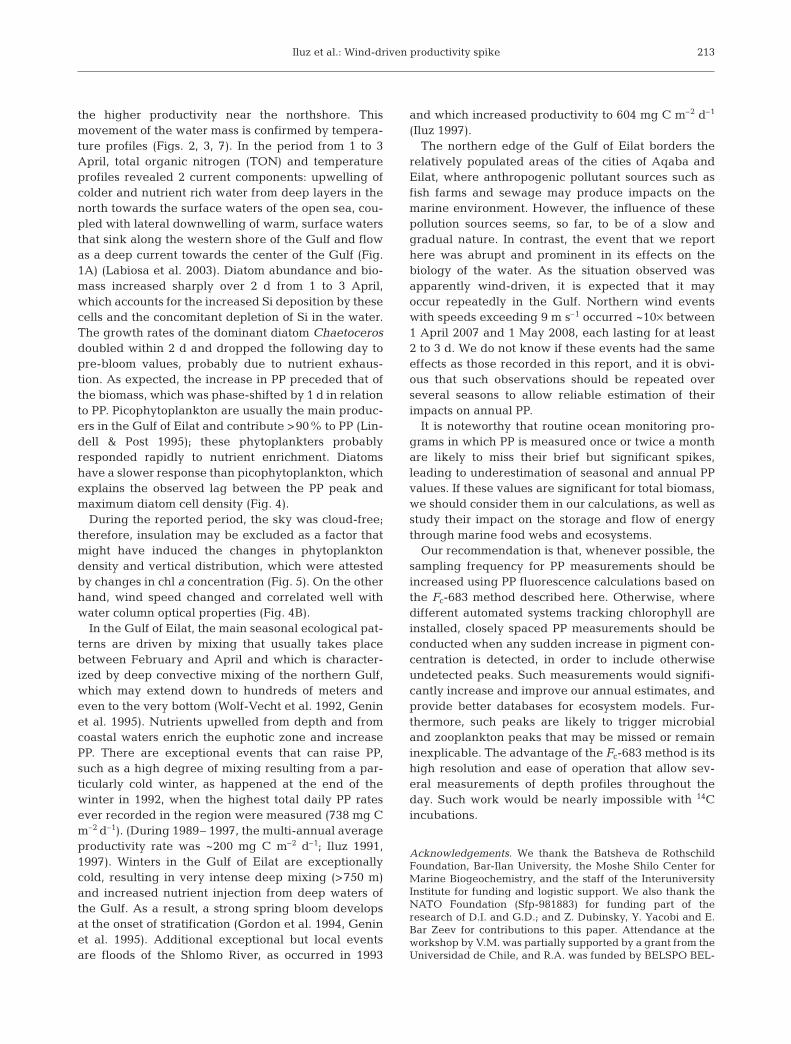
Fig. 7. (A) Profiles of total organic nitrogen (TON) on 1 to 3 April 2008, and (B) temperature on 1 to 6 April 2008, showing mixingfrom the surface and mixing of upwelled water at depth
Iluz et al.: Wind-driven productivity spike
the higher productivity near the northshore. Thismovement of the water mass is confirmed by tempera-ture profiles (Figs. 2, 3, 7). In the period from 1 to 3April, total organic nitrogen (TON) and temperatureprofiles revealed 2 current components: upwelling ofcolder and nutrient rich water from deep layers in thenorth towards the surface waters of the open sea, cou-pled with lateral downwelling of warm, surface watersthat sink along the western shore of the Gulf and flowas a deep current towards the center of the Gulf (Fig.1A) (Labiosa et al. 2003). Diatom abundance and bio-mass increased sharply over 2 d from 1 to 3 April,which accounts for the increased Si deposition by thesecells and the concomitant depletion of Si in the water.The growth rates of the dominant diatom Chaetocerosdoubled within 2 d and dropped the following day topre-bloom values, probably due to nutrient exhaus-tion. As expected, the increase in PP preceded that ofthe biomass, which was phase-shifted by 1 d in relationto PP. Picophytoplankton are usually the main produc-ers in the Gulf of Eilat and contribute >90% to PP (Lin-dell & Post 1995); these phytoplankters probablyresponded rapidly to nutrient enrichment. Diatomshave a slower response than picophytoplankton, whichexplains the observed lag between the PP peak andmaximum diatom cell density (Fig. 4).
During the reported period, the sky was cloud-free;therefore, insulation may be excluded as a factor thatmight have induced the changes in phytoplanktondensity and vertical distribution, which were attestedby changes in chl a concentration (Fig. 5). On the otherhand, wind speed changed and correlated well withwater column optical properties (Fig. 4B).
In the Gulf of Eilat, the main seasonal ecological pat-terns are driven by mixing that usually takes placebetween February and April and which is character-ized by deep convective mixing of the northern Gulf,which may extend down to hundreds of meters andeven to the very bottom (Wolf-Vecht et al. 1992, Geninet al. 1995). Nutrients upwelled from depth and fromcoastal waters enrich the euphotic zone and increasePP. There are exceptional events that can raise PP,such as a high degree of mixing resulting from a par-ticularly cold winter, as happened at the end of thewinter in 1992, when the highest total daily PP ratesever recorded in the region were measured (738 mg Cm–2 d–1). (During 1989– 1997, the multi-annual averageproductivity rate was ~200 mg C m–2 d–1; Iluz 1991,1997). Winters in the Gulf of Eilat are exceptionallycold, resulting in very intense deep mixing (>750 m)and increased nutrient injection from deep waters ofthe Gulf. As a result, a strong spring bloom developsat the onset of stratification (Gordon et al. 1994, Geninet al. 1995). Additional exceptional but local eventsare floods of the Shlomo River, as occurred in 1993
and which increased productivity to 604 mg C m–2 d–1
(Iluz 1997).The northern edge of the Gulf of Eilat borders the
relatively populated areas of the cities of Aqaba andEilat, where anthropogenic pollutant sources such asfish farms and sewage may produce impacts on themarine environment. However, the influence of thesepollution sources seems, so far, to be of a slow andgradual nature. In contrast, the event that we reporthere was abrupt and prominent in its effects on thebiology of the water. As the situation observed wasapparently wind-driven, it is expected that it mayoccur repeatedly in the Gulf. Northern wind eventswith speeds exceeding 9 m s–1 occurred ~10× between1 April 2007 and 1 May 2008, each lasting for at least2 to 3 d. We do not know if these events had the sameeffects as those recorded in this report, and it is obvi-ous that such observations should be repeated overseveral seasons to allow reliable estimation of theirimpacts on annual PP.
It is noteworthy that routine ocean monitoring pro-grams in which PP is measured once or twice a monthare likely to miss their brief but significant spikes,leading to underestimation of seasonal and annual PPvalues. If these values are significant for total biomass,we should consider them in our calculations, as well asstudy their impact on the storage and flow of energythrough marine food webs and ecosystems.
Our recommendation is that, whenever possible, thesampling frequency for PP measurements should beincreased using PP fluorescence calculations based onthe Fc-683 method described here. Otherwise, wheredifferent automated systems tracking chlorophyll areinstalled, closely spaced PP measurements should beconducted when any sudden increase in pigment con-centration is detected, in order to include otherwiseundetected peaks. Such measurements would signifi-cantly increase and improve our annual estimates, andprovide better databases for ecosystem models. Fur-thermore, such peaks are likely to trigger microbialand zooplankton peaks that may be missed or remaininexplicable. The advantage of the Fc-683 method is itshigh resolution and ease of operation that allow sev-eral measurements of depth profiles throughout theday. Such work would be nearly impossible with 14Cincubations.
Acknowledgements. We thank the Batsheva de RothschildFoundation, Bar-Ilan University, the Moshe Shilo Center forMarine Biogeochemistry, and the staff of the InteruniversityInstitute for funding and logistic support. We also thank theNATO Foundation (Sfp-981883) for funding part of theresearch of D.I. and G.D.; and Z. Dubinsky, Y. Yacobi and E.Bar Zeev for contributions to this paper. Attendance at theworkshop by V.M. was partially supported by a grant from theUniversidad de Chile, and R.A. was funded by BELSPO BEL-
213

Aquat Microb Ecol 56: 205–215, 2009
COLOUR-2 project (SR/00/104). This study was conductedduring the 8th International Workshop of the Group forAquatic Primary Productivity (GAP) and the Batsheva deRothschild Seminar on Gross and Net Primary Productivityheld at the Interuniversity Institute for Marine Sciences, Eilat,Israel in April 2008.
LITERATURE CITED
Bar Zeev E, Berman-Frank I, Stambler N, Vázquez Domín-guez E and others (2009) Transparent exopolymer parti-cles (TEP) link phytoplankton and bacterial production inthe Gulf of Aqaba. Aquat Microb Ecol 56:217–225
Behrenfeld MJ, Randerson JT, McClain CR, Feldman GC andothers (2001). Biospheric primary production during anENSO transition. Science 291:2594–2597
Benitez-Nelson C (2000) The biogeochemical cycling of phos-phorus in marine systems. Earth Sci Rev 51:109–135
Chamberlin WS, Marra J (1992) Estimation of photosyntheticrate from measurements of natural fluorescence: analysisof the effects of light and temperature. Deep-Sea Res39:1695–1706
Chamberlin WS, Booth CR, Kiefer DA, Morrow JH, MurphyRC (1990) Evidence for a simple relationship between nat-ural fluorescence, photosynthesis, and chlorophyll in thesea. Deep-Sea Res 37:951–973
Chase Z, Paytan A, Johnson KS, Street J, Chen Y (2006) Inputand cycling of iron in the Gulf of Aqaba, Red Sea.Global Biogeochem Cycles 20:GB3017, doi:10.1029/2005GB002646
Chen Y, Mills S, Street J, Golan D, Post A, Jacobson M, Pay-tan A (2007) Estimates of atmospheric dry deposition andassociated input of nutrients to Gulf of Aqaba seawater.J Geophys Res 112:D04309, doi:10.1029/2006JD007858
Chen Y, Paytan A, Chase Z, Measures C and others (2008)Sources and fluxes of atmospheric trace elements to theGulf of Aqaba, Red Sea. J Plankton Res 113:1–13
Cleveland JS, Weidemann AD (1993) Quantifying absorptionby aquatic particles: a multiple scattering correction forglass-fiber filters. Limnol Oceanogr 38:1321–1327
Codispoti LA (1989) Phosphorus vs. nitrogen limitations ofnew and export production. In: Berger WH, Smetacek VS,Wefer G (eds) Productivity of the ocean: present and past.J Wiley & Sons, Chichester, p 377–394
D’Elia CE, Sanders JG, Boynton WR (1986) Nutrient enrich-ment studies in a coastal plain estuary: phytoplanktongrowth in large scale, continuous cultures. Can J FishAquat Sci 43:397–406
Delesalle B, Pichon M, Frankignoulle M, Gattuso JP (1993)Effects of a cyclone on coral reef phytoplankton biomass,primary production and composition (Moorea Island,French Polynesia). J Plankton Res 15:1413–1423
Duce RA, LaRoche J, Altieri K, Arrigo K and others (2008)Impacts of atmospheric anthropogenic nitrogen on theopen ocean. Science 320:893–897
Dugdale RC (1967) Nutrient limitation in the seas: dynamics, iden-tification, and significance. Limnol Oceanogr 12:685–695
Edler L (ed) (1979) Recommendations for marine biologicalstudies in the Baltic Sea: phytoplankton and chlorophyll.Baltic Mar Biol 5:1–38
Eppley RW, Peterson BJ (1979) Particulate organic matter fluxand planktonic new production in the deep ocean. Nature282:677–680
Field CB, Behrenfeld MJ, Randerson JT, Falkowski P (1998)Primary production of the biosphere: integrating terres-trial and oceanic components. Science 281:237–240
Filippelli GM, Delaney ML (1996) Phosphorus geochemistryof equatorial Pacific sediments. Geochim Cosmochim Acta60:1479–1495
Follmi KB (1996) The phosphorus cycle, phosphogenesis andmarine phosphate-rich deposits. Earth Sci Rev 40:55–124
Genin A, Lazar B, Brener S (1995) Vertical mixing and coraldeath in the Red Sea following the eruption of MountPinatubo. Nature 377:507–510
Gordon N, Angel DL, Neori A, Kress N, Kimor B (1994) Het-erotrophic dinoflagellates with symbiotic cyanobacteriaand nitrogen limitation in the Gulf of Aqaba. Mar EcolProg Ser 107:83–88
Grasshoff K, Kremling K, Ehrhardt M (eds) (1999) Methods ofseawater analysis, 3rd edn. Wiley–VCH, Weinheim
Hans P (1997) Coastal eutrophication and harmful algalblooms: importance of atmospheric deposition andgroundwater as ‘new’ nitrogen and other nutrient sources.Limnol Oceanogr 42:1154–1165
Iluz D (1991) Primary production of phytoplankton in thenorthern Gulf of Eilat, Red Sea. MSc thesis, Bar-Ilan Uni-versity, Ramat-Gan (in Hebrew with English abstract)
Iluz D (1997) The light field, phytoplankton pigmentation andproductivity in the Gulf of Eilat. PhD thesis, Bar-Ilan Uni-versity, Ramat-Gan (in Hebrew with English abstract)
Kiefer DA, Chamberlin WS, Booth CR (1989) Natural fluores-cence of chlorophyll a: relationship to photosynthesis andchlorophyll concentration in the western South Pacificgyre. Limnol Oceanogr 34:868–881
Labiosa RG, Arrigo KR, Genin A, Monismith G, van Dijken G(2003) The interplay between upwelling and deep convec-tive mixing in determining the seasonal phytoplanktondynamics in the Gulf of Aqaba: evidence from SeaWiFSand MODIS. Limnol Oceanogr 48:2355–2368
Leblanc K, Hutchins DA (2005) New applications of a bio-genic silica deposition fluorophore in the study of oceanicdiatoms. Limnol Oceanogr Methods 3:462–476
Lindell D, Post AF (1995) Ultraphytoplankton succession istriggered by deep winter mixing in the Gulf of Aqaba(Eilat), Red Sea. Limnol Oceanogr 40:1130–1141
Mackey KRM, Labiosa RG, Street JH, Paytan A (2006) Nitro-gen and phosphorus co-limit growth and control commu-nity composition and taxon specific nutrient status in theGulf of Aqaba, Red Sea. EOS Trans Am Geophys Union86:52
Mackey KRM, Labiosa RG, Calhoun M, Street JH, Post AF,Paytan A (2007) Phosphorus availability, phytoplanktoncommunity dynamics, and taxon-specific phosphorus sta-tus in the Gulf of Aqaba, Red Sea. Limnol Oceanogr52:873–885
McGillicuddy Jr DJ, Laurence AA, Bates NR, Bibby T andothers (2007) Eddy/wind interactions stimulate extraordi-nary mid-ocean plankton blooms. Science 316:1021–1026
Menden-Deuer S, Lessard EJ (2000) Carbon to volume rela-tionship for dinoflagellates, diatoms and other protistplankton. Limnol Oceanogr 45:569–579
Mitchell BG, Bricaud A, Carder K, Cleveland J and others(2000) Determination of spectral absorption coefficientsof particles, dissolved material and phytoplankton fordiscrete water samples. In: Fargion GS, Mueller JL(eds) Ocean optics protocols for satellite ocean colorsensor validation, Rev 2. NASA/TM-2000-209966,NASA Goddard Space Flight Center, Greenbelt, MD,p 125–153
Nixon SW (1986) Nutrient dynamics and the productivity ofmarine coastal waters. In: Halwagy R, Clayton D, Behbe-hani M (eds) Marine environment and pollution. AldenPress, Oxford, p 97–115
214

Iluz et al.: Wind-driven productivity spike
Redfield AC (1958) The biological control of chemical factorsin the environment. Am Sci 46:205–221
Ryther JH, Dunstan WM (1971) Nitrogen, phosphorus andeutrophication in the coastal marine environment. Science171:1008–l 112.
Scanlan DJ, Wilson WH (1999) Application of molecular tech-niques to addressing the role of P as a key effector inmarine ecosystems. Hydrobiology 401:149–175
Schlitzer R (2008) Ocean data view. http://odv.awi.deSteeman-Nielsen E (1952) Measurements of production of
organic matter in the sea by means of carbon-14. Nature267:684–685
Strickland JDH, Parsons TR (1968) A practical handbook ofseawater analysis. Bull Fish Res Bd Can 167:1–311
Tomas CR (1996) Identifying marine phytoplankton. Acade-mic Press, San Diego, CA
Tyrrell T (1999) The relative influences of nitrogen andphosphorus on oceanic primary production. Nature 400:525–531
UNESCO (1994) Protocols for the joint global ocean flux study(JGOFS) core measurements. IOC manuals and guides 29.UNESCO, Paris, p 170
Utermöhl H (1958) Zur Vervollkomnung der quantitativenPhytoplankton-Methodik. Mitt Int Ver Theor Angew Lim-nol 9:1–38
Wolf-Vecht A, Paldor N, Brenner N (1992) Hydrographic indi-cations of advection/convection effects in the Gulf of Eilat.Deep-Sea Res 39:1393–1401
Znachor P, Nedoma J (2008) Application of the PDMPO tech-nique in studying silica deposition in natural populationsof Fragilaria crotonensis (Bacillariophyceae) at differentdepths in a eutrophic reservoir. J Phycol. 44:518–525
215
Editorial responsibility: Hugh MacIntyre,Dauphin Island, Alabama, USA
Submitted: December 9, 2008; Accepted: May 6, 2009Proofs received from author(s): June 22, 2009