short-term size-specific distribution and movement ... size-specific distribution and movement...
TRANSCRIPT

Ciencias Marinas (2009), 35(1): 41–57
41
Short-term size-specific distribution and movement patterns of juvenile flatfish in a Pacific estuary derived through length-frequency and mark-recapture data
Evaluación de la distribución y movimiento de lenguados juveniles en un sistema estuarino del Pacífico en escalas de tiempo cortas por medio de frecuencias de tallas y marcaje y recaptura
SZ Herzka1, R Griffiths2, FJ Fodrie3, ID McCarthy2
1 Departamento de Oceanografía Biológica, Centro de Investigación Científica y Enseñanza Superior de Ensenada (CICESE), Km. 107 Carretera Tijuana-Ensenada, Ensenada, Baja California, México. E-mail: [email protected]
2 School of Ocean Sciences, University of Wales-Bangor, Menai Bridge, Anglesey, LL59 5AB, UK.3 Scripps Institution of Oceanography, UCSD MC 0218, La Jolla, CA 92093, USA (current address: Dauphin Island Sea Lab,
101 Bienville Blvd, Dauphin Island, AL 36528).
Abstract
Evaluating small-scale distribution and movement patterns of juvenile fishes within estuarine systems is necessary foridentifying favorable nursery habitats and adequately interpreting local instantaneous growth and mortality estimates. Fine-scale, size-specific catch per unit effort (CPUE, catch per 500 m tow) and movement of juvenile flatfish were studied in PuntaBanda Estuary, Baja California, Mexico, during the summer of 2004. After dividing the estuary into five contiguous sections,habitat utilization and movement were analyzed using two complimentary approaches. We intensively surveyed the estuarythroughout the summer to document the size-specific distribution of flatfishes. California halibut and diamond turbot werecaptured throughout the estuary on all sampling dates, indicating that the entire system serves as habitat for juveniles. Multipleregression analysis indicated that the CPUE of California halibut was significantly and negatively related to temperature anddepth, although the model exhibited low explanatory power. In contrast, the CPUE of diamond turbot was only significantly andnegatively related to depth. CPUE was not related to salinity for either species. Analyses of site- and time-specific length-frequency distributions indicated movement by all flatfishes on the time scale of weeks, which is likely due to the estuarineemigration of fish >140 mm standard length. In addition, an estuary-wide mark-recapture study was performed. Visibleelastomer implants were used to tag 697 California halibut, 442 diamond turbot, and 128 spotted turbot. Based on section-specific CPUE and the area of the estuary, we tagged 3–6% of the local population of each species in a given month. FourCalifornian halibut and two diamond turbot were recaptured within hundreds of meters of where they were released. Hence, weobserved residency and movement at the same time. This study indicates that short-term movement and its underlying causesshould be taken into account when assessing patterns of juvenile habitat utilization.
Key words: estuarine emigration, flatfish, movement, nursery habitat.
Resumen
La valoración de hábitats estuarinos de crianza para juveniles de peces marinos se basa en la caracterización de patrones dedistribución en relación a condiciones ambientales y en la estimación de tasas de crecimiento y mortalidad. Sin embargo, elmovimiento de individuos entre hábitats puede desvirtuar la relación entre la calidad de un hábitat y estos parámetros. En esteestudio se caracterizaron los patrones de utilización de hábitat en un sistema estuarino en escalas de tiempo y espacio cortas. Secuantificó la captura por unidad de esfuerzo (captura por arrastre de 500 m; CPUE) en diferentes secciones del Estero de PuntaBanda, Baja California (México), y se evaluó el movimiento con dos estrategias complementarias: el análisis de frecuencias detallas y un estudio de marcaje y recaptura. El estero se dividió en cinco secciones contiguas que abarcaban todo el sistema. Sehicieron censos en junio, julio y agosto de 2004. Se capturaron juveniles de lenguado de California y platija diamante en todoslos censos y secciones del estero, lo cual indica que todo el estuario sirve de hábitat para los juveniles. Mediente análisis deregresión múltiple se encontró una relación significativa negativa entre la CPUE del lenguado de California y la temperatura yprofundidad. Para la platija diamante se encontró una relación significativa negativa con la profundidad. Para ambas especies, elmodelo explicó un bajo porcentaje de variabilidad y no se detectó relación entre CPUE y salinidad, lo cual indica que estosparámetros no influyen en la distribución de los juveniles. Las distribuciones de frecuencias de tallas sugieren emigración dejuveniles de longitud estándar >140 mm. Se marcaron 697 lenguados de California, 442 platijas diamante y 128 platijasmoteadas con marcas visibles elastoméricas. Con base en la CPUE y el área de cada sección, se marcó de 3–6% de la poblaciónde cada especie cada mes. Se recapturaron cuatro lenguados de California y dos platijas diamante en la misma sección del esterodonde fueron liberados. Se obtuvo evidencia tanto de movimiento como de residencia. Este estudio indica que es necesariocaracterizar el movimiento en escalas de tiempo cortas como parte de la evaluación de patrones de utilización de hábitat.
Palabras clave: emigración estuarina, hábitat de crianza, movimiento, peces planos.

Ciencias Marinas, Vol. 35, No. 1, 2009
42
Introduction
Many flatfish species spend the early part of their lives incoastal areas, and estuaries are often identified as importantnursery grounds (Gibson 1997). Because estuaries are complexand dynamic environments, the interplay of biotic and abioticfactors such as salinity, freshwater inflow, oxygen levels,turbidity, depth, food availability, predation pressure, andrecruitment affect the distribution and abundance patterns ofjuvenile flatfishes (reviewed by Able et al. 2005). Conse-quently, patterns of flatfish estuarine habitat utilization varyspatially, temporally, and ontogenetically (Armstrong 1997,Howell et al. 1999, Goldberg et al. 2002).
Studies of nursery habitat value for juvenile fishes in estua-rine environments often assume that distribution patterns and,more importantly, that growth and mortality estimates obtainedfrom “instantaneous” collections of organisms represent over-all patterns over longer temporal scales; however, movementof individuals can confound instantaneous assessments ofnursery habitat value. The underlying causes for individualjuvenile fish movements in estuarine systems can be related toresource-directed dynamics within and among home ranges, aswell as the process of estuarine immigration and emigration(non-resource mediated migration, sensu Dingle 1996). Hence,studies that evaluate movement and migration of juvenilefishes within estuaries over fine temporal and spatial scales arecrucial to understanding how these systems are used as nurser-ies and to the quantification of habitat value (Saucerman andDeegan 1991, Beck et al. 2001, Burrows et al. 2004).
Within estuarine and coastal systems of the Pacific coast-line, flatfish are important members of the ichthyofaunalcommunity (Allen 1990; Kramer 1990, 1991a; Rosales-Casián1997; Allen et al. 2006). We focused on the juvenile stages ofCalifornia halibut (Paralichthys californicus), diamond turbot(Pleuronichthys guttulatus, previously Hypsopsetta guttulata),and spotted turbot (Pleuronichthys ritteri). These three speciesspawn in coastal areas and have a relatively short larval period;metamorphosis occurs between 7 and 10 mm standard length(Moser 1996). These species spawn throughout the year,although larval abundance is highest during the winter forCalifornia halibut and diamond turbot, and during the summerfor spotted turbot (Moser 1996). All three make use ofestuaries during the juvenile stage and are considered marinemigrants by Allen et al. (2006).
Our primary objective was to evaluate whether there wasevidence of size-specific movement of individuals among con-tiguous sections of a Pacific coastal estuary over the time scaleof weeks. This was achieved in two ways: (1) examination ofsection-specific length-frequency distributions throughout thesummer of 2004, and (2) estimates of dispersal distancesobtained from recaptured (tagged) individuals. We also exam-ined whether different sections of the estuary were occupied byspecific species or size classes, and if there was a relationshipbetween flatfish abundance and temperature, salinity, anddepth during summer conditions.
Introducción
Muchas especies de peces planos utilizan hábitats costerosdurante sus fases tempranas de desarrollo. Los sistemas estua-rinos suelen ser considerados zonas de crianza importantes(Gibson 1997). Los estuarios son sistemas complejos y diná-micos donde la interacción entre variables bióticas y abióticas,como salinidad, aportes de agua dulce y niveles de oxígenodisuelto, alimento, depredación y reclutamiento influyen sobrela distribución y abundancia de peces juveniles (ver revisión enAble et al. 2005). En consecuencia, los patrones de utilizaciónde hábitat estuarino varían en diversas escalas espaciales ytemporales, así como en función de la ontogenia (Armstrong1997, Howell et al. 1999, Goldberg et al. 2002).
El movimiento de individuos entre hábitats puede influirsobre estimaciones instantáneas de abundancia, crecimiento ymortalidad y, por ende, sobre la valoración de la calidad de unhábitat en particular. El movimiento de los juveniles de pecesmarinos dentro de los sistemas estuarinos puede ocurrir en res-puesta a la disponibilidad de recursos (conocido comoresource-directed dynamics), o como consecuencia de los pro-cesos de inmigración y emigración estuarina (non-resourcemediated migration; sensu Dingle 1996). Por lo tanto, paraentender la función de los sistemas estuarinos como hábitats decrianza para juveniles de peces marinos, y para poder valorardistintos hábitats, es indispensable estudiar el movimiento y lamigración bajo escalas temporales y espaciales cortas(Saucerman y Deegan 1991, Beck et al. 2001, Burrows et al.2004).
Los peces planos son un componente importante de lacomunidad de peces en las zonas costeras y estuarinas delPacífico norteamericano (Allen 1990; Kramer 1990, 1991a;Rosales-Casián 1997; Allen et al. 2006). En este estudio nosenfocamos en el estadio juvenil del lenguado de California(Paralichthys californicus), la platija diamante (Pleuronichthysguttulatus, previamente Hypsopsetta guttulata) y la platijamoteada (Pleuronichthys ritteri). Estas tres especies desovanen aguas costeras y tienen un periodo larvario relativamentecorto. La metamorfosis ocurre entre los 7 y 10 mm de longitudestándar (Moser 1996). Las tres especies desovan todo el año,aunque la abundancia de larvas es mayor en el invierno en elcaso del lenguado de California y la platija diamante, y en elverano en la platija moteada (Moser 1996). Todas usan siste-mas estuarinos durante su fase juvenil y son consideradasmigrantes marinos por Allen et al. (2006).
El objetivo principal de este estudio fue evaluar elmovimiento de juveniles de peces planos en función de la talla.Examinamos secciones contiguas a lo largo de todo un sistemaestuarino en una escala temporal de semanas durante el veranode 2004. Para evaluar el movimiento, empleamos dos estrate-gias complementarias: (1) se determinó la abundancia, distri-bución y frecuencia de tallas de juveniles capturados endiferentes secciones del sistema durante el verano y, simultá-neamente, (2) se estimó la distancia de dispersión de indivi-duos por medio de un estudio de marcaje y recaptura. También

Herzka et al.: Movement of juvenile flatfish in a Pacific estuary
43
Material and methods
Study site
Punta Banda Estuary (31º N, 116º W) is located on thePacific Ocean 100 km south of the US-Mexico border (fig. 1).The estuary has a distinctive L-shaped morphology and is con-nected to a semi-protected coastal bay through a single inlet.The tidal regime is primarily semidiurnal, and the mean andmaximum tidal ranges are 1.04 and 2.5 m, respectively. Theestuary receives limited freshwater inflow and the system func-tions largely as a negative estuary (Pritchard et al. 1978). Achannel 3–8 m in depth runs along the main axis of the estuary;this channel splits into two main arms within the inner estuary(see Ortiz et al. 2003 for a detailed bathymetry of the system).Depths outside the main channels are <2 m. Most of the sub-merged habitat available to flatfish is unvegetated, althoughthere are patches of Zostera marina in the central estuary and
se analizó si la abundancia relativa variaba en función de latalla y la zona del sistema, y si había una relación entre laabundancia de juveniles y la temperatura, salinidad y profundi-dad durante las condiciones más cálidas del año.
Materiales y métodos
Zona de estudio
El Estero de Punta Banda (31° N, 116° O) se encuentra enel Pacífico mexicano, 100 km al sur de la frontera México-Estados Unidos (fig. 1). Tiene forma de L y está conectado conla Bahía de Todos Santos a través de un solo canal en suextremo norte. El régimen de mareas en la zona es principal-mente semidiurno, y los rangos medio y máximo de mareasson de 1.04 y 2.5 m, respectivamente. Por lo general, el Esterode Punta Banda recibe una cantidad limitada de agua dulce, porlo cual se considera un estuario negativo (Pritchard et al.1978). Un canal de profundidad de ca. 8 m cerca de la bocahasta <3 m hacia el interior del sistema se extiende a lo largode su eje principal (ver Ortiz et al. 2003 para una batimetríadetallada). Fuera del canal principal el estero es muy somero ytiene profundidades <2 m. La mayoría del hábitat disponiblepara juveniles de peces planos está libre de vegetación, aunquehay pequeñas praderas de Zostera marina en la zona central delestero y hay marismas que rodean el sistema. El fondo esarenoso cerca de la boca, y limoso hacia el interior del estero(Ortiz et al. 2003).
Abundancia espacial y temporal de peces planos
Para evaluar los patrones de utilización de hábitat en esca-las cortas de tiempo y espacio, el estero se dividió en 5 seccio-nes contiguas (fig. 1). Cada sección tenía una longitud similar alo largo del eje principal. Los censos se llevaron a cabo durantetres periodos de cinco días cada uno durante el verano de 2004:21–23 y 25–26 de junio, 5–9 de julio y 9–13 de agosto. Losmuestreos se hicieron durante la transición entre mareas muer-tas y vivas. Durante junio y julio los arrastres se hicieron entrelas 9 a.m. y 2 p.m. para permitir el marcaje y recaptura de juve-niles por la tarde (n = 4–10 arrastres por día; tabla 1). Por logeneral, el nivel de marea era bajo durante la mañana y másalto por la tarde. En agosto los arrastres se efectuaron a lo largodel día (n = 6–18 por día). Las predicciones de los niveles demareas para las fechas de muestreo se encuentran en http://oceanografia.cicese.mx/predmar/.
Durante cada mes se censó una sola sección del estero pordía. Los arrastres se hicieron a distintas profundidades y endiferentes zonas con el fin de obtener una estimación represen-tativa de los patrones de utilización de hábitat. Sin embargo, enla sección más interna del estero (sección 5), los arrastres sehicieron sólo en el canal principal, ya que la profundidad eramuy somera en otras zonas. Se trató de evitar zonas con vege-tación sumergida durante los arrastres.
Los juveniles fueron capturados con un red de arrastre deprueba o chango camaronero de 7.6 m de ancho y con luz de
Figure 1. Map of Punta Banda Estuary, Baja California, Mexico. Thenumbers indicate the sections used to divide the estuary for samplingpurposes. The gray line indicates the position of the estuary’s mainchannel, with depths of 3–8 m.Figura 1. Mapa del Estero de Punta Banda, Baja California, México. Losnúmeros indican las secciones en que se dividió el estero para fines demuestreo. La línea sólida gris indica la posición del canal principal dentrodel sistema, que tiene una profundidad de 3–8 m.
31°45’ N
116°36’ W
116°36’ W
31°45’ N
0 1.25 2.5km
1
2
3
4
5
Todos Santos Bay
Ensenada0 25 50 100 km
U.S.A
Mexico
33°N
117°W
Study Site
Ciencias Marinas, Vol. 35, No. 1, 2009
44
tidal marshes along the banks. The bottom is sandy towards theinlet and becomes increasingly silty towards the head of theestuary (Ortiz et al. 2003).
Spatial and temporal abundance of flatfish
To evaluate fine-scale spatial and temporal variability inhabitat use, we divided the system into five contiguous sec-tions. Each section was of roughly equal length along the mainaxis of the estuary (fig. 1). Sampling took place during threefive-day sampling periods during the summer of 2004: 21–23and 25–26 June, 5–9 July, and 9–13 August. All samplingintervals occurred during the transition from spring to neaptides. Tows were conducted from 9 a.m. to 2 p.m. during Juneand July to allow for the mark and release of individuals in theafternoon (n = 4–10 tows per day; table 1). Tidal level was usu-ally lowest during the beginning of the sampling and reachedthe lower high tidal level early in the afternoon. In August,
malla de 2.5 cm en el cuerpo y 0.5 cm en el copo (Fodrie yMendoza 2006). Los arrastres se hicieron a 3 km h–1 por 10min, cubriendo una distancia aproximada de 500 m. Se trató demantener una profundidad consistente durante cada arrastre.Con un GPS se registraron las coordenadas correspondientes alinicio y final de cada arrastre y la distancia cubierta. La abun-dancia fue estandarizada a 500 m y se reporta como captura porunidad de esfuerzo (CPUE). Los juveniles se identificaron y semidió su longitud estándar (LE, mm) inmediatamente despuésde cada arrastre. La profundidad y la temperatura superficial seregistraron con un Fishfinder Garmin, y la salinidad superficialse midió con un refractómetro.
Patrones de movimiento de peces juveniles
Se evaluó el movimiento de los juveniles de peces planosempleando dos estrategias complementarias. Primero, seutilizaron los datos obtenidos durante los censos para generar
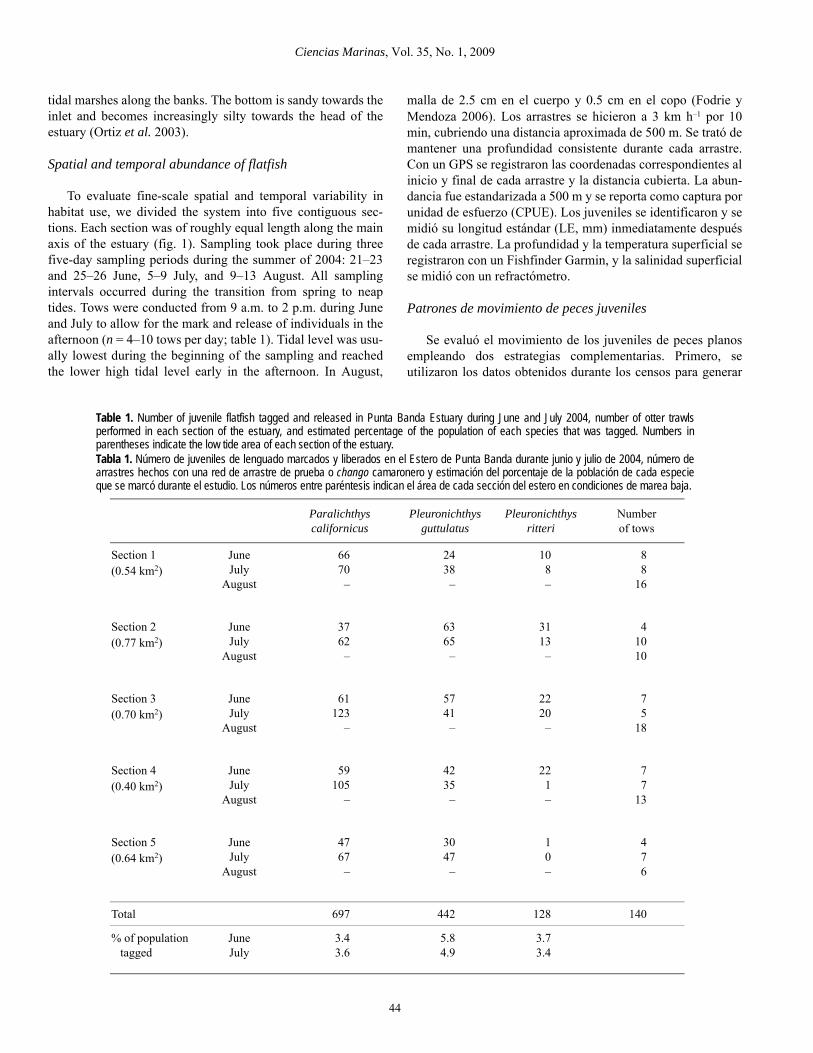
Table 1. Number of juvenile flatfish tagged and released in Punta Banda Estuary during June and July 2004, number of otter trawlsperformed in each section of the estuary, and estimated percentage of the population of each species that was tagged. Numbers inparentheses indicate the low tide area of each section of the estuary.Tabla 1. Número de juveniles de lenguado marcados y liberados en el Estero de Punta Banda durante junio y julio de 2004, número dearrastres hechos con una red de arrastre de prueba o chango camaronero y estimación del porcentaje de la población de cada especieque se marcó durante el estudio. Los números entre paréntesis indican el área de cada sección del estero en condiciones de marea baja.
Paralichthys californicus
Pleuronichthys guttulatus
Pleuronichthys ritteri
Numberof tows
Section 1(0.54 km2)
June July
August
6670–
2438–
108–
88
16
Section 2(0.77 km2)
June July
August
3762–
6365–
3113–
41010
Section 3(0.70 km2)
June July
August
61123
–
5741–
2220–
75
18
Section 4(0.40 km2)
June July
August
59105
–
4235–
221–
77
13
Section 5(0.64 km2)
June July
August
4767–
3047–
10–
476
Total 697 442 128 140
% of population tagged
JuneJuly
3.43.6
5.84.9
3.73.4

Herzka et al.: Movement of juvenile flatfish in a Pacific estuary
45
sampling lasted throughout the day (n = 6–18 per day). Thepredicted tides for all sampling dates can be found at http://oceanografia.cicese.mx/predmar/.
During each five-day period, one day was allocated tosampling in each section. The locations of specific tows werehaphazardly selected in order to sample representative regionsand depths within each section, and hence obtain the best pos-sible estimates of habitat utilization. In the innermost sectionof the estuary, however, sampling was limited to the mainchannels due to very shallow depths elsewhere. An attemptwas made to avoid vegetated habitats during trawling.
Juvenile flatfish were captured using a 7.6-m wide, 9.5-mheadrope length otter trawl with a mesh size of 2.0 and 0.5 cmin the body and cod-end, respectively (Fodrie and Mendoza2006). Ten-minute trawls (approx. 500 m) were conducted at atarget speed of 3 km h–1 while attempting to maintain aconsistent depth. GPS coordinates were recorded at the begin-ning and end of each trawl. The distance covered in each trawlwas recorded. Catches were standardized to the number ofindividuals per 500 m tow and are reported as catch per uniteffort (CPUE). Juvenile flatfish were identified and standardlength (SL) measured to the nearest millimeter following eachtow. Depth and surface temperature were estimated for eachtow using an on-board fish finder, and surface salinity wasmeasured with a refractometer.
Movement patterns of juvenile flatfish
The movement patterns of juvenile flatfish were examinedusing two complimentary approaches. First, we used thesection- and time-specific length frequency distributionsderived from the sampling described above to infer ontogeneticmigration throughout the estuary. Second, an intensive mark-recapture experiment was conducted to track the movements ofindividual fish over the same period.
California halibut, diamond turbot, and spotted turbot juve-niles were tagged with visible implant elastomer (VIE) tags(Northwest Marine Technologies, Seattle, WA, USA) duringthe June and July sampling periods (Griffiths 2002, Malone etal. 1999). Immediately after capture in the trawl, flatfish wereplaced in large ice chests filled with seawater aerated withbattery-powered air pumps. Each day, sampling ceased afterapproximately 150 individuals had been captured to minimizeon-board stress and mortality. Individuals were then removedfrom the ice chests and injected subcutaneously with the elas-tomer material using a hypodermic syringe. Four colors (red,yellow, green, and orange) and three different muscle locations(middle dorsal, posterior dorsal, and ventral middle) on theblind side of the fish were used to assign a unique tag for eachdate and section. Following tagging, fish were kept in a con-tainer filled with seawater for approximately 10 min to recover.They were monitored for ill effects such as abnormal swim-ming or lack of responsiveness to tactile stimuli, which wererarely observed. Individuals that exhibited abnormal behaviorwere not released. At the end of each day, tagged fish were
distribuciones de frecuencias de tallas para cada sección delestero y fecha de muestreo con el fin de inferir patrones demovimiento con respecto a la talla. Por otro lado, se realizó unesfuerzo intensivo de marcaje y recaptura para reconstruir elmovimiento individual de peces durante el mismo periodo detiempo.
Se marcaron juveniles del lenguado de California, la platijadiamante y la platija moteada con bandas elastoméricas visi-bles (Northwest Marine Technologies, Seattle, Washington,EUA) durante los muestreos de junio y julio (Griffiths 2002,Malone et al. 1999). Después de cada arrastre y de medir laLE, los juveniles se colocaron en hieleras llenas de agua demar provistas con aireación. Cada día, los arrastres se dieronpor terminados una vez que fueron capturados unos 150 peces,con el fin de minimizar el estrés y la mortalidad por manipula-ción. Los individuos fueron inyectados con marcas elastomé-ricas de diferentes colores (rojo, amarillo, verde y naranja) demanera subcutánea en diferentes lugares del lado ciego (dorsalmedio, dorsal posterior, ventral medio). Se asignaron fechas ysecciones del estero a combinaciones específicas de lugar deinyección y color. Las marcas se solidifican en 24 h. Luego demarcarlos, los peces se mantuvieron en baldes con aireaciónpara facilitar su recuperación, y se mantuvieron en observacióncon el fin de detectar efectos negativos como natación anormalo falta de respuesta al estímulo táctil, los cuales sólo se obser-varon en un número limitado de individuos que no fueron pos-teriormente liberados. Los demás peces se liberaron a lo largode un transecto perpendicular al canal principal. Los transectosde liberación estaban localizados exactamente al centro decada sección.
Los esfuerzos de recaptura se llevaron a cabo durante julioy agosto utilizando los mismos métodos descritos anterior-mente. Se calculó la distancia entre el transecto de liberación yla zona de recaptura para cada individuo. Las distancias de dis-persión mínima y máxima entre el punto central del transectode liberación y el punto de recaptura se estimaron usando lascoordenadas iniciales y finales del arrastre en el cual se recap-turó cada individuo. Si se recapturaba un individuo durante unarrastre que cruzó el transecto de liberación, se le asignó unadistancia mínima de dispersión de 0 m.
Para evaluar la retención de las marcas y si el proceso demarcaje inducía mortalidad, se mantuvo en observación por 30días en el laboratorio una submuestra de individuos marcados(n = 12) y sin marcar (n = 8) colectados durante el censo dejunio. Se seleccionaron veinte individuos de cada una de lasdos especies más abundantes (lenguado de California y platijadiamante) de manera aleatoria y se transportaron al Departa-mento de Acuacultura del Centro de Investigación Científica yde Educación Superior de Ensenada (CICESE). Los individuosse colocaron en tanques con flujo continuo de agua de mar fil-trada en condiciones de temperatura y salinidad similares a lasdel estero. Los peces se alimentaron con una ración diaria de2–4% de camarones misidáceos congelados (Piscine Energe-tics). Los tanques se limpiaron diariamente y se cuantificó lamortalidad a lo largo del experimento. A los 14 y 30 días de ser

Ciencias Marinas, Vol. 35, No. 1, 2009
46
released along pre-established transects running along themiddle of each sampling section.
Recaptures were attempted during July (June releases) andAugust (June and July releases) using the sampling methodsdescribed above. The distance between the recapture locationand the nearest point along the release transect was calculatedfor each recaptured individual. Minimum and maximum poten-tial distances between the midpoint of the release transect andthe location of recapture were estimated using start and endcoordinates of the recapture trawl. Recaptures during a trawlthat crossed the release transect were assigned a minimum dis-tance of zero.
To evaluate tag retention and tag-induced mortality, asubset of tagged (n = 12) and untagged (n = 8) fish collected inJune was observed for 30 days in the laboratory. Individuals ofeach of the two most abundant species (California halibut anddiamond turbot) were randomly selected and transported to theEnsenada Center for Scientific Research and Higher Education(CICESE). Tanks were supplied with a continuous flow offiltered seawater that mimicked estuarine conditions, and wereinspected and cleaned daily. Mortality was quantified through-out the experiment. Dead fish were removed and examined fortags. Juveniles were fed a daily ration (2–4% body weight) offrozen mysid shrimp (Piscine Energetics), and were inspectedfor presence or absence of tags after 14 and 30 days.
To generate a rough estimate of the percentage of the popu-lation that was tagged and released, we calculated area-basedcatch rates for each section of the estuary. CPUE was con-verted to area-based catch rates using a trawl width of 7.6 m.Digitized aerial photos of the estuary were imported into aGeographic Information System (GIS) database. All GIS dataprocessing and analyses were done using ArcGIS 8.3 (ESRI®),and using the NAD27 coordinate system and Albers equal-areaconic projection. Working with aerial images collected at bothhigh and low tides, we created polygon features to representthe footprint of the estuary at both tidal levels. We used a visualbasic script provided in the ArcMap software to calculate theareas and perimeters for each zone at both high and low tides.The habitat available to juvenile flatfishes during low tidederived in this study agreed with that reported by Pritchard etal. (1978) for Punta Banda Estuary (3.06 vs 3.61 km2, respec-tively). However, Pritchard et al.’s (1978) high-tide estimatesof submerged area were higher than ours (11.63 vs 5.22 km2).While these authors included tidal marshes, we purposefullyexcluded them from the area calculations since they do not pro-vide adequate habitat for juvenile flatfishes (Valle et al. 1999,Desmond et al. 2000). As most of the trawling was performedwhen the tidal level was relatively low (ca 0–75 cm abovemean low water), area-based catch estimates were derivedusing the area of submerged habitat at low tide. Given that fishdensity may vary as a function of tidal level in shallowestuarine systems, our population size approximations mayunderestimate the extent of the true population. The percentageof the population of each species tagged in the entire estuary
transportados al laboratorio, los peces fueron sacados de lostanques y se registró la presencia y ausencia de las marcas.Asimismo, se examinaron los peces que murieron durante elexperimento para ver si tenían marcas.
Con el fin de estimar de manera aproximada el porcentajede la población de cada especie marcada en junio y julio, pri-mero se calculó el número de juveniles por unidad de área paracada sección del estero. La CPUE se transformó en captura porunidad de área utilizando el ancho de la red de arrastre (7.6 m).Se importaron fotos digitalizadas del Estero de Punta Banda auna base de datos utilizando un sistema de información geo-gráfica (SIG). Los datos del SIG se analizaron y procesaronusando ArcGIS 8.3 (ESRI®), usando el sistema cartográficoNAD 27 y la proyección cónica Albers Equal-Area. Se usaronimágenes capturadas en condiciones tanto de marea alta comomarea baja, y se crearon polígonos representativos del períme-tro del sistema en ambas condiciones de marea. Utilizando elprograma ArcMap se calcularon las áreas y perímetros de cadasección del estero. La área de hábitat disponible para los juve-niles de lenguado (i.e., las zonas sumergidas) durante la mareabaja (3.06 km2) es similar a la estimada por Pritchard et al.(1978; 3.61 km2) para el Estero de Punta Banda (tabla 1). Sinembargo, las estimaciones de Pritchard et al. (1978) de lasuperficie cubierta por agua durante la marea alta es mayor quela obtenida en el presente estudio (11.63 vs. 5. 22 km2). Mien-tras que Pritchard et al. (1978) incluyeron las marismas querodean al estero en sus estimaciones, nosotros las excluimosporque no constituyen hábitat adecuado para los juveniles delenguado (Valle et al. 1999, Desmond et al. 2000). Ya que lamayoría de los arrastres se llevaron a cabo en condiciones demarea relativamente baja (0–75 cm por encima del nivel mediode la marea más baja), las estimaciones de la abundancia porunidad de área se hicieron con las áreas correspondientes a lamarea baja. En sistemas estuarinos someros la densidad de losjuveniles puede variar en función del nivel de marea, lo cualimplica que nuestras estimaciones del tamaño poblacional pro-bablemente subestiman el tamaño real de la población. El por-centaje de la población de cada especie que marcamos a lolargo del estero fue calculada como el número de peces marca-dos multiplicada por el área del estero × 100.
Análisis de datos
Para evaluar si existieron diferencias en la CPUE de cadaespecie en función del tiempo y entre secciones del estero seutilizó análisis de varianza (ANOVA) de dos vías. Para evaluarsi los datos cumplían con los supuestos de normalidad y homo-geneidad de varianza se emplearon las pruebas de AndersonDarling y Bartlett. Cuando fue necesario se empleó una trans-formación log (x + 1) antes de aplicar los ANOVA. Las distri-buciones de frecuencias de tallas generadas para distintosperiodos de muestreo y secciones del estero se analizaron conpruebas de chi-cuadradas utilizando las siguientes clases detallas: 21–60, 61–100, 101–140, 141–180, 181–200 y >200mm de LE.

Herzka et al.: Movement of juvenile flatfish in a Pacific estuary
47
was estimated by dividing the number of fish tagged by thearea of the estuary × 100.
Data analysis
Analysis of variance (ANOVA) was performed on CPUEdata for each species to test for differences between samplingintervals and sections of the estuary. The Anderson-Darlingand Bartlett tests were used to determine whether CPUE datacomplied with the assumptions of normality and homogeneityof variance. When necessary, a log(x + 1) transformation wasperformed prior to ANOVA. Length-frequency data wereanalyzed using chi-squared tests to determine if there weredifferences in species-specific length-frequency distributionsamong sections within the estuary and among sampling inter-vals. The following size classes were used for chi-squaredanalyses: 21–60, 61–100, 101–140, 141–180, 181–220, and>220 mm SL.
Backward stepwise multiple regression analysis (F-to-remove = 1) was used to examine the relationship between theCPUE of the two most abundant species (California halibutand diamond turbot) and temperature, salinity, and depth. Wechecked for collinearity among abiotic variables using correla-tion analysis, and found none were highly correlated with eachother (r ≤ 0.33). The data for June, July, and August werepooled for analysis. CPUEs were log(x + 1)-transformed.Abiotic parameters deviated only slightly from normality and,therefore, were not transformed.
Results
Spatial and temporal patterns of habitat use within Punta Banda Estuary
A total of 2352 individuals belonging to four species werecaptured during 140 tows. The catch was dominated byCalifornia halibut (62% of the total) and diamond turbot(32%), which were present in every section of the estuary dur-ing all three sampling periods (fig. 2). The CPUE of Californiahalibut and diamond turbot varied significantly among sam-pling periods (F2, 125 = 5.99, P = 0.005, and F2, 125 = 5.87, P =0.002, respectively) and sections of the estuary (F4, 125 = 3.94,P = 0.005, and F4, 125 = 4.57, P = 0.002, respectively); the inter-actions between fixed factors were not significant (P > 0.05).
Although California halibut had a broad range of lengths(24–480 mm SL), 91% of individuals were less than 200 mmSL. Rosales-Casián (2004) performed otolith ageing of juve-nile California halibut captured in the region and estimated thatindividuals ≤180 mm SL are young-of-the-year. Hence, mostof the fish we caught were less than one year of age. Thelength-frequency distributions of California halibut capturedthroughout the estuary in June, July, and August differed sig-nificantly (χ2 = 60.2, d.f. = 10, P < 0.001; fig. 3). In June, therewas a bimodal (possibly multimodal) length-frequency distri-bution with a primary peak between 40 and 70 mm SL and asecondary peak between 140 and 170 mm SL. In contrast, in
La relación entre las CPUEs de las dos especies más abun-dantes y la temperatura, salinidad y profundidad se evaluó conun análisis de regresión múltiple. El análisis de corrió haciaatrás (step-wise backward), eliminando las variables con F < 1.Se evaluó el nivel de correlación entre variables predictivas(colinealidad), y se encontró que en ningún caso había unacorrelación importante (r ≤ 0.33) Para los análisis de regresiónmúltiple se agruparon los datos de junio, julio y agosto. Dadoque los valores de las variables de predicción sólo exhibieronpequeñas desviaciones de la normalidad, éstas no fueron trans-formadas.
Resultados
Patrones espaciales y temporales en la utilización del hábitat en el Estero de Punta Banda
Se capturaron un total de 2352 lenguados juveniles decuatro especies durante los 140 arrastres. El lenguado deCalifornia fue la especie más abundante (62% del total),seguida por la platija diamante (32%). Ambas especies fueroncapturas en todas las secciones del estero durante los tresperiodos de muestreo (fig. 2). Las CPUEs del lenguado deCalifornia y la platija diamante variaron significativamenteentre meses (F2, 125 = 5.99, P = 0.005 y F2, 125 = 5.87, P = 0.002,respectivamente) y zonas de muestreo (F4, 125 = 3.94, P = 0.005y F4, 125 = 4.57, P = 0.002, respectivamente); la interacciónentre el tiempo y las secciones del estero no fue significativa enambos casos (P > 0.05).
Aunque se capturaron lenguados de California dentro de unamplio intervalo de tallas (24–480 mm LE), 91% tenían tallas<200 mm LE. Con base en un estudio de la formación de ani-llos diarios en los otolitos del lenguado de California, Rosales-Casián (2004) estimó que los individuos con tallas <180 mmLE tienen menos de un año de edad. Por lo tanto, la mayoría delos lenguados de California capturados en este estudio teníanmenos de un año. Las distribuciones de frecuencias de tallas delos lenguados de California capturados en el estero en junio,julio y agosto presentaron diferencias significativas (χ2 = 60.2,g.l. = 10, P < 0.001; fig. 3). Durante junio se observó una dis-tribución bimodal (posiblemente multimodal), con un picoprincipal de 40–70 mm LE y uno secundario de 140–170 mmLE. En contraste, las distribuciones de julio y agosto fueronunimodales (40–80 mm LE en julio y 40–100 LE en agosto).En junio 64% de los lenguados de California tuvieron tallas<140 mm LE, mientras que en agosto estas tallas representaron82% de la captura.
El análisis de chi-cuadrada indicó diferencias significativasen la distribución de frecuencia de tallas de los lenguados deCalifornia capturados en las distintas secciones del estero cadames (χ2 = 142, 74.6 y 63.8, para junio, julio y agosto, respecti-vamente, P < 0.001 en todos los casos, g.l. = 4). Cerca de laboca del estero se observó un amplio intervalo de tallas, aun-que los individuos >100 mm LE fueron relativamente másabundantes. También se registraron individuos con tallas >100mm LE en la sección 2. En contraste, en la parte central del

Ciencias Marinas, Vol. 35, No. 1, 2009
48
both July and August the length-frequency distributions wereunimodal (40–80 mm SL in July and 40–100 mm SL inAugust). In June, 64% of California halibut were ≤140 mm SL,but by August they accounted for 82% of all individuals.
Chi-squared analyses indicated significant differencesbetween the length-frequency distributions of Californiahalibut in the different sections of the estuary during all months(χ2 = 142, 74.6, and 63.8 for June, July, and August, respec-tively, P < 0.001 in all cases, d.f. = 4). Close to the mouth ofthe estuary, a broad size range was found, although individuals>100 mm SL were more abundant. Individuals >100 mm SLwere also dominant in section 2. In contrast, individuals<100 mm SL exhibited a higher CPUE in the middle of theestuary (sections 3 and 4), while in the innermost section of theestuary there was a bimodal length distribution, with a largepeak of individuals between 40 and 80 mm SL and a secondsmaller peak of individuals between 170 and 190 mm SL.
Diamond turbot ranged from 44 to 234 mm SL. Most(86%) of the individuals captured were between 100 and200 mm SL. The monthly length-frequency distributionsof diamond turbot captured in the entire estuary differedsignificantly from each other (χ2 = 219, d.f. = 12, P < 0.001).For June and July, bimodal length-frequency distributions sug-gested two cohorts were present in the estuary, while in Augusta unimodal length-frequency distribution indicated only thatsmaller fish (120–140 mm SL) were still present (fig. 4).
estero (secciones 3 y 4) predominaron los juveniles <100 mmLE, y en la zona interna la distribución fue bimodal con picosentre 40–80 y 170–190 mm LE.
El rango de tallas de la platija diamante fue de 44 a 234 mmLE; la mayoría (86%) midió entre 100 y 200 mm LE. Las dis-tribuciones de frecuencias de tallas correspondientes a los dife-rentes meses de muestreo fueron significativamente diferentes(χ2 = 219, g.l. = 12, P < 0.001). En junio y julio la presencia deuna distribución bimodal de tallas sugiere la presencia de doscohortes en el estero, mientras que en agosto sólo estuvieronpresentes los peces más pequeños (120–140 mm LE; fig. 4).
El rango de tallas de los juveniles de la platija moteada fuemás limitado que el de las otras dos especies (100–198 mmLE), y el pico de abundancia relativa estuvo entre 121 y 150mm. La mayoría de las capturas ocurrieron en la parte centraldel estero durante junio y en menor grado durante julio (fig. 2).Esta especie no se encontró presente en el estero en agosto.Durante todos los censos sólo se capturaron 15 lenguascalifornianas (Symphurus atricaudus, 0.06% de la capturatotal) con tallas de 97 a 122 mm de longitud total. Como estasdos últimas especies fueron capturadas en poca abundancia nose hicieron análisis estadísticos para evaluar su CPUE ni distri-buciones de frecuencias de tallas.
Relación entre CPUE y parámetros abióticos
El promedio menor de temperaturas ocurrió en junio (21.8± 0.3ºC, promedio ± error estándar) y el mayor en agosto (23.4± 0.2ºC). A lo largo del estero las menores temperaturas seregistraron cerca de la boca (21.1 ± 0.2ºC), y las mayores en lasección interna (24.8 ± 0.1ºC). La salinidad varió entre 33.0cerca de la boca y 39.5 hacia el interior del estero. Las dosespecies de lenguado más abundantes en el estero, el lenguadode California y la platija diamante, se capturaron en un ampliointervalo de temperaturas y salinidades (20–26ºC, 33.0–39.5;fig. 5). El análisis de regresión múltiple indicó para ambasespecies una relación significativa entre CPUE y parámetrosabióticos (F2, 142 = 38.44, P < 0.001 para el lenguado deCalifornia y F1, 143 = 40.45, P < 0.001 para la platija diamante).Para el lenguado de California, la CPUE tuvo una mayor rela-ción con la profundidad que la temperatura (coeficientes βestandarizados = –0.617 vs –0.101, respectivamente); la salini-dad quedó excluida del modelo al no contribuir explicación.Para la platija diamante se encontró una relación inversa de laCPUE con la profundidad de los arrastres, y una ausencia derelación lineal con la temperatura y la salinidad. Ambos mode-los explicaron sólo una proporción baja de la varianza en laCPUE (r2 = 0.35 y 0.22 para el lenguado de California y la pla-tija diamante, respectivamente).
Patrones de movimiento de los peces planos con base a los resultados del marcaje y recaptura
Se marcaron y liberaron un total de 1327 lenguados (697lenguados de California, 442 platijas diamante y 128 platijas
Figure 2. Average catch per unit effort (CPUE ± SE, individuals per 500 mtrawl) of the three most abundant flatfish species captured in each section ofPunta Banda Estuary in June, July, and August 2004. Figura 2. Promedio de captura por unidad de esfuerzo (CPUE ± EE,individuos por arrastre de 500 m) de las tres especies de lenguados másabundantes capturas dentro del Estero de Punta Banda en junio, julio yagosto del 2004.
June 2004
01020304050
California halibutDiamond turbotSpotted turbot
July 2004
01020304050
August 2004
Section1 2 3 4 5
01020304050CP
UE (in
dividu
als pe
r 500
m to
w)

Herzka et al.: Movement of juvenile flatfish in a Pacific estuary
49
Spotted turbot exhibited a more restricted distribution thanCalifornia halibut and diamond turbot. Most were capturedtoward the middle of the estuary during June and to a lesserextent July (fig. 2); none were captured in August. Sizesranged from 100 to 198 mm SL (peak abundance between 121and 150 mm SL). California tonguefish were the least abun-dant flatfish in the estuary; only 15 individuals (0.06% of thetotal) ranging from 97 to 122 mm total length were collected.
moteadas; tabla 1). El número de individuos liberados en cadasección del estero fue de 37–123 (promedio = 69.7) para el len-guado de California, 24–65 (promedio = 44.2) para la platijadiamante y 0–31 (promedio = 12.8) para la platija moteada.Con base en las estimaciones del área de cada sección delestero y el tamaño de la población de cada especie, estimamosque logramos marcar entre 3% y 6% de la población de cadaespecie durante junio y julio (tabla 1).
Figure 3. Length-frequency histograms of California halibut (Paralichthys californicus) captured in Punta Banda Estuary during the summer of 2004.Figura 3. Distribuciones de frecuencias de tallas del lenguado de California (Paralichthys californicus) capturado en el Estero de Punta Bandadurante el verano de 2004.
Section 1
05
1015202530
July AugustJunen= 75 n = 180n= 89
Section 2
05
1015202530
n= 35 n= 106n= 72
Section 3
05
1015202530
n= 97 n= 190n = 147
Section 4
05
1015202530
n= 83 n= 100n= 125
Section 5
05
1015202530
n= 39 n= 100n= 69
Overall
0 100 200 300 400 50005
1015202530
Standard Length (mm)0 100 200 300 400 500 0 100 200 300 400 500
n= 329 n= 616n= 502
Perce
nt re
lative
freq
uenc
y

Ciencias Marinas, Vol. 35, No. 1, 2009
50
Because the spotted turbot and California tonguefish were cap-tured in low numbers, statistical analyses for differences inhabitats and size frequencies were not performed.
Relationship between CPUE and abiotic parameters
Mean water temperature was lowest in June (21.8 ± 0.3ºC,mean ± SE) and highest in August (23.4 ± 0.2ºC). The average
Se recapturaron cuatro lenguados de California y dosplatijas diamante durante julio y agosto, representando unatasa de recaptura de 0.57% y 0.45% para cada especie, res-pectivamente. Una evaluación visual de los juveniles re-capturados indicó que los peces estaban en buenas condiciones.No se recapturaron platijas moteadas. Las distancias de disper-sión mínima y máxima variaron entre 0 y <700 m (tabla 2).
Figure 4. Length-frequency histograms of diamond turbot (Pleuronichthys guttulatus) captured in Punta Banda Estuary during the summer of 2004.Figura 4. Distribuciones de frecuencias de tallas de la platija diamante (Pleuronichthys guttulatus) capturado en el Estero de Punta Banda duranteel verano de 2004.
Section 1
0
10
20
30
40
50July AugustJune
n= 21 n= 30n= 36
Section 2
0
10
20
30
40
50n= 32 n= 100n= 69
Section 3
0
10
20
30
40
50n= 56 n= 125n= 61
Section 4
0
10
20
30
40
50n= 45 n= 56n= 34
Section 5
0
10
20
30
40
50n= 24 n= 18n= 46
Overall
0 50 100 150 200 2500
10
20
30
40
50
Standard length (mm)0 50 100 150 200 250 0 50 100 150 200 250
n = 178 n= 329n= 246
Perce
nt re
lative
freq
uenc
y

Herzka et al.: Movement of juvenile flatfish in a Pacific estuary
51
water temperature was lowest near the mouth (21.1 ± 0.2ºC)and increased towards the head of the estuary (24.8 ± 0.1ºC).The salinity in the estuary ranged from 33.0 to 39.5. It waslowest near the mouth and highest in the innermost reaches ofthe estuary. The two most abundant species, California halibutand diamond turbot, were captured over a broad range oftemperatures and salinities (20–26ºC and 33.0–39.5; fig. 5).Multiple regression analysis indicated a significant relationshipbetween abiotic parameters and CPUE of both species (F2, 142 =38.44, P < 0.001 for California halibut, and F1, 143 = 40.45, P <0.001 for diamond turbot). For California halibut, depth exhib-ited a greater influence on CPUE than temperature (standard-ized coefficient β = –0.617 vs –0.101, respectively), andsalinity was dropped from the model since it did not contributeexplanatory power. For diamond turbot, only depth remainedin the model, indicating the absence of a linear relationshipbetween either temperature or salinity and CPUE. For bothspecies, multiple r2 values indicated that the models explaineda low proportion of the variance (multiple r2 = 0.35 and 0.22for California halibut and diamond turbot, respectively.
Movement patterns of flatfish based on mark-recapture results
A total of 1327 flatfish were tagged and released (697 Cali-fornia halibut, 442 diamond turbot, and 128 spotted turbot;table 1). The number of tagged individuals released in eachsection of the estuary on a single day was 37–123 Californiahalibut (mean 69.7 individuals), 24–65 diamond turbot (mean44.2), and 0–31 spotted turbot (mean 12.8). Based on the areaof each section of the estuary and the estimated populationsize, we tagged between 3% and 6% of the total population ofthe three flatfish species during June and July (table 1).
Four California halibut and two diamond turbot wererecaptured in July and August (table 2), representing recapturerates of 0.57% and 0.45%, respectively. Visual examinationindicated that the recaptured fish appeared to be in good condi-tion. All were recaptured in the same section of the estuary inwhich they were tagged and released. No spotted turbot wererecaptured. The minimum and maximum potential distancestraveled by individuals ranged from 0 m (i.e., they were caughtwithin a trawl that crossed the release transect) to <700 m(table 2).
Of the 20 California halibut brought to the laboratory (12tagged, 8 untagged), only 14 remained after 30 days. One deadfish was removed from the tanks and another five weredocumented as missing before the first inspection on day 14.None of the missing fish were found on the floor surroundingthe tanks, and hence we suspect that cannibalism occurred.After both 14 and 30 days, 9 of the remaining 14 fish had tags.Chi-squared goodness of fit tests indicated that there were nosignificant differences between the number of California hali-but that had tags and the expected numbers of tagged fish after14 days (χ2 = 0.1, d.f. = 1, P > 0.05) and 30 days (χ2 = 0.1,d.f. = 1, P > 0.05). If cannibalism occurred, it resulted in themortality of both tagged and control fish.
De los 20 lenguados de California que fueron transportadosal laboratorio (12 marcados y 8 sin marcar), sólo 14 sobrevi-vieron a los 30 días. Durante la revisión a los 14 días, un pez seretiró muerto de un tanque y los otros cinco se registraroncomo ausentes. No se encontraron peces muertos alrededor delos tanques, por lo que se cree que hubo canibalismo. A los 14y 30 días, 9 de los 14 peces tenían marcas. Los análisis de chi-cuadrada indicaron que no hubo diferencias entre la proporciónde peces marcados al inicio y a los 14 y 30 días del experi-mento (χ2 = 0.1, g.l. = 1, P > 0.05 y χ2 = 0.1, g.l. = 1, P > 0.05).Si hubo canibalismo, éste llevó a la mortalidad tanto de indivi-duos marcados como no marcados.
En el caso de la platija diamante, 17 de los 20 juvenilestransportados al laboratorio sobrevivieron a los 30 días. Uno seencontró muerto antes de cumplirse los primeros 14 díasdel experimento, y dos murieron después (uno con marca yotro sin marca). Un individuo perdió la marca. A los 14 días,11 de los 19 peces tenían marcas, y a los 30 días, 9 de los 17restantes tenían marcas. Los resultados de la prueba de chicuadrada indicó que no hubo diferencias significativas entre laproporción de individuos marcados a los 14 y 30 días delexperimento (χ2 = 0.035, g.l. = 1, P > 0.05 y χ2 = 0.353, g.l. = 1,P > 0.05, respectivamente). Por lo tanto, los resultados dellaboratorio sugieren la ausencia de pérdidas sustanciales de lasmarcas elastoméricas empleadas en el campo.
Discusión
Movimiento de lenguados en el Estero de Punta Banda
En este estudio se documentó el movimiento de juvenilesen dos escalas espaciales: cientos de metros (por medio de larecaptura de individuos marcados) y varios kilómetros (aso-ciado al proceso de emigración estuarina). Según la taxonomíadel movimiento propuesta por Dingle (1996), los patrones demovimiento cortos probablemente reflejan la búsqueda derecursos dentro del home range, o el área dentro de la cual semueve un organismo en búsqueda de los recursos necesariospara su supervivencia y reproducción. En contraste, la emigra-ción estuarina no ocurre en respuesta a la disponibilidad derecursos, sino que es parte de una estrategia que involucra lautilización de diversos hábitats a lo largo del ciclo de vida. Porlo tanto, es indispensable interpretar los estudios de movi-miento y migración de lenguados y otras especies con estrate-gias similares dentro del contexto de fases particulares de ciclode vida.
Los resultados del estudio de marcaje y recaptura sugierenque, en una escala de tiempo de semanas, una proporción de lapoblación local del lenguado de California y la platija diamantede 120–160 mm LE exhibe un comportamiento de residenciaen la misma zona del estero. Al mismo tiempo, no se recaptura-ron juveniles que se habían desplazado entre secciones delestero. Sin embargo, entre junio y agosto hubo una disminu-ción en la abundancia relativa de lenguados de California yplatijas diamante de tallas >140 mm LE, lo cual probablemente

Ciencias Marinas, Vol. 35, No. 1, 2009
52
Of the 20 diamond turbot included in the experiment, 17survived after 30 days. One diamond turbot with a tag diedduring the first 14 days, and an additional two (one tagged andone control fish) died shortly after the first inspection. Oneindividual later lost its tag. After 14 days, 11 of the 19 fish hadtags and after 30 days, 9 of the remaining 17 fish had tags. Achi-squared goodness of fit test indicated that the differencebetween the number of tagged diamond turbot after 14 and30 days was not significantly different to the expected numberof tagged fish remaining (χ2 = 0.035, d.f. = 1, P > 0.05, and χ2 =
refleja la emigración estuarina. Es posible que la mortalidadselectiva de las tallas más grandes haya contribuido a la dismi-nución de la abundancia relativa de la CPUE. Sin embargo,estudios previos sobre el lenguado de California indican quelos residentes de sistemas estuarinos tienen tallas <200 mmLE, y que la emigración estuarina ocurre a partir de los 140mm (e.g., Haaker 1975, Allen y Herbinson 1990, Hammann yRamírez-González 1990). Nuestros resultados concuerdan conlas tallas correspondientes a la emigración estuarina reportadapor otros autores. Por lo tanto, es probable que hayamos
Figure 5. Catch per unit effort (CPUE, individuals per 500 m trawl) of California halibut (left panels) and diamond turbot (right panels)vs abiotic parameters measured in Punta Banda Estuary during the summer of 2004.Figure 5. Captura por unidad de esfuerzo (CPUE, individuos por arrastre de 500 m) de lenguado de California (paneles izquierdos)y platija diamante (paneles derechos) vs. parámetros abióticos en el Estero de Punta Banda durante el verano de 2004.
o18 20 22 24 26 280
10
20
30
40
50
60
70
Temperature (°C)18 20 22 24 26 28
0
10
20
30
40
50
60
70
JuneJulyAugust
Depth (m)0 1 2 3 4 5 6 7 8
0
10
20
30
40
50
60
70
Depth (m)0 1 2 3 4 5 6 7 8
0
10
20
30
40
50
60
70
Salinity (‰)32 33 34 35 36 37 38 39 40
0
10
20
30
40
50
60
70
Salinity (‰)32 33 34 35 36 37 38 39 40
0
10
20
30
40
50
60
70
Temperature (°C)
CPUE
(indiv
iduals
per 5
00m
tow)

Herzka et al.: Movement of juvenile flatfish in a Pacific estuary
53
0.353, d.f. = 1, P > 0.05, respectively). Therefore, laboratoryresults indicate no substantial tag loss within the 30-dayperiod.
Discussion
Short-term movement of flatfish in Punta Banda Estuary
The movement of juvenile flatfish was documented at twospatial scales: hundreds of meters (fish recaptured close to theirrelease location within the estuary) and several kilometers(movement related to the process of estuarine emigration).Based on Dingle’s (1996) taxonomy of movement behaviors,the smaller-scale movement patterns probably reflect resource-related home-ranging behavior. In contrast, estuarine emigra-tion does not occur in response to local resource availability,but is part of a life history strategy that allows exploitation ofdifferent habitats. Hence, studies of movement and migrationpatterns of flatfish and other similar species must be performedand interpreted within the framework of specific stages of thelife cycle.
The results of the mark-recapture study suggest that on thetime scale of weeks, some fraction of the California halibut anddiamond turbot populations in the 120–160 mm SL size rangeremained within the same region of the estuary. Correspond-ingly, we did not recapture tagged individuals that had movedamong sections of the estuary. Between June and August therewas a decrease in the relative abundance of individuals>140 mm SL coupled with a decrease in CPUE, which likelyreflects emigration from the estuary during our study. How-ever, size-selective mortality may also have contributed to theobserved decrease in the CPUE of larger individuals. Califor-nia halibut estuarine residents are mostly <200 mm SL andemigration appears to start at around 140 mm SL (Haaker1975, Allen and Herbinson 1990). Our findings are thus inagreement with previous reports (Haaker 1975, Allen andHerbinson 1990, Hammann and Ramírez-González 1990)regarding size at estuarine emigration (>140 mm SL) for
observado residencia dentro del home range y emigraciónestuarina de manera simultánea.
Otros estudios de marcaje y recaptura en lenguados hanindicado un nivel limitado de movimiento. Haaker (1975)encontró que 85% de los juveniles del lenguado de Californiamarcados dentro de la Bahía de Anaheim, en California, EUA,fueron capturados cerca de la localidad de su liberación. Losadultos de esta especie tampoco parecen moverse distanciaslargas (Tupen 1990, Domeier y Chun 1995, Posner yLavenberg 1999). Algunos estudios de marcaje sobre loslenguados Pseudopleuronectes americanus y Pleuronectesplatessa también indican movimientos de cientos de metros(Saucerman y Deegan 1991, Burrows et al. 2004).
Es importante considerar que, dado el bajo número derecapturas que logramos a pesar de nuestro esfuerzo intensivo,es imposible llegar a conclusiones robustas sobre los patronesde movimiento de lenguados individuales en función de sutalla. Sin embargo, Fodrie y Herzka (2008) utilizaron micro-química de otolitos para reconstruir los patrones de movi-miento de lenguados de California juveniles en el Estero dePunta Banda y la Bahía de Todos Santos, y encontraron quemientras que una fracción (43% de individuos) de la poblaciónde juveniles se mantuvo en la misma zona general del esteropor periodos de dos meses, otra fracción se movió entre zonas(57% de individuos). Con base en nuestros resultados y los deFodrie y Herzka (2008), algunos individuos se comportancomo residentes, mientras que otros emigran del estero comoparte del ciclo de vida y/o en respuesta a condiciones ambien-tales.
Las dos platijas diamante fueron recapturadas cerca de suzona de liberación, lo cual es consistente con los resultados delestudio de marcaje y recaptura hecho con esta especie por Lane(1975). Las distribuciones de frecuencias de tallas de la platijadiamante a lo largo del estero y la CPUE también sonconsistentes con la emigración estuarina. Durante junio, ladistribución fue bimodal (ca 90–140 y 170–230 mm LE),mientras que para agosto sólo las tallas más pequeñas secapturaron dentro del estero y la CPUE disminuyó. Además,
Table 2. Individual flatfish recaptured in Punta Banda Estuary during July and August 2004. Time refers to the number of days elapsed between release andrecapture. Maximum and minimum distances that individuals moved were calculated based on the initial and final coordinates of the trawl in which recapturesoccurred and the midpoint of the release transect.Tabla 2. Juveniles de lenguado recapturados en el Estero de Punta Banda durante julio y agosto de 2004. El tiempo se refiere al número de días transcurridoentre la liberación y recaptura. Las distancias máximas y mínimas de dispersión se calcularon con base en las coordenadas iniciales y finales del arrastre enque se recapturó y el punto medio del transecto de liberación.
Standard length(mm)
Time(days)
Releasesection
Recapturesection
Min. distancemoved (m)
Max. distance moved (m)
Paralichthys californicus
123140141165
14481313
2454
2454
3840
34887
692326676238
Pleuronichthys guttulatus
121132
1335
54
54
348175
676499

Ciencias Marinas, Vol. 35, No. 1, 2009
54
California halibut. We therefore observed evidence of both res-idency and movement out of Punta Banda Estuary.
Other tagging studies have reported limited movement ofCalifornia halibut and other flatfish. Haaker (1975) found littlemovement of tagged juvenile California halibut in AnaheimBay (California); 85% of individuals were recaptured near thestation where they had been released. Likewise, adults do notappear to move large distances (Tupen 1990, Domeier andChun 1995, Posner and Lavenberg 1999). Tagging studies ofage zero winter flounder (Pseudopleuronectes americanus) andplaice (Pleuronectes platessa) also indicated limited displace-ment on the scale of a few hundred meters (Saucerman andDeegan 1991, Burrows et al. 2004). Despite our intensive sam-pling, the low recapture rates we obtained for California hali-but and diamond turbot makes it impossible to draw broadconclusions regarding the movement of individual fishes ofdifferent sizes. However, Fodrie and Herzka (2008) used oto-lith microchemistry to reconstruct movement of juvenile Cali-fornia halibut in the Punta Banda Estuary and Todos SantosBay system, and found that while a fraction of the population(43% of individuals) remained in the same general area on thetime scale of two months, others (57% of individuals) movedsubstantially (i.e., among sections). Based on our data and theresults of Fodrie and Herzka (2008), some individuals exhibitresident behavior, while others move throughout the systemand/or emigrate from the estuary in response to ontogeneticmigration patterns and/or in response to environmentalconditions.
Like California halibut, diamond turbot were recapturedclose to their release location. This is consistent with previoustagging studies by Lane (1975). The estuary-wide length-frequency distributions of diamond turbot also suggestedestuarine emigration of larger individuals. In June, there was adistinct bimodal length-frequency distribution (ca 90–140 and170–230 mm SL). By August, only smaller individualsremained in the estuary and CPUE was generally lower. More-over, the length-frequency distributions for the different sec-tions of the estuary appear to show the progressive movementby the cohort of larger diamond turbot towards the mouth ofthe estuary over time. Little is known regarding the size atwhich estuarine emigration occurs in diamond turbot, but ourdata suggest that emigration takes place at around 150 mm SL(fig. 4). Spotted turbot abundance decreased drasticallybetween June and July, and by August this species was absentfrom Punta Banda Estuary. Given that the sizes caught in theestuary ranged from 100 to 200 mm SL, and that size at matu-rity is about 150 mm (Love 1996), it is likely that individualsof this species emigrate from estuaries following maturation.
It appears that in all three species estuarine emigrationtakes place during the summer months. For California halibut,this agrees with the findings of Haaker (1975), who docu-mented a sudden decrease in abundance of larger juvenilesfrom one month to the next (April–May) in Anaheim Bay thatwas attributed to estuarine emigration. López-Rasgado (2006)also observed a decrease in the abundance of larger juveniles
las distribuciones de frecuencias de tallas correspondientes adiferentes secciones del estero parecen indicar el movimientoprogresivo de los juveniles más grandes hacia la boca. No hayinformación sobre las tallas de emigración estuarina de la pla-tija diamante, pero nuestros datos sugieren que esta inicia a ca150 mm LE (fig. 4). La CPUE de la platija moteada disminuyódrásticamente entre junio y julio, y para agosto no habían juve-niles dentro del estero. Dado que las tallas capturadas dentrodel estero estaban entre 100 y 200 mm LE, y que la talla demadurez sexual es de 150 mm (Love 1996), es probable queesta especie emigre de los sistemas estuarinos luego de alcan-zar la madurez reproductiva.
Al parecer, en las tres especies más abundantes que captu-ramos hay emigración estuarina durante los meses de verano.Para el lenguado de California, esto concuerda con los resulta-dos de Haaker (1975), quien documentó una disminuciónrepentina en la abundancia de juveniles de un mes a otro (abrila mayo) en la Bahía de Anaheim, la cual atribuyó a emigraciónestuarina. López-Rasgado (2006) también observó una dismi-nución en la abundancia de los juveniles más grandes de estaespecie durante el verano en el Estero de Punta Banda en unestudio de un año. Tanto en este estudio como en aquel, la emi-gración coincidió con las temperaturas más altas registradasdentro del estero. En este estudio la temperatura media en lazonas centrales e internas del estero se incrementó entre junio yagosto (21.4ºC vs 24.1ºC en la sección 3, 23.6ºC vs 24.6ºC enla sección 4 y 24.4ºC vs 25.0ºC en la sección 5). Es posible quela temperatura tenga un papel importante como detonador delproceso de emigración estuarina en el lenguado de California,así como en las platijas diamante y moteada.
Evaluación del estudio de marcaje y recaptura
La tasa de recaptura que se logró en este estudio para el len-guado de California (0.57%) es más baja que la reportada porHaaker (1975; 4.6–8.8% usando distintos tipos de marcas) parajuveniles. Nuestras recapturas también fueron más bajas quelas reportadas para adultos de esta especie (Domeier y Chun1995, Posner y Lavenberg 1999). Esto puede deberse a diferen-cias en las estrategias de recaptura, incluyendo periodos derecaptura más largos utilizados en otros estudios y niveles deesfuerzo más altos de recaptura. Según nuestras estimaciones,sólo marcamos entre 3% y 6% de la población de cada especieen un mes dado. La mortalidad de los juveniles en función a latalla (Sogard 1997) y la emigración estuarina también pudohaber contribuido a la baja tasa de recaptura. Otra posibilidades que el método de marcaje haya causado mortalidad excesivao pérdida de las marcas que conlleve a bajas tasas de recaptura.Sin embargo, la evaluación de la retención de marcas en condi-ciones de laboratorio sugiere que ni la mortalidad ni la pérdidade marcas fueron excesivamente altas. Las marcas elastoméri-cas han sido usadas con éxito en otros estudios con especies depeces marinos, como Girella elevate (Griffiths 2002), Gobio-morphus cotidanus (Goldsmith et al. 2003), Cryphopterusglaucofraenum (Malone et al. 1999) y Gadus morhua (Olsen et

Herzka et al.: Movement of juvenile flatfish in a Pacific estuary
55
during the summer in Punta Banda Estuary during a year-longsurvey, which was coincident with the onset of higher tem-peratures during the summer months. In this study, averagetemperature in the central and innermost sections of the estuaryincreased between June and August (21.4ºC vs 24.1ºC in sec-tion 3, 23.6ºC vs 24.6ºC in section 4, and 24.4ºC vs 25ºC insection 5). Hence, it is possible that temperature plays animportant role in triggering estuarine emigration in Californiahalibut, as well as in diamond turbot and spotted turbot.
Evaluation of the mark-recapture experiment
The recapture rate for California halibut (0.57%) is notablylower than that reported by Haaker (1975; 8.8% and 4.6%using spaghetti clips and fin tagging, respectively), who con-ducted a similar study in Anaheim Bay. Our estimates are alsolower than the recapture rates of studies performed on adults(Domeier and Chun 1995, Posner and Lavenberg 1999). Thehigher recapture rates obtained by other researchers may berelated to differences in the sampling strategies employed torecapture tagged fish, including longer recapture periods and amore intensive recapture effort. In addition, we were only ableto tag 3–6% of the population of each species during each sam-pling period. The size-selective mortality of juveniles (Sogard1997) and the emigration of individuals out of the system mayhave also contributed to low recapture rates. One otherpossibility is that the tagging method used in this study wasresponsible for the low recaptures; however, the laboratoryevaluation of the elastomer tags indicated that neither tag lossnor tag-induced mortality were substantial. VIE tags have alsobeen used successfully in tagging studies involving blackdrummer (Girella elevate, Griffiths 2002), common bully(Gobiomorphus cotidanus, Goldsmith et al. 2003), bridledgoby (Cryphopterus glaucofraenum, Malone et al. 1999), andAtlantic cod (Gadus morhua, Olsen et al. 2004). Hence, it isunlikely that significant tag loss influenced our results.
Patterns of habitat use
We found the highest CPUE of California halibut anddiamond turbot toward the center of the estuary. Fodrie andMendoza (2006) also found that the highest abundance ofCalifornia halibut in medium-sized embayments similar toPunta Banda Estuary were often centrally located, while insmaller embayments this species tends to be more abundantnear the mouth. In contrast, Hammann and Ramírez-González(1990) found that the abundance of California halibut washighest in the central section of Punta Banda Estuary, althoughtheir sampling was limited to the main channels and did notinclude the innermost section of the system. Valle et al. (1999)reported that the abundance of California halibut decreasedwith distance from the mouth in Alamitos Bay (California),although the highest abundance of diamond turbot wasfound furthest from the mouth. It is likely that spatial distribu-tion patterns are influenced by seasonal variations in the
al. 2004). Por lo tanto, es poco probable que la mortalidad depeces marcados y/o la pérdida de marcas hayan resultado en lasbajas tasas de recaptura.
Patrones de utilización de hábitat
Las CPUEs del lenguado de California y la platija diamantefueron más altas en la zona central del estero. Fodrie yMendoza (2006) también encontraron que en sistemas estuari-nos de tamaño similar al Estero de Punta Banda la abundanciaera mayor hacia las zonas centrales, mientras que en sistemasmás pequeños la abundancia era mayor cerca de las boca.Hammann y Ramírez-Gomzález (1990) reportaron mayorabundancia del lenguado de California en la región central delEstero de Punta Banda, aunque sus muestreos sólo incluyeronel canal principal y omitieron la zona interna. En contraste,Valle et al. (1999) encontraron que la abundancia de esta espe-cie variaba en proporción a la distancia desde la boca de laBahía de Alamitos en California hacia el interior del sistema.En el mismo estudio reportaron que la abundancia de la platijadiamante era mayor en la parte interna de esa bahía. Es proba-ble que los patrones de utilización de hábitat de los juveniles delenguado estén relacionados tanto con variaciones temporalesen las condiciones ambientales, como con eventos de inmigra-ción y emigración estuarina (Kramer 1990, Kramer 1991b,Gibson 1997, Fodrie y Mendoza 2006).
Las distribuciones ubicuas del lenguado de California y laplatija diamante dentro del Estero de Punta Banda, las CPUEsvariables en función de la temperatura y la salinidad, y losresultados de los análisis de regresión múltiple, indican queestas variables no regulan los patrones de utilización de hábitaten estas especies en condiciones de verano. Los juveniles fue-ron capturados en las condiciones más cálidas y salinas del año(fig. 5; Álvarez-Borrego y Álvarez-Borrego 1982). Esto esconsistente con la naturaleza tolerante de los juveniles del len-guado de California (Madon 2002, Fodrie y Mendoza 2006,López-Rasgado 2006). No conocemos estudios que evalúen elnivel de tolerancia de los juveniles de la platija diamante a latemperatura o salinidad.
La CPUE del lenguado de California y la platija diamantetuvieron una relación negativa con la profundidad; las capturasfueron más altas a profundidades menores a 2 m y se captu-raron pocos lenguados a profundidades mayores a 5 m. Estoes consistente con estudios previos sobre el lenguado deCalifornia (e.g., Kramer 1991b, Fodrie y Mendoza 2006).
En conclusión, la conectividad entre hábitats dentro de lossistemas estuarinos puede ser de gran importancia si es queindividuos de diferentes tallas exhiben diferentes patrones deutilización de hábitat y movimiento. El movimiento y la migra-ción pueden desvirtuar las estimaciones locales de crecimientoy mortalidad si no se toman en consideración al valorar loshábitats estuarinos. Por lo tanto, es necesario cuantificar elnivel de movimiento y migración en escalas de tiempo y espa-cio finas, con el fin de interpretar adecuadamente las estima-ciones de abundancia, crecimiento y mortalidad, y viceversa.

Ciencias Marinas, Vol. 35, No. 1, 2009
56
environmental conditions found among sections of the estuary,as well as by estuarine recruitment and emigration events(Kramer 1990, 1991b; Gibson 1997; Fodrie and Mendoza2006).
The results of the multiple regression analyses, coupledwith the ubiquitous distribution and variable CPUE of Califor-nia halibut and diamond turbot throughout Punta BandaEstuary, indicate that the temperatures and salinities that occurduring the summer months do not drive habitat utilization pat-terns. Juveniles were consistently caught throughout the sys-tem at temperatures and salinities that included the warmestand most saline conditions of the year (fig. 5, Álvarez-Borregoand Álvarez-Borrego 1982). This is consistent with the tolerantnature of the juvenile stage of California halibut (Madon 2002,Fodrie and Mendoza 2006, López-Rasgado 2006). To ourknowledge, there are no studies regarding the temperate orsalinity tolerance of juvenile diamond turbot.
The CPUE of California halibut and diamond turbot wassignificantly related to depth. The highest values were found inshallow water less than 2 m deep, and very few individualswere captured in water depths greater than 5 m. This agreeswith previous studies on California halibut (e.g., Krammer1991b, Fodrie and Mendoza 2006), which also identified arelationship between abundance and depth.
In conclusion, intra-estuary spatial connectivity can bewidespread and important if individuals display differentialhabitat utilization and movement patterns based on their size.Movement and migration can substantially confound local esti-mates of abundance, growth, and mortality if not consideredwhen identifying habitat value. Quantification of small-scalemovement and patterns of habitat utilization are thus necessaryto ensure that estimates of abundance, growth, and mortalityare interpreted in the light of within-estuary movement, immi-gration, and emigration, and vice-versa.
Acknowledgements
The authors thank J Mariscal, J Sandoval, A Castillo, andCICESE’s Department of Research Vessels for help during thefield work. CICESE’s Department of Aquaculture provided theculture facilities for the maintenance of laboratory specimens.We also thank JM Domínguez for help with the preparation offigure 1 and the two anonymous reviewers for their helpfulcomments. This project was funded through a research grant(No. 39571) awarded to SZ Herzka by the Mexican Council forScience and Technology (CONACYT) and by a NERC stu-dentship awarded to R Griffiths by the University of Wales atBangor.
References
Able KW, Neuman MJ, Wennhage H. 2005. Ecology of juvenile andadult stages of flatfishes: Distribution and dynamics of habitatassociations. In: Gibson RN (ed.), Flatfishes: Biology andExploitation. Blackwell Publishing, Oxford, UK, pp. 64–184.
Agradecimientos
Los autores agradecen a J Mariscal, J Sandoval, A Castilloy el Departamento de Embarcaciones Oceanográficas deCICESE por su ayuda en el campo. El Departamento de Acua-cultura de CICESE brindó las instalaciones necesarias paramantener a los lenguados en el laboratorio. Se agradece a JMDomínguez el apoyo en la preparación de la figura 1. Porúltimo, agradecemos a los dos revisores anónimos por suscomentarios y sugerencias constructivas. Este proyecto esresultado del proyecto de ciencia básica No. 39571 otorgadopor CONACYT a SZ Herzka y la beca estudiantil de NERCotorgada a R Griffiths por la Universidad de Gales en Bangor.
Allen LG, Yoklavich MM, Cailliet GM, MH Horn. 2006. Bays andestuaries. In: Allen LG, Pondella I DJ, Horn MH (eds.), TheEcology of Marine Fishes, California and Adjacent Waters. Univ.California Press, Berkeley, pp. 119–148.
Allen MJ 1990. The biological environment of the California halibut,Paralichthys californicus. In: Haugen CW (ed.), The CaliforniaHalibut, Paralichthys californicus, Resource and Fisheries. Calif.Fish Game 74: 7–30.
Allen MJ, Herbinson KT. 1990. Settlement of juvenile Californiahalibut, Paralichthys californicus, along the coasts of LosAngeles, Orange, and San Diego Counties in 1989. CalCOFI Rep.33: 84–96.
Álvarez-Borrego J, Álvarez-Borrego S. 1982. Temporal and spatialvariability of temperature in two coastal lagoons. CalCOFI Rep.23: 188–197.
Armstrong MP. 1997. Seasonal and ontogenetic changes indistribution and abundance of smooth flounder, Pleuronectesputnami, and winter flounder, Pleuronectes americanus, alongestuarine depth and salinity gradients. Fish. Bull. 95: 414–430.
Beck MW, Heck Jr KL, Able KW, Childers DL, Eggleston DB,Gillanders BM, Halpern B, Hays CG, Hoshino K, Minello TJ,Orth RJ, Sheridan PF, Weinstein MP. 2001. The identification,conservation, and management of estuarine and marine nurseriesfor fish and invertebrates. Bioscience 51: 633–641.
Burrows MT, Gibson RN, Robb L, Maclean A. 2004. Alongshoredispersal and site fidelity of juvenile plaice from tagging andtransplants. J. Fish Biol. 65: 620–634.
Desmond JS, Zedler JB, Williams GB. 2000. Fish use of tidal creekhabitats in two southern California salt marshes. Ecol. Eng. 14:233–252.
Dingle H. 1996. Migration: The Biology of Life on the Move. OxfordUniv. Press. New York, 474 pp.
Domeier ML, Chun CDY. 1995. A tagging study of the Californiahalibut, Paralichthys californicus. CalCOFI Rep. 36: 204–207.
Fodrie FJ, Mendoza G. 2006. Availability, usage and expectedcontribution of potential nursery habitats for the Californiahalibut. Estuar. Coast. Shelf Sci. 68: 149–164.
Fodrie FJ, Herzka SZ. 2008. Tracking juvenile fish movement andnursery contribution within arid coastal embayments via otolithmicrochemistry. Mar. Ecol. Prog. Ser. 361: 253–265.
Gibson RN. 1997. Behaviour and the distribution of flatfishes. J. SeaRes. 37: 241–256.
Goldberg R, Phelan B, Pereira J. 2002. Variability in habitat use byyoung-of-the-year winter flounder, Pseudopleuronectes ameri-canus, in three northeastern US estuaries. Estuaries 25: 215–226.

Herzka et al.: Movement of juvenile flatfish in a Pacific estuary
57
Goldsmith RJ, Closs GP, Steen H. 2003. Evaluation of visible implantelastomer for individual marking of small perch and commonbully. J. Fish Biol. 63: 631–636.
Griffiths SP. 2002. Retention of visible implant tags in small rockpoolfishes. Mar. Ecol. Prog. Ser. 236: 307–309.
Haaker PL. 1975. The biology of the California halibut, Paralichthyscalifornicus (Ayres), in Anaheim Bay, California. Calif. FishGame 165: 137–153.
Hammann GM, Ramírez-González AA. 1990. California halibutParalichthys californicus, in Todos Santos Bay, Baja California,Mexico. In: Haugen CW (ed.), The California Halibut,Paralichthys californicus, Resource and Fisheries. Calif. FishGame 74: 127–144.
Howell PT, Molnar DR, Harris RB. 1999. Juvenile winter flounderdistribution by habitat type. Estuaries 22: 1090–1095.
Kramer SH. 1990. Distribution and abundance of juvenile Californiahalibut, Paralichthys californicus, in the shallow waters of SanDiego County. In: Haugen CW (ed.), The California Halibut,Paralichthys californicus, Resource and Fisheries. Calif. FishGame 74: 99–126.
Kramer SH. 1991a. The shallow-water flatfishes of San DiegoCounty. CalCOFI Rep 32: 128–142.
Kramer SH. 1991b. Growth, mortality and movements of juvenileCalifornia halibut in shallow coastal and bay habitats of SanDiego County, California. Fish. Bull. 89: 195–207.
Lane ED. 1975. Quantitative aspects of the life history of the diamondturbot, Hypsopsetta guttulata (Girard). Calif. Fish Game 165:153–173.
López-Rasgado JF. 2006. Evaluación del hábitat de crianza estuarinode juveniles de lenguado de California (Paralichthys californicus)con base alcrecimiento y la abundancia relativa. Tesis de maestría,CICESE, 120 pp.
Love M. 1996. Probably more than you want to know about the fishesof the Pacific Coast. Really Big Press, Santa Barbara, California.
Madon SP. 2002. Ecophysiology of juvenile California halibutParalichthys californicus in relation to body size, watertemperature and salinity. Mar. Ecol. Prog. Ser. 243: 235–249.
Malone JC, Forrester GE, Steele MA. 1999. Effects of subcutaneousmicrotags on the growth, survival, and vulnerability to predationof small reef fishes. J. Exp. Mar. Biol. Ecol. 37: 243–253.
Moser HG 1996. The early stages of fishes in the California Currentregion. CalCOFI Atlas 33. Allen Press, Lawrence, 1505 pp.
Olsen EM, Gjøsæter J, Stenseth NC. 2004. Evaluation of the use ofvisible implant tags in age-0 Atlantic cod. N. Am. J. Fish.Manage. 24: 282–286.
Ortiz M, Huerta L, Hinojosa A. 2003. Transporte de sedimento portracción de marea en el Estero de Punta Banda, BC, México.GEOS 23: 283–294.
Plummer KH, DeMartini EE, Roberts DA. 1983. The feeding habitsand distribution of juvenile-small adult California halibut incoastal waters off northern San Diego County. CalCOFI Rep. 24:194–201.
Posner M, Lavenberg RJ. 1999. Movement of California halibut alongthe coast of California. Calif. Fish Game 85: 45–55.
Pritchard DW, de la Paz Vela R, Cabrera-Muro H, Farreras-Sanz S,Morales E. 1978. Hidrografía física del Estero de Punta Banda.Parte I: Análisis de datos. Cienc. Mar. 5:1–23.
Rosales-Casián JA. 1997. Inshore soft-bottom fishes of the twocoastal lagoons on the northern Pacific coast of Baja California.CalCOFI Rep. 38: 180–192.
Rosales-Casián JA. 2004. Age and growth of young-of-the-year(YOY) California halibut (Paralichthys californicus), fromnorthwestern Baja California. Bull. South. Calif. Acad. Sci. 103:137–143.
Saucerman SE, Deegan LA. 1991. Lateral and cross-channel move-ments of young-of-the-year winter flounder (Pseudopleuronectesamericanus) in Waquiot Bay, Massachusetts. Estuaries 14:440–446.
Sogard SM 1997. Size-selective mortality in the juvenile stages ofteleost fishes: A review. Bull. Mar. Sci. 60: 1129–1157.
Tupen JW. 1990. Movement and growth of tagged California halibut,Paralichthys californicus, off the central coast of California. In:Haugen CW (ed.), The California Halibut, Paralichthyscalifornicus, Resource and Fisheries. Calif. Fish Game. 74:199–206.
Valle CF, O’Brien JW, Wiese KB. 1999. Differential habitat use byCalifornia halibut, Paralichthys californicus, barred sand bass,Paralabrax nebulifer, and other juvenile fishes in Alamitos Bay.Fish. Bull. 97: 646–660.
Recibido en mayo de 2008;aceptado en enero de 2009.