short selling: cleaning up after elephants
TRANSCRIPT

Short Selling: Cleaning Up
After Elephants
An Investor’s Guide to Wall Street’s Toughest Job
Guy Judkowski

About the Author
Mr. Judkowski is a managing member of Waterloo International
Advisors, LLC. He co-managed a short-biased hedge fund from 2000-2013. Over
a 20 year period, Mr. Judkowski published short sell reports (The Accounting
Workout (1993-1994) and The Short Seller’s Report (1996-2006)) and co-
published red flag newsletters (Balance Sheet Watch (1998-2006) and Earnings
Workout (2011-2012)). His firm currently serves as sub-advisor to Logan Capital
Management, which offers a long/short strategy through separately managed
accounts and a mutual fund. For more information, visit www.logancapital.com
or www.logancapital.com/funds

Copyright © 2014 Guy Judkowski
Contents Chapter 1: Introduction ......................................................................................... 1
Chapter 2: Beginner’s Luck .................................................................................... 4
Chapter 3: Keeping it Simple .................................................................................. 7
Chapter 4: Slowing Sales and Rising Inventory Levels ......................................... 10
Case Study: Fruit of the Loom (FTL) ............................................................. 11
Chapter 5: Slowing Sales and Rising Accounts Receivable .................................. 14
Case Study: Alpharma (ALO) ........................................................................ 15
Chapter 6: Totality of the Circumstances Approach ............................................ 18
Earnings Quality Issues .................................................................................... 18
Case Study: Fossil Corp. (FOSL) .................................................................... 19
Case Study: American Italian Pasta (AIPC, PLB) ........................................... 22
Differential Disclosure ...................................................................................... 24
Case Study: Serologicals (SERO) ................................................................... 25
Management Quality ....................................................................................... 27
Case Study: Orthodontic Centers of America (OCA) .................................... 27
Fieldwork .......................................................................................................... 30
Case Study: Safeskin (SFSK) .......................................................................... 31
Chapter 7: When a Short Just Isn’t Working ........................................................ 34
Chapter 8: The Increased Difficulty Level of Successful Shorting ........................ 37
Chapter 9: Conclusion .......................................................................................... 41
Acknowledgements .............................................................................................. 43

1
Chapter 1: Introduction
I have been a professional short seller for over 20 years. Early in my
career, a colleague described our job as basically being paid to clean up after
elephants. Later in my career, I met someone whose summer zoo job actually
involved cleaning up after elephants. After comparing notes, the jobs seemed
very similar. Both involved a whole lot of s_ _t!
I doubt very few people ever intend to become a short seller. I know I
didn’t. After receiving a BA in International Relations from the University of
Pennsylvania in December 1988, reality slowly dawned on me. With the possible
exception of philosophy, I had just earned one of college’s least useful degrees.
So I did what every LA Law watching student did in 1989. I went to law school.
One summer toiling at an insurance defense law firm convinced me I would
never be able to successfully account for my day in 6-minute increments. The
following summer, I landed an internship with the Internal Revenue Service.
They loved me primarily because my softball skills proved useful to the legal
department’s softball team. Workwise, nobody knew what to do with me. I had
free time to do stock research all day on the Nexis/Lexis research terminal. It
gradually dawned on me that I really enjoyed doing stock research so after law
school I took a job as an analyst at a money management firm in Bryn Mawr,
Pennsylvania.

2
The owner of the firm had once been the head of Drexel Burnham
Research (which later became famous and ultimately infamous in the 1980s due
to Michael Milken and junk bonds). While in his office one day, I noticed him
reading a newsletter called Financial Statement Alert. The service highlighted
between 5-8 companies per month that were using aggressive accounting
techniques in order to manage earnings.
My interest piqued, I read all the back issues in short order. Next, I went
to the library and read as much as I could on short selling. I learned about NYU
accounting Professor Abraham Briloff who in the 1960s wrote papers criticizing
how companies manipulated earnings. I also located a copy of Thornton
O’Glove’s Quality of Earnings (1987). This book laid out in great detail how
forensic accounting helps identify earnings quality problems by emphasizing the
importance of detailed analysis and investigation of a company’s financial
statements. Identifying problems before they are well known creates excellent
opportunities on the short side.
The sections that delved deeply into accounting bored me. I admittedly
was not interested in learning all the nuances of accrual-based accounting. I did
find fascinating the sections on due diligence, working capital red flags such as
high accounts receivable and inventory, and the concept of differential disclosure
(seeking out wording changes in federal filings and company announcements).
Perhaps some of my legal training helped me to be more naturally attentive to the

3
necessity of critically reading federal filings and proxy statements. The premise
that slowing sales coupled with deteriorating working capital is a red flag made
common sense to me. After all, my stepfather owned a furniture store so I had a
front row seat to the importance of managing your cash flow, not allowing your
inventory to pile up, and the importance of collecting on your receivables.
Within two weeks of reading these materials, I created financial screens
able to identify companies experiencing slowing sales and working capital
problems. Armed with this powerful tool, in 1993 I began publishing a short sell
newsletter called The Accounting Workout.

4
Chapter 2: Beginner’s Luck
There was a remarkable rookie pitcher in 1976 named Mark “Birdman”
Fidrych who went 19-9 and won Rookie of the Year (shortly afterwards, he
suffered arm injuries and was finished after just 5 seasons). My rookie season as
a short seller was almost as good. I published 9 short sell reports between
October 1993 and March 1994. The following table shows my record:
Brooktree Corp, down 17% in 6 weeks; Fruit of the Loom, down 32% in
4 weeks; Eagle Hardware & Garden, down 46% in 4 weeks; Regal
Communications, down 31% in 4 weeks; SLM International, down 40% in 5
Company
Initiation
Date
Initiation
Price
Close-Out
Date
Close-Out
Price
Gain/
Loss
Brooktree (BTRE) 10/19/93 $13 7/8 12/1/93 $11 ½ +17%
Fruit of the Loom (FTL) 11/24/93 $35 ¼ 12/20/93 $23 7/8 +32%
Eagle Hardware (EAGL) 12/13/93 $39 ¾ 1/1/94 $16 +46%
Regal Comm. (RCOM) 12/20/93 $5 ¼ 1/10/94 $3 5/8 +31%
Empi (EMPI) 1/10/94 $20 Open Open Open
Pyxis (PYXS) 1/21/94 $70 ½ Open Open Open
Cooper Tire (CTB) 1/31/94 $25 ½ NA $27 7/8 -9%
SLM International (SLMI) 2/23/94 $22 ½ 3/24/94 $13 1/2 +40%
Alaska Air (ALK) 3/22/94 $16 5/8 Open Open Open

5
weeks. There was a small loss (9%) in Cooper Tire & Rubber and 3 open short
recommendations (Empi, Pyxis, and Alaska Airlines) when I stopped publishing
and left to work for a hedge fund. I later co-managed a successful short-biased
hedge fund for 13 ½ years and also published short sell reports (The Accounting
Workout (1993-1994), The Short Seller’s Report (1996-2006)) and co-published
red flag newsletters (Balance Sheet Watch (1998-2006), Earnings Workout
(2011-2012)).
I have a somewhat unique perspective because I published research and
managed short portfolios. Few who publish negative research ever actually
manage money and those who manage shorts almost never publish research. I co-
managed my short-biased hedge fund which had a total net return of +58.7% over
the period 2000 to 2013. During the comparable time period, the Russell 2000
went up +131.4%. If you were a market bear, investing in our fund would have
been a much better decision than shorting the Russell 2000. Our fund was
popular with several large institutional investors who used us to hedge long
portfolios. They liked our fund primarily because losses were generally much
lower than our competition during up markets while we still made money in
down markets.
To give some perspective on my research business track record, below
are some performance statistics on Balance Sheet Watch, which I co-published
from October 1998 to August 2006. The goal of the service was to conduct a

6
disciplined, methodical search for flawed companies that we believed were likely
to under-perform the Russell 2000 over a 6 to 12 month period. We highlighted
over 1,000 companies in Balance Sheet Watch.
Performance Metric
1,038 total companies
Hit Rate
% (# companies)
A. Declined 30% or more using a cover price 6 months after initial write-up
19% (204)
B. Closed below the write-up 6 months after the initial report 53% (570)
C. Traded 30% below the write-up price within 12 months 42% (452)
D. Traded 50% below the write-up price within 12 months 19% (201)
In my business, you are judged on performance. What I can say with
confidence is that I developed a methodology that I felt very comfortable using
whether as part of a newsletter or as part of portfolio management. I am hopeful
that my experiences in regard to both what works and doesn’t work will prove
useful to readers.

7
Chapter 3: Keeping it Simple
While the effortless success I enjoyed at the beginning of my career did
not last, I fortunately did not suffer the same fate as the Birdman. My career
continued upward even if it more closely mirrored the dependable baseball
pitcher Jamie Moyer than one of the game’s superstars.
I believe that short selling is easiest when the approach is not over-
complicated. I look for signs of problems in simple-to-understand businesses
that point to a possible near-term earnings and/or sales disappointment. Most
importantly, I strive to be objective in my analysis and diligent in managing risk.
A focus on slowing sales and deteriorating working capital creates a
manageable list of potentially flawed companies. This approach quickly
eliminates a lot of potential headaches. Wall Street always appreciates a good
growth story. Growing companies often need capital and capital-raising is the
lifeblood of investment banks. Good sales performance also masks underlying
issues such as poor cost control, inadequate infrastructure, or an overmatched
management team. Once sales growth slows, these issues reveal themselves more
clearly.
Sometimes, a company’s reported sales growth can be misleading as
revenue contribution from acquisitions augments internal growth. It often is too

8
risky to short a company that relies on acquisitions for growth. Wall Street likes
organic growth, but they absolutely adore growth-by-acquisition. Acquisitive
companies need financing from Wall Street to fund acquisitions and Wall Street
does not usually like to bite the hand that pays their fees. Growth-by-acquisition
also complicates analysis. By doing frequent acquisitions, companies have
accounting flexibility to massage reported earnings quarter after quarter and
mask slowdowns in organic growth. There have been some great shorts involving
acquisitive companies, but great patience and a large loss tolerance are essential.
These are qualities that most people, including myself, do not possess.
Another benefit of focusing on slowing sales and deteriorating working
capital is it allows an analyst to quickly exclude problematic areas. For example,
I have always been fascinated by short sellers who focus on frauds, drug
approvals, and financial shorts. Over my career, I published short sell reports on
companies like MedQuist, ArthroCare, Impath, and American Italian Pasta
Company. Ultimately, the United States Securities & Exchange Commission
accused these companies of various accounting irregularities. However, my short
thesis for each of these companies was never predicated on financial wrongdoing.
A complete fraud like Enron requires a lot of financial acumen and patience. On
the surface, everything at Enron looked great and my screens could never have
unmasked Enron’s problems. The same logic applies to binary events like drug
approval submissions before the FDA. I never like to bet on what any

9
government agency may or may not do. Financial shorts are also difficult since
these companies have maximum flexibility to manage earnings by making
reserve assumption changes. In 2008, financial shorts worked amazingly well,
but the catalysts were as much systemic as company-specific. I do not believe my
methodology is nearly as effective in predicting financial stock performance. In
sum, I believe the most fertile sectors to find short ideas using my process are
consumer-discretionary, retail, healthcare (excluding drugs), and technology
(preferably simple to understand companies). I also exclude most cyclical
industries since the stock performance of a cyclical company is often more
closely tied to business cycles and commodity price changes than company
specific issues.

10
Chapter 4: Slowing Sales and Rising Inventory Levels
The interrelationship between sales growth, gross margins, and inventory
levels has great significance when analyzing companies that manufacture and/or
sell inventory, especially with consumer-focused businesses. There are various
ways to measure inventory. I prefer two methods:
1. Calculate the percentage change in sales year over year (“y/y”) and
compare to the percentage change in inventory y/y. If the change in
inventory is growing faster than sales, it is a red flag.
2. Calculate the days sales of inventory (“DSI”) which is the average
number of days that it takes to sell inventory held during a quarter
and compare the DSI for two comparable time periods. It is a very
simple equation: DSI= 90 X (inventory/quarterly cost of goods). I
use inventory reported at quarter’s end. Others like to use average
period inventory. As long as you are consistent and compare to a
relevant time period, DSI is very helpful in understanding whether a
company is managing its inventory well.
I am especially interested on the short side when sales growth depends
on price increases over volume growth. Price increases can boost reported sales
temporarily. However, when volume growth stalls, higher prices are likely to

11
pressure volumes further. This causes even higher inventory levels. Eventually, a
company has to cut prices in order to reduce this inventory.
It is also helpful to analyze gross margin trends. Deteriorating gross
margins are obviously negative, but the implications of this are fairly well
understood. I am more intrigued when despite slowing sales and rising inventory
levels, gross margins are improving. This is particularly interesting if the
company is a manufacturer. A producer can sustain or improve gross margins by
operating plants at full capacity. However, if sales do not pick up and inventory
builds, manufacturing activity eventually has to be curtailed. This hurts plant
utilization, reduces economies of scale, and adversely impacts gross margins.
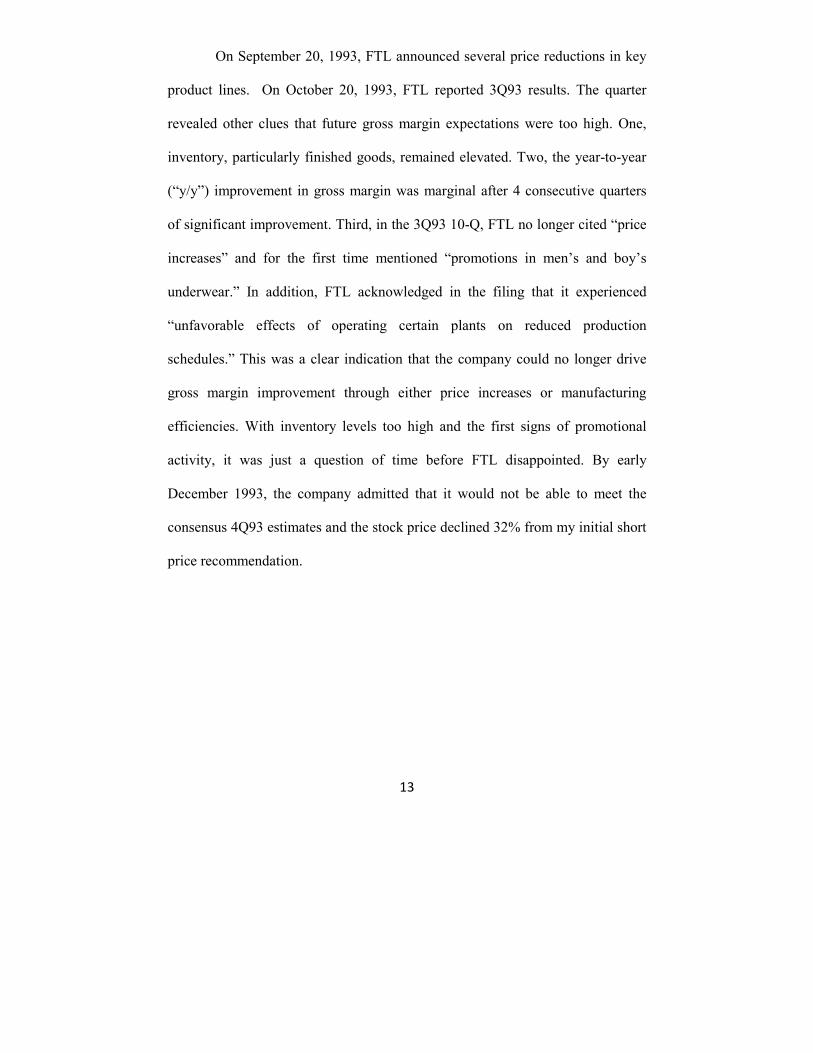
Case Study: Fruit of the Loom (FTL)
Source: Bloomberg
The significance of stagnant sales growth coupled with bulging
inventories has proven itself repeatedly over my 20+ years of short selling. On

12
November 24th, 1993, I published a short sell recommendation in The
Accounting Workout on Fruit of the Loom (FTL). At the time of publication,
FTL had reported several quarters of decelerating sales. Despite the sales
slowdown, inventory levels were rising rapidly. Some Wall Street analysts
praised FTL for improving gross margins despite difficult industry conditions.
Analysis of the company's federal filings, however, should have raised doubts
about the sustainability of this improvement.
In its 1992 Annual Report, FTL attributed improved gross margins to
"Price increases ... manufacturing efficiencies due to higher plant utilization,
lower raw material costs, and the continuing shift within the active wear line to
higher margin products". In the first quarter of 1993 (“1Q93”) 10-Q, the
company no longer cited "the continuing shift within the active wear line to
higher margin products". In the 2Q93 10-Q, the company dropped "the
manufacturing efficiencies due to higher plant utilization" phrase. Instead, FTL
attributed continued gross margin improvement to "Price increases and lower
cotton costs…”
In the report, I wrote, “If the shift to higher margin products has halted
and manufacturing efficiencies have ceased, then the company has to either raise
prices further, increase volumes, or reduce raw material costs in order to sustain
gross margins. In addition, one can surmise that potential manufacturing
inefficiencies will occur if FTL scales back excessive production levels.”
13
On September 20, 1993, FTL announced several price reductions in key
product lines. On October 20, 1993, FTL reported 3Q93 results. The quarter
revealed other clues that future gross margin expectations were too high. One,
inventory, particularly finished goods, remained elevated. Two, the year-to-year
(“y/y”) improvement in gross margin was marginal after 4 consecutive quarters
of significant improvement. Third, in the 3Q93 10-Q, FTL no longer cited “price
increases” and for the first time mentioned “promotions in men’s and boy’s
underwear.” In addition, FTL acknowledged in the filing that it experienced
“unfavorable effects of operating certain plants on reduced production
schedules.” This was a clear indication that the company could no longer drive
gross margin improvement through either price increases or manufacturing
efficiencies. With inventory levels too high and the first signs of promotional
activity, it was just a question of time before FTL disappointed. By early
December 1993, the company admitted that it would not be able to meet the
consensus 4Q93 estimates and the stock price declined 32% from my initial short
price recommendation.

14
Chapter 5: Slowing Sales and Rising Accounts
Receivable
The interrelationship between sales growth and accounts receivable
levels also has great significance. This is another common sense red flag. When
sales slow, managements sometimes are tempted to drive last minute sales by
either offering more favorable terms to an existing customer or relaxing credit
standards. This boosts current sales, but there is an associated cost. By offering
more favorable terms, the company risks pushing forward sales that would have
occurred later. Consequently, the company becomes more likely to face a similar
dilemma in subsequent quarters. Relaxing credit standards increases the risk that
the receivables are ultimately uncollectible and calls into question whether
reserves for credit losses are conservative. This is a pretty obvious danger, yet
Street analysts often ignore this problem.
I analyze accounts receivable trends the same way that I analyze
inventory levels. The following are my two preferred methods of analysis:
1. Calculate the percentage change in sales y/y compared to the
percentage change in accounts receivable y/y. If the change in
accounts receivable is growing faster than sales, it is a red flag.
2. Calculate the days sales outstanding (“DSO”) which is the average
number of days that it takes to collect revenue after a sale has been
made during a quarter for two comparable time periods. It is a very

15
simple equation: DSO=90 X (Accounts Receivable/Quarterly
Revenues). Tracking DSO over several quarters helps to spot a trend.
If increasing, the company may be offering more favorable terms or
experiencing difficulties collecting from less creditworthy customers.
Case Study: Alpharma (ALO)
Source: Bloomberg
The implications of unusually high accounts receivable was clearly
displayed in the January 2002 issue of Balance Sheet Watch when I featured
specialty generic pharmaceutical company Alpharma (ALO). Alpharma’s sales
growth had been slowing all year. On November 6, 2001, the company
announced 2001 third quarter (“3Q01”) revenues and earnings in-line with
previously reduced guidance and Wall Street expectations. A week later on
November 14th the Company surprised investors when it negatively revised the
results that had just been released the week before. In a press release,

16
management attributed this to, “Oral representations alleged by certain
customers of the Animal Pharmaceutical business that resulted in a
difference in understanding of key terms and conditions related to third
quarter sales to these customers. As a result, the Company has modified the
revenue recognition for these transactions and has not reflected these sales
in the third quarter results.”
Alpharma’s DSO, which rose steadily throughout 2001, blasted higher in
3Q. The release of the 3Q 10-Q essentially confirmed a major problem brewing.
In the 10Q, management included the following new cautionary language,
“Accounts receivable in our Animal Health Division (“AHD”) increased by over
$32.0 million resulting from marketing programs which included sales
incentives, principally extended terms and reductions off list prices. Customers
have also delayed payment terms resulting in an increase in past due amounts.
The Company is pursuing collection of these amounts and expects a reduction in
both receivables and past due amounts by the end of the quarter.”
Despite these red flags, the stock price barely budged between
September 2001 and January 2002 (and this time period included the stock
market bloodbath following 9/11). Alpharma’s stock price finally imploded
March 2002 after posting lower than expected 4Q results and warning of a major
shortfall for FY02. When I published on Alpharma in January 2002, the stock
price was $27.03. Three months after my report, ALO stock had dropped -39% to

17
$16.55. The earnings miss and guidance shortfall should not have been a shock to
any analyst who had paid attention to Alpharma’s accounts receivable.

18
Chapter 6: Totality of the Circumstances Approach
In law school, I learned about the totality of the circumstances standard.
This legal standard states that there is no single deciding factor in order to make a
fair conclusion. Instead, one must consider all presented facts. This maxim also
applies to short selling. Here are the factors used for this approach.
Screening for a combination of slowing sales and deteriorating working
capital is a great way to narrow a universe of possible shorts, but it really is just
the first step, albeit the most important one. Beyond screening, building a short
case is about identifying additional clues that support the proposition that the
company in question is vulnerable to disappointment. I primarily focus on
earnings quality, differential disclosure, management quality, and fieldwork.
Earnings Quality Issues
When a rapidly growing company begins to experience a sales
slowdown, management has various levers it can use besides manipulation of
inventory and accounts receivable to preserve the appearance of undiminished
Totality of the Circumstances Approach to Short Selling
1. Combination of slowing sales and deteriorating working capital
2. Earnings quality
3. Differential disclosure
4. Management quality
5. Fieldwork

19
growth. It is always a concern when a company reports both revenue
deceleration and a sales shortfall. It is particularly noteworthy when a company
reports a positive earnings surprise despite a sales shortfall. My reasoning is that
revenue issues generally precede earnings problems, yet Wall Street is usually
more forgiving about sales misses than earnings misses. Consequently, I always
view this scenario as a potential opportunity to find a timely short idea.
Assuming inventory or accounts receivable levels are also problematic, I try and
understand how the company managed to exceed earnings expectations despite
the sales shortfall. This analysis enables a better understanding of whether the
problems are deeper than investors realize.
Below are a few brief case studies that show how poor earnings quality
often leads to significant earnings disappointments:
Case Study: Fossil Corp. (FOSL)
Lower Tax Rate and Foreign Currency Benefits
Source: Earnings Workout, Dec 2011 and Feb 2012 issues
Source: Yahoo Finance

20
I initially became interested in Fossil following its 3Q11 earnings
release. Revenues for 3Q increased 22.7% while inventory increased 31.8%.
Fossil 3Q EPS was $0.05 above analyst consensus expectations due to higher
than expected gross margins and SG&A leverage, but as pointed out in my
report, “Y/Y gross margin declines have been partially masked by foreign
currency (“FX”) benefits from a weaker dollar. In 3Q, gross margin decreased
110 basis points to 55.9% from 57.0% in the prior year quarter, inclusive of a
170 basis point favorable change resulting from a weaker U.S. dollar. Overall
operating income was positively impacted by $15.8 million as a result of
translating foreign-based sales and expenses into dollars.”
Fossil predicted that fourth quarter gross margins and earnings would be
slightly lower than expectations due to a smaller foreign exchange benefit and
pressure from recent strengthening in the U.S. dollar. There were other subtle
signs of problems. These included a slowdown in Fossil’s Direct-to-Consumer
and E-Commerce business; cautious comments on the 3Q conference call about
the international outlook; and an increasing reliance on driving sales through
third-party distributors and off-price retailers. In the 3Q 10-Q filing, management
attributed part of the gross margin decline to “a higher percentage of lower
margin sales to third party distributors and off-price retailers which negatively
impacted gross profit margin in the third quarter.”
To my surprise, the stock price proved resilient. Investors ignored the
warning signs and drove Fossil’s stock price higher over the following months.

21
Nonetheless, I was not surprised when 4Q earnings also showed signs of strain.
As I noted in my February 24, 2012 follow-up, “Fossil reported better than
expected 4Q EPS of $1.87 vs the $1.77 consensus estimate on lower than
expected revenue of $830.8 million vs the $841.5 million estimate. 4Q earnings
quality was extremely poor with a lower than expected tax rate of 27.3% (vs the
35% consensus estimate) adding $0.21 to the bottom line. Excluding the impact
of the lower tax rate, EPS would have come in at $1.66 or $0.11 below investor
expectations. On the surface, FY12 EPS guidance of $5.40-5.50 is in-line with
investor expectations of $5.44, however adjusting for the tax rate change and
using the old tax rate assumption, EPS guidance would have been $5.15-$5.25,
well below expectations. Further, FY12 revenue guidance came in slightly below
the Street at $2.95 billion vs the $3.0 billion estimate. Additionally, the company
issued 1Q12 EPS guidance $0.90-0.92 vs the $0.98 consensus. Using Fossil’s
old tax rate, 1Q EPS guidance would have been $0.85-0.87. On the call,
management also reported that it expects a lower share count in 2012. Given the
lower tax rate and share count assumption along with deteriorating gross margin
and operating margin, much of FY12 earnings growth guidance appears to be
lower quality.”
I also highlighted the continued unhealthy pattern of slowing sales and
rising inventories. In the prior quarter, management forecasted that, “in terms of
Q4 we do expect inventory increases to be in line with sales.” This forecast
proved incorrect as inventory growth exceeded sales growth in the fourth quarter.

22
Finally, despite the continuing benefit from favorable FX, 4Q gross margins
decreased year-over-year and were below consensus estimates. Management
commented, “This decline was principally driven by an increase in the cost of
factory labor in certain watch components.” In the prior quarter, the Company
wrongly predicted that, “production cost increases are expected to remain stable
over the balance of the year.”
After a brief dip, Fossil’s stock price revived. Finally, however, on May
8, 2012, Fossil’s stock price plummeted 29% after the company reported
disappointing first-quarter sales and its second-quarter forecast also missed
estimates. The earnings quality in both 3Q and 4Q was poor and proved to be
very useful in predicting that Fossil’s near term prospects were not as rosy as its
supporters believed.
Case Study: American Italian Pasta (AIPC, PLB)
One-Time Gains in Operating Earnings and Capitalizing Interest Costs
Source: The Short Seller’s Report, July 29, 2002
Source: Bloomberg

23
When I first analyzed American Italian Pasta, the company exhibited
classic red flags such as slowing sales and rising inventory coupled with gross
margin improvements attributed to manufacturing efficiency. Subsequent
analysis and fieldwork revealed numerous problems with the company and over
the next 3+ years of coverage, I wrote numerous updates on the company.
Ultimately, American Italian Pasta was forced to restate earnings and the CEO
and CFO pleaded guilty in 2008 to their role in a conspiracy to fraudulently
inflate earnings in order to conceal the true financial condition of AIPC between
May 2002 and December 2004.
At the time of my July 29, 2002 initial report, I never imagined the
magnitude of corporate fraud occurring at AIPC, but I did believe the company
was using certain accounting treatments that diminished the quality of reported
earnings. From my report: “We further believe that investors should exclude
payments from the U.S. government from earnings and revenues since the
likelihood and amount of future payments is uncertain. Competitor New World
recorded these payments as “other income”, which was not included in operating
results. On the other hand, AIPC, which has received $7.6 million from the
government, has prorated the payments throughout the fiscal year and is
recognizing $0.02 in EPS and $1.0 m in revenues per quarter.” Later in the
report, I questioned the company’s practice of capitalizing interest costs
associated with the construction and installation of plant and equipment. I noted

24
that “In FY01 and FY00, approximately $2.6 million and $2.0 million of interest
cost was capitalized. The company does not reveal the amount of interest
capitalized quarterly so it is unclear what the impact has been during FY02.”
My fieldwork, which included numerous conversations with industry
participants and tracking industry sell-through data, cast serious doubt on
management’s rosy forecasts. The feedback I received supported my initial view
that the accounting changes were part of management’s efforts to paint a positive
picture of the company’s prospects. Proving a short thesis sometimes feels like
peeling off the layers of an onion. The foundation of the thesis, however, should
always start with a straightforward set of red flags such as sales deceleration and
working capital deterioration. Accounting changes and fieldwork should support
(or refute) the primary thesis. Absent sales deceleration and working capital
deterioration, I do not believe that they should be the main pillar that supports a
short thesis
Differential Disclosure
Focusing on sales deceleration helps pinpoint when a company’s
problems may trigger a negative reaction from investors. Another important way
to assess the timeliness of a short idea is differential disclosure (the practice of
seeking out wording changes in federal filings and company announcements).
There are computer programs available that automatically highlight wording

25
changes in federal filings, but I have found them less useful than actually reading
and comparing two documents side-by-side. Computer programs show every
single discrepancy, but cannot discern which changes actually have meaning.
Furthermore, it is often useful to compare and contrast a quarterly conference call
transcript with either a previous quarter’s call or with a federal filing submitted
for the current quarter.
Case Study: Serologicals (SERO)
Source: Bloomberg
One of my all-time favorite illustrations of differential disclosure
occurred in Serologicals Corp. (SERO-The Short Seller’s Report, February 22,
1999). The company provided specialty human antibodies and related services to
major healthcare companies. In my initial report, I summarized the short thesis as
follows, “SERO stock trades with a P/E multiple in excess of the Company’s
estimated 1999 growth rate. We view slowing internal sales growth, deteriorating

26
gross margins, rising accounts receivable and inventory DSOs, and significant
insider sales as major red flags. Consequently, we are recommending the short
sale of Serologicals ahead of its 4Q earnings release (scheduled for release on
March 1st).”
One of the primary reasons I was confident that 4Q could disappoint was
a subtle change made by Serologicals in its 3Q 10-Q. In the 1Q and 2Q quarterly
filings, Serologicals stated, “The Company believes that any adverse impact it
has experienced or may continue to experience as a result of the factors described
above, including decreased collections of antibodies and delayed or reduced
shipments thereof, will be short-term in nature.” The September 10-Q included
the above warning, but deleted the comment that the negative impact would only
be “short-term in nature”. In my report, I wrote, “We view this deletion as a
significant red flag and as a strong indicator that significant fundamental
challenges continue to face Serologicals.”
On April 16th, 1999, the company announced that it expected a
significant 4Q earnings shortfall because two international customers cancelled
orders. The stock price plummeted 50% following the announcement. The
following year, on April 11, 2000, Serologicals announced that it would restate
the first three quarters of 1999. The company said it discovered errors that
resulted in an overstatement of sales and an understatement of cost of sales and
other expenses. The company also said its revenue recognition policy, as it
relates to the timing of recording sales under an existing arrangement with a

27
single customer, should be amended. The case of Serologicals is a text book
example of why it is really important to read filings as closely as possible. Word
changes are not random occurrences and often provide a great tell for an
approaching catalyst.
Management Quality
Management quality is also an important factor to consider when
assessing a short idea. Key factors include:
Management Quality Red Flags
1. The presence of related party transactions
2. Key management or auditor resignations
3. Any past failures or controversies involving current management or board members;
4. Excessive family participation in the business
5. Insider selling
Case Study: Orthodontic Centers of America (OCA)
Source: Bloomberg

28
As with earnings quality and differential disclosure, management quality
concerns should complement slowing sales and deteriorating working capital.
Management quality issues always give me greater confidence in a short idea.
The case of Orthodontic Centers of America (OCA-Balance Sheet Watch,
December 16, 2002) illustrates this point. OCA provided a wide range of services
to its affiliated orthodontic practices. I was initially interested in OCA because
3Q02 sales growth slowed while accounts receivable surged. In addition,
sequential revenue growth declined -0.6% q/q, which represented the first decline
in revenue growth on a sequential basis in over two years. On the 3Q conference
call, management cautioned, “There was a change in sequential sales for the
quarter. They basically dropped because some of our doctors have quit paying
and we quit accruing revenues.” Management did not provide further comments
relating to the doctors that have “quit paying”.
On the conference call, a questioner asked about the high accounts
receivable. Management answered, “I thought this was going to be a cake
walk…It’s not as easy as I thought and I don’t have all the answers yet but here
is what I have learned. One, the dynamics of our collections have changed with
the change in the economy, the addition of our OrthAlliance subsidiary and the
expansion of our foreign operations. Collections have slowed.” Additionally, in
response to a question whether receivables should be expected to rise or not,
management stated, “I would reiterate my answer to the last question the same
way I did before. The past is the best indication of the future.”

29
Despite the admission that accounts receivable were becoming difficult
to collect, OCA lowered the allowance for doubtful accounts (as a percentage of
total receivables) to 4.5% versus 6.2% at Q4/01 and 6.9% at Q4/00. By lowering
the allowance, OCA’s earnings received an immediate boost. The flip side, of
course, is that if collection problems lingered, the company would have to write
down any uncollectible balances.
In terms of management quality, there were numerous red flags.
Bartholomew Palmisano, Sr., CEO and Chairman, and Bartholomew Palmisano,
Jr., COO, were father and son. Gordon Tunstall, a member of the Audit
Committee, resigned as a Director in September 2001. In June 2001, Dr. Gasper
Lazzara, Jr. resigned as Chairman of the Board. Hector Bush, Director, and Jack
Devereux, Director, each separately owned companies that had service
agreements with OCA. John Sheridan, another Director, was paid for providing
consulting services. In October 2002, John Glover resigned as CFO. Mr.
Glover’s tenure as CFO lasted only a year. Previous to Mr. Glover,
Bartholomew Palmisano Jr., son of the CEO, served as CFO from 1998 through
2001. Collectively, especially given all the other red flags, I concluded that
management quality was low. This raised my confidence level that OCA’s
problems would likely fester.
In the first quarter of 2004, the company disavowed its previous revenue
recognition policies. The 10Q stated, “The determination of fee revenue under
our prior revenue recognition policy required significant judgments by

30
management to determine the portion of a straight-line allocation of patient
contract amounts that was estimated to be retained by affiliated practices in
future periods, as well as the portion of un-reimbursed practice-related expenses
that was secured by patient fees receivable and therefore recognizable as fee
revenue. These complex and data-intensive calculations are not applicable under
our new revenue recognition policy. We have also taken steps to improve
communication between our operations and financial accounting areas, including
appointment of a chief financial officer with experience in our operations area."
In February 2006, OCA’s shares were delisted by the New York Stock
exchange due to the company’s failure to file any quarterly or annual financial
statements since September 30, 2004. In March 2006, OCA filed for Chapter 11
bankruptcy protection. In 2008, the SEC sued ex-CFO Bart Palmisano Jr. (and
son of the founder) and alleged that over twelve different quarters during the
years 1998 and 2001, he had created and recorded a total of eighteen journal
entries on OCA’s general ledger that had the cumulative effect of creating
approximately $71 million of fictitious revenue.
Fieldwork
Red flags uncovered through the forensics process can often be
confirmed through solid fieldwork. Such fieldwork might consist of speaking
with competitors, suppliers, distributors, channel checks, store visits, or
analyzing social media trends.

31
Case Study: Safeskin (SFSK)
Source:Bloomberg
An example of this is a short sale recommendation that I made on
Safeskin Corp (SFSK) in The Short Seller’s Report on October 26th, 1998. In my
initiation piece, I summarized the thesis as follows: “In 1998, Safeskin’s gross
margin has increased 600 basis points y/y to 52.3%. Much of this improvement is
tied to devalued Asian currencies, manufacturing efficiencies, and stable pricing.
Street analysts project that Safeskin’s gross margins will remain at 52%
throughout 1999. We disagree. In recent months, Asian currencies have
appreciated versus the dollar. We believe this development could begin to have a
negative impact on Safeskin’s gross margins by Q4. In Q2, inventory increased
48% y/y on a 30.5% sales increase (absent a small acquisition, revenue growth
would have been 26%, in-line to slightly below Street estimates) while other
current assets and debt rose.”

32
The key issue was whether Safeskin’s gross margin improvement was
sustainable in the face of currency headwinds and bloated inventory. The
company participated in an industry where it was very easy to identify the main
players: Ansell Perry, Johnson & Johnson, London International Group, and
Wembley Inc. Through perseverance, I developed a good rapport with the
Johnson & Johnson and Ansell Perry managers. I learned that Safeskin’s revenue
growth benefited the previous two years from the change in mix in the acute care
market (driven by concerns over allergenic reactions to powder) from powdered
to higher priced powder-free latex examination gloves. Revenue growth in the
future would be driven more by new units sold rather than conversion of sales
from powdered to powder-free.
Safeskin’s competitors were slow to recognize the growing demand for
powder-free gloves and had under-invested in powder-free production. By 1997,
however, the entire industry began building new powder-free facilities.
Throughout the first half of 1998, Safeskin benefited as many of these projects
had not yet been completed. When I wrote my report, however, I was well aware
that industry production was ramping and that a glut was inevitable.
Competitors informed me that Safeskin had been offering several months
of free glove supplies to prospective customers and had increased the use of
rebates. As I wrote in my report, “In fact, we have heard of one instance where
Safeskin effectively (by using rebates and free supplies instead of formal
price cuts) offered powder-free gloves at $49.00 per case to a hospital in the

33
Premier network, which is 23% below its official Premier price of $62.90 per
case. We spoke with several competitors and each one acknowledged that
prices have declined by over 5% in the past six months and that there is
concern regarding escalating price declines. Compounding these concerns,
some competitors believe that hospitals are much more aware that
manufacturers have not passed on the majority of the savings derived from
lower production costs caused by the devaluation of Asian currencies.”
I recommended Safeskin as a short sale on October 26 at a price of
$32.50. After the company announced disappointing 3Q earnings on October 29,
the stock price dropped 42% in one day. If only all shorts would work out so
painlessly!

34
Chapter 7: When a Short Just Isn’t Working
The case studies I cited are all representative of the approach I use
whenever I am considering a short. I also have a graveyard for ideas that did not
work. In my career, sometimes companies I have been short get acquired. It hurts
the same way ripping off a band-aid hurts, but then the pain is over quickly.
Other times, I have been plain wrong. A company claims problems are temporary
and the company then backs up the claim with a strong quarter. I have never been
afraid to admit that I am wrong when the opposing evidence is clear and
convincing. These losses are easier to accept.
The situation is more difficult when the numbers still support the short
case, but Wall Street ignores the negative and embraces only the positive. This
occurs frequently. Sometimes, the market trend is so strong that bad news is
ignored by investors. This was the case in 2003, late 2006, and most of 2009-
2013. Sometimes, there are specific sectors to avoid. The Internet and technology
sector between October 1998 and March 2000 is a good example. Short sellers
had many opportunities to short successfully during that time period if they could
just resist the temptation to short egregiously overvalued and overhyped tech
stocks.
There are also battleground stocks that I ignore. Over the past decade, for
instance, Amazon has crushed more than one hapless short seller. I also feel it is

35
an uphill battle to focus on shorts that have well-known issues repeatedly ignored
by bulls. In the 1990s, America Online (AOL) repeatedly beat earnings
expectations in great part due to an accounting decision to capitalize a significant
percentage of marketing expenses. It was apparent to me at that time that member
growth was all AOL bulls cared about. Eventually, AOL announced a onetime
write down of these capitalized expenses. This decision basically validated the
short argument that earnings were being over-stated. Instead of tanking, AOL
bulls rejoiced and the stock surged. Investors concluded that future earnings
would be enhanced since these expenses would now never hit the income
statement.
For many, regardless if 100 or 100,000 shares are involved, it is much
easier mentally to initiate a short position than it is to cover a short position. For
me, it has always been naturally easier to take a loss than to ride a winner. Too
frequently I book small profits instead of displaying greater patience when a
short idea is just starting to work. For most people, however, I think taking a loss
is more difficult. I believe in using price strength to increase a short position, but
only if the position is less than full. Once the position is fully weighted, the worst
mistake is to keep increasing the size of the short position as the stock price rises.
I am more likely to reduce the position size or even cover entirely if it becomes
apparent that I under-estimated the desire by bulls to get long the stock. I simply
am more comfortable re-shorting when the set-up improves rather than riding out

36
the turbulence without a stop loss. There is no one correct way to implement risk
control, but it is extremely important to outline the factors that would cause one
to cover a short and then adhere to those rules.
I always imagined myself becoming the short selling world’s equivalent
of the legendary Philip Carret. Mr. Carret started one of the country’s first mutual
funds and had an investment career that lasted over 8 decades. I figured that only
someone with 8 decades of experience could really figure out how to play the
short game successfully. In my mind, short sellers age like dogs so 11 years of
actual short selling experience would logically equate to 77 years of long
experience. Ergo, it would take a little over a decade to duplicate on the short
side the equivalent long knowledge that Carret acquired over his life time. But
what I did not realize is that short selling is really a game where the rules
constantly change. It is not impossible to achieve success, but so few are
consistently successful. After all, there is a reason why Jack Schwager has only
interviewed one short seller (Dana Galante, a former research client of mine with
phenomenal trading instincts) in his Market Wizards series. Nonetheless, my
experience helped me gain insights into how to avoid some common pitfalls
associated with short selling. Unfortunately, I have had to learn each lesson the
hard way, sometimes more than once.

37
Chapter 8: The Increased Difficulty Level of Successful
Shorting
While the 21st century has had severe market declines in 2001, 2002, and
2008, profitable short selling year in and year out has become more difficult. One
major negative is the enormous growth in the hedge fund industry itself. The
ability to borrow certain stocks is more difficult than before. A bigger issue is the
tendency for many long/short funds to crowd into the same names. There are
many managers who are outstanding on the long side and therefore
understandably focus their attention on their long portfolios. As a result, some of
these hedge funds, which manage multi-billion dollar portfolios, often rely on the
same third party services for idea generation and/or frequently talk among
themselves or through the press about the same ideas.
Many long/short funds are individually disciplined regarding their short
positions, but individual discipline collectively often leads to much greater
volatility. For example, a long/short fund may limit a short position size to 1% of
capital, but for a $20.0 billion fund, that still represents a $200.0 million short
position. If the short position is in anything less than a large cap stock, covering
the position is not easy in even the best of times. Since so many funds are
catalyst-driven and/or use strict stop losses, there is often pronounced volatility

38
following earnings events and at obvious stop loss points such as moving
averages and/or new 52-week highs.
The implementation of Regulation FD has had a significant, albeit
unappreciated effect on short selling. On August 15, 2000, the SEC
adopted Regulation FD to address the selective disclosure of information by
publicly traded companies and other issuers. Regulation FD provides that when
an issuer discloses material nonpublic information to certain individuals or
entities—generally, securities market professionals, such as stock analysts, or
holders of the issuer's securities who may well trade on the basis of the
information—the issuer must make public disclosure of that information. In this
way, the new rule aims to promote full and fair disclosure. The regulation has
noble intentions, but has caused two interesting consequences.
One, the rule basically ensures that companies will add every
conceivable boiler plate warning to federal filings. Prior to Regulation FD, risk
factor disclosure in annual filings was sparse while virtually non-existent in
quarterly filings. In addition, prior to easy online access to federal filings (pre-
2000), investors had to order an investor packet by mail. As a result, federal
filings were read less frequently. Consequently, when there was a warning or risk
factor listed in a federal filing prior to regulation FD, it was a very important
piece of information. Since filings were not as widely read, it was possible for a
diligent short analyst to gain a very important investment edge.

39
The second consequence of Regulation FD is that by severing the unfair
flow of information between a company’s management and Street analysts, the
information vacuum raises the risk of unwelcome surprises. Perversely, though,
since managements no longer give formal earnings guidance, they no longer feel
compelled to issue as many earnings warnings announcements. Managements
have also learned that by issuing “soft earnings guidance” (i.e. wide ranges), they
can manage expectations and set a low bar each quarter that can be exceeded.
Further abetting management’s ability to manage expectations is that
there is no universal set of rules defining non-GAAP (also known as adjusted or
pro forma) earnings. Income statements reported based on GAAP (“Generally
Accepted Accounting Principles”) don't always reflect the ongoing performance
of a company’s underlying operations. As a supplement, companies frequently
report a second non-GAAP number that excludes items such as restructuring
charges, write-downs, R&D expenditures, M&A costs, stock compensation
expense, and goodwill amortization. The use of non-GAAP metrics is not a new
practice. Accounting professionals and government regulators have long been
concerned that the use of non-GAAP financial metrics has the potential mislead
investors and overstate earnings.
The Sarbanes Oxley Act of 2002 intended to limit the use of non-GAAP
by adding restrictions. Disclosure has improved, but management still has
enormous flexibility to make whatever adjustments it chooses. Street analysts

40
and analyst estimate clearinghouses such as First Call are compliant and basically
accept the non-GAAP earnings as the proper comparable to published estimates
even if frequently the same non-GAAP metrics were not used in original Street
estimates. Therefore, the comparison is not apples-to-apples. Enormous
importance is placed on quarterly earnings. Electronic trading creates an
environment which encourages instantaneous decision-making so the volatility
that surrounds earnings releases has become much greater in recent years. In a
strong market, this volatility more often than not resolves itself to the upside.
This causes shorts to cover in order to limit losses regardless if fundamentally not
much may have changed.

41
Chapter 9: Conclusion
There is no question that superior returns are achieved more easily from
the long side than the short side. Some long/short hedge funds like Greenlight
Capital and Pershing Square have become identified as “short sellers”. I have
always found it surprising that Greenlight’s founder, David Einhorn, is known as
a “short seller” when in fact his firm’s superior returns over the years are derived
overwhelmingly from long performance, not short selling. Greenlight and other
successful hedge funds have some of the brightest minds in the business and have
virtually unlimited resources to hire private investigators, lobby politicians, and
use the media to further their case, yet even they do not generally find the going
very easy. This is not to argue that short selling has no value or even that it is not
possible to make money on the short side. Short positions reduce portfolio
volatility and lessen drawdowns during market declines by hedging long
positions. In addition, short positions can be a standalone profit center that is
additive to overall performance. However anyone who wants to implement a
short selling strategy needs to understand that even professional short sellers do
not create great fortunes from the short side so one might as well formulate a
cohesive, simple-to-understand methodology that can be implemented both cost
and time effectively.

42
In sum, I have always practiced the craft with the knowledge that the
stock market has historically risen two-thirds of the time. Many short sellers have
strong opinions that the stock market is egregiously overvalued and they have
unshakable conviction in the short positions that they select. This mindset can
create large losses as the market can become even more overvalued. Bulls often
ignore rotten fundamentals longer than a short seller can stay with a position. I do
not have strong opinions on market direction or valuation. I prefer to focus on
process, including a strong appreciation for the necessity of risk controls. I am of
the opinion that that it is preferable to reduce exposure in companies that remain
fundamentally flawed if the alternative means greater volatility and/or suffering
large drawdowns. I believe that by adhering to a clearly defined methodology
that can be followed, an investor can use short selling both as a standalone profit
center as well as to hedge long positions.

43
Acknowledgements
I would like to acknowledge 4 individuals. First, my intern Josh Brilliant
who helped me organize this project. Second, Tim Nakagawa, my colleague on
Balance Sheet Watch and The Earnings Workout. He is a great analyst and a
good friend. Third, Marvin Kline from Logan Capital. Marvin helped me
immensely with editing. Finally, David Schroll, my partner in Waterloo
International Advisors. Together, we have been cleaning up after elephants for
over 14 years.
Disclaimer
All research reports referenced in this book were published between
1993 and 2012. They are historical, provided solely for educational purposes, and
have zero investment merit. No content provided in this book constitutes a
recommendation that any particular security, portfolio of securities, transaction
or investment strategy is suitable for any specific person and nothing in this book
should be construed as an offer to sell, a solicitation of an offer to buy, or a
recommendation for any security.