short-length dna biomarker for the detection …studentsrepo.um.edu.my/7964/6/thesis-asing.pdf ·...
TRANSCRIPT

SHORT-LENGTH DNA BIOMARKER FOR THE
DETECTION AND QUANTIFICATION OF MALAYAN BOX
TURTLE (CUORA AMBOINENSIS) MATERIALS IN FOOD
CHAIN AND TRADITIONAL CHINESE MEDICINES
ASING
INSTITUTE OF GRADUATE STUDIES UNIVERSITY OF MALAYA
KUALA LUMPUR
2017

SHORT-LENGTH DNA BIOMARKER FOR THE
DETECTION AND QUANTIFICATION OF
MALAYAN BOX TURTLE (CUORA AMBOINENSIS)
MATERIALS IN FOOD CHAIN AND TRADITIONAL
CHINESE MEDICINES
ASING
THESIS SUBMITTED IN FULFILMENT OF THE
REQUIREMENTS FOR THE DEGREE OF DOCTOR
OF PHILOSOPHY
INSTITUTE OF GRADUATE STUDIES
UNIVERSITY OF MALAYA
KUALA LUMPUR
2017

ii
UNIVERSITY OF MALAYA
ORIGINAL LITERARY WORK DECLARATION
Name of Candidate: ASING (I.C/Passport No:
Registration/Matric No: HHC120009
Name of Degree: Doctor of Philosophy (Ph.D.)
Title of Project Paper/Research Report/Dissertation/Thesis (“this Work”):
“SHORT-LENGTH DNA BIOMARKER FOR THE DETECTION AND
QUANTIFICATION OF MALAYAN BOX TURTLE (CUORA AMBOINENSIS)
MATERIALS IN FOOD CHAIN AND TRADITIONAL CHINESE MEDICINES”
Field of Study: BIOLOGY AND BIOCHEMISTRY
I do solemnly and sincerely declare that:
(1) I am the sole author/writer of this Work;
(2) This Work is original;
(3) Any use of any work in which copyright exists was done by way of fair dealing
and for permitted purposes and any excerpt or extract from, or reference to or
reproduction of any copyright work has been disclosed expressly and
sufficiently and the title of the Work and its authorship have been
acknowledged in this Work;
(4) I do not have any actual knowledge nor do I ought reasonably to know that the
making of this work constitutes an infringement of any copyright work;
(5) I hereby assign all and every rights in the copyright to this Work to the
University of Malaya (“UM”), who henceforth shall be owner of the copyright
in this Work and that any reproduction or use in any form or by any means
whatsoever is prohibited without the written consent of UM having been first
had and obtained;
(6) I am fully aware that if in the course of making this Work I have infringed any
copyright whether intentionally or otherwise, I may be subject to legal action
or any other action as may be determined by UM.
Candidate’s Signature Date:
Subscribed and solemnly declared before,
Witness’s Signature Date:
Name:
Designation:

iii
ABSTRACT
Malayan box turtle (Cuora amboinensis) (MBT) is a protected species in Malaysia and
prohibited (haram) animal species in Muslim foods and medicines. However, because of
its purported health benefits, its clandestine trades in black markets, especially for use in
tonic foods and traditional Chinese medicines (TCM) are quite rampant. The widespread
availability of commercial food items and TCM across Malaysia may offer the
opportunity of turtle product trafficking under the covert of halal brands, needing to
develop a convenient and reliable method both for the qualitative and quantitative tracing
of turtle materials in food chain and medicines. Several polymerase chain reaction (PCR)
assays have been proposed for the detection of MBT species under various routes but they
are based on long-length targets which break down under the state of decomposition,
making them unsuitable for the forensic detection in food chain, medicines and other
potential routes. To overcome this knowledge gap, for the first time, a short length DNA
target was developed for the qualitative and quantitative detection of MBT tissues by
conventional PCR, PCR-RFLP and SYBR green real-time PCR systems. It combined a
120 bp-site of the MBT mitochondrial cytochrome b gene and a 141bp-site of 18S rRNA
gene as the universal marker for the eukaryotes. The assay specificity was checked against
20 different species and biomarker stability was tested under various food processing
conditions, including boiling, autoclaving and micro oven heating under pure, admixed
and commercial food matrices. The limit of detection (LOD) of the conventional PCR
and PCR-RFLP assays was 0.0001 ng MBT DNA under pure state and 0.01% (w/w) MBT
meat under admixed and commercial matrices. In contrast, the LOD of the SYBR green
duplex PCR system was 0.00001 ng DNA and 0.001% (w/w) MBT meat under mixed
matrices. PCR amplified target was further authenticated by sequencing and restriction
digestion with Bfa1 endonuclease and distinctive fingerprints (72, 43 and 5 bp) were
obtained. The MBT target was further quantified by a duplex SYBR green real time PCR

iv
system consisting of MBT target and internal positive control, wherein the melting curve
clearly reflected two distinctive peaks at 74.63 ± 0.22 °C and 81.40 ± 0.31 °C for the
MBT and eukaryotic targets, respectively, under pure, admixed and commercial matrices.
The quantification limit (ng) was 0.00001for pure meat, 0.0030 ±0.00001 for binary
mixtures, 0.0021 ± 0.00008 for meatball, 0.0042 ±0.0037 burger and 0.0013 ±0.00006
frankfurter products. The analysis of 150 reference meat samples reflected 98.19 to
166.57 % target recovery, 92.23-98.15 % PCR efficiency and 0.001% LOD under various
matrices. A total of 183 commercial meat products were screened but no turtle
contamination was found. Finally, 153 and 120 TCM samples were surveyed by PCR-
RFLP and SYBR Green PCR and 40% and 23% of them were found to be MBT-positive
(0.00157 to 0.0612 ng/µL), respectively. Thus the methods were suitable for real-world
application and they confirmed the widespread speculation that MBT materials are widely
used in Chinese medicines and herbal desserts.

v
ABSTRAK
Kura-kura Kotak Malaya (Cuora amboinensis) merupakan spesies yang dilindungi di
Malaysia dan merupakan haiwan yang tidak halal di dalam makanan Muslim dan ubat-
ubatan. Walau bagaimanapun, disebabkan kelebihan kesihatannya, perdagangan haram
dalam pasaran gelap berleluasa, terutama penggunaannya dalam barangan makanan tonik
dan ubat-ubatan tradisional. Produk makanan komersial Cina dan ubat-ubatan tradisional
yang meluas di seluruh Malaysia mampu memberikan peluang pemerdagangan produk
kura-kura yang bertopengkan produk halal, menjadikannya keperluan untuk
membangunkan kaedah yang mudah dan boleh dipercayai bagi mengesan tisu kura-kura
dalam rantaian makanan dan ubat-ubatan. Beberapa tindakbalas rantai asai polimeras
(PCR) telah dicadangkan untuk mengesan spesies MBT menggunakan pelbagai cara
tetapi bersandarkan sasaran berjarak panjang yang terurai di bawah keadaan penguraian,
menjadikan kaedah-kaedah ini tidak sesuai untuk pengesanan forensik dan di dalam
pengesanan rantaian makanan, perubatan dan lain-lain kaedah-kaedah yang berpotensi.
Untuk mengatasi jurang pengetahuan ini, buat pertama kali, kami membangunkan sasaran
DNA berjarak pendek untuk pengesanan kualitatif dan kuantitatif tisu MBT oleh PCR
konvensional, PCR-RFLP dan sistem SYBR Green PCR masa nyata. Ia menggabungkan
120bp-tapak MBT gen mitokondria cytochrome-b dan 141bp-tapak gen 18S rRNA
sebagai penanda universal bagi eukariot. Kekhususan asai telah disemak dengan 20
spesies yang berbeza manakala kestabilan sasaran penanda bio telah diuji dalam keadaan
pengendalian makanan yang berbeza, termasuk pendidihan ekstrim, pengautoklafan dan
pemanasan ketuhar mikro di bawah matriks makanan tulen, campuran dan matriks
makanan komersial. Had pengesanan (LOD) PCR konvensional dan asai PCR-RFLP
adalah 0.0001 ng MBT DNA di bawah keadaan tulen dan 0.01% (w/w) daging MBT
untuk campuran dan matriks komersial. Sebaliknya, LOD sistem PCR SYBR Green
dupleks adalah 0.00001 ng DNA dan 0.001% (w/w) daging MBT dibawah matriks

vi
campuran. Sasaran PCR yang teramplifikasi telah disahkan melalui penjujukan DNA dan
pencernaan terbatas menggunakan Bfa1 endonuklase dan profil terbatas tersendiri (72,
43 dan 5 bp) telah diperolehi. Sasaran MBT telah dikuantifikasi melalui system PCR masa
nyata SYBR Green yang terdiri daripada sasaran MBT dan kawalan internal positif, di
mana keluk lebur jelas menunjukkan dua puncak tersendiri pada 74.63 ± 0.22 °C dan
81.40 ± 0.31 °C untuk MBT dan sasaran eukariot, masing-masing, di bawah matriks tulen,
campuran dan komersial. Had kuantifikasi (LOD) (ng DNA) adalah 0.00001 untuk daging
tulen, 0.0030 ±0.00001 untuk campuran binari, 0.0021 ± 0.00008 untuk bebola daging,
0.0042 ±0.0037 burger dan 0.0013 ±0.00006 produk frankfurter. Analisis 150 sampel
daging rujukan menunjukkan 98.19 ke 166.57% dapatan semula sasaran, 92.23-98.15%
keefisienan PCR dan 0.001% LOD dibawah pelbagai matriks. Sejumlah 183 produk
daging komersial disaring namun didapati tiada sampel terkontaminasi dengan kura-kura.
Akhirnya, 153 dan 120 sampel ubat-ubatan tradisional Cina diselidik meggunakan PCR-
RFLP dan PCR SYBR Green dan 40% dan 23% daripadanya didapati positif MBT
(0.00157 ke 0.0612 ng/L), masing-masing. Jadi, kaedah-kaedah ini sesuai diaplikasikan
dalam dunia sebenar dan mengesahkan spekulasi bahawa bahan MBT digunakan secara
meluas dalam perubatan Cina dan pencuci mulut herba.

vii
ACKNOWLEDGEMENTS
All the praise and admiration to Almighty God, the most gracious, the most kind
and merciful, who enable me in carrying out my research work presented in this
dissertation.
First of all, I would like to express my heartfelt gratitude to my supervisors,
Associate Professor Dr. Md. Eaqub Ali and Late Professor Dr. Sharifah Bee Abd
Hamid for their utmost guidance, encouragement and continuous support throughout my
research journey. Their willingness to sacrifice their precious time to monitor and guide
me during the study period is highly appreciated. Indeed, my exclusive thanks go to my
beloved parents and my teachers Professor Dr. Dwaipayan Sikdar (BMB-CU-BD) and all
siblings for their encouragements, suggestions and affection during this research study.
I also would like to extend my deepest gratitude to Prof. Dr. Jennifer Ann Hari
Krishna for her help to use the facilities in CEBAR, IPPP, University of Malaya. Special
thank goes to Prof. Dr. Shuhaimi Mustafa, Razzak, Raifan Rashid, Dr. Mahafujur
Rahman, Al Amin who shared their valuable knowledge for my academic research. I am
very thankful to have Motalib Hossain, Nasir, Nina, Azad, Sharmin (Shuci), Sharmin
(Bonni), Ismat, Celvi, Lavaniya as group members. My relatives, friends, and other
research mates, Mrs. Athen, Khing Maung Suman Mojumder, Ashok, Sabuj, Lathen
Maung, Uthing Maung, Dr. Ziaul Karim, Ibrahim Khalil, Dr. Emy Marlina, Dr. Rasel
Das, Subrata and Amit thank you all for making my adventurous PhD journey more
colorful, enjoyable and full of laughter. Especial thanks to Md. Ibrahim Khalil for his
support and encouragement. I also would like to thank all NANOCAT staff and members
for being there when I need help regarding my study. At the end, I would like to express
appreciation to lovely wife Asan King and son Uthant Meing for being always with me
during my hard times, your advice and positive words are part of my success.
Thank you

viii
TABLE OF CONTENTS
ABSTRACT .................................................................................................................. III
ABSTRAK....................................................................................................................... V
ACKNOWLEDGEMENTS ........................................................................................ VII
TABLE OF CONTENTS .......................................................................................... VIII
LIST OF FIGURES .................................................................................................. XIII
LIST OF TABLES ...................................................................................................... XV
LIST OF SYMBOLS AND ABBREVIATIONS ................................................... XVII
CHAPTER 1: INTRODUCTION .................................................................................. 1
1.1 General Background ................................................................................................ 1
1.2 Study Rationale ........................................................................................................ 5
1.3 Current Detection Methods and Challenges ............................................................ 7
1.4 Objectives of the Research ...................................................................................... 8
1.4.1 General objective..................................................................................... 8
1.4.2 Specific objectives................................................................................... 8
1.5 Thesis organization .................................................................................................. 9
CHAPTER 2: LITERATURE REVIEW .................................................................... 11
2.1 Animal Materials in Foods Chain .......................................................................... 11
2.1.1 Meat .. .................................................................................................... 12
2.1.2 Animal proteins ..................................................................................... 14
2.1.3 Animal fats ............................................................................................ 16
2.1.4 Vitamin and minerals ............................................................................ 17
2.2 Animal Materials in Pharmaceuticals .................................................................... 18
2.3 The Need for Animal Material and Turtle Authentication .................................... 21

ix
2.4 Religious Prohibition and Social Factors............................................................... 23
2.5 Regulatory Laws .................................................................................................... 26
2.5.1 Malaysia food act 1983 ......................................................................... 27
2.5.2 The criteria and justification of Malaysia food act 1983 ...................... 28
2.5.3 Malaysian standard ................................................................................ 29
2.5.3.1 Layout design ............................................................ 30
2.5.3.2 Flow of product processing ....................................... 30
2.5.3.3 Conditions ................................................................. 30
2.5.3.4 Slaughtering............................................................... 30
2.5.4 U.S. legislations..................................................................................... 30
2.5.4.1 Adulterated foods ...................................................... 31
2.5.4.2 Misbranded food........................................................ 31
2.5.5 European Commission legislations ....................................................... 32
2.6 Turtle Species in Foods and Pharmaceuticals........................................................ 33
2.7 Malayan Box Turtle and Availability .................................................................... 37
2.8 Existential Threats ................................................................................................. 40
2.9 Routes of Trafficking ............................................................................................. 41
2.10 Current Species Detection Methods ...................................................................... 44
2.11 Protein based Detection Techniques ...................................................................... 46
2.12 Organ Specific Protein Detection Technique ........................................................ 46
2.13 Detection of Species Specific Protein by ELISA .................................................. 47
2.14 Limitation of Protein Markers for Species Detection ............................................ 48
2.15 DNA based Detection ............................................................................................ 49
2.16 Cytochrome b (Cytb) Gene, A Potential Candidate Mitochondrial Gene for
Species Specific DNA Biomarker ......................................................................... 50

x
2.17 Species-Specific PCR Assay and Short-Length DNA Amplicon .......................... 52
2.18 DNA Sequencing ................................................................................................... 54
2.19 PCR- Restriction Fragment Length Polymorphisms (RFLP) Technique .............. 55
2.20 Real-Time PCR Assay ........................................................................................... 57
2.21 Methods for Malayan Box Turtle Detection .......................................................... 59
CHAPTER 3: MATERIALS AND METHODS ......................................................... 61
3.1 Sample Collection and Preparation........................................................................ 61
3.2 Preparation of Binary and Ternary Meat Mixtures for Specific PCR and PCR-
RFLP Assay ........................................................................................................... 65
3.3 Sample Preparation for Real Time PCR Assay ..................................................... 65
3.4 Preparation of Chicken and Turtle Meatball for Specific PCR Assay .................. 66
3.5 Preparation of Reference Meat Products for PCR-RFLP and Real Time PCR
Assay .................................................................................................................... 67
3.6 Sample Preparation for Target DNA Stability Test ............................................... 70
3.7 DNA Extraction of Animals and Plants Samples .................................................. 70
3.8 DNA Extraction of Traditional Chinese Medicines (TCM) .................................. 70
3.9 Design of Oligonucleotide Primers........................................................................ 72
3.10 Specific PCR Assay Optimization ......................................................................... 73
3.11 DNA Sequencing and Data Analysis ..................................................................... 74
3.12 Sensitivity Tests for Specific PCR and PCR-RFLP Assay ................................... 75
3.13 Comparison of Target DNA Sensitivity and Stability ........................................... 76
3.14 Enzymatic Digestion for PCR Product Authentication with PCR-RFLP Assay ... 76
3.15 PCR-RFLP Analysis of Admixed and Processed Samples ................................... 77
3.16 SYBR-Green Duplex Real Time PCR Assay Optimization .................................. 77

xi
3.17 Melting Curve Analysis of SYBR Green Real Time PCR Assay ......................... 78
3.18 Construction of Standard Curve ............................................................................ 78
3.19 Amplification Efficiency (E %) ............................................................................. 79
3.20 Limit of Detection (LOD) and Quantification (LOQ), Repeatability and Assay
Robustness in the Real Time PCR Technique ....................................................... 80
CHAPTER 4: RESULTS AND DISCUSSION ........................................................... 82
4.1 DNA Extraction .................................................................................................... 82
4.2 Development of Short DNA Biomarker and Malayan Box Turtle Specific PCR
Assay .................................................................................................................... 84
4.3 Sensitivity Test for Pure, Admixed and Commercial Meatballs and Comparison
Study for Species Specific PCR assay ................................................................... 96
4.4 Effect of Processing Treatments and Comparison Study for Species Specific
PCR Assay ........................................................................................................... 100
4.5 Target Authentication by PCR-RFLP Assay ....................................................... 102
4.6 Authentication of Limit of Detection (LOD) Assay by PCR-RFLP Assay ......... 106
4.7 Validation of Stability Assay by PCR-RFLP Assay ............................................ 110
4.8 Evaluation of Meat Products and Commercial Products Screening .................... 114
4.9 Product Authentication by PCR-RFLP Assay ..................................................... 118
4.10 Traditional Chinese Medicines Screening and Validation by PCR-RFLP Assay121
4.11 Optimization of SYBR Green Duplex Real-Time PCR System ......................... 128
4.12 Selectivity of the Real-time PCR Assay .............................................................. 129
4.13 Limit of Detection (LOD) and Quantification (LOQ) and Efficiency of Real
time PCR Assay ................................................................................................... 131
4.14 Meat Product Analysis ......................................................................................... 146
4.15 Quantitative Screening of Traditional Chinese Medicines .................................. 147
CHAPTER 5: CONCLUSION AND RECOMMENDATION FOR FUTURE
WORK ................................................................................................................ 153

xii
5.1 Conclusion ........................................................................................................... 153
5.2 Recommendations for Future Work .................................................................... 156
REFERENCES ............................................................................................................ 158
APPENDIX A .............................................................................................................. 185
Front Pages of Publication ............................................................................................ 185
APPENDIX B............................................................................................................... 188
Conferences .................................................................................................................. 188
APPENDIX C .............................................................................................................. 190
Ethical Clearance Letter ................................................................................................ 190

xiii
LIST OF FIGURES
Figure 2.1: Global meat consumption per capita ........................................................... 14
Figure 2.2: Schematic diagram of animal sources of therapeutic agents. ....................... 20
Figure 2.3: Wild turtle meat and egg soup are openly sold at restaurant in Singapore... 35
Figure 2.4 Turtle plastron are sold in traditional Chinese medicine shops in China. ..... 37
Figure 2.5: Route map of illegal trade............................................................................. 44
Figure 2.6: Mammalian mitochondrial genome. ............................................................. 52
Figure 4.1: Evolutionary distance between Malayan box turtle and reptiles by neighbour
joining method................................................................................................................. 93
Figure 4.2: Specificity of Malayan box turtle specific primers ....................................... 94
Figure 4.3: Target (MBT) PCR product (120 bp) DNA sequence and its corresponding
eletropherogram .............................................................................................................. 95
Figure 4.4: PCR sensitivity test with the newly designed 120 bp target and previously
published primers ............................................................................................................ 98
Figure 4.5: Specificity and sensitivity test of the newly designed primer ...................... 99
Figure 4.6: Stability test of the newly designed (120 bp) and published shortest (165bp)
targets ............................................................................................................................ 102
Figure 4.7: In Silico digestion of MBT species specific PCR (120 bp) product with Bfa1
restriction enzyme ......................................................................................................... 104
Figure 4.8: Sensitivity analysis of pure, binary and ternary admixtures. ...................... 109
Figure 4.9: Sensitivity analysis under pure, binary and ternary admixtures using MBT
specific 120 bp .............................................................................................................. 110
Figure 4.10: Stability analysis of the MBT-specific target DNA (120 bp) under boiling,
autoclaving and microwave cooking. ............................................................................ 113
Figure 4.11: Stability analysis of the MBT-specific target DNA (120 bp) under boiling,
autoclaving and microwave cooking are shown in electropherogram are demonstrated by
respective labels. ........................................................................................................... 114
Figure 4.12: MBT meat screening in model meat products. ......................................... 117
xiv
Figure 4.13: MBT meat analysis in model meat products by PCR-RFLP assay, showing
120 bp PCR product before and after Bfa1 digestion.................................................... 118
Figure 4.14: Traditional Chinese medicines analysis.................................................... 123
Figure 4.15: Screening of traditional Chinese medicines by PCR-RFLP assay. .......... 124
Figure 4.16: Specificity of Malayan box turtle (MBT) specific primers against 20
different species............................................................................................................. 129
Figure 4.17: Standard (a) calibration curves for pure DNA(100 ng to 0.00001 ng) and (b)
for binary admixtures DNA(10 ng to 0.001 ng) and melting (c and d) curves for binary
admixtures. ................................................................................................................... 135
Figure 4.18: Standard (a) and melting (b-g) curves for chicken (b, c, d) and beef (e, f, g)
meat products. ............................................................................................................... 138
Figure 4.19: Relationship between the reference and recovery value (%)…………….146

xv
LIST OF TABLES
Table 2.1: Asian box turtles – An overview.................................................................... 39
Table 2.2: Food mislabeling and its abundance in meat and meat products ................... 45
Table 3.1: Information of collected samples .................................................................. 63
Table 3.2: Ingredients used in meatball preparation ....................................................... 67
Table 3.3: Formulation of ready-to-eat model meat products ......................................... 69
Table 3.4: Oligonucleotide primers used in this study .................................................... 73
Table 4.1: The mismatch comparison of the Malayan box turtle specific amplicon (120bp)
against tested species and eight Cuora species ............................................................... 90
Table 4.2: he mismatch comparison of the eukaryotic internal control (18S rRNA gene)
specific amplicon (141bp) against tested species and eight Cuora eight species ........... 91
Table 4.3: Pairwise distances of the Malayan box turtle (MBT) specific amplicon (120
bp) site of cytochrome b gene against corresponding sites of 29 different species by
maximum composite likelihood method ......................................................................... 92
Table 4.4: Analysis of binary, ternary and commercial meat products using the ......... 100
Table 4.5: In silico analysis of the MBT-specific primers against twenty study species
eight species of the Cuora genus with Bfa1-restriction sites ........................................ 105
Table 4.6: Analysis of reference and commercial meat products using MBT specific PCR
assay .............................................................................................................................. 120
Table 4.7: Analysis of traditional Chinese medicines using MBT specific PCR assay 125
Table 4.8: Specificity and Ct values of the SYBR Green duplex real time PCR assay 131
Table 4.9: Repeatability and recovery of MBT targets in binary admixture (MBT-beef
and MBT-chicken) (w/w%) .......................................................................................... 137
Table 4.10: Repeatability and recovery of MBT targets in reference meat products using
Yeastern genomic DNA extraction kit .......................................................................... 140
Table 4.11: Repeatability and recovery of MBT targets in reference meat products using
NucleoSpin® extraction kit ........................................................................................... 142
Table 4.12: PCR efficiency and limit of detection (LOD) and quantification (LOQ) of
MBT specific SYBR Green PCR for the admixed and reference meat products of chicken
and beef origins ............................................................................................................. 144

xvi
Table 4.13: Average recovery value of the real time PCR using 150 reference meat
products samples ........................................................................................................... 145
Table 4.14: Analysis of traditional Chinese herbal jelly powder using MBT specific PCR
assay .............................................................................................................................. 151

xvii
LIST OF SYMBOLS AND ABBREVIATIONS
$ : Dollar
% : Percent
/ : Prime
°C : Centigrade
µg : Microgram
µL : Microliter
µM : Micromolar
≥ : Greater than or Equal to
≤ : Less than or Equal to
± : Plus-Minus
® : Registered Sign
A : Adenine
A260/280 : Ratio of UV Absorbance at 260 nm to 280 nm
ABI : Applied Biosystems
ATP 6 : ATPase Subunit 6
BLAST : Basic Local Alignment Search Tool
BBC : British Broadcasting Cooperation
bp : Base Pairs
C : Cytosine
CE : Capillary Electrophoresis
CITES :
Convention on International Trade in Endangered Species of Wild
Fauna and Flora
COI : Cytochrome c Oxidase Subunit I
Cq : Quantification Cycle

xviii
Ct : Threshold Cycle
Cyt b : Cytochrome b
DBKL : Dewan Bandaraya Kuala Lumpur
DR : Daily Requirement
dH2O : Distilled Water
D-loop : Displacement Loop
DNA : Deoxyribonucleic Acid
dNTP : Deoxyribonucleoside Triphosphate
ds-DNA : Double Stranded- Deoxyribonucleic Acid
E (%) : Amplification Efficiency
EC : European Commission
Eq : Equation
ELISA : Enzyme-Linked Immunosorbent Assay
E-nose : Electronic Nose
Euk : Eukaryotic
FAO : Food and Agricultural Organization
F : Forward
FTIR : Fourier Transformed Infrared
g : Gram
G : Guanine
GC-MS : Gas Chromatography-Mass Spectrometry
h : Hour
HPLC : High Performance Liquid Chromatography
IDT : Integrated DNA Technology
LINE : Long Interspersed Nuclear Element
LC/MS : Liquid Chromatography Mass Spectroscopy

xix
LOD : Limit of Detection
LOQ : Limit of Quantification
Ltd : Limited
MBT : Malayan Box Turtle
mg : Milligram
MgCl2 : Magnesium Chloride
Min : Minute
ml : Milliliter
mM : Millimolar
Mt : Mitochondrial
mDNA : Mitochondrial Deoxyribonucleic Acid
NCBI : National Center of Biological Information
NADH2 : NADH Dehydrogenase Subunit 2
ND5 : NADH Dehydrogenase Subunit 5
ND6 : NADH Dehydrogenase Subunit 6
Ng : Nanogram
nt : Nucleotide
O.D : Optical Density
PAGE : Polyacrylamide Gel Electrophoresis
PDCAAS : Protein Digestibility-Corrected Amino Acid Scores
PCR : Polymerase Chain Reaction
PCR-
RFLP
: Polymerase Chain Reaction- Restriction Fragment Length
Polymorphism
R : Reverse
pg : Picogram
psi : Pounds Per Square Inch

xx
rpm : Rotations Per Minute
RNA : Ribonucleic Acid
R2 : Regression Coefficient
SA : Suitable Amount
s : Second
T : Thiamine
Taq : Thermus aquaticus
TCM : Traditional Chinese Medicine
Tm : Melting Temperature
UV : Ultraviolet
WHO World Health Organization
W/W : Weight/Weight

1
CHAPTER 1: INTRODUCTION
1.1 General Background
Nowadays consumers like to know the ingredients of food and medicine which
they are purchasing and consuming from the food court, road side restaurants, medicine
shops and supermarkets. A list of factors including lifestyles (e.g. vegetarianism and
organic food), diet (e.g. calories and nutritional value), hazardous health issues (e.g.
toxins and allergens), and religious and social factors are bringing variation in food prices
and increasing the rate of adulteration incidents in food medicine and personal care
products (Fajardo at el., 2010). Unlisted or mis-description, false labeling and/or
fraudulent ingredients in food products, medicines and cosmetics are getting serious issues
to health, business, wildlife and religious practices. Due to scientific breakthrough and
innovation in food processing and packaging technologies, the substituted materials look
very similar to the original materials and thus it is becoming rather challenging to
differentiate the false ingredients from the original ones (Ghovvati et al., 2009). Thus
ensuring food safety from the farm-to-fork through rigorous market monitoring is
becoming increasingly difficult (Shackell, 2008). Recently, the British Broadcasting
Corporation (BBC) reported that approximately 20-70% meat products (sausage, ground
meat, meat balls, deli meats, and dried meats, burgers) in Mexico, Turkey, and African
countries, 8% in the UK and 19.4% in the USA are mislabeled. (Ayaz et al., 2006; Brown,
2013; Cawthorn et al., 2013; D’Amato et al., 2013; Özpınar et al., 2013). Similarly,
research groups have found 92% adulteration/contamination in traditional Chinese
medicines in Australia, 68% in North America (Newmaster et al., 2013) and 4.2% in China
(Han et al., 2016).

2
Recently some unexpected alien species, such as, rat, cat and dog meat has entered
into the food chain ( Fang et al., 2016), raising concern about the validity of the traditional
food authentication techniques and target analytes because many of them are not
considered in a typical food detection test. These are really alarming to the security of
public health, consumers’ religious faith, fair-trade economy, endangered wildlife and
biodiversity (Schoppe, 2008). The mesmerizing belief of certain health benefits such as
the distinctive flavor, high protein and low fat and cholesterol, the absence of health-
threatening anabolic steroids in bush meat are posing special threats to wildlife and
encouraging their overhunting and exploitation to harness health benefits (Hoffman &
Wiklund, 2006; La Neve, Civera, Mucci, & Bottero, 2008). The bones, shells, skins and
eggs of certain endangered species, such as Malayan box turtles, are believed to possess
active healing attributes and invigorating elements that prolong youth and sexual life
(Graham-Rowe, 2011; Hempen & Fischer, 2009). In the recent decades, the uses of
traditional Chinese medicine (TCMs) which are being taken in conjunction with, or as an
alternative to conventional Western medicine has greatly increased because of their
natural attributes that are believed to give natural cures to many complex diseases (Ernst,
2004; Houghton & Mukherjee, 2009; Wang et al., 2005). The increasing popularity of
TCM products has witnessed a dramatic turnover of US$ 60 billion in the international
markets, posing an unexpected threat to wildlife (WHO, 2002).
The market demand for wildlife for food, medicine and cosmetic applications has
greatly surpassed their natural availability and placing a restriction on their legal trade has
just prompted their clandestine turnover in the illegal markets. These actions are
deteriorating the ecosystems and causing the extinction of vulnerable species from the
world map. The perceived efficacy of TCM is largely based on long-standing beliefs
(Still, 2003) as the therapeutic benefits of TCM products have been validated for only a
few cases (Sahoo et al., 2010). The Chinese herbal/traditional medicines often contain

3
numerous different plant and animal-derived products that combined together, exert a
synergistic outcome (Xie et al., 2006; Yang, 2010). Despite having a weak scientific basis,
the uses of traditional medicines and its supplements have dramatically increased and
about 80% of the world population rely on them for primary healthcare, especially in the
developing countries and uneducated societies where traditional faiths prevails in
everyday activities. Between 2000 and 2005, the market value of traditional medicines
has increased more than 3 fold from US$ 385 million in 2000 to US$ 1.29 billion in 2005
(Jayaraj, 2010).
Due to the proprietary nature of TCM manufacturing coupled with a lack of strict
industry regulation, the biological origins or contents of TCM are not appropriately
labeled or determined, raising questions about its quality, efficacy and safety standards
(Heubl, 2010; WHO, 2002). Under these circumstances, the widespread uses of these
medicines are a great threat to the healthcare systems since its associated health risks are
largely unknown. Undeclared or misidentified TCM ingredients and adulterants can pose
serious health risks to consumers (Gilbert, 2011; Sakurai, 2011); these include but are not
limited to allergens (Ernst, 2000), plant toxins (Still, 2003), heavy metals, such as
mercury, lead, copper and arsenic ( Ernst, 2002), and pharmaceutically active compounds
of undetermined concentration that may lead to toxicity after prolonged intake (Ernst,
2004). An Australian study found that high rates of adulteration (92%), substitution and
mislabeling are rampant in TCMs, wherein the undeclared animal materials and heavy
metal ingredients were either illegal or potentially hazardous to the consumers (Coghlan
et al., 2015; Ernst & Coon, 2001). In the early 1990s, the misidentification of the toxic
herb, Aristolochia fangchi, in the anti-inflammatory agent for Stephania tetrandra led to
kidney failure and subsequent development of cancer in the urinary system of more than
100 women in Belgium (Gilbert, 2011).

4
Turtle species are natural scavengers of waste materials and hosts of several
microbes and heavy metals. The health risks associated with the consumption or contact
of turtle meat, eggs and shells include infections caused by bacteria (such as Salmonella
spp. and Vibrio spp.), parasites (such as Spirometra, Trichinella, Gnathostoma, and
Pentastomids), and various type of biotoxins such as lyngbyatoxins, cyanotoxins,
cytotoxins, haemotoxins, mycotoxins, and neurotoxins (Magnino et al., 2009). Moreover,
it is a sensitive social and religious issue as the consumption of turtle-derived materials is
prohibited in certain religions such as Islam (Ali et al., 2015). According to the halal
definition, meat of the domestic animals having a split hoof like cattle, buffalo, sheep,
goat and camel are allowed for consumption by Muslims but meat from a carnivorous
animal like cat, dog, pork and some wild life such as wolf, hyena, lion, tiger and
turtle/tortoise, and crocodile is prohibited (Khattak et al., 2011). Global halal food
markets are rapidly expanding because of amongst others, its special health and religion
compliant attributes (Ali et al., 2014), wherein, the current turnover has reached to 1.8
billion dollars (Anonymous, 2014). Ready-made foods such as burgers, meatballs, pizzas,
hot dogs, sandwiches, soups, cookies, candies, creams and numerous others are becoming
increasingly popular among the working class and teenagers in worldwide because of
their convenient features of ready-made availability in road-side restaurants and groceries
(Ali et al., 2012).
In addition to TCM, there is constantly a growing tendency of mislabeling or
adulteration in commercial meat products as well as trafficking of endangered species
meat and their organs through popular meat products presented under the halal logo to
withstand the competitive markets. In January 2013, the Food Safety Authority of Ireland
(FSAI) found the presence of horse and pig DNA in meat products that were labeled to
contain only beef. Out of 27 beef burgers labeled as 100% beef, 10 (37%) were tested
positive for horse DNA and 23 (85%) were positive for pig DNA. Testing of raw

5
ingredient was performed and traces of horse DNA were detected in several batches
(O'Mahony, 2013). In South Africa, 139 processed meats including minced meats, burger
patties, deli meat and sausages were tested for mislabeling with results determining that
95 samples (68%) were mislabeled, and contained animal species not listed on the
package (Cawthorn et al., 2013). The samples were purchased from four provinces that
represent the most highly populated provinces in South Africa.
Since adulterant meats are typically less costly than higher priced declared meat,
it often returns higher profit and encourages the industry to do it. Another possible reason
might be the unintentional contamination that might come from sharing the same
equipment and its improper cleaning while multiple meat species are handled. Sausages,
burger, patties, meatball and deli meats are among the most common mislabeled meat
products because of the difficulty in discriminating mixed species in ground meats by
visual means alone (Cawthorn et al., 2013; Sentandreu & Sentandreu, 2014). Thus there
is a need of a reliable method that allows the correct identification of MBT in processed
meat products and TCM.
1.2 Study Rationale
Turtle species are especially vulnerable and 3% of them are already extinct, 9%
critically threatened, 18% threatened and 2% are at risk. In Asian regions, 1% of turtles
are extinct, 20% are critically endangered, 31% are endangered and 25% are vulnerable
(Fund, 2002). Malayan box turtle (MBT) belongs to the Cuora genus, which encompasses
a total of 12 turtle species, all of which are critically endangered (Spinks et al., 2012). It
is a widely distributed turtle species in Asia, including Bangladesh, India, Malaysia,
Myanmar, Thailand, Vietnam Laos, Philippine, Singapore, Cambodia and Indonesia
(Schoppe, 2008c), and it has been listed in the vulnerable category in Appendix II of the
Convention on International Trade in Endangered Species of Wild Fauna and Flora

6
(CITIES) and in the IUCN due to its overexploitation in foods, pets and traditional
medicines (Chen et al., 2009a). A large number of this species are hunted by local
indigenous people such Orang Asli in Peninsular Malaysia, Bedayuh and Iban in
Sarawak, and ethnic Chinese community for consumption whilst some are also exported
illegally to Europe and North America as pets, and used in China as foods and traditional
medicines (Schoppe, 2008c). Turtle shells are highly exploited in TCM markets in East
Asian countries especially in China and Taiwan, as it is believed that turtle shells provide
analgesic and antipyretic medicinal effects as well as being seen as rich nutritional value
sources of protein, gelatin, calcium and potassium in Chinese Materia Medica. Each year
hundreds metric tonnes of turtle shells including Cuora species shells are exported to
main land China from Southeast Asian countries either legally or illegally (Lo et al.,
2006). Additionally, various food items such as soup, gel, pills and capsules are prepared
with tortoise shells and sold widely in the East Asian countries ( Hsieh et al., 2008).
To protect them from illegal exploitation, the Malaysia government banned export
of all Malaysian native turtle including Malayan box turtle from Peninsula Malaysia and
eastern Malaysia (Sabah and Sarawak state) since 2005 (Schoppe, 2008c) but importing
countries (China and Singapore) reported the import of 33,969 individuals and 390 kg of
plastron from Malaysia. In 2006, more than 21,884 Malayan box turtle were illegally
exported to China, Hong Kong and Singapore from Malaysia (Schoppe, 2008b) and
another report mentioned that more than 20,000 turtle species were exported to the East
Asian countries from Malaysia in 2008 (Nijman, 2010). The Malaysian Customs
Department seized 4.3 tonnes of illegally trafficked reptiles, including fresh water turtles,
lizards, snake and tortoises; the illegal shipment was seized at the Malay–Thai border in
December 2010 (Traffic, 2010), which reflects the fact that the illegal trade of reptiles is
still rampant (Felbab-Brown, 2011). These actions are definitely deteriorating the
ecosystems and causing the extinction of vulnerable species from the world map.

7
1.3 Current Detection Methods and Challenges
The current detection methods for food and medicinal products’ authentication
are numerous and they are mainly based on DNA and protein biomarkers (Nicolai et al.,
2009; Coghlan et al., 2015). Morphological diagnostic traits do not work when products
are degraded or highly treated making the microscopic tools obsolete for food forensic
studies (Nejad et al., 2014). Protein and lipid-based species detection schemes are
hopeless as these biomarkers are easily modified during processing treatments, providing
misleading information about the source materials (Murugaiah et al., 2009). Initially,
many tests were directed towards the identification of protein fractions in foods using
isoelectric focusing and ELISAs (Bottero & Dalmasso, 2011). However, these techniques
are gradually proving less effective due to low specificity under complex matrices and
vigorous processing, such as chilling, salting, seasoning and heating which induces
marked structural modification of proteins (Dooley et al., 2004). Protein-based
approaches are particularly ineffective for TCM authentication because TCM
preparations involve decoction and some excipients after a series of processing such as
cooking, drying and stewing that significantly denature or degrade protein molecules,
rendering them unidentifiable.
On the other hand, DNA-based species identification schemes are reliable and
recently several DNA based methods, such as PCR–DNA sequencing (Lo et al., 2006),
PCR-restriction fragment length polymorphism (PCR-RFLP) (Moore et al., 2003), and
randomly amplified polymorphic DNA (RAPD) (Saez et al., 2004), have been
documented for the detection of MBT (Cuora amboinensis) and other turtle species.
However, all these reported methods involve very long lengths of target amplicons that
break down during food processing treatments or under the state of decomposition such
as found during the natural decomposition of the carcasses. Moreover, there was no found

8
document on quantitative detection of Malayan box turtle materials in foods and
medicinal products. Additionally, remarkable research gaps were also found on assay
sensitivity, stability and biomarker validation under various processed samples as well as
validated assay with commercial food products screening. To overcome these limitations,
for the first time this paper develops a very short-amplicon-length PCR assay (120 bp)
for the quantitative detection of Malayan box turtle meat in raw, processed and mixed
matrices, and experimental evidence is produced that such an assay is not only more stable
and reliable but also more sensitive than those previously published. Since the
mitochondrial genes are present in multiple copies (Rojas et al., 2011), if the target
biomarkers are developed from a site of mitochondrial genes, assay reliability would be
greatly increased as it is highly unlikely that all copies of the gene would be degraded
together, even under the compromised state. Inclusion of an endogenous positive control
would effectively eliminate the chances of any false negative detection (Sobhy & Colson,
2012). Authenticity of the PCR targets could be verified by restriction fragment-length
polymorphism (RFLP) analysis and handling errors could be eliminated or reduced using
an automated system.
1.4 Objectives of the Research
1.4.1 General objective
The objective of the present study is to develop a short-length DNA biomarker for
the detection and quantification of Malayan box turtle (Cuora amboinensis) materials in
the food chain and traditional Chinese medicines using conventional and Real-Time PCR
techniques.
1.4.2 Specific objectives
(a). To identify and characterize short-length DNA biomarker targeting multicopy
mitochondrial DNA of Malayan box turtle.

9
(b). To optimize and validate a conventional PCR and Lab on a Chip based PCR–
RFLP system for the qualitative detection of Malayan box turtle material in foods and
traditional Chinese Medicine.
(c). To develop and validate a SYBR green duplex qPCR assay for the quantitative
detection of Malayan box turtle in the food chain and traditional Chinese medicines.
1.5 Thesis organization
This thesis consisted of five (5) chapters namely (1) introduction, (2) literature
review, (3) methodology, (4) results and discussion and (5) conclusion and
recommendation
Chapter 1: This chapter consists of current authentication issues that are related
to food and medicinal products, especially on adulteration, mislabeling in the food chain
and traditional medicinal preparations and the negative impact in health and biological
conservation. It also briefly presents currently available meat authentication techniques,
significance of using the mt- gene as a target, research gaps and study objectives.
Chapter 2: This chapter critically presents the current state of knowledge about
the abundance and the authentication of animal materials in the food chain and medicinal
products. This literature review chapter specifically emphasizes the turtle population,
their smuggling routes, risks in the food chain and medicines and biodiversity protection.
Chapter 3: This chapter describes the methodologies and materials that are
adapted to fulfill the scopes of the work and research targets. The materials, procedures,
equipment, instruments, bioinformatics tools used for designing a biomarker, in-silico
analysis of restriction sites and experimental works are systematically presented. The
details of primer design, species selection, specificity, sensitivity, stability, meat product

10
formulation under various matrices, commercial meat product and traditional medicine
screening procedure are stated as well.
Chapter 4: This chapter consists of research findings and discussions along with
the significance of the studies that were performed for the identification of Malayan box
turtle species in foods and medicines.
Chapter 5: This final chapter summarizes the overall findings of the research and
recommendations for future work.

11
CHAPTER 2: LITERATURE REVIEW
2.1 Animal Materials in Foods Chain
The animal contributions into the human food chains are huge and probably one
of the main catalysts for a mutual set of interactions between animals and humans for
millions of years (Shipman, 2010). According to Henry Bunn, an anthropologist of the
Wisconsin University, early human started to eat meat more than two million years ago
(Wrangham, 2013). This historical evidence was reported after the successful analysis of
carcasses of antelopes, gazelles and wildebeest left behind by Homo habilis at a site in
Tanzania (Yirka, 2002 ). Over the period, H. habilis used to get meat mostly by
scavenging and a smaller part by hunting. However, the large scale of wild meat was
predominantly hunted by H. erectus to obtain protein; it was probably a major adaptive
shift in human civilization (Leonard et al., 2007). A study on human evolution reflects
when early humans started to eat meat and eventually hunt; their women started to give
birth to more children during their reproductive life, contributing to the growth and
spreading population all over the world (Psouni et al., 2012). A positive correlation was
also observed between regular meat eating and body size. H. erectus/ergaster males had
an average body mass of 66 kg compared to H. habilis which weighed 37 kg, while the
body mass of females increased by 53%, from 32 kg for H. habilis to 56 kg for H.
erectus/ergaste for females (McHenry & Coffing, 2000). Thus, meat has a very crucial
link to our evolutionary heritage (Smil, 2002; Craig et al., 2001; Craig et al.,1999). The
age-old interlacing of the collection, consumption, and societal integration of meat with
hominin development has greatly influenced our biological and cultural modes of
operation (Ehrlich, 2000). With the improvement of stone tools, sustained running ability,
hominin accessed more animal-derived foods during the Pliocene period (Bramble &
Lieberman, 2004; Domínguez et al., 2005; Schoeninger, 2012) and they preferred meat

12
from large animals as meat makes up 40% or more of the diet; a much larger proportion
than in other primates (Wrangham, 2013). Subsequently, the meat consumption
opportunity expanded around 250,000 years ago when the earliest Homo invented fire
(Goudsblom, 1992) and they made meat food more delicious through searing and
roasting, and smoking and preserved it for later consumption. Thus, many years ago,
animals were considered as valuable source of meat food, containing high biological
value proteins and valuable minerals such as iron, vitamin as well as zinc, selenium and
phosphorus.
2.1.1 Meat
Meat has played a crucial role in human evolution and is an important component
of healthy, well balanced diet because of its high nutritional values. Increasing
populations and rapid income growth at the global scale has led not only to an increased
demand for staple foods but also for preferred foods such as meat products. Thus, various
forms of animal meat products have unique entry points into our commercial food chains;
these include minced meat, sausages, burger patty and meatballs which are the most
common meat products that are being widely consumed around the world regardless of
the brands, geographical and ethnical preferences. This is because only meat can offer
such a wide range of nutritional requirements; it is the best source of proteins, fats,
vitamins, minerals and micronutrients which are essential for human growth and
development. Moreover, the qualities of proteins from animal sources are superior to
those from plant sources as all the eight essential amino acids for human growth and
development are found in meat (Soares et al., 2014). The current rate of the global meat
consumption is 41.2 kg per capita per year (BBC, 2013) and has been on an increasing
trend for both domesticated and farmed wild animals (Klein, 2004) (Figure 2.1).
According to the Food and Agricultural Organization (FAO), global annual meat

13
production is estimated to will have increased from 218 million tonnes in 1997-1999 to
376 million tonnes by 2030 (FAO, 2002).
The top sources of meat in our diet are domesticated animals such as cattle, pigs
and poultry and to a lesser extent buffaloes, sheep, camels and goats. To a limited extent
and on a regional basis, meat is also derived from wild animals such as turtle, deer, elk,
rabbit, crocodiles, snakes and lizards (FAO, 2014; Klein, 2004). To keep up with this
trend, food companies are vigorously competing to produce and supply more meat
including raw meat itself and various meat products. However, consumers nowadays are
becoming more anxious about their choice for healthy food and are showing trends to
avoid high fat content meat. Another cause of anxiety is the increasing findings of fraud
labelling and adulteration in meat products (Nicole, 2010). Therefore, those who are
concerned about healthy diet regimes, are trying to reduce the high fat content meat, such
as red meat on their dining table. As a response to consumer demands for healthy food,
game/wild animals are being integrated into common foods chain using either legal or
illegal procedures. As wild meat provides distinctive texture and flavor, low fat and
cholesterol contents and is free from anabolic steroids or other drugs, they have become
attractive components in new and exotic delicacies (Hoffman & Wiklund, 2006; La Neve
et al., 2008) and as a result have created huge appeal to consumers. According to the
North American Elk Breeders Association’s report, a tremendous growth in the Elk
farming industry was observed in the USA from 1997 to 2003, where the total market
value was $ 150 million in that period. Similarly, the National Deer Farmer’s Association,
USA reported in 2003, about $1 billion worth of deer meat were marketed by 11,000 U.S.
farms (Klein, 2004). Meanwhile in Southeast Asia, Malaysia is one of the most intensely
hunting countries where approximately 108 million bush meat animals are killed for
consumption each year (Bennett et al, 2002).

14
Figure 2.1: Global meat consumption per capita (Source: http://www.fao.org/docrep
/005/y4252e /y4252e05b.htm)
2.1.2 Animal proteins
Protein is a core macronutrient and comes from a variety of sources, including
meat, milk, fish, soy, and eggs, as well as beans, legumes, and nut butters. When proteins
are digested, they leave behind amino acids, which the human body needs. In general,
proteins derived from animal sources (i.e. milk, eggs & meat) are complete, but the human
body’s ability to use the protein varies. Unlike carbohydrates and fats, protein is not stored
in the body; so, it is needed to be add in the diet regularly for the body to stay healthy.
Similar to carbohydrates and fat, protein is a “macronutrient,” which is needed in
relatively large amounts. However, meat protein content can vary substantially.
According to the Portuguese nutritional table data, the average protein content of meat is

15
22%, however, it can be as high as 34.5% (chicken breast) or as low as 12.3% (duck meat)
(INSRJ, 2006).
Meat proteins are further categorized by their essential amino acids content. There
are more than three hundred amino acids in nature but only twenty are indispensable to
synthesize proteins (Wu, 2009). Within this twenty, eight cannot be produced by the
human body which makes them essential and thus they have to be supplied by the diet.
Both essential and non-essential amino acids cannot be produced by the human body
unless all necessary raw materials are supplied from the diet. Thus, dietary proteins are
needed for growth, maintenance and repair of the body, and can also provide energy. The
amount of essential amino acids in the crude protein of beef is approximately as follows:
8.4% leucine, 8.4% lysine, 5.7% valine, 5.1% isoleucine, 4.0% phenylalanine, 4.0%
threonine, 2.9% histidine, 2.3% methionine and 1.1% tryptophan. Nonessential amino
acid contents in order of importance are glutamic acid, aspartic acid, glycine, arginine,
alanine, proline, serine, tyrosine and cysteine (Giroux & Lacroix, 1998).
In most developed countries, average protein intakes for all age groups are in
excess of the minimum requirements for good health resulting in the excess protein being
used to provide energy. Meat and meat products (including poultry) are the main dietary
source of protein in many countries. An overview of the developed countries reflects that
the average available amount of red meat (pork, beef and veal, sheep) for daily
consumption is approximately 110 g per person (FAO, 2009). Reviewing dietary
guidance of developed countries reveals that the recommendations for meat and meat
alternatives are 142 g/day on average or from 65 to 250 g/day for adults depending on
gender, indicating that red meat consumption is within recommended levels in most
developed countries. For example, in a recent analysis of U.S. National Health and
Nutrition Examination Survey (NHANES), data for adults (19–50 years) reflects that the

16
total beef consumption equated to 49.3 g of the 142–198 g/day recommended by the
USDA “MyPyramid” food plan (Zanovec et al., 2010). These data indicate that beef is
moderately consumed despite its popularity with consumers.
2.1.3 Animal fats
Animal fats are principally composed of triglycerides and accumulate in the fat
cells and become the richest dietary source of energy that supplies essential nutrients and
essential fatty acids. Usually fat is made up of different types of fatty acids: saturated fatty
acids (SFAs), monounsaturated fatty acids (MUFAs) and polyunsaturated fatty acids
(PUFAs). The content of fat may differ significantly among beef, poultry and other meat
products such as offal and specialties like sausages, ham, etc. According to the Portuguese
nutritional composition table (INSRJ, 2006), there are 14% (calf) to 19% (adult) fats in
beef retail cuts whereas it is 8% to 28% in pork. However, the USDA reports estimated
values that range from 5.4% to 7.9% fats in beef retail cuts while pork fat range from 8%
to 10.7% (USDA, 2011). Skin is probably the main source of fat in poultry meat, hence
chicken and turkey skinless breasts have similar fat contents (INSRJ, 2006).
Animal fats are widely added in meat preparation to make the products softer and
also to add taste and flavors. In particular, products such as meat loaves, frankfurter type
sausages or liver pate, have meats and fats that are finely comminuted and the fat particles
are enclosed in protein structures and thus become difficult to detect via visual methods.
Fat contents of up to 40% may be hidden this way, which may be harmful to the
consumers’ health because most often relatively low grade and cheap raw materials have
been used in processed foods. Fat abundancy also plays a role in food processing. For
example-fat derivatives are used as biosurfactants in food industries as emulsifying,
antimicrobial, antifungal and as well as antiadhesive agents. Commercially available

17
emulsifiers used in the food and drink sectors are typically derived from soy and eggs
(Shepherd et al., 1995).
It is now well recognized that different fatty acids have different consequences on
blood cholesterol levels (including beneficial as well as harmful effects), hence it is
important to consider the fatty acid profile of a food. Palmitic acid and stearic acid are the
main SFAs present in red meat (Fink-Gremmels, 1993; MAFF, 1998) while oleic acid is
the principal MUFA in meat and typically ranges between 30 and 40% of the fat in meat
(Fink-Gremmels, 1993; MAFF, 1998). The predominant PUFAs in meat are linoleic (n-
6) and α-linolenic acid (n-3), which are known as essential fatty acids. In spite of having
low PUFAs content, meat and meat products (including poultry) contribute substantially
to intakes in the UK, providing 18% of n-6 PUFAs and 17% of n-3 PUFAs, while 23%
of overall fat intake (Henderson, Gregory, Irving, & Swan, 2004).
2.1.4 Vitamin and minerals
As with other animal foods, animal meat is an excellent source of bioavailable
vitamins and minerals. Red meat provides up to 25% RDI (recommended daily intake) of
multivitamins such as riboflavin, niacin, vitamin B6 and pantothenic acid per 100 g
intake. Up to two thirds of the daily requirement of vitamin B12 is derived from red meat
foods (Williams, 2007). Although, liver is known as a reservoir of heavy metals,
hormones and xenobiotics, it is also the best source of vitamin A and folate than lean
muscle meat tissue (Kerry, 2009). Chicken breast is an excellent source of niacin (100 g
supplies 56% of DR) and vitamin B6 (27% of DR) whereas turkey breast supply as low
as 31% of niacin DR and 29% of vitamin B6 DR from 100 g intake (USDA, 2011). For
all these vitamins, older animals tend to have higher concentrations; so the levels in beef
are generally higher than those in veal, mutton and lamb. Likewise, red meat is also the
greatest source for trace elements such as zinc, selenium phosphorus and iron. A 100 g of

18
red meat provides around 37% of selenium DR, 26% of zinc DR and 20% of potassium
DR (USDA, 2011). According to Henderson et al (2003), in the UK 17% of the total
dietary iron comes from meat and its product whereas the amount is 22% in New Zealand
(Russell et al., 1999). Absorption of zinc from a diet high in animal protein is greater than
from plant foods, causing about 50% higher requirement for vegetarians than meat eaters
(NHMRC, 2006). Meat and meat products in Ireland provide around 41% of total zinc
intake (Cosgrove et al., 2005) and 31–34% intake in Denmark, UK and New Zealand
(Credoc, 2003; DIFVR, 2005; Henderson et al., 2003; Russell et al., 1999).
Other elements such as sodium and potassium are important for muscle
contraction, nerve transmission, digestive and muscular function and maintaining pH
balance. A certain amount of both these elements in diets are derived from red meat where
potassium is present 5 times higher than sodium. Copper is a mineral that is found
throughout the body. It helps to make red blood cells and keeps nerve cells and the
immune system in the right gear. Raw lean meat cuts provide 0.055 to 0.190 mg/100 g of
copper for beef and 0.190 to 0.240 mg/100 g for mutton (Chan, 1995).
2.2 Animal Materials in Pharmaceuticals
Chemicals from nature have played a vital role in health care and prevention of
diseases for thousands of years (Ji et al., 2009). The ancient Chinese, Indian and North
African civilizations provide written evidence for the use of medicinal chemicals from
plants, animals or micro-organisms for curing various diseases (Phillipson, 2001). A
major part of these chemicals comes from animals and its metabolic byproducts such as
secretions and excrements. Indeed, animals are therapeutic arsenals that have played
significant roles in the healing processes, magical rituals, and religious practices of the
peoples from all five continents (De et al., 2000).

19
Globalization of technologies and new innovation ideas lead to the expansion of
animal based medicines around the world. It has been recorded that the annual global
trade in animal-based medicinal products accounts for billions of dollars per year (Kunin
& Lawton). An assessment study on 252 essential chemicals by the World Health
Organization showed that 11% were from plants and 8.7% from animals (Marques, 1997).
Out of 150 recommended drugs in the U.S.A, 27 have animal origins (WRI, 2000),
reflecting the wide spread consumption and uses of animal materials in these medicines.
Similarly, Tatham & Patel (2014) stated that some drugs prescribed by primary care
doctors elsewhere in the world contain ingredients derived from animals. For example,
several vaccines for both children and adults containing animal by-products are
manufactured with gelatin, chicken embryo, pork serum and embryo cells. These usually
go unnoticed by the consumers, who have no knowledge that they are taking medicine
with animals by-products. Numerous animals are being used to develop medicines across
the world (Figure 2.2).

20
Figure 2.2: Schematic diagram of animal sources of therapeutic agents (Source:
https://www.health.qld.gov.au/__data/assets/pdf_file/0024/147507/qh-gdl-954.pdf).
Gelatin is an animal protein has been used as a carrier of Zoster vaccine
(Grabenstein, 2013). Zoster vaccine is a live vaccine used to prevent or reduce post
herpetic neuralgia caused by the varicella zoster virus. The introduction of insulin was a
breakthrough in the treatment of diabetes, as insulin is effective in restoring
normoglycaemia, suppressing ketogenesis and in delaying or arresting diabetic
complications (Garg & Misra, 2002). This life saving drug is derived from pig pancreas
as well as bovine serum. Heparin is a sulfated polysaccharide of animal origin used as an
effective anticoagulant to prevent the formation of blood clots in the veins, arteries, or
lungs (Triplett, 1979). It is obtained from porcine (intestines), bovine (lungs), ovine and
caprine (Huang et al., 2012), but porcine intestinal heparin has restricted applications
because of the emergence of transmissible spongiform encephalopathy from other
ruminant animals (Concannon et al., 2011) and also due to religious prohibition.
21
2.3 The Need for Animal Material and Turtle Authentication
The identification of animal species in food and medicinal products has enormous
importance in public health as they are potential careers of various zoonotic threats and
food-borne diseases as well as certain chronic disorders such as cancer and cardiovascular
diseases (CVD). Studies demonstrate approximately 75% of infectious diseases in
humans are caused and originated from domesticated and wild animals (Blancou et al.,
2005). There are approximately 1,500 pathogens, which are known to infect humans and
61% of these cause zoonotic infections via direct or indirect contact (Taylor et al., 2001).
The potential pathways include but are not limited to (i) transmission by animal bites and
scratches (Zambori et al., 2013); (ii) meat food or materials from infected animals as well
as improper food handling and cooking (Gerba et al., 1996; Roe & Pillai, 2003; Tauxe,
1997); (iii) through farmers and animal health workers who spend a significant time with
animals and thus are exposed to certain pathogens or catch health risk bacteria and thus
they could also become carriers and spread the infection to other humans (Levy et al.,
1976); (iv) wildlife animals who can serve as hosts for a variety of known and unknown
emerging zoonotic pathogens (Karesh et al., 2005).
Some of the animals are especially vulnerable and have been identified as a
reservoir of various pathogens. Turtles and tortoises are among these groups, where
several potential zoonotic agents such as parasites and enteric bacteria have been
detected and which are the causative agents for about 70,000 cases of human
salmonellosis that happen in each year in the United States alone (Wong et al., 2003).
Moreover, turtle and tortoise species are known as wild scavengers since they consume
waste materials in nature. Thus, the consumption of turtle meats may have adverse human
health effects due to the presence of pathogens and environmental contaminates. In 2013,
a survey conducted by the Department of Health, Philippines on a foodborne illness
22
(Chelonitoxism) event in Rawis, a small village located in the coastal area of Arteche,
Philippines, where four consumers ranging in age from 23 to 80 years died after
consuming turtle meat. Three of these were from the same family and consumed turtle
meat and the intensity of food poison was so acute that all of them died from the
consumption of turtle soup and internal organs; whereas 75% and 25% consumers had
died after the consumption of turtle eggs and heart parts, respectively (Ventura et al.,
2015). This incident supports the alarming risk that comes with the consumption of
turtle products. However, turtle and some others wildlife are integral parts of traditional
medicines as some recent medicinal textbooks of traditional Chinese Medicines (TCM)
still recommend the use of various animal tissues such as tiger bones, antelope, buffalo
or rhino horns, deer antlers, dog testicles, bear or snake bile in TCM formulas. Although
there are not enough scientific studies on the physiological effects of animal materials in
traditional medicines, it has been continued to be included because of the traditional belief
and rituals that have propagated from generation to generation. Several studies have
suggested that there are strong possibilities of the transmission of diseases from animal
preparations. For example, monkeys are identified as harboring the herpes B virus which
is also known as the Ebola virus in Human and is transmissible to man with potentially
grave consequences. Several researchers have considered the propagation worldwide of
the sweeping HIV virus may have originated from monkeys. In some regions, wild
animals are hunted (poached) for their meat rather than for their uses in medicines.
Even though animal meat is consumed to get basic nutrition, indiscriminate
consumption might not only affect the food chain but also risk their health as well. A
number of epidemiological studies have reported that high consumption of red meat or
processed meat is associated with increased risk of several cancers and cardiovascular
disease (CDV) (Cross et al., 2007; Giovannucci et al., 1994; Kelemen et al., 2005;
Kontogianni et al., 2008). Although the risks are small, they could be important for public

23
health as many people worldwide eat meat, and its consumption is increasing day by day
even in the low and middle-income countries. According to the most recent export by the
Global Burden of Disease project, more than 34,000 cancer related deaths are caused by
diets high in processed meat. Similarly, the same organization has stated that red meat
was responsible for 50,000 cancer deaths a year worldwide (WHO, 2015).
Processed meats mostly contain pork or beef, but they may also contain other red
meats, poultry, offal and meat by-products such as blood. Constituents of these red meat
products that have been proposed to be responsible for these associations include the fat
content, fatty acid composition and the possible formation of carcinogenic compounds,
such as heterocyclic amines (HCAs) while cooking the meat at high temperatures
(Bingham, Hughes, & Cross, 2002). Besides, oxidation of red meat derived fat leads to
the formation of oxyesterols and aldehydes that may alter transforming growth factor beta
(TGF-β)-mediated signal and cell proliferation (Biasi, Mascia, & Poli, 2008). Moreover,
the high saturated fat content of red meat contributes to obesity and general inflammation,
insulin resistance, and intestinal dysbiosis (Calle & Kaaks, 2004; Schulz et al., 2014).
Recent epidemiological studies show consistent associations between saturated fat intake
and the risk of prostate and breast carcinomas (Pelser et al., 2013; Xia et al., 2015).
Moreover, red meat is a potential source of contaminating inorganic toxins, such as
arsenic (As), cadmium (Cd), mercury (Hg), lead (Pb), pesticides among many others
(Domingo & Nadal, 2016). These toxins can be derived from the cooking processes or
from industrial sources during meat processing.
2.4 Religious Prohibition and Social Factors
Religions have played an important role in the selection of the menu throughout
the human civilization (Rehman et al., 2010). The impact of religion on food consumption
depends on the individuals who are following the teachings of the religion along with

24
their understanding and interpretations of the religious tenet. Religious requirements and
its adherence influence the feelings and attitudes of people towards food consumption
(Jamal, 2003). Most of the religions have strict guidelines that determine the food
consumption to show a respect to God as well as its health attributes (Meyer-Rochow,
2009). For Muslims, the Islamic Shariah law is one of the most important foundations in
their social and cultural life. Thus, Muslim consumers strictly follow dietary laws
enshrined in the holy Quran, Hadiths of prophet Mohammad (SM) and in certain cases
based on the opinions of a group of Islamic Scholars. According to the Islamic dietary
laws, Muslims are prohibited from eating or using any product derived from pigs as well
as prohibited body parts and ingredients such as blood and plasma even from halal
animals, or permissible body parts such as the flesh if the animal is slaughtered in a non-
halal way such as shooting or electrical shock (Nakyinsige et al., 2012). Likewise, Jewish
dietary laws consider animal’s ingredients must comply with the kosher laws. Both the
Muslim Halal and Jewish Kosher law require that animals which may be consumed must
chew their cud and have split hooves; pigs don’t chew their cud and thereby pork and pig
derivatives are clearly prohibited as food materials in Islam and Judaism (Regenstein,
Chaudry, & Regenstein, 2003). Although cow meat and its products are lawful as food
for the Jewish, Christian and Muslim consumers, they are with the exception of milk,
unacceptable to the followers of Hinduism; this is because cow is considered as sacred
animals by Hindus (Meyer-Rochow, 2009).
On the other hand, vegetarianism is strongly linked to a number of religions that
originated from ancient India. While Judaism, Christianity and Islam have not strongly
promoted vegetarian diets; religions that originated from ancient India such as Hinduism,
Jainism and Buddhism, strongly practice vegetarianism in their everyday menu. While
vegetarianism is mandatory for everyone in Jainism (Burt, 2016), it is advocated by some
influential scriptures and religious authorities of Hinduism and Buddhism (Davidson,

25
2003). Most of these religious tenets are focused on promoting a healthy lifestyle and
preventing illness caused by food consumption. For example, halal is an all-encompassing
concept which encourages a Muslim to seek and use products, ventures and services that
promote cleanliness in all aspects of a person’s life. Thus, halal food means that a product
or service is safe for consumption, produced in a clean environment and healthy.
Therefore, religion is one of the main factors determining food avoidance, taboos and
special regulation particularly with respect to meat consumption (Ali et al., 2014). Culture
and social lifestyle also play an important role in food selection. Lifestyle, such as
practicing vegetarians consume only plant originated materials whilst some Buddhists
believe that killing animals is a great sin(Phelps, 2004; Stewart, 2015). Considering all of
these religious views, food and drug manufacturers should have a loyalty and
responsibility to provide reasonable information related to all aspects of food and drug
production. Consumers also need to be assured that the information they are being
provided by a company is true and accurate (Holm & Kildevang, 1996)
Malaysia, is a multiracial country with various ethnic groups and religious tenets,
although Islam is the official religion where 50% of the population practice Islamic
doctrines (Fischer, 2008). Malaysia has shown great interest in the Halal industry
development including food, pharmaceutical and personal care products as well as Halal
finance systems (Riaz & Chaudry, 2003). Malaysia also imports food, cosmetic and
medicinal products from several non-Muslim countries such as Australia, New Zealand,
India and Thailand where the bulk market is not Halal compliant (Elasrag, 2016).
Muslims around the world are facing similar problems when they purchase consumer
items from non-Muslim countries. These food and consumer products could contain
haram substances because the manufacturers in the foreign countries and
importers/exporters may not well understand the concept of Halal which is a fundamental
aspect in Islamic life. Fortunately, since 1982 Malaysia along with other Muslim

26
countries have strong legislation and surveillance laboratories under the Halal
regulatory board, JAKIM, to monitor the Halal markets and create trust to the Halal-
consuming populations (Othman, Ahmad, & Zailani, 2009). Thus, exporter and
importers are required to meet the Malaysian standard for Halal Food Production,
Preparation and Storage-General Guideline (MS 1500:2004) (Malaysian Standard).
Despite strict monitoring of Halal status, recently non Halal beef was sold in Malaysia;
this has placed most Muslim consumers on red alert in determining the presence of
prohibited animal ingredients in marketed foods as well as medicinal products
(Anonymus, 2015).
2.5 Regulatory Laws
The regulation of health products and food is an important activity that not only
supports our health but also gives us the right tools for authentication. Nowadays, both in
developed and developing countries, food and drug assurance systems are generally
getting more stringent to ensure both the real and perceived food safety problems are
addressed. Regulations are the rules issued by the Governor of a Council to carry out the
intent of statutes (Acts or legislation) enacted by the Government. They are the
instruments of legislative power and have the force of law. Regulations contain more
specific information and requirements than Acts. These can include definitions, licensing
requirements, performance specifications, exemptions, forms and other details. The
complexity in regulations for the health and food product sectors reflect consumers’
demand for safe food and drugs, as well as firms’ reputation for providing safe food and
drugs and maintaining global market shares. The regulations also differ significantly
across health products and food types, such as raw and processed food and drugs, low and
highly perishable food products, or for food and drugs containing low or high incidences

27
of risks for human health. The following Malaysian regulatory system, statutes and rules
provide a framework for health to regulate health products and food in country
2.5.1 Malaysia food act 1983
Generally, “food law” is used to apply to legislation which regulates the
production, trade and handling of food and hence covers the regulation of food control,
food safety and relevant aspects of food trade. To protect the public from unhealthy food
or health hazards and fraud in the preparation, sale and use of food, the Malaysian
Government enacted the Food Act law on 9th March 1983. Moreover, Malaysia is on the
edge of making itself as the Halal food hub of the world. Malaysia is a Muslim-majority
country and hence there is a demand for Halal foods in the local markets and Malaysia
also wants to earn revenues from the export of Halal foods. Also, Halal foods has gained
attention among non-Muslims communities due to its quality attributes, hygiene and
safety standard (Wahab et al., 2016). The global Halal food market value is estimated to
be US$ 3.7 trillion by 2019 (WAM, 2016). This big market may contribute as a potential
engine for economic growth and societal development and Malaysia aspires to be a leader
in the Halal food benchmarking. In fact, the United Nations has cited Malaysia as the
world’s best example of benchmarking of Halal food in Geneva in 1997 (Bohari et al.,
2013). Therefore, food material including processed foods is stringently regulated by the
Malaysia Food Act 1983 and Malaysia Halal Standard (Act, 1983; Wahab et al., 2016).
This act protects the public from health risks and fraud in the food preparation, sale, use
of food, and for matters incidental or connected in addition to that, throughout Malaysia.
Additionally, Malaysia is the first to announce a global Halal center and create a restricted
agency for Halal monitoring at the national level (Iberahim et al., 2012).

28
2.5.2 The criteria and justification of Malaysia food act 1983
The regulatory and enforcement bodies will take necessary legal action if they
find the following offenses and evidences (Act, 2006):
1. Strictly about clean and sanitary condition of premises or equipment
Procedure:
a. Director may order premises or appliances be put into clean and sanitary
condition 2. If any offence and evidence with harmful materials at food premise or
foods contain harmful ingredients to health or food unfit for human consumption
or any portion of an animal unfit for food, or any diseases, filthy, decomposed or
putrid animal or vegetable substance
Procedures:
Report letter as a warning (specified period)
Penalty: imprisonment for a term not exceeding (5) five years or to a fine or to
both.
3. If any person who prepares, packages, labels or sells any food in a manner that
is false, misleading or deceptive as regards its character, nature, value, substance,
quality, composition,
Procedures:
Writing warning report: not exceeding 14 days of any premises providing or
selling food
Closure selling food
Imprisonment for a term not exceeding three (3) years or a fine or both

29
4. Regulatory body will take the necessary steps if they find adulterated food or if any
substance or ingredient has been extracted, wholly or in part, or omitted, from the
food and by reason of such extraction or omission.
Procedure:
Removal of food from food premises
Writing warning notice letter
Order to remove or withdraw from sale at specific time
Prohibition against the sale
Penalty: imprisonment for a term not exceeding (5) five years or to fine or to both
Order license to be cancelled and food to be disposed of
2.5.3 Malaysian standard
The Malaysian Standard is under the Department of Standards Malaysia which is
the recognized body for the standardization and accreditation industry in Malaysia. The
application of the Malaysian Standard is a voluntary use except where it is made
mandatory by regulatory authorities involved by means of regulations, local by-laws or
any other similar ways. Article 4.2.1. in MS 1500:2009 has clearly defined Halal food, its
production, preparation, handling and storage procedures step by step (Amendment
2009). This category of Malaysian Standard reviews of the food industry start from the
preparation, handling and serving process of Halal food and products including trade and
business. It is a fundamental requirement guideline which contains knowledge of nutrient
matter. The premises criteria discussed in this guideline are divided into 4 (four) elements:
The criteria and justification of premise in MS 1500:2009.

30
2.5.3.1 Layout design
Plan should provide proper flow of the process, employee, good hygiene and
safety application as applicable to any pest infection and cross-contamination
between and during operations
Clean facilities and proper food hygiene supervision designed
Provided and maintaining the sanitary facilities
Appropriately designed for loading and unloading bay
2.5.3.2 Flow of product processing
Started with raw materials receiving until finish product without cross
contamination
Entirely separated and well insulated from a pig farm or its related activities .
2.5.3.3 Conditions
Maintain the good repair and condition to prevent contamination from any pest
and breeding sites potential access
To prevent pets and other animals from entering the premises compound
2.5.3.4 Slaughtering
Only for Halal slaughtering and processing
All carcasses process like deboning, cutting, packing and storing should be done
completely in approval premises; the competent authority require this standard
2.5.4 U.S. legislations
There is a long established system of food safety control and regulation which
occurs at the federal (interstate commerce and import) and regional (intrastate commerce)
level. Two main agencies are involved at the federal level, namely, Food and Drug
Administration (FDA) and the Food Safety Inspection Service (FSIS) of the United States

31
Department of Agriculture (USDA). The Food, Drug and Cosmetic Act 1938 (FDCA)
sets out the authority of the FDA whilst the Meat and Poultry Inspection Acts and the Egg
Inspection Act set out the authority of FSIS. But In some situations, FSIS and FDA follow
similar practices while in other situations, the practices of these two agencies are quite
distinct. State agencies also have an active role in overseeing food processing businesses
within their respective states, but their role is in collaboration with the federal agencies.
U.S federal law has categorized foods into interstate commerce "; foods not in interstate
commerce" and which are regulated by state law. Most foods fit the definition of being in
interstate commerce, however, because they are moved across a state line, or an ingredient
has been moved across a state line. Federal agencies have defined the adulterated and
misbranded food products which are not allowed to be sold in the USA.
2.5.4.1 Adulterated foods
If any food contains any substance, food additive, or pesticide chemical residue
which may render it injurious to health or unsafe
If any food consists of any filthy, putrid, or decomposed substance
If any food is unfit for food
If any food has been prepared, packed, or held under insanitary conditions
whereby it may have become contaminated
If any food is the product of a diseased animal or an animal that died other than
by slaughtering or professional killing
If food container is composed of any substance which may render the contents
injurious to health
If any food has been intentionally irradiated.
2.5.4.2 Misbranded food
It means any food that

32
Its labeling or advertising is false or misleading
It is offered for sale under the name of another food
It is an imitation of another food but the label does not bear the word “imitation”
Its container is made or filled to be misleading
Its label does not provide
i) the name and place of the manufacturer, and
ii) an accurate statement of the quantity of the contents in terms of weight, measure, or
numerical count
2.5.5 European Commission legislations
The food processing sector in the European countries is tightly regulated by state
and European commission legislation, although there is no specific definition about food
adulteration and misbranded food but it has traceability guidelines that have five major
steps to prevent food fraud under the article 18, 19 and 20 of Regulation (EC) 178
(2002) sections. Thus the articles 18, 19 and 20 of the Regulation (EC) 178 (2002) cover
the responsibilities of food and feed business operators to inform the public on an
appropriate label about the content of the prepared food (Law, 2002), as follows:
The traceability of food, feed, food-producing animals, and any other substance
intended to be, or expected to be, incorporated into a food or feed shall be
established at all stages of production, processing and distribution.
Food and feed business operators shall be able to identify any person from whom
they have been supplied with a food, a feed, a food-producing animal, or any
substance intended to be, or expected to be, incorporated into a food or feed. To
this end, such operators shall have in place systems and procedures, which allow
for this information to be made available to the competent authorities on demand.

33
Food and feed business operators shall have in place systems and procedures to
identify the other businesses to which their products have been supplied. This
information shall be made available to the competent authorities on demand.
Food or feed which is placed on the market or is likely to be placed on the market
in the Community shall be adequately labelled or identified to facilitate its
traceability, through relevant documentation or information in accordance with
the relevant requirements of more specific provisions.
Provisions for the purpose of applying the requirements of this Article in respect
of specific sectors may be adopted in accordance with the procedure laid down in
Article 58, paragraph 2, referring to Committee and Mediation Procedures.
If an operator considers, or has reason to believe that a food/feed which they have
imported, produced, processed, manufactured or distributed is not in compliance
with the food/feed safety requirement, they will immediately initiate procedures
to withdraw the food/feed in question from the market where the food/feed has
left the immediate control of that initial food/feed business operator and inform
the competent authorities thereof.
2.6 Turtle Species in Foods and Pharmaceuticals
Turtle species have been exploited for meat, eggs, and traditional medicine since
the 16th century (Alves & Santana, 2008; Klemens, 2000). In many East Asian cultures,
turtle meat and eggs are considered a culinary delicacy with perceived health and
medicinal benefits. The annual trade volume of live turtles for consumption in Asian
countries have exceeded 13,000 metric tons, a high proportion of this is believed to be
collected from the wild (Dijk et al., 2000). The largest consumers are predominantly in
East Asia, i.e., China, Hong Kong, Japan, Korea, Singapore and Taiwan, as well as
Chinese ethnic communities around the world. But, among them China is the leading
consumer country in the world and its international trade has been cited as the greatest

34
threat to Asian turtles (Figure 2.3) (Cheung & Dudgeon, 2006; Gong et al., 2009). Turtle
plastron is the essential part of traditional medicine preparations which comprise about
32% protein, 7% collagen and 50% calcium carbonate. In 1992-1998, Taiwan imported
more than120 metric tons turtle shell from main land China and Southeast Asia (Figure
2.4) (Lo et al., 2006) however, food trade involving the largest quantities of turtles takes
place in Asia.
The consumption of turtle meat and eggs are greatly encouraged by the traditional
belief of health benefits such as natural source of high quality proteins for certain
communities. In Malaysia, indigenous people such as the Orang Asli of Peninsular
Malaysia and the Bedayuh and Iban of Sarawak are greatly involved o consume turtle
meat as their protein source. These ethnic groups traditionally appreciate turtles and other
wildlife as their food (Sharma et al., 2000; Sim et al., 2002) and Sharma et al., (2000)
noted that most indigenous groups consume the flesh of the species purely for food and
not for medicinal purposes (Sharma et al., 2000).
In contrast, the Chinese communities around the world consider it as tonic food
as well as being medicinal materials (Cheng, 2014). In Hong Kong and Singapore, turtle
soup is widely accepted as an exotic dish and largely consumed during the winter season
because of the belief that turtle meat warms its consumer’s blood (Lau, 2000)(Figure 2.4).
Conversely, Malaysian Chinese, eat turtle meat for its assumed medicinal values and they
feed flesh to the children to cure for nocturnal urination in bed (Sharma et al., 2000).
Recently, turtle jelly has become more popular as desert food or as a medicinal product
and is found in traditional medicine shops around the Asia. The dark brown turtle jelly
powder is obtained from the plastron of Cuora trifasciata, Cuora amboinensis, Mauremvs
mutica and Notochelvs platvnota species, Callagur borneoensis and Pelodiscus
sinensis and prepared with various medicinal herbs (Figure 2.5). This plastron jelly is also

35
considered as anticancer and detoxifying drugs and applied as traditional medication
(Lau, 2000).
Turtle and tortoise shells possess small portions of keratin, magnesium, vitamin
D and trace minerals such as zinc (Damiens et al., 2012; Mitchell, 2014) but collagen and
calcium are the two main chemical constituents that are found in the turtle or tortoise
shells (Damiens et al., 2012). While the collagen usually makes up the 7% of the turtle
plastron, calcium makes up half of the tortoise plastron and carapace. Calcium has been
known for building strong teeth and bones but it is also associated with nervous and
neuromuscular disorders. Calcium deficiency usually lead to nervousness, hyperactivity,
irritability, insomnia, muscle cramps, limb numbness, etc. (Fang, Zhang, & Liu, 1989). A
Figure 2.3: Wild turtle meat and egg soup are openly sold at restaurant in Singapore
(Source: http://www.sbestfood.com/wp/tanserseng.htm).

36
popular medicine “Longmu Zhanggu Tang” made from turtle and tortoise shells with
others materials such as oyster shell, astragalus, atractylodes, codonopsis, hoelen,
dioscorea, schizandra, jujube, licorice, and gallus and is applied for the treatment of
rickets disease because this medicine improves serum calcium and phosphorus levels, and
bone mass (Lili, 1987). Plastron is sometimes described as an exoskeleton, partially or
completely solidified by calcium carbonates and phosphates. Ingestible collagen can
inhibit arthritis (perhaps by deflecting immune attacks against the joints to the ingested
collagen) and as well as angiogenesis (blood vessel formation) to inhibit tumor growth
(Dunussi-Joannopoulos et al., 2005). Animal gelatin is recommended for arthritis
treatment as well as soreness and back and spinal pain, joints enlargement, leg pains, and
heel pains in published traditional Chinese medical books and medicines are composed
with tortoise and turtle shell, donkey skin gelatin, and deer antler gelatin (Cai et al.,
1995). Gelatin polypeptides contribute to stop vaginal bleeding and uterine fibroids in
women older than 40 years. Administered medicines to these diseases are derived from
tortoise shell as well as other wild animals by-products (Sionneau, 1997). There may be
substances in the shell that stimulate the body to produce hormones and control and
prevent thyroid disorders. There are also small amounts of fats, magnesium, trace
minerals, such as zinc, and vitamins, including vitamin D, in the tortoise shells
(http://www.itmonline.org/arts/tortois2.htm). It is still difficult to explain some of the
traditional indications for tortoise shell based on the limited knowledge of its constituents
and their effects.

37
2.7 Malayan Box Turtle and Availability
The Malayan box turtle (Cuora amboinensis) is one of 18 freshwater turtle and
tortoise species which are the native species of Malaysia (Sharma, 1999). These species
belong to the Cuora genus, which encompasses a total of 12 turtle species (Table 2.1), all
of which their habitats are found in different geographical locations across the Asian
peninsulas (Spinks et al., 2012). A wide distribution of these species is found across South
and Southeast Asia countries such as Malaysia, Thailand, Myanmar, Cambodia, Vietnam,
Brunei, Indonesia, Laos, Philippines ( Ernst & Altenburg, 2000; Trust, 2004), Bangladesh
(Khan, 1982), and India (Moll & Vijaya, 1986). However, it is a very common hard shell
fresh water turtle found in Malaysia including the Borneo islands (East Malaysia) and
Singapore (Lim & Das, 1999). Life expectancy of this species is about 25–30 years and a
maximum age of 38.2 years was recorded (Bowler, 1977). According to Schoppe (2008),
it takes 14-16 months to reach sub-adulthood having a MeCL (median carapace length)
size > 115 mm and to reach maturity, female species take 5-6 years and males 8-9 years.
However, suitable habitats, environment, and sufficient feeding might enhance them to
Figure 2.4 Turtle plastron are sold in traditional Chinese medicine shops in China
(Source: http://www.thefullwiki.org/Traditional_Chinese_medicine).

38
mature at an age of 3-5 years (Praedicow, 1985). An adult female turtle can lay 3-5 eggs
during the rainy season but its population numbers are based on fertile and infertile eggs
(Nutaphand, 1979). It is estimated that 61% of the female of the total population is found
in Peninsular Malaysia and 49% in Sarawak, east Malaysia and the ratio of male to
females is 1:1.6 in Peninsular Malaysia and 1:1.2 in Sarawak. An overview of the Asian
box turtles are given in table 2.1.

39
Table 2.1: Asian box turtles – An overview
Species Countries of Origin Population Status Use and Trade
Cuora amboinensis
Malaysian box turtle
Malaysia, Bangladesh, Cambodia, India,
Indonesia, Lao PDR, Myanmar,
Philippines, Singapore, Thailand, Vietnam
Endangered
Food markets and TCM. High level of exploitation for Chinese
food markets in East Asia
Cuora aurocapitata
Golden-headed box turtle
China Critically endangered Food markets and TCM. One of the most requested and most
expensive species in the Chinese food markets
Cuora flavomarginata
Chinese box turtle
China, Japan Endangered Food markets and TCM. High level of exploitation in China and
Hong Kong,
Cuora galbinifrons
Flowerback box turtle
Cambodia, China, Lao PRD, Vietnam Critically endangered
Food markets and TCM. High level of exploitation for food
markets in Southeast and East Asia
Cuora mccordi,
Mc Cord´s box turtle
China Critically endangered Food markets and TCM
Cuora pani,
Pan´s box turtle
China Critically endangered Food markets and TCM
Cuora trifasciata,
Three-striped box turtle
Cambodia, China, Lao PDR Vietnam Critically endangered Food markets and TCM. Most expensive and requested turtle in
the Chinese markets
Cuora yunnanensis,
Yunnan box turtle
China Probably extinct in the wild Not observed in trade, maybe already extinct
Cuora zhoui,
Zhou´s box turtle
China Critically endangered Food markets and TCM. One of the most requested and expensive
species in the China food markets
Cuora cyclornata,
Vietnamese three-striped
box turtle
China, Vietnam, Lao PRD Critically endangered Food markets and TCM. One of the most requested and expensive
species in the China food markets
Cuora bourreti,
Vietnamese flowerback
box turtle
Vietnam, Lao PRD Not recorded Food markets and TCM. One of the most requested and expensive
species in the China food markets
Cuora serrata China Critically endangered Food markets and TCM:
Source: https://www.cites.org/eng/cop/11/prop/36.pdf

40
2.8 Existential Threats
The Malayan box turtle population in Malaysia occupies about 2.6 million acres
of peat swamp forests area (Schoppe 2008b). Nevertheless, the existence of the species is
now in jeopardy due to over-exploitation. A large number of this species is caught for
domestic consumption, but it has the highest consumption by East Asian consumers and
for use in traditional Chinese medicine (TCM) (Schoppe, 2008b) (Figures 2.3 and 2.4).
All specimens for domestic and international use are wild-caught and linked with an
economic motivation. Moreover, its size and reputation of having higher meat quality
make the Malayan box turtle highly preferred for consumption in Asian food markets.
Likewise, Malayan box turtle shell is reported to be analgesic and antipyretic and a rich
source of proteins and calcium in Chinese Materia Medica (Schoppe et al., 2012). Being
wildlife protected and a commercially high valued species, the possibility of illegal
trafficking and trade of Malayan box turtle are rampant in Southeast Asia including
Malaysia. A conservative estimate is that the illegal trade amounts to 10 times the volume
of legal trade (Schoppe, 2009), and this covers live specimens and the shell trade. Thus,
a higher portion of this species is harvested through forgery ways. According to the
Vanda Felbab-Brown’s (International and internal expert on security and illicit
economies), illegal trade of wildlife is $8-10 billion per year in Southeast Asia, resulting
in deterioration of ecosystems and extinction of vulnerable species (Felbab-Brown,
2011).
Besides, the rapid and extensive destruction of tropical forests has become a serious
threat to their native biota (Zanovec et al., 2010). The current deforestation rate is
particularly severe in Malaysia, where natural habitats are being destroyed at relatively
higher rates than those of other tropical regions (Fink-Gremmels, 1993). If this continues,
Malayan box turtle will be extinct from this region in the near future. Similarly, drainage

41
and irrigation works, unregulated chemical and pesticide use in paddy land also have a
significant impact upon the environment and this may lead to the destruction of wetlands
and cause a population decline (Gregory & Sharma, 1997; Lim & Das, 1999).
Moreover, Malayan box turtles have a slow reproductive cycle characterized by
late maturity and a limited number of eggs. It is therefore feared that the continuous high
volume exploitation in combination with its slow productivity might lead to serious
population reductions and finally to a local extinction (Schoppe, 2009). Turtle species are
known as natural scavengers and they eat vegetable, fallen fruits and soft invertebrates
such as worms and slugs and waste materials in wetlands (Anonymus, 2016a). Therefore,
its temporary or permanent removal from its natural habitats is not only a threat to their
existence but also may lead to an imbalance of the ecosystem structure, the significance
and consequences of which cannot currently be determined.
2.9 Routes of Trafficking
To protect them from overexploitation, Malayan box turtle was first assessed by
the International Union for Conservation of Nature and Natural Resources (IUCN). It was
Red Listed as the Threatened Species in 1996, “Low Risk or Near Threatened” before it
was upgraded to vulnerable in 2000 ( Schoppe, 2008b). In the same year, all species under
the genus Cuora were listed in Appendix II of the Convention on International Trade in
Endangered Species of Wild Fauna and Flora (CITES), bringing requirements of legal
provenance and sustainable management for any international trade in the species
(Henderson et al., 2004). Prior to the export of Appendix II species from a country of
origin, a so-called non-detriment finding (NDF) needs to be conducted to determine the
number of individuals that can be harvested without a negative impact on the survival of
wild populations (Henderson et al., 2004). Despite strong legislations internationally,
thousands are harvested annually in Malaysia and Indonesia and exported illegally into

42
the international meat, TCM and pet markets without considering their present survival
condition. The main destinations for illegally traded individuals are reported to be
Thailand, Hong Kong, Singapore, China and USA (Sabine Schoppe, 2008a).
The Department of Wildlife and National Park Malaysia (PERHILITAN) and
Wild Life Malaysia have jointly banned the export of Malayan Box Turtle (MBT) to other
countries since 2005 (Schoppe, 2008a). However, evidence was found for continuing
export of the species after the Malaysian government imposed the export ban. A survey
in Malaysia in 2006 has shown more than 21,884 Malayan Box Turtles (C. amobinensis)
are illegally exported by 12 suppliers from Sabak Bernam, Malaysia to international
export markets (Henderson et al., 2004; Schoppe, 2008). In the recent time, a big illegal
shipment seizure report was published on the Traffic website, where the Malaysian
Customs Department seized 4.3 tonnes of illegally trafficked reptiles, including Malayan
box turtles, lizards, snake and tortoises, at the Malay–Thai border in December 2010
(TRAFFIC, 2010), which reflects the fact that the illegal trade of reptiles is rampant.
However, smugglers have not stopped their smuggling activities as Malaysian
enforcement further seized more than 2,066 Malayan box turtle at their different
operational raids in 2011, 2014 and 2016; these animals were destined for Thailand
(Source:http://www.geo.tv/latest.32907-malaysia-seizes-450-protected-snakes-turtles),
Anonymous, 2016b) (Figure 2.5). Information from the seizure reports indicate that 98%
adult turtles from Peninsular Malaysia and 88% from Sarawak are traded by individuals
and most of them were between 170 and 199 mm in median carapace length (Schoppe,
2008c). Mostly illegal shipments were found to enter by chartered air plane from
countries in South and Southeast Asia, and by road from neighboring countries through
overland routes and border crossings (Figure 2.5) (Henderson et al., 2004). Beyond
Malaysia, Thailand customs authority seized 19,000 Tuttle and tortoise species including
Malaysian box turtle (Cuora amboinensis) at Suvarnabhumi International airport in

43
Bangkok in the period 2008-2013. The highest exploitation of this species was recorded
in Indonesia, where 48,335 live species were seized by the US Fish and Wildlife Service
(USFWS) Law Enforcement Management Information System (LEMIS) and those
animals had been illegally exported from Indonesia to the US between 1998 and 2002
(Schoppe 2008; Wood et al., 1999). In the period of 2000-2005, Indonesia exported more
than 1 million turtles to the international markets but it officially recorded only 18,000
indicating that the majority of these shipments were undeclared (Wood et al., 1999). In
addition to those destined for markets in Thailand, animals are also redistributed to other
demand centers in Southeast Asia and East Asia (Figure 2.5) (Shepherd, 2014). There are
several factors as well as syndicate groups involved that are leading to the decline of this
species in Asia.

44
2.10 Current Species Detection Methods
Adulteration in food and herbal medicines has inflicted substantial concern to the
consumers in terms of economic loss, food allergy, religious observance, and food safety
(Arslan et al., 2006; Koh et al., 1998; Mane et al., 2009). Therefore, to enhance food
security, foodstuff containing even trace amounts of meat must be labeled correctly to
ensure food safety and safeguard customers’ interest, especially in the case of processed
food products where differentiation of the different constituents are extremely difficult.
Indeed, falsely labelled food products could be perilous to consumers with chronic
illnesses who require specific dietary needs. In Europe, food traceability and
Figure 2.5: Route map of illegal trade in Malaysia and international: blue arrows
for domestic route in Malaysia and red arrows for international illegal trade routes.
In inset (b), seizure of illegal shipment of the box turtle at Kuala Lumpur airport
(KLIA 1) by Malaysia customs department in 2013(Shepherd, 2014).

45
authentication were seriously considered following EC regulations that requires the
source of all raw materials in the food to be identified (Stanner, 2008). But several study
have discovered that undeclared meat (Table 2.2) including numerous wildlife species are
widely substituted in traditional medicine preparations (Coghlan et al., 2012;
Premanandh, 2013). Widespread uses of undeclared animal materials in foods and
traditional medicines are posing great threats to the food manufacturers, consumers as
well as sustainable biological conservations (Nicolai et al., 2009; Quillen & Murphy,
2006; Quinto et al., 2016). In order to enable food and drug control authorities to supervise
compliance with labelling requirements, suitable detection methods which could allow
unambiguous identification of animal or fish in foodstuff are prudent. The development
of methods for species traceability has been the subject of intense research in many
countries during the past two decades (Heinz & Hautzinger, 2009). Currently, animal
species or their products including highly processed materials are based on identifying
either DNA or protein (Nicolai et al., 2009; Calvo et al., 2002; Herman, 2001; Matsunaga
et al., 1999; Meyer, et al., 1995; Peter et al., 2004). A summary of fraud events in
processed food is presented in table 2.2.
Table 2.2: Food mislabeling and its abundance in meat and meat products
Investigated
products
Country Authentication
Issue
Percentage of
mislabeling cases
(number of analyzed
samples)
References
Hamburgers Brazil Undeclared
soy protein
30.8% Macedo et al., 2001
Hamburgers Mexico Undeclared
animal species
39% Flores et al., 2000
Sausages Mexico Undeclared
animal species
29% Flores et al., 2000
Meat products US Undeclared
animal species
15.9% (raw)
22.9% (processed)
Hsieh et al., 1995
Meat products Turkey Undeclared
animal species
22% Ayaz et al., 2006

46
2.11 Protein based Detection Techniques
Protein biomarkers are widely used in species identification using electrophoretic
(Bouwman et al., 2011) and chromatography techniques (Chen et al., 2013) ,or enzyme-
linked immunosorbent assay (ELISA) (Asensio et al., 2008) and isoelectric focusing
(IEF)(Pergande & Cologna, 2017). All of these proteins based techniques are proposed
to identify the specific animals such as cattle, sheep and swine (Marbaix et al., 2016)
Hollung et al., 2009; Xu et al., 2009), and poultry(Sentandreu et al.,2010). Numerous
protein markers have also been applied in the authenticity assay of food products (Chaze
et al., 2006).
2.12 Organ Specific Protein Detection Technique
Some organ specific proteins such as carnosine (ß-alanyl-Lhistidine) (CAR),
anserine (ß-alanyl-L-1 methylhistidine) (ANS), and balenine (ß-alanyl-L-3
methylhistidine) (BAL) are found in muscle, liver, kidney, and heart but not available in
plants (Aristoy & Toldrá, 1998, 2004). They play vital roles for the generation of meat
flavor in food (Aristoy & Toldrá, 1998). Therefore, these biomarkers could be used to
measure the animal substituents and sources in animal feeds as animal and fish by-
products are main protein sources in feeds preparation for ruminants and aquatic animals
(Aristoy & Toldrá, 2004). However, due to the outbreak of bovine spongiform
encephalopathy (BSE) in Europe, the use of animal byproducts has been banned within
the European Union under several regulations. Regulation (EC) 999/2001 and EC
1774/2002 prohibits explicitly the feeding of mammalian byproducts to ruminants or
prohibits the feeding of animals with proteins from the same species (Commission,
2001, 2002). Moreover, these biomarkers can’t distinguish specific protein in a complex
background and are also poorly sensitive in processed foods using HPLC techniques.
None the less, it has been reported that species as low as 0.5% can be detected by the

47
same technique (Aristoy & Toldrá, 1998), but this sensitivity needs to be investigated
further. Parvalbumins is known as muscle specific proteins of fish and has been applied
to differentiate closely related fish species (Berrini et al., 2006). However, there is need
to combine electrophoretic techniques with novel proteomic tools, such as in-gel
digestion and mass spectrometry (Martinez et al., 2004; Pischetsrieder & Baeuerlein,
2009). The electrophoretic and proteomics tools are laborious, expensive, demands
specialized skills, and also not reliable for the analysis of complex mixtures (Addis et al.,
2010; Pischetsrieder & Baeuerlein, 2009). Osteocalcin (OC) (γ-carboxyglutamate
containing protein) is another calcium binding protein that is also known as bone protein
because it is found as a major constituent of bones. This protein is used to determine
the species origin using enzyme-linked immunosorbant assay (ELISA), and highly
sensitive MALDI-TOF and Q-TOF mass spectrometry (MS) (Balizs et al., 2011).
However, MS is not only expensive but also needs specialized skills for its operation
and data interpretation, calling the need for simpler and more convenient methods to
perform this job.
2.13 Detection of Species Specific Protein by ELISA
There are several protocols and techniques that are proven to be safe for species
authentication studies but the most common among them is the ELISA. Because, of its
specificity, sensitivity and low cost, ELISA has become very popular to the regulatory
board for the routine analysis of species origin in foods (Asensio et al., 2008; Bellorini et
al., 2005; Giovannacci et al., 2004). Various type of commercial available immunoassay
kits has been applied for detection of raw and processed samples such as pork (Berger,
Mageau, Schwab, & Johnston, 1987; Chen & Hsieh, 2000), chicken (Martín et al., 1991),
and minced meats (pork 50%+beef 50%) (Notermans et al., 1983) over the decades.
However, ELISA has several drawbacks such as variable affinity, insensitivity to closely
related species, it needs extensive purification to eliminate cross-species reactions

48
(Khadijah et al., 2012) and is often hindered by cross-reactions occurring among closely
related species (Fajardo et al., 2010). Additionally, this method is based on soluble
proteins but soluble proteins are susceptible to denaturation at heat and are therefore
unable to be applied to processed foods (Hsu et al., 1999; Smith et al., 1996). It also
requires high titer antisera with specific antibodies for each meat species and its
sensitivity is not equivalent to that of DNA-based methods (Fajardo et al., 2010) and
also varies significantly in a mixed background of multiple species (Luo et al., 2011).
Because, ELISA method less specific and sensitivity and it could detect up to 2%
adulteration(Bhat et al.,2015) and was most suitable method for handling numerous
samples at a time where DNA based polymerase reaction methods can detect as low as
0.001% of pork (Ali et al., 2012).
2.14 Limitation of Protein Markers for Species Detection
The protein based methods have been reported to be unsuitable for species
identification in highly processed meat products due to the denaturation of protein by
intensive heating during food processing which in turn lead to modifications in the
antigenic activity of molecules and their mobility in electrophoresis (Still, 2003). This
changes the ability of the antibody to identify its target protein (Still, 2003). Moreover,
protein biomarkers is tissue specific (Adams, 2013) and can’t be applied in an authenticity
assay in terms of ground and complexed background samples (Anyinam, 1995).
Furthermore, as the majority of commercial methods have been designed to detect plasma
proteins, it has also been argued that adventitious contamination of meat with blood from
other species could lead to spurious results (Robinson & Bennett, 2002). Moreover, cross-
reactions of closely related species cannot be ruled out by protein-based methods even
though they are specific and sensitive; but these problems can be solved with DNA-based
methods especially species-specific PCR which has the potential to reach higher detection
sensitivity and specificity (Hsieh et al., 1998). Additionally, DNA is characterized by

49
more stability under intensive heating, pressures, and chemical processing, has a
conserved structure in whole body cells, has a great identification power since they are
rely on the recognition of specific DNA segments sequence of a particular tissue or animal
(Alves et al., 2013; Ernst & Coon, 2001; Lee et al., 2014).
2.15 DNA based Detection
Three major characteristic of the DNA molecule makes it an extremely useful tool
for molecular species identification schemes. First, DNA is an extremely stable and long-
lived biological molecule that can be recovered from biological samples that has been
under stress conditions (processed food products, coprolites, mummified plant tissues,
blood stains, etc) (Ali et al., 2012, 2014, & 2015). Therefore, analyses using nucleic acid
are less liable to be disrupted by processing of foodstuffs and medicinal composites. A
variety of methods have also been developed and they have shown that DNA molecular
markers are more stable and sensitive than proteins (Ali et al., 2014 & 2016). Secondly,
DNA is found in all biological cells and tissues, genetically identifiable information can
be attained from any sample from the same organism or same sources (saliva, faeces,
plant seeds, milk, etc). Finally, DNA can provide more information than proteins due to
the degeneracy of the genetic code and the presence of large non-coding stretches.
Nowadays, DNA based methodologies are improving rapidly and getting huge attention
as suitable techniques by researchers and clinical practitioners for the authentication of
target species (Amin et al., 2015).
In order to develop a DNA biomarker, it is important to select a conserve sequence
of the target species for primer designing. Conserve DNA sequence from both nuclear
and mitochondrial genes have been used to determine or distinguish the species in food
and medicinal products. However, nuclear genes DNA have several drawbacks. Because
of its high recombination rate and single copy linear DNA in each somatic cell which

50
make disturbance to perform DNA analysis in species authentication and highly
processed samples difficult. Moreover, it is less sensitive in processed samples because
DNA breakdown is a common phenomenon in heat treated samples. In contrast,
mitochondrial DNA possesses several advantages over nuclear DNA for studies of
speciation in meat products. It is relatively more abundant in total nucleic acid
preparations than nuclear DNA (more than 1000x copies of nuclear DNA found in each
cell), with the copy number of the mitochondrial genome exceeding that of the nuclear
genome several fold (Williams, 2007). Mitochondrial DNA also tends to be maternally
inherited so that individuals normally possess only one allele and thus sequence
ambiguities from heterozygous genotypes are generally avoided. The relatively high
mutation rate compared to nuclear genes has tended to result in the accumulation of
enough point mutations to allow the discrimination of even closely-related species. It
should however be noted that mitochondrial DNA also exhibits a degree of intraspecific
variability and so care has to be taken when studying differences between organisms
based on single base polymorphisms (Lombardi et al., 2005).
2.16 Cytochrome b (Cytb) Gene, A Potential Candidate Mitochondrial Gene for
Species Specific DNA Biomarker
The mitochondrial genome comprises a double-stranded DNA molecule of
approximately 16 kb in length and accounts for 1% to 2% of the total DNA in mammalian
cells (Figure 2.6). The use of mitochondrial DNA (mt-DNA) genes for species
identification may offer a series of advantages which is mentioned in the earlier section.
As there are thousands of copies of mitochondrial genes that are present in each cell, this
improves the possibility of amplifying template molecules of adequate size among the
DNA fragments brought about by heat denaturation. Intraspecific variability of mt-DNA
offers the possibility of discriminating breeds currently used in industrial swine

51
production (Coghlan et al., 2015). Moreover, vast knowledge of its organization, as well
as the availability of reported sequences in many species, also makes mt-DNA an easy
design of specific primers possible for the direct and specific identification of PCR-
amplified fragments (Ali et al., 2012; Rahman et al., 2014; Razzak et al., 2015).
Therefore, several types of mt-DNA genes such as 12S rRNA (Park et al., 2007), 16S
rRNA (Girish et al., 2007), Cytb (Coghlan et al., 2015), ND5, and a D-loop (Albers,
Jensen, Bælum, & Jacobsen, 2013) (Figure 2.6) have been used in molecular techniques
to devolve short length DNA biomarkers over the last two decades. Among these, Cytb
gene has gained huge attention in animal species authentication tests. Numerous animal
species including human to insects have been identified over the decades using complete
or partial Cytb sequences (Ali, et al., 2015a; Nicolai et al., 2009; Fajardo et al., 2009;
Meyer et al., 1994; Murugaiah et al., 2009). Therefore, of all the mt-DNA genes, Cytb is
one of the most frequent target genes used in species identification (Kerry, 2009; Purchas
et al., 2007) and is often used for phylogenetic studies and as reference gene in species-
specific PCR (IRD, 2006). It contains both variable and conserved regions that are
sufficient to resolve divergence at a population level and give high sensitivity (Coghlan
et al., 2015). Although, Kocher et al. (1989) have mentioned that the primer sequence
from 12S ribosomal RNA (rRNA) gene can amplify template DNA obtained from the
mtDNA of animals, including mammals, birds, amphibians, reptiles, fish and insects as
well as amplify the control region of mtDNA in most mammals and many fish species
(Ali et al., 2016). However, the DNA sequencing results obtained from 12S rRNA gene
didn’t reveal and described by authors (Ali et al., 2015). Besides this, studies on 12S
rRNA (BNF, 2005; Razzak et al., 2015), D-loop (Hambræus, 1999; Nathan et al., 1997),
subunits of NADH dehydrogenase 2, 5 and ATPase 6, 8 (Haunshi et al., 2009) also
provided detection limit ranging from 2% to 0.01% in mixture which offer highly
sensitive species detection systems. In contrast, analysis of the sequence of amplicons

52
from the cytb gene revealed inter- and intraspecific base sequence variations showing
higher sensitivity (0.1PG) (DIFVR, 2005).
Figure 2.6: Mammalian mitochondrial genome. The gene order is the same in all
mammalian species (Yusoff et al., 2015).
2.17 Species-Specific PCR Assay and Short-Length DNA Amplicon
Species-specific PCR assay targeting short length amplicon products obtained
from mt-DNA genes has received huge attention in recent years (Coghlan et al., 2015;
Fajardo et al., 2010). This technique has shown to be suitable for the detection of species’
adulteration because of a specific target sequence that can be detected in sequences of
different origin without the need of further sequencing or digestion of the PCR products

53
with restriction enzymes (Girish et al., 2004; Mafra et al., 2008). The principle of this
method is that specific lengths of DNA can be copied multiple times using species-
specific primers to provide a sufficient amount of targeted species DNA obtained from
analysed samples followed by conventional gel electrophoresis techniques with ethidium
bromide staining or via the automated real time qPCR technique being the most
frequently used (Do et al., 2010). Several species such as bovine DNA (Maede, 2006),
water buffalo and goat DNA (Arslan et al., 2006; Karabasanavar et al., 2011), sheep,
pork, horse, donkey (Doosti et al., 2014; Haunshi et al., 2009; Mane et al., 2012), cat,
and dog DNA (Ali et al., 2016) have been detected applying this techniques. Numerous
studies in meat species authentication reported that species-specific assay can be either
simplex or multiplex PCR assays. In a multiplex PCR assay, a single primer is used for
the conserved region of the target gene, whilst the second primer is varied depending on
the species. Thus, a multiple copy with different length target DNA fragments is
amplified and detected in a single PCR assay. Additionally, the multiplex technique is
widely accepted because it can detect multiple species in a single run, simultaneously
reducing both the cost and time. However, it has some drawbacks such as an inborn
complexity, fickle and lower sensitivity and unequal amplification for different-length
templates have made them incompatible for target quantification (Credoc, 2003; DIFVR,
2005; Henderson et al., 2003). On the contrary, singleplex PCR assays, even though they
cannot detect many species in a single run PCR, they are verified to be more sensitive,
accurate, and robust (Ali et al., 2015; Coghlan et al., 2015; Fajardo et al., 2010).
Presently, variable sensitivities and stability of singleplex PCR assays with different
PCR products lengths are widely reported, because, better sensitivity of this assay is
dependent on the reduction of amplicon length. According to Rojas et al. (2010),
amplicon length should be kept less than 150 bp for species detection in highly processed
foods analysis (Ilhak & Arslan, 2007), because larger amplicons are more susceptible to

54
breakdown into smaller fragments under harsh environments and often lead to cross-
specificity reaction which significantly diminish the assay acceptability (Rashid et al.,
2015a).
2.18 DNA Sequencing
DNA sequencing is the most straight-forward, definite and highly informative tool
to identify species as the obtained target sequence can directly be compared with the
known sequences in the Gene bank database in the National Center for Biotechnology
Information (NCBI). Although, species identification by PCR technique is widely
accepted, it is costlier and needs to additional preparations and is time consuming. In
contrast, the DNA sequencing technique provides more information without further
actions such as digestion with restriction endonuclease enzymes or further data analysis
(Panduranga, 1996). Commonly mitochondrial genes such as Cytb, 12S and 16S rRNA
genes are suitable for species identification because mitochondrial genes are highly
susceptible for mutation and provides more variable information, thereby it makes it
easier to distinguish between vertebrate animals, birds, fish, reptiles, mammals and
amphibians than the closely related species using DNA sequencing techniques (Fajardo
et al., 2008; Mutalib et al., 2012; Schoppe, 2008c; Spinks et al., 2012). Different species
such as birds, mammals (Mane et al., 2009; Rodriguez et al., 2003), fishes, amphibian
and reptiles (Hsieh et al., 2008; Montiel et al., 2000; Moore et al., 2003; Tamura et al.,
2011) and some invertebrate species (Rojas et al., 2010) have been identified using the
DNA sequencing technique. Abuzinadah et al. (2013) used the direct DNA sequencing
method and found 90-98% homology in the DNA sequence to chicken species (Gallus
gallus) in processed chicken products (Panduranga, 1996). But when they analyzed
samples labelled as chicken luncheon they detected 98% homology with turkey meat
(Meleagris gallopavo). They further used the same techniques and detected adulterants
in luncheon, burger, sausage and minced meat products using the 12S rRNA gene

55
followed by confirmation using species specific primers (Lo et al., 2006). Red deer, roe
deer, song thrush, pyrenean ibex, chamois, quail and sparrow have also been identified
using partial and fully DNA sequencing techniques (Gans et al., 2012a; Thitika et al.,
2014; Wu et al., 2009). Numerous research groups have reported that DNA sequencing is
easier and a convenient technique for the identification of target species. However, in
terms of short length DNA sequence and processed meat samples, it needs additional
preparations, such as a cloning system, multiplication and integration target sequence into
vectors, restriction digestion; all of which are costlier, time consuming, require expertise
and sensitive protocol procedures. Moreover, their use is further restricted in the analysis
of mixed-species meats as the heterogeneous amalgam of sequences from different
species hinders interpretation (Fajardo et al., 2010)
2.19 PCR- Restriction Fragment Length Polymorphisms (RFLP) Technique
PCR-restriction fragment length polymorphism (PCR-RFLP) technique is
currently used in species authentication including animals to microorganisms, where
amplified PCR products obtained from the conserved region of single or multiple species
using species specific primers and followed by digestion of those PCR products with
selective restriction digestive endonuclease enzymes by incubating for a certain period at
a specific temperature (Ball & Ackland, 2000; Davey et al., 2003). The acceptance of this
method is more and wider than the species-specific PCR assay, as the PCR-RFLP method
is intrinsically more accurate and specific so much so that it can easily discriminate
closely related species (Ball & Ackland, 2000; Coghlan et al., 2015; Henderson et al.,
2003). In addition, it is a good option to confirm the PCR products compared to DNA
sequencing without further use of extensive analytical tools because PCR products can
be subjected to incubation for fingerprinting with a wide variety of restriction enzymes.
This technique gives flexibility to researchers to verify the specificity without access to
direct sequencing facilities (Anyinam, 1995). It has been reported that the PCR-RFLP

56
technique is used for the identification of a variety of species including meat and fish.
Fajardo et al. (2006) have applied the PCR-RFLP technique to the identification of closely
related species such as red deer (Cervus elaphus), fallow deer (Dama dama), roe deer
(Capreolus capreolus), cattle (Bos taurus), sheep (Ovis aries), and goat (Capra hircus)
and they digested 712 base pair bp conserve region with MseI, MboII, BslI, and ApoI
endonucleases and obtained individual pattern for those species (Frézal & Leblois, 2008).
Another group applied PCR-RFLP assay to identify cow, chicken, turkey, sheep, pig,
buffalo, camel and donkey species using a 710-bp fragment obtained from all species with
Hind II, Ava II, Rsa I, Taq I, Hpa II, Tru 1I and Xba I endonuclease restriction enzymes
(Gillian et al., 2000). They were able to distinguish the mentioned species even though
all the PCR products where the same but the restriction sites had different lengths. Thus,
different levels of polymorphism were detected among samples. PCR–RFLP has also
received special interest for meat speciation as it exploits the sequence variation that
exists within defined DNA regions, allowing species differentiation of even closely
related species by digestion of selected DNA fragments with appropriate restriction
enzymes (Fajardo et al., 2008). However, some criteria need to be met when handling the
RFLP technique. Usually the method accepts larger size PCR products which are
susceptible to breakdown into smaller sized DNA fragments in heat processed samples.
Moreover, DNA movement also depends on the concentration of the agarose gel, it is
impossible to trace small DNA fragments, especially for sizes smaller than 50 bp
(Coghlan et al., 2015). In order to trace out small DNA fragments such as 15 bp, the
procedure should be integrated with sophisticated instruments which is costlier and time
consuming. Recently, Ali et al. (2012) analysed their small size of restriction digested
product (49, 33 and 27 bp) by using a lab on chip- based capillary electrophoresis
incorporated in an Agilent 2100 Bioanalyzer (Coghlan et al., 2015). Other similar
automated instruments that allows detection of small fragments (≥15 bp) are QIAxcel

57
capillary 31 electrophoresis system (Qiagen) and Biorad Experion. Generally, lab-on-a-
chip is a miniaturized device that integrates onto a single chip one or several analyses,
which are usually done in a laboratory; analyses such as DNA sequencing or biochemical
detection. Lab on chip based technique has numerous advantages, such as cost efficiency,
parallelization, diagnostic speed and sensitivity. The emergence of the lab-on-a-chip
mainly focused on human diagnostic and molecular biology analysis. However, this
technique cannot give the quantitative detection and is also expensive.
2.20 Real-Time PCR Assay
Real-time PCR has become one of the most widely accepted methods of species
specific DNA identification and quantification because it has a large dynamic range,
boasts tremendous sensitivity, can be highly sequence-specific, has little to no post-
amplification processing, and is amenable to increasing sample throughput (Smithers et
al., 1998). Real-time PCR is the technique of collecting data throughout the PCR process
as it occurs, thus combining amplification and detection into a single step. This is
achieved using a variety of different fluorescent chemistries that correlate PCR product
concentration to fluorescence intensity (Johnson & Walker, 1992). Reactions are
characterized by the point in time (or PCR cycle) where the target amplification is first
detected. This value is usually referred to as cycle threshold (Ct), the time at which
fluorescence intensity is greater than background fluorescence (Rohman, et al., 2011).
Generally, two common methods for the detection of PCR products in real-time PCR are:
(1) sequence-specific DNA probes consisting of oligonucleotides that are labelled with a
fluorescent reporter and (2) non-specific fluorescent dyes that intercalates with any
double-stranded DNA. In a sequence specific real-time PCR system, reporter dye
molecules give the fluorescent signals when the probe DNA sequences are completely
hybridized with its complementary DNA sequences of the target species (BNF, 2001;
Fajardo et al., 2010). Sequence specific technique with various reporter dyes are widely

58
used based on the instrument and experimental set up. They include TaqMan hydrolysis
probe (DIFVR, 2005b; Fajardo et al., 2010; Ilhak & Arslan, 2007) and Molecular
Beacon probe (BNF, 2001). Further, TaqMan chemistries are simpler and more reliable
than those of molecular beacon probes. This technique has been applied in several
studies for the detection of beef, pork, lamb, chicken and turkey meats and the target
products were less than 150 bp of regions of the cytochrome b gene. It can detect and
quantify as low as 0.1% in raw state and 0.5% in an admixture condition (Fernández et
al., 2005). Similarly, it can effectively detect turkey, beef, pork and sheep DNA sequences
in complex food products, with the range of detection of 0.02 pg and 0.80 pg and at 1%
in-mixture (Matthews & Strong, 2005). However, the drawbacks of this method is that it
only allows the amplification of short amplicons PCR (maximum 150bp) (Lenstra, 2010),
and there is the possibility of incompatibility of certain platforms with some fluorescent
dyes, the restricted multiplex capability and the high cost of most reagents and
instrumentation (Pereira et al., 2008). On the contrary, it is cost effective, with no need
for additional preparation. Usually, two types such as SYBR green I (NHMRC, 2006)
and EvaGreen (Chan, 1995) chemistries bases are used for the detection of target
species. Although, it is a nonspecific detection technique as it intercalates with both the
amplified and non-amplified ds-DNA and include SYBR green I (NHMRC, 2006) and
EvaGreen (Chan, 1995) chemistries. Recently, absolute quantification of viral genomes
of infectious hypodermal and hematopoietic necrosis virus, white spot virus, avian
leukosis virus and human immunodeficiency virus (HIV) using SYBR Green chemistry
has been described (Ali et al., 2016; Mane et al., 2012; Rahman et al., 2015). SYBR
Green-based real-time PCR assay does not require probes and, therefore, it is economical
and easily adoptable from the conventional PCR system. Furthermore, the SYBR Green-
based real-time PCR assay detects the target PCR product accumulation independent of
the sequence, as such it allows for the quantification of the viral genome with minor

59
variations in the sequence (Rodríguez et al., 2004). This may not be possible with probes
as they operate in a highly target sequence-specific manner and small changes in target
sequence may abrogate probe binding leading to generation of false negative results
(Rodríguez et al., 2004)
As can be observed, meat fraud implies many different illegal procedures that
need to be controlled by legal authorities through means of robust, accurate and sensitive
technical methodologies, in order to ensure that fraudulent or accidental mislabeling of
food does not arise. This review will specially deal with the case of meat substitutions as
one of the most important sources of meat fraud and how proteomics emerge as a new
and powerful tool capable to overcome the limitations of the control methods currently in
use to detect these practices.
2.21 Methods for Malayan Box Turtle Detection
Recently, Malayan box turtle (MBT) have been categorized as most vulnerable by
the IUCN and listed in Appendix II of the CITES database (Sabine Schoppe, 2008a).
However, this species is highly targeted in illegal markets in south and East Asia and
exported to East Asian countries for meat and medicinal purposes which causes the
potential threat to their population and biodiversity balance. Moreover, turtle materials
in any form is a potential haram ingredient in Halal foods as well as a zoonotic threat to
human health. Therefore, a sensitive and reliable method to detect trace amounts of turtle
materials is also necessary to prevent illegal trafficking of turtle meats and organs in local
and international markets as well as to safe guard the religious faith of 1.8 billion
Muslims around the world (Ali et al., 2015). Various detection techniques have been
addressed based on the morphological, taxonomic approaches to determine MBT turtle
species (Schoppe & Das, 2011). However, diagnostic morphological traits do not work
when products are degraded or highly treated/processed (Nejad et al., 2014). Turtle

60
materials are used in highly processed forms in various food items and traditional
medicine such as gels, pills and capsules (Hsieh et al. 2006). To overcome this limitation,
targeted molecular detection techniques to determine the target species in complex
background samples are required. DNA markers have proven to have higher stability,
specificity and thus reliability even in environmentally compromised and highly
processed samples (Ali et al., 2015; Zhang et al., 2007). Recently, several DNA based
methods, such as PCR–DNA sequencing (Lo et al. 2006), PCR-restriction fragment
length polymorphism (PCR-RFLP) (Moore et al. 2003), and randomly amplified
polymorphic DNA (RAPD) (Saez et al. 2004), have been documented for the detection
of MBT (C. amboinensis) and other turtle species. Hsieh et al., (2008) detected 14 turtle
species including C. amboinesis using PCR assay and DNA sequencing (Hsieh et al.,
2008). However, all involve very long length of target amplicons which have been
assumed to break down when subjected to food processing treatments or compromised
environmental conditions such as natural decomposition (Ali et al., 2015). A number of
studies have demonstrated that successful analysis of degraded DNA specimens or
compromised forensic evidence is improved with the use of smaller-sized PCR
amplicons, typically ≤150 bp in length (Turna, 2010). Usually, the smaller the amplicon
length, the better the recovery (Ali et al., 2012, 2015).

61
CHAPTER 3: MATERIALS AND METHODS
3.1 Sample Collection and Preparation
Ethical clearance was obtained from the University of Malaya’s Ethical
Committee for Laboratory Animals as well as the Department of Wildlife and National
Parks of Malaysia (PERHILITAN), located at Cheras in Malaysia, to study the occurrence
of MBT meat in the food chain and traditional Chinese medicines. Application was made
to study 22 turtle and tortoise species including 12 species of the Cuora genus, but the
Department of Wildlife and National Parks of Malaysia (PERHILITAN) only permitted
the study of 5 species, namely, the Malayan box turtle (Cuora amboinensis), the pond
slider turtle (Trachemys scripta), the Malayan soft-shell turtle (Dogonia suplana), the
yellow-headed temple turtle (Heosemys annandalii) and the elongated tortoise
(Indotestudo elongate). Only the Malayan box turtle (Cuora amboinensis) samples was
found at the authentic shop in various commercial wet markets, Malaysia. Authentic raw
meat samples of Malayan box turtle(MBT) (Cuora amboinensis accession: FJ763736.1)
and Chinese edible frog (Hoplobatrachus rugulosus) accession: NC_019615.1), and
common meat species (chicken (Gallus gallus accession: KP269069.1), cow (Bos taurus
accession: GU947021.1), goat (Capra hircus accession: KR059217.1), pig (Sus scrofa
domestica accession: AP003428.1), pigeon (Columba livia accession: KP168712.1 ),
sheep (Ovis aries accession: NC_001941.1), duck (Anas platyrhychos accession:
EU755253.1), buffalo (Bubalus bubalis accession: NC_006295.1)), fish (giant river
prawn (Macrobrachium rosenbergii accession: NC_006880.1), cod (Gadus morhua
accession: NC_002081.1), salmon (Salmo salar accession: NC_001960.1), carp
(Cyprinus carpio accession: KU050703.1)) and plants (wheat (Triticum aestivum
accession: NC_007579.1) and cucumber (Cucumis sativus accession: NC_016005.1))
were purchased from Pasar Borong, Pudu Raya and Selangor on three different days to

62
increase the genetic diversity of the samples. Venison (Odocoileus virginianus accession:
KM612279.1) meats from three different animals were obtained in triplicate from the
Faculty of Veterinary Science, University of Putra Malaysia located at Serdang in
Selangor, Malaysia. Stray dog (Canis lupus familiaris accession: KF907307.1), cat (Felis
catus accession: NC_001700.1) and rat (Rattus rattus accession: NC_012374.1) muscle
meats were donated by Kuala Lumpur City Hall (KLCH) or Dewan Bandaraya Kuala
Lumpur (DBKL), Air Panas, Kuala Lumpur and monkey (Macaca fascicularis accession:
NC_012670.1) meat was a gift from the Department of Wildlife and National Park
Malaysia (PERHILITAN/DWNPM), Cheras, Kuala Lumpur. DBKL routinely killed
these animals for population control and public security in the town area and sufficient
amount of muscle tissue samples of these species were taken from them following
institutional and country laws. Information of all collected samples is compiled in Table
3.1. The identities of all of the collected samples of animal, fish and plant species were
authenticated and confirmed by veterinary, fisheries and botanical taxonomy experts at
the University of Malaya. All samples were transported under ice-chilled conditions and
cut into small pieces for storage in a freezer at -20 °C until further use to prevent the
further degradation of the tissues and DNA. On the other hand, 273 traditional Chinese
medicinal samples for detoxification, antipyretic, nocturnal-urination, coughing, anti-
inflammation, anti-cancer and sex-stimulator drugs and others were collected from 15
different shops of Chinese medicines across Kuala Lumpur and Selangor, Malaysia
(Tables 4.6 and 4.13). Similarly, 189 samples (21x9) of 21 different branded commercial
meat products (Table 4.6), namely, chicken and beef meatball, burger and frankfurter
products were purchased from 10 different wholesale food shops in Kuala Lumpur and
Selangor. All collected samples were kept in the samples’ chamber of the freezers
according to the manufacturer’s guideline.

63
Table 3.1: Information of collected samples
No Species Sources Geographic coordinates of the sources Number of samples
1 Malayan box turtle Wet market Paser Borong, Pudu Raya and Selangor, Malaysia 30
2 Frog Wet market Paser Borong, Pudu Raya and Selangor, Malaysia 15
3 Chicken Tesco supermarket Paser Borong, Pudu Raya and Selangor, Malaysia 30
4 Cow AEON supermarket Paser Borong, Pudu Raya and Selangor, Malaysia 30
5 Goat AEON supermarket Paser Borong, Pudu Raya and Selangor, Malaysia 30
6 Pig Tesco supermarket Paser Borong, Pudu Raya and Selangor, Malaysia 25
7 Pigeon Wet market Paser Borong, Pudu Raya and Selangor, Malaysia 20
8 Sheep AEON supermarket Paser Borong, Pudu Raya and Selangor, Malaysia 20
9 Duck Wet market Paser Borong, Pudu Raya and Selangor, Malaysia 25
10 Buffalo Wet market Paser Borong, Pudu Raya and Selangor, Malaysia 20
11 Prawn Wet market Paser Borong, Pudu Raya and Selangor, Malaysia 30
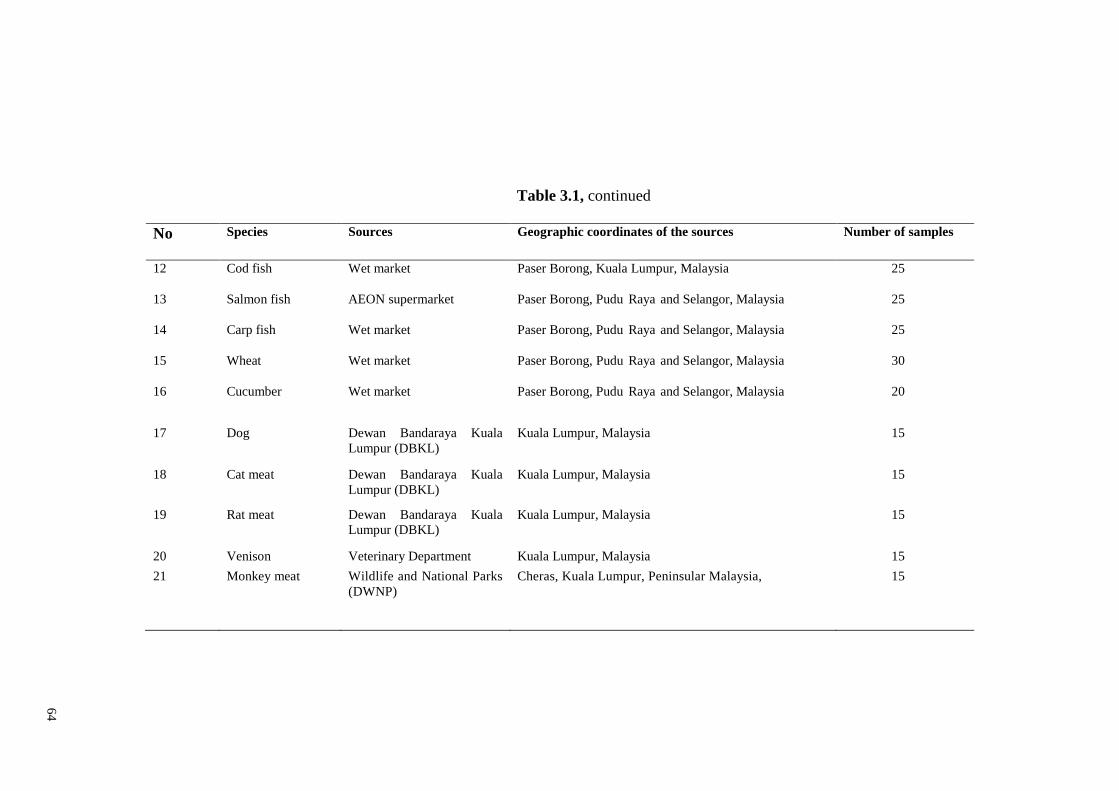
64
Table 3.1, continued
No Species Sources Geographic coordinates of the sources Number of samples
12 Cod fish Wet market Paser Borong, Kuala Lumpur, Malaysia 25
13 Salmon fish AEON supermarket Paser Borong, Pudu Raya and Selangor, Malaysia 25
14 Carp fish Wet market Paser Borong, Pudu Raya and Selangor, Malaysia 25
15 Wheat Wet market Paser Borong, Pudu Raya and Selangor, Malaysia 30
16 Cucumber Wet market Paser Borong, Pudu Raya and Selangor, Malaysia 20
17 Dog Dewan Bandaraya Kuala
Lumpur (DBKL)
Kuala Lumpur, Malaysia 15
18 Cat meat Dewan Bandaraya Kuala
Lumpur (DBKL)
Kuala Lumpur, Malaysia 15
19 Rat meat Dewan Bandaraya Kuala
Lumpur (DBKL)
Kuala Lumpur, Malaysia 15
20 Venison Veterinary Department Kuala Lumpur, Malaysia 15
21 Monkey meat Wildlife and National Parks
(DWNP)
Cheras, Kuala Lumpur, Peninsular Malaysia, 15

65
3.2 Preparation of Binary and Ternary Meat Mixtures for Specific PCR and
PCR-RFLP Assay
To simulate the complexity of the matrices, two types of binary mixtures, i.e.,
MBT-beef and MBT-goat, were made in a total volume of 100 g of specimen by mixing
MBT meat in a proportion of 10%, 1%, 0.5%, 0.1% and 0.01% with an adjusted amount
of beef and goat meat (Ali et al., 2012, 2014a, 2015; Rashid et al., 2015). Two types of
ternary admixtures were compiled following the procedure by Ali et al., (2012), i.e.,
MBT-chicken-wheat flour and MBT-beef-wheat flour were made by mixing 10%, 1%,
0.5% 0.1%, and 0.01% of turtle meat into chicken, beef and wheat flour, at a ratio of
20:80:100, 2:98:100, 0.04:99.60:100, 0.2:99.8:100, and 0.02:99.98:100. Finally, the
required amount of deionized water was added to the admixtures and briskly ground with
a blender (Pensonic Super Blender-PB-3205, 13600 Prai, Penang, Malaysia) to obtain a
homogenous, semi-solid slurry. The admixture samples were autoclaved at 120 °C under
45 psi pressure for 2.5 h. All prepared admixture meat samples were kept at -20 °C for
further DNA extraction. To prevent contamination, each of the mixtures was made and
tested on separate occasions in triplicate, and all of the prepared admixtures were stored
at -20 °C prior to DNA extraction.
3.3 Sample Preparation for Real Time PCR Assay
For the determination of the lower limit of detection (LOD) and lower limit of
quantification (LOQ) either for Malayan box turtle or eukaryotic control content,
approximately 50-60 g of MBT, chicken and beef pure muscle meat were sterilized
individually at 120 C under 45-psi pressure for 2.5 hours on three different days. Once
the autoclaving was completed, samples were kept to cool at room temperature and finally
stored in -20 °C or had the DNA extracted immediately for further analysis. To evaluate
the performance of the real time PCR assay in complex matrices, two types of binary

66
mixtures, namely, Malayan box turtle-chicken and Malayan box turtle-beef were made
into a total amount of 100 g specimen by spiking of MBT meat at a proportion of 10%,
1%, 0.1% , 0.01% and 0.001% with an adjusted amount of ground chicken and beef
meat. All binary admixed meats were made following the procedures of Ali et al. (2012,
2015) and Rashid et al. (2015). Sufficient (50-100 ml) sterile phosphate-buffered saline
(PBS; 136 mM NaCl, 1.4 mM KH2 PO4, 8.09 mM Na2HPO4. 12 H2O, and 2.6 mM KCl,
pH 7.2) was added to the admixtures and briskly grinded with a blender (Pensonic Super
Blender-PB-3205, 13600 Prai, Penang) to obtain a homogenous semi solid-slurry. To
prevent contamination, every mixture was taken out separately using separate
materials and a separate blender on three different days by three independent analysts.
Fifty to sixty grams of each type of mixture were sterilized at 120 C under 45 psi pressure
for 2.5 h to check the thermal effect on the target species. Once the tissues were
autoclaved, the samples were left to cool at room temperature inside a lamina flow cabinet
with positive air flow. Finally, all raw and heat processed binary admixture samples were
used directly for DNA extraction or stored at -20 °C for later DNA extraction.
3.4 Preparation of Chicken and Turtle Meatball for Specific PCR Assay
Meatballs were prepared according to Rahman et al. (2014) with a well-adjusted
amount of ground chicken and turtle meat with culinary salt, garlic and other ingredients
(Table 3.2). To obtain MBT meat contaminated meatballs, 1%, 0.5%, 0.1%, and 0.01%
of turtle meats were added with 100 g of deboned chicken. All other ingredients were
properly mixed with meats by vigorous blending and the emulsified homogenous meat
mixtures were then given a meatball shape. To simulate cooking and extensive heat
treatment effect, the prepared meatballs were subjected to autoclaving at 120 °C at 45 psi
pressure for 2.5 h. All samples and preparations were stored at −20 °C for further DNA
extraction.
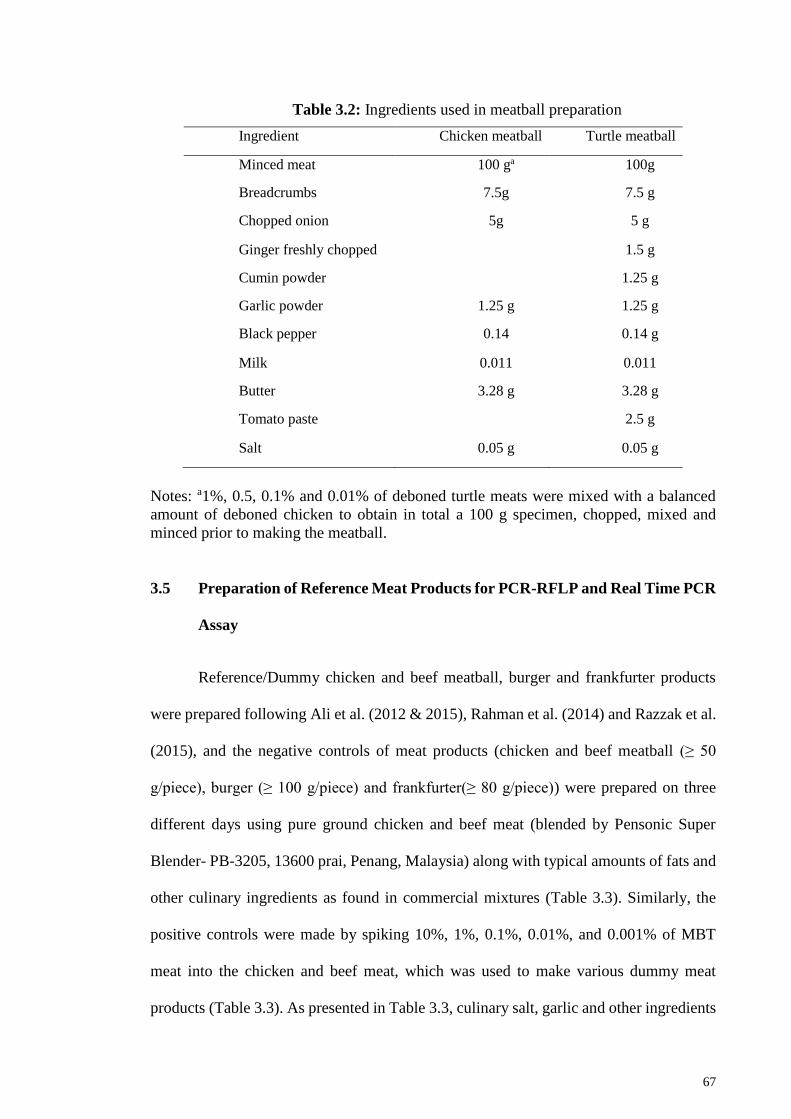
67
Table 3.2: Ingredients used in meatball preparation
Ingredient Chicken meatball Turtle meatball
Minced meat 100 ga 100g
Breadcrumbs 7.5g 7.5 g
Chopped onion 5g 5 g
Ginger freshly chopped 1.5 g
Cumin powder 1.25 g
Garlic powder 1.25 g 1.25 g
Black pepper 0.14 0.14 g
Milk 0.011 0.011
Butter 3.28 g 3.28 g
Tomato paste 2.5 g
Salt 0.05 g 0.05 g
Notes: a1%, 0.5, 0.1% and 0.01% of deboned turtle meats were mixed with a balanced
amount of deboned chicken to obtain in total a 100 g specimen, chopped, mixed and
minced prior to making the meatball.
3.5 Preparation of Reference Meat Products for PCR-RFLP and Real Time PCR
Assay
Reference/Dummy chicken and beef meatball, burger and frankfurter products
were prepared following Ali et al. (2012 & 2015), Rahman et al. (2014) and Razzak et al.
(2015), and the negative controls of meat products (chicken and beef meatball (≥ 50
g/piece), burger (≥ 100 g/piece) and frankfurter(≥ 80 g/piece)) were prepared on three
different days using pure ground chicken and beef meat (blended by Pensonic Super
Blender- PB-3205, 13600 prai, Penang, Malaysia) along with typical amounts of fats and
other culinary ingredients as found in commercial mixtures (Table 3.3). Similarly, the
positive controls were made by spiking 10%, 1%, 0.1%, 0.01%, and 0.001% of MBT
meat into the chicken and beef meat, which was used to make various dummy meat
products (Table 3.3). As presented in Table 3.3, culinary salt, garlic and other ingredients

68
were added to the mixtures and blended vigorously until a homogenous mush was
obtained, and the emulsified homogenous mixtures were then shaped into meatball,
burger, and frankfurter products (Razzak et al., 2015). All samples were prepared in
triplicate on three different dates by three independent analysts. All of the prepared meat
products were individually subjected to autoclaving at 120 C under a pressure of 45 psi
for 2.5 h, after which, all of the meatballs were stored at -20 °C for further DNA
extraction.
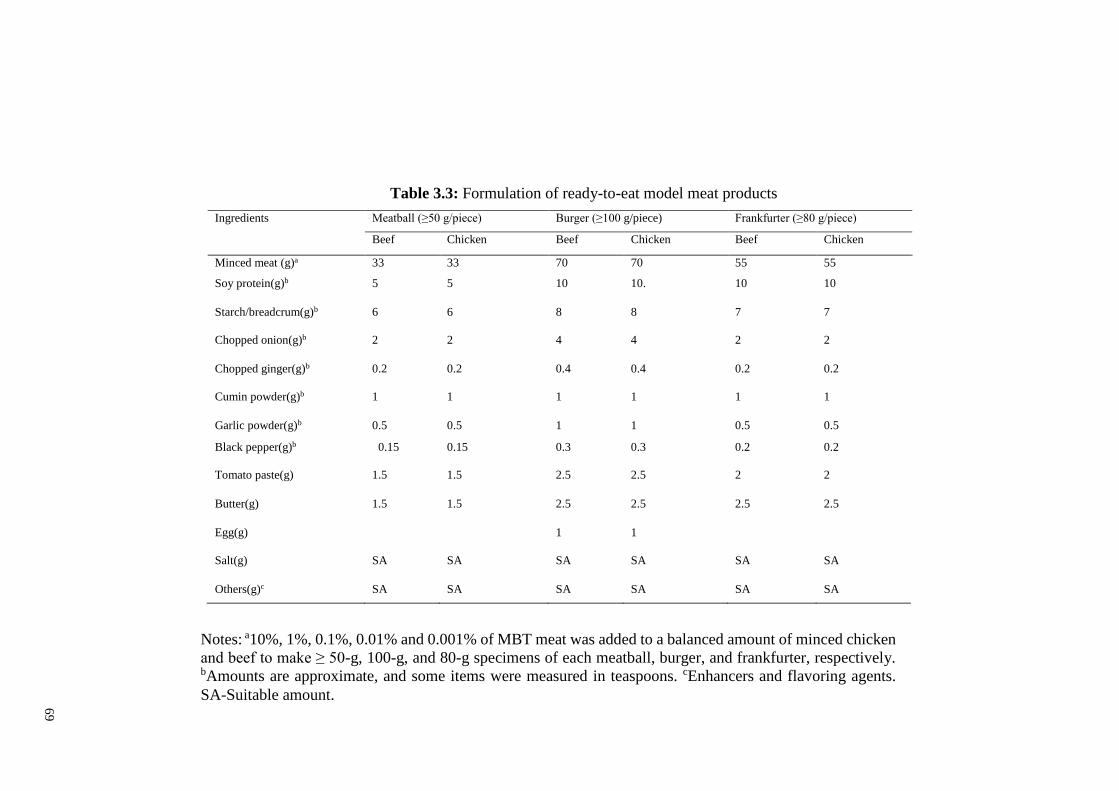
69
Table 3.3: Formulation of ready-to-eat model meat products
Ingredients Meatball (≥50 g/piece) Burger (≥100 g/piece) Frankfurter (≥80 g/piece)
Beef Chicken Beef Chicken Beef Chicken
Minced meat (g)a 33 33 70 70 55 55
Soy protein(g)b 5 5 10 10. 10 10
Starch/breadcrum(g)b 6 6 8 8 7 7
Chopped onion(g)b 2 2 4 4 2 2
Chopped ginger(g)b 0.2 0.2 0.4 0.4 0.2 0.2
Cumin powder(g)b 1 1 1 1 1 1
Garlic powder(g)b 0.5 0.5 1 1 0.5 0.5
Black pepper(g)b 0.15 0.15 0.3 0.3 0.2 0.2
Tomato paste(g) 1.5 1.5 2.5 2.5 2 2
Butter(g) 1.5 1.5 2.5 2.5 2.5 2.5
Egg(g) 1 1
Salt(g) SA SA SA SA SA SA
Others(g)c SA SA SA SA SA SA
Notes: a10%, 1%, 0.1%, 0.01% and 0.001% of MBT meat was added to a balanced amount of minced chicken
and beef to make ≥ 50-g, 100-g, and 80-g specimens of each meatball, burger, and frankfurter, respectively. bAmounts are approximate, and some items were measured in teaspoons. cEnhancers and flavoring agents.
SA-Suitable amount.

70
3.6 Sample Preparation for Target DNA Stability Test
All of the MBT meat samples were individually cut into smaller pieces, and
approximately 5-6 g of each sample were cooked at 100 °C for 60, 90, 120 and 150 min
to simulate traditional cooking. Secondly, all meat samples were autoclaved at 120 °C
under 45 psi for 60, 90, 120 and 150 min. Finally, microwave cooking was performed at
600, 650 and 700W (watt) for 30 min, and all of the heat-treated samples were stored at -
20 °C until further use. Total DNA was extracted from 30 mg of the heat-treated samples
using a Yeastern Genomic DNA Mini Kit (Yeastern Biotech Co., Ltd. Taipei, Taiwan).
3.7 DNA Extraction of Animals and Plants Samples
Total DNA was extracted from 30 mg of muscle tissue of each animal species,
heat processed or admixed samples as well as from the binary, ternary mixtures of turtle
meat spiked models and commercial meat products using the Yeastern Genomic DNA
Mini Kit (Yeastern Biotech Co., Ltd, Taipei, Taiwan) following the manufacturer’s
instruction. DNA from plant sources was extracted following Ma et al. (2000) using
traditional CTAB (Cetyl Tri Methyl Ammonium Bromide) extraction kits. The purity and
concentration of all of the extracted DNA was determined using a Biodrop UV-VIS
spectrophotometer (Biochrom Libra S70, Biochrom Ltd, Cambridge, UK) based on
absorbance at 260-280 nm in the calculating ratios of A260/280. The purified genomic
DNA was kept at - 20 °C until further use.
3.8 DNA Extraction of Traditional Chinese Medicines (TCM)
DNA extraction from traditional Chinese Medicines was carried out with a slight
modification. Total genomic DNA was extracted from 30 mg of traditional Chinese
medicine (TCM) samples using Yeastern genomic DNA (animal tissue DNA) mini kits

71
(Yeastern Biotech Co., Ltd. Taipei, Taiwan). Firstly, the powder was ground with a micro
pestle and dissolved properly with 400 µL GT buffer. A high amount of GT buffer (400
µL) was used to properly dissolve the powder samples and ensure the proper dissociation
of the sample tissues and contaminants. Due to the over dried form of TCM and Chinese
herbal jelly powder, twice the normal amount of GT (400 µL) and GBT (400 µL) buffer
were added to these samples to avoid the formation of solid glue or to allow settling down
of the target samples and kept for a prolong incubation (60 minutes) period for tissue
lysis. Prolong incubation increases the DNA yield and dissociates the unwanted materials
from the target samples.
To lyse the protein molecules in the target samples, thirty (30) µl (10 mg/mL) of
protein kinase enzyme was added, shaken vigorously and incubated for 60 minutes at 60
°C to ensure the samples lysate clearly. Afterwords, 400 µL of GBT buffer were added
into the sample, shaken vigorously and incubated for 60 minutes at 60 °C which
confirmed clear lysis and dissociation of polysaccharides and phenol from the samples.
At this stage, protein molecules undergo breakdown and DNA in chaotrophic salt is
bound to the glass fibre matrix of the spin GD column. To remove the insoluble materials,
samples (phenol, chloroform, polysaccharides or any possible remaining proteins) were
centrifuged (Allegra X-30R centrifuge, CAT A99471, Backman Coulter, Inc, California,
U.S.A) for 3 minutes at 16,000 X g where after the supernatant was transferred to a new
1.5 mL micro-centrifuge tube and checked for any sediment. 200 µL of absolute ethanol
was added in the supernatant to clear the lysate and immediately shaken vigorously for
10 second and again centrifuged for 2 minutes at 16,000 X g to remove the precipitate.
Finally, the clear solution was transferred into a GD column containing a fiber matrix and
centrifuged for 2 minutes at 16000 X g where dissociated DNAs are bound into the fiber
matrix in the GD column. The resulting bound DNA in the fiber matrix in the GD column
was rinsed twice with 400 µL of W1 buffer (ethanol) and 600 µL of wash buffer and

72
centrifuged at 16,000 X g for 3 minutes to remove the non DNA molecules or impurities.
Finally, 100 µL pre-heated DNA elution buffer was added into the purified DNA which
was bound onto the fiber matrix and left for 10 minutes until dissolving of the fibre bound
DNA into the elution buffer was completed. Once properly dissolved, purified DNAs
were eluted by low salt elution buffer. The yield and quality of extracted DNA was
determined with a NanoDrop ND-100 spectrophotometer (NanoDrop Technologies Inc.
Montchanin, DE, UK) based on absorbance at 260 nm and purity ratio (A260/280).
3.9 Design of Oligonucleotide Primers
A pair of MBT-specific primers (MBT-F and MBT-R) targeting a 120 bp site of
the mitochondrial cytochrome b (mt-cytb) gene were designed using publicly available
primer3 Plus software (www.bioinformatics.nl/cgibin/primer3plus/primer3plus.cgi). To
check species specificity, the designed primers were aligned against the similar sites of
the 28 different species mentioned above (Table 3.1) using MEGA 5 software. They were
blasted in the National Center for Biotechnology Information (NCBI) by the basic local
alignment search tool (BLAST) against non-redundant nucleotide sequences. The
designed primers were synthesized and supplied by the 1st Base Laboratories Sdn. Bhd.
(Selangor, Malaysia). For internal control, a 141-bp conserved fragment of eukaryotic
18S rRNA gene was amplified from all species using the Eukaryotic primers (Euk-F and
Euk-R) described elsewhere. For the comparison study, another universal primer pairs set
(L1373-F and H1478-R) of 165 bp length for multiple turtle including Cuora amboinesis
species detection was used (Lo et al., 2006). All primer sequences and target product-
sizes used are given in Table 3.4.

73
Table 3.4: Oligonucleotide primers used in this study
Target gene Primer Sequence (5 -3) Amplicon
(bp)
Reference
Cytb MBT-F AGCCCTTCTAACATCTCTGCTC 120
MBT-R CTCACCAGACATCTCACTAGCA
18S rRNA Euk-F GGTAGTGACGAAAAATAACAATACAGGAC 141 Rojas et al.,
(2010)
Euk-R ATACGCTAT TGGAGC TGGAATTACC
12S rRNA, L1373-F CGCTCGAGAGAAATGGGCTACATTTTCT 165 Lo et al., (2006)
H1478-R TGACTGCAGAGGGTGACGGGCGGTGTGT
3.10 Specific PCR Assay Optimization
To confirm the theoretical specificity determined by the BLAST analysis (source:
http://blast.ncbi.nlm.nih.gov/Blast.cgi), the designed primers were challenged against 20
different non-target species (Frog, chicken, cow, goat, pig, pigeon, monkey, rat, cat, dog,
sheep, duck, water buffalo, deer, giant river prawn, cod fish, salmon fish, carp fish, wheat,
cucumber) by performing an optimized PCR assay against the template DNA of the said
species. Additionally, in silico analysis was performed and a phylogenetic tree was
constructed using MBT-specific 120 bp site of the cytochrome b gene against 66 reptile
species. Finally, theoretical deigned primer set was optimized with the following
modifications; three annealing temperatures such as 58, 59 and 60 °C and different
concentration of PCR master mix (4-7 unit µ/L of Tag DNA polymerase, and 130-160
µM each dNTP and 1-1.30 mM MgCl2), 20 ng of extracted DNA concentration were
mixed with 150 nM of each primer to determine the optimized PCR amplification.
Generally annealing temperature chosen for a PCR product depends directly on length
and composition of the primers. In each reaction a negative template control of PCR
reaction (a PCR reaction mixture without template DNA and replaced with 18.2 Ω
Millipore-nuclease free water) and internal control (18S rRNA gene) with similar

74
concentration were included to ensure the purity of the PCR reaction mixture from
contaminating DNA. All steps of optimization were recorded and analyzed and compared
results in each other. Finally optimized PCR assay was performed in a 20 μL reaction
mixture holding 1× PCR master mix (Promega, Corp., Madison, WI, USA) composed of
5 unit μ/Lof Taq DNA polymerase (supplied in a proprietary reaction buffer pH 8, 150
μM each dATP, dGTP, dCTP, dTTP and 1.25 mM MgCl2), 150 nM of each primer and
20 ng of extracted DNA. PCR cycling was done in Veriti 96-well Thermal Cycler
(Applied Biosystems Inc., Foster, CA, USA), using an initial denaturation at 95 °C for 3
min followed by 35 cycles of denaturation at 95 °C for 20 s, annealing at 58 °C for 20 s,
extension at 72 °C for 30 s and a final extension at 72 °C for 5 min. Negative template
control of PCR reaction (a PCR reaction mixture without template DNA and replaced
with 18.2 Ω Millipore-nuclease free water) and eukaryotic internal control (18S rRNA
gene) primer pair with similar concentration were included to eliminate false positive
results as well as ensure the purity of the PCR reaction mixture from contaminating DNA.
The separation of PCR products was performed in 2% agarose gel (1st base Laboratories,
Pte. Ltd, Selangor, Malaysia) in 1× TBE buffer at a constant voltage of 120 V for 60 min,
pre-stained with 6× loading dye and using a 100 to 1000 bp DNA marker (Promega
Corporation, 2800 Woods Hollow Road · Madison, WI 53711-5399, USA) as reference
standard. PCR product on agarose gel was visualized using a gel image documentation
system (AlphaImager HP, Santa Clara, CA, USA).
3.11 DNA Sequencing and Data Analysis
To establish the assay validity and PCR products, target amplicon (120 bp) was
subjected into DNA sequencing through the following steps. Firstly, PCR products were
purified using the High Pure PCR Product Purification kit (Roche Diagnostics, GmbH,
Roche Applied Science 68298, Mannheim, Boehringer, Germany) and ligated into a
plasmid vector (PJTI1.2) using the TOPOTM TA Cloning Kit (Invitrogen, Carlsbad,

75
CA, USA) following the manufacturer's instructions. DH5α-T1 Escherichia
coli (Invitrogen) were added into recombinant plasmids for the transformation reaction
and incubated overnight at 37 °C on agar plate containing X-Gal (5-bromo-4-chloro-3-
indolyl-β-D-galactopyranoside). About forty colonies were selected from each agar plate,
and plasmid DNAs were isolated and purified using the QIAprep Spin Miniprep Kit
(Qiagen Gmbh, Hilden, Germany). Finally, cloned target DNA sequencing was carried
out with universal LpJET1.2 forward primer (5′-CTGCTTTAACACTTGTGCCTGA-3′)
and LpJET1.2 reverse primer (5′-TACGATTGGTGGAGTAGTCCTT-3′) provided by
the cloning kit manufacturer and analyzed with an ABI Prism 3100 genetic analyzer
(Applied Biosystems, Perkin-Elmer/Cetus, Norwalk, Connecticut, USA). Chromatogram
sequencing files where inspected with Chromas 2.2 software (Technelysium)
(http://technelysium.com.au/wp/).
3.12 Sensitivity Tests for Specific PCR and PCR-RFLP Assay
The sensitivity of the assay was determined using serially diluted DNA extracted
from pure meat tissues (10, 1, 0.1, 0.01, 0.001, 0.0001 ng. μ/L) as well beef-turtle and
goat-turtle binary and chicken-turtle-wheat flour ternary mixtures prepared by spiking
10%, 1%, 0.5%, 0.1% and 0.01% (w/w) of turtle meat into an adjusted amount of beef,
goat and chicken in a 100 g mixture, whereas, 1%, 0.5%, 0.1% and 0.01% turtle meat was
spiked in chicken meatballs for specific PCR assay. Similarly, sensitivity tests of admixed
for PCR-RFLP assay was designed with the following samples from a binary mixture,
ternary mixture and dummy meat products (chicken and beef meatballs, burgers and
frankfurters). All of the admixed meat samples were made by spiking the beef, chicken
and goat meat with 10%, 1%, 0.1%, and 0.01% MBT meat (Table 3.3). The lower limit
of detection (LOD) was determined by amplification of 10-fold serially diluted (10, 1,
0.1, 0.01, 0.001, 0.0001 ng μL–1) target species DNA in nuclease-free water. Total DNA
was extracted as described above.
76
3.13 Comparison of Target DNA Sensitivity and Stability
To check the comparative stability and sensitivity of the newly developed (120 bp
site of the cytochrome b gene of MBT) and previously documented shortest target (165
bp site of the 12S rRNA gene)(Lo et al., 2006) PCR assays, PCR was performed with 20
ng MBT DNA template extracted from turtle meats after boiling at 120 °C for 60, 90, 120
and 150 min; autoclaving at 120 °C for 60, 90, 120 and 150 min at 45 psi pressure and
microwave cooking at 600, 650 and 700 Watt for 30 min. In addition, the sensitivity of
the newly designed and published targets was tested by a 10-fold serial dilution of
extracted DNA from pure raw meats.
3.14 Enzymatic Digestion for PCR Product Authentication with PCR-RFLP
Assay
To authenticate the specific PCR product, the MBT-specific PCR product (120
bp) was digested with Bfa1-restriction endonucleases (New England Biolabs, Ipswich,
MA, USA) in a 30 μL reaction mixture containing 12 μL of PCR product, 1 μL of
restriction enzyme (1 FDU), 2 μL of 10x digestion buffer supplied with enzyme and 15
μL of distilled water. All of the mixtures were mixed properly and kept in a water bath at
37 °C for 30 min, and DNA digestion was stopped by placing the mixture in another water
bath at 80 °C for 20 min. For the RFLP analysis, 1 μL of digested PCR product was
applied to a microfluidic lab-on-chip well using a 1 K DNA analysis kit (Experion, Bio-
Rad, Inc., USA), and the desired fragments were separated in a Bio-Rad Automated
Electrophoresis station (Experion, Bio-Rad, Inc., USA). The Experion automated
electrophoresis system employs Lab Chip microfluidic technology to automate nucleic
acid electrophoresis and this system is widely used for the applications: DNA analysis-
quantitation and sizing of restriction digests (15 to 1500bp), amplified DNA,
microsatellites, and amplified fragment length polymorphisms (AFLPs). It integrates

77
separation, detection, and data analysis within a single platform. Using much smaller
sample and reagent quantities than standard analysis methods, the Experion system
accomplishes analysis in a single 30–40 minute, automated step. Thereby, lab-on-a-chip
technology provides more convenient for smaller DNA fragment analysis and productive
way to gather and store experimental data.
3.15 PCR-RFLP Analysis of Admixed and Processed Samples
The PCR products from the binary mixture, ternary mixture and commercial meat
products (chicken and beef meatballs, burgers and frankfurters) were digested with Bfa1-
restriction endonucleases (New England Biolabs, Ipswich, MA, USA). All of the admixed
meat samples were made by spiking the beef, chicken and goat meat with 10%, 1%, 0.1%,
and 0.01% MBT meat (Table 3.3). Further, all types of PCR products of the heat
processed (boiling, autoclaving and microwave cooking) samples were digested with
Bfa1-restriction endonucleases (New England Biolabs, Ipswich, MA, USA). Further
RFLP analysis was carried out with Bio-Rad Automated Electrophoresis station
(Experion, Bio-Rad, Inc., USA). The total procedure is described in 3.14 section
3.16 SYBR-Green Duplex Real Time PCR Assay Optimization
The real-time PCR assay was optimized and executed in a 20 μL reaction mixture
(20 μL per reaction) containing 10 μL Power SYBR Green PCR Master Mix (Applied
Biosystems, Foster, CA, USA; Thermo Fisher Scientific, Foster, CA, USA), 1.5 μL
forward primer (150 nM), 1.5 μL reverse primer (150 μM) and 3 μL template DNA (10
ng) and 4 μL of nuclease-free water. Same concentration (150 nM) of eukaryotic (18S
rRNA) primer pairs as the endogenous positive control were combined into the reaction
mixture to verify the target DNA amplification and ensured the presence of good quality
DNA extract obtained from all eukaryotic samples (Rojas et al., 2010). A negative

78
template control was made by using nuclease-free water (PCR reaction mixture without
template DNA and replaced with 18.2 Ω Millipore water). The PCR reaction was run on
a QuantStudio® 12 K Flex Real-Time PCR System (Applied Biosystems, Thermo Fisher
Scientific). Cycling conditions were 10 min initial denaturation at 95 °C and 40 cycles at
95 °C for 15 s, 58 °C for 1 min and 72 °C for 30 s. The melting curve analysis was
programmed to form a slope between 70 and 94 °C by raising 1 °C at each step. The
program waits for 118 s of pre-melt conditioning on the first step and 5 s for each step
afterwards. Each reaction was performed in triplicate using two different reagents and
different analysts.
3.17 Melting Curve Analysis of SYBR Green Real Time PCR Assay
The melting temperatures (Tm) of the amplified DNA targets were determined by
melting curve analysis using ExpressionSuite software (version 1.0.4., Life Technologies,
Thermo Fisher Scientific, USA). The specific location of the Tm was obtained by plotting
the variation in fluorescence (dF/dT) against the temperature of the reaction products.
3.18 Construction of Standard Curve
Three types of standard curves namely (i) pure meat DNA (ii) binary admixtures
(MBT-chicken and MBT-beef) and (iii) reference meat products (percentages) were
separately constructed. The first calibration curve was constructed using the DNA extract
obtained from pure muscle meat and adjusted to concentration 100 ng µL-1 and diluted
with nuclease free water at a ratio of 1:10, 1:102, 1:103, 1:104, 1:105, 1:106 and 1:107.
Other standard curves for admixture (MBT-chicken and MBT-beef) and reference meat
were constructed with 10-fold serially diluted DNA obtained from the binary admixtures
of 10 ng (10%) MBT DNA spiked into 90 ng (90%) DNA of beef and chicken and six
types of reference meat products, respectively. Initially, the extracted total DNA of the

79
binary mixtures was made into 100 ng/μl (100%) and then serially diluted using nuclease-
free water in ratios of 1:10, i.e., 1:10, 1:102, 1:103, 1:104, 1:105 and 1:106. All standard
curves were applied for the quantification of the target DNA in unknown samples.
The linear calibration curves for MBT and total meat (eukaryotic) of pure and,
binary admixtures (MBT-chicken and MBT-beef) and references meat products were
obtained by plotting the respective Ct values against the logarithm of the concentration
of MBT DNA, and total meat DNA, respectively. For quantification, the concentration of
MBT DNA and total meat DNA was calculated using equation (1) and (2) and the content
of MBT meat or recovery of MBT meat in an unknown sample was calculated according
to equation (3) following Druml et al. (2015b).
DNA (MBT)(ng/µL) = 10*[(Ctspec-dspec)/slope(spec)] Eq. 1
DNA (Total meat) (ng/µL)= 10*[(Ceuk-deuk)/slope(euk)]
Eq. 2
Where Ctspec and Ceuk are Ct values obtained with MBT specific and eukaryotic (18S
rRNA gene) systems real time PCR assay, respectively; dspec and deuk are intercepts from
the standard curves; and slopespec and slopeeuk are the slopes of the standard curves for the
MBT-specific and eukaryotic PCR systems, respectively.
MBT 𝑚𝑒𝑎𝑡 𝑐𝑜𝑛𝑡𝑒𝑛𝑡(%) =𝑀𝐵𝑇 𝐷𝑁𝐴 (
𝑛𝑔
µ𝐿)
𝑡𝑜𝑡𝑎𝑙 𝑚𝑒𝑎𝑡 𝐷𝑁𝐴(𝑛𝑔
µ𝐿)
𝑋100 Eq. 3
3.19 Amplification Efficiency (E %)
The amplification efficiency (E) of the real time PCR assay was determined by
analyzing the DNA extract obtained from MBT in various concentration ranges from 100
ng µL-1 to 0.1 pi µ/L.

80
Amplification efficiency was extrapolated from the slope of the best fitted line in the
standards curve and also calculated using equation (4).
E [%] = [10 [-1/Slop] – 1] x 100 Eq. 4
3.20 Limit of Detection (LOD) and Quantification (LOQ), Repeatability and
Assay Robustness in the Real Time PCR Technique
The lower limit detection of the assay was determined using serially diluted DNA
(100 ng, 10 ng, 1 ng, 0.1 ng, 0.01 ng, 0.001 ng, 0.0001 ng and 0.00001 ng) extracted from
pure meat tissues, binary admixtures (MBT-chicken and MBT-beef), and various known
percentage of MBT tissue (10%, 1%, 0.1%, and 0.001% (w / w) )added into lab made
reference meat products (chicken and beef meatballs, burgers and frankfurters)(Table 3.3)
and commercial meat products (chicken and beef meatballs, burgers and frankfurters)
(Table 4.4). The LOD was defined as the lowest concentration that resulted in an increase
in fluorescence signal by at least seven out of eight replicates within 38 cycles of the PCR.
Quantification was performed based on an MBT target and eukaryotic control system
DNA corresponding to the MBT and total meat. In order to determine the lower limit
quantification (LOQ), the real-time PCR assay was calibrated with the calibration
standard curves of two types of binary admixtures (MBT-chicken and MBT-beef) and six
types of reference meat products containing 10% MBT DNA in 90% chicken and beef
meat DNA and reference meat product DNA, respectively. Finally, the quantity of the
target DNA in the samples (binary admixtures and reference meat products) was
determined using a normalized Ct value fitted into a calibration curve; and finally the
target DNA content was determined by equation 1 to 3. Data obtained from an SYBR
Green duplex real-time PCR assay was analyzed by Expression Suite software (version
1.0.4., Applied Biosystems, Thermo Fisher Scientific, USA) and Microsoft Office Excel

81
2007. Microsoft Excel software and One-way analysis of variance (ANOVA) using SPSS
software (version 16.0, IBM, Chicago, IL, USA) was performed to assess the significant
differences in the mean values of the different samples. Relative standard deviation of the
targets in complexed background samples was calculated and determined following the
good laboratory practice of the Food and Agricultural Organization guidelines (FAO-
CAC/GL 74-2010)(FAO, 2010). Thus, under experimental conditions, the LOQ reflected
the lowest concentration of the target in complex matrices (Table 4.10-4.13) at which the
relative standard deviation was <25% (FAO-CAC/GL 74-2010)(FAO, 2010). The assay
reproducibility and recovery of the targets were confirmed by analyzing 150 reference
meat samples using two different DNA extraction kits: (1) Yeastern Genomic DNA Mini
Kit(animal tissues) (Yeastern Biotech Co., Ltd, Taipei, Taiwan), and (2) NucleoSpin®
Extraction Kit (Macherey-Nagel, Düren, Germany), at PCR instruments (QuantStudio®
12 K Flex Real-Time PCR System (Applied Biosystems, Thermo Fisher Scientific, USA)
with two different analysts on five different days in the same laboratory using three
replicates in each reaction.

82
CHAPTER 4: RESULTS AND DISCUSSION
4.1 DNA Extraction
Total genomic DNA was extracted from pure and admixed (binary, ternary and
MBT-mixed) meat products under raw and processed (boiled, autoclaved and
microwaved) states and traditional medicines using Yeastern Genomic DNA Mini Kit
(animal tissues) (Yeastern Biotech Co., Ltd, Taipei, Taiwan). The specimens were
prepared on three different dates by three independent analysts. The concentration and
purity of the extracted DNA were determined, and the 260/280-nm absorbance of all of
the samples was 1.7–2.0 which indicates good quality DNA (Adams, 2013). DNA yield
was higher from the heat-treated MBT meat samples (220–350 ng μL-1 from boiled and
autoclaved 400-450 ng μL-1 from microwaved samples) than from the raw meat samples
(210–275 ng μL-1) probably due to sample dehydration, which increases the effective
number of cells and, thus, the number of analytes per unit weight of the treated samples
(Fairbrother et al., 1998). In contrast to the meat and meat products, the concentration of
the extracted DNA from medicinal samples was 18–35 ng μL-1 and the purity of the
genomic DNA was 1.75–1.80; this might be due to the multiple components such as
polysaccharides within the medicinal samples that may not contain DNA. Furthermore,
the various plant and animal materials might involve inhibitors and also the series of
processing procedures such as drying and stewing that definitely degrade DNA to variable
extents will cause these lower concentrations. Initially, difficulties were encountered in
dissolving some of the herbal jelly medicinal powder samples (~15 samples) which
frequently precipitated during the DNA extraction process (without modification). This
was not a surprise since TCM preparations often involve a decoction method that
extensively modifies the natural composition and textures of the source ingredients,

83
bringing in many excipient species. Therefore, the DNA extraction method was modified
by increasing the lysis time in the GT buffer and prolonging the binding time to the
nitrocellulose membrane in the GD column using a GBT buffer (Yeastern Biotech Co.,
Ltd. Taipei, Taiwan). This modified procedure resulted in 120 of 135 (Tables 4.6 & 4.13)
jelly powder samples being dissolved and DNA extraction being successfully carried out.
However, the concentration of the DNA from these jelly powder samples was 18-27 ng
μL-1, which was far less than that from the other medicinal samples that yielded 30–35 ng
μL-1 by the self-modified extraction protocol system. Without modification of extraction
protocol (manufacturer’s protocol), the yielded DNA concentration was very low and
ranged from 2.0 to 5.0 ngµL-1 and the purity was at 1.65 to 1.7 at 260/280 nm, suggesting
possibly less dissolved target samples in the buffer solution or an inappropriate amount
of buffer solution or less dissociated DNA from the samples. TCM is based on multiple
types of herbal materials and sources and contains impurities such as polysaccharides,
polyphenols, and other substances which may hinder the extraction. Under the
experimental condition, 200 µL of GT buffer and 200 µL GBT buffer (according to the
manufacturer protocol) volume were insufficient to properly dissolve the jelly medicines
powder and consequently it formed a solid glue that settled down. Thus, adding more
buffer solution (double the amount) and prolonging the incubation period (60 minute at
60 °C in water bath) accelerated the dissolving and thus dissociated the DNA from the
target samples. Finally, extracted DNA concentration and purity obtained from TCM and
herbal jelly powder were determined using Biodrop UV-VIS spectrophotometer
(Biochrom Libra S70, Biochrom Ltd, Cambridge, UK) based on absorbance at 260-280
nm in the calculating ratios of A260/280 and the concentrations ranged between 18~35
ng µL-1 and purity ranged between 1.75-1.80 ratio. All the purified genomic DNA were
kept at -20 °C until further use.

84
4.2 Development of Short DNA Biomarker and Malayan Box Turtle Specific
PCR Assay
There are increasing events at global level which represent the illicit labeling, and
food and medicine adulteration. The trade of food and medicine is frequently disturbed
by anomalies of product safety and quality (Ali et al., 2015; Coghlan et al., 2015, 2012).
Recent horse meat scandal in food chain in Europe and animal materials adulteration in
Chinese medicines in Australia have brought a lot of control and supervises more
frequently in connection with the authenticity of the products(Ali et al., 2015; Coghlan et
al., 2015, 2012). Generally it is difficult for the consumer to identify target species and
for processed products this also constitutes a challenge for control and enforcement
authorities. Consequently, it is need a reliable method for regulatory body as well as
industries authority to authenticate the food and medicinal products. At a globe level,
several analytical methods have been highlighted in order to test the authenticity of
different food and medicinal products. The most important techniques have been proved
to be those which are based on the DNA analyses using electrophoresis methods.
Nowadays, species specific DNA biomarker plays an important role in the
polymerase chain reaction studies for species authentication in food and medicine
samples. It has gained enough attention among the scientists as well as regulatory
departments; because, it gives efficient and accurate results in forensic sample analysis.
Although, obtaining target PCR products depend on the primer sequence selection from
conserve region of the target species genome. Therefore, primer sequence selection is
among the most critical input factors in species-specific polymerase chain reaction (PCR)
assay optimization and PCR assay efficiency. Because, a quality primer pairs depends on
the several key factors such as primer size, GC content (%), melting and annealing
temperature for assay efficiency and unambiguously DNA amplification. An inaccurate
designed primers may interrupt the assay by forming secondary structure, as well as non-
85
specific amplification and reduce the PCR efficiency at normal annealing temperature
(Abd-Elsalam, 2003). Generally, an ideal primer length and GC content(%), should be
(18-30) nt and 40 to 60 % and 3 or more G or C content at 3′-end should be avoided
because it has adverse effect to the primer amplification (Ali et al., 2014; Rychlik et al.,
1990). Besides, selection of amplicon DNA size especially short amplicon DNA is also
important factor that reflects the real content in molecular analysis; because, its extensive
stability enhance the assay validity in forensic case study. Moreover, several research
group have proved that short target amplicon DNA more suitable than the longer target
DNA sequence due to longer DNA more susceptible to breakdown into smaller DNA
fragments at harsh environment or in highly decomposed samples (Ali et al., 2012; Rojas
et al., 2010). Due to extensive sensitivity and stability of the shorter DNA biomarker, it
has vast application in forensic analysis, biochip and biosensor deployment. Considering
all these factors, a pair of MBT-specific primers for short length PCR product (120 bp)
was developed in this study and carefully analysed both theoretically and experimentally.
In theoretical analysis, a whole mitochondrial DNA sequence of MBT (NC014769.1) was
retrieved from the NCBI and designed a set of primer with Primer3Plus bioinformatics
software to amplify unambiguously a short PCR product. Melting temperature and GC
content (%) and amplicon size were also properly checked by TM calculator and
Primer3Plus bioinformatics software. Theoretically, designed primer set and its
amplicon(120 bp) DNA sequence were aligned with 29 potential non-target species
including eight closely related species of the Cuora genus using a ClustalW multiple and
Molecular Evolutionary Genetic Analysis Version 5 (MEGA 5) alignment program
(Table 4.1). Although a total of 12 species, all of which are critically endangered (Spinks
et al., 2012), belong to the Cuora genus, the genetic sequences of only nine species were
available in NCBI. Mismatch analysis, reflects very close matching among these nine
species of the Cuora genus. Thus, there is a high chance of Cuora genus detection using

86
the MBT specific assay and there was a need of practical cross-testing among Cuora
species. However, due to lack samples and regulatory restriction, practical evaluation
could not perform. Close observation of the sequence reflected 1–4 nt mismatches among
the Cuora species. These few numbers of mismatch nucleotides (1–4 nt) at the primer
region were probably due to habitat loss or modification, animal translocations and
wildlife farming that lead to increased rates of anthropogenic hybridization and
introgression between native and introduced animals within the same genus (Spinks et
al., 2012). Although even a single-nt mismatch at the 3′ end of primer may prevent
successful PCR amplification (Wu et al., 2009), most of the mismatches (1–4 nt) among
Cuora species were found at the middle position in the reverse primer (Table), which
have little probability of hindering the PCR amplification. This evidenced that all Cuora
species might be detected by the MBT-specific primers. Instead of compromising interest
in the assay, these findings have increased the scope of the assay by many fold since all
species of Cuora genus are critically endangered and finding a universal PCR assay for
their detection should be highly appreciated. Among the 20 tested non target species,
100% match was obtained only with the cytochrome b gene of MBT and multiple
mismatches (5–33 nt) were found with the non-target species (Table 4.1). A BLAST study
against non-redundant nucleotide sequences (data not shown) in NCBI reflected similar
outcomes.
Further, to determine the genetically distances, a 3D plot(Figure 4.2) and pairwise
table(Table 4.3) were also constructed using XLSTAT and Molecular Evolutionary
Genetically Analysis (MEGA 5) software and reflects the clear distance between MBT
with other species. Later, in order to observe the genetic relationship between MBT and
other reptile species, a phylogenetic tree was constructed by neighbor joining
method(Tamura et al., 2013) using similar sites of cytochrome b genes of 66 reptile
species, of which 44 were tortoise and turtles, 10 were snakes, 8 were crocodiles, and 5

87
were lizards (Figure 4.1). The constructed genetic tree demonstrates a close relationship
among the nine species of Cuora genus and a specific distance between MBT and other
reptile species. This reflected the probability of Cuora genus detection, but eliminated the
chances of other reptile detection. Because, mismatch, pairwise distance, 3D plot and
phylogenetic tree results reflects the very close matching among the nine Cuora species
(Figure 4.1 & 4.2) (Table 4.1 & 4.3)
To validate the assay, a most useful universal oligo primer set (Euk-F and Euk-
R) for 141 bp length amplicon site of the eukaryotic gene (18S rRNA) was applied as
internal control in this study (Rojas et al., 2010). Although, all tested samples including
Cuora genus were belongs to eukaryotic species and applied into mismatch analysis with
eukaryotic 18S rRNA gene. However, there was a challenge due to the unavailability of
genetic information of the 18S rRNA gene of most the selected species in NCBI, thereby
mismatch analysis result of the 18S rRNA was not reflected to the real experiment.
However, among the 20 tested non target species, above 98.14-100% match was obtained
only with the complete 18S rRNA gene sequence of Cyprinus carpio, Macrobrachium
rosebergii Gallus gallus, Bos taurus, Macaca fascicularis Rattus norvegicus, Ovis aries,
Anas platyrhynchos,Gadus morhua, Salmo salar sequence obtained from complete
sequenced DNA, and multiple mismatches (4–29 nt) were found with the non-target
species such as Cucumis sativus, Triticum aestivum, Felis catus Sus scrofa domesticus,
Capra hircus and Odocoileus virginianus(Table 4.2). However, most of the mismatches
were found in the middle area of the primer binding region and genetic information were
partially sequenced retrieved from NBCI gene bank that reflects the importance of
complete 18S rRNA genes sequence to do theoretically analysis. Finally, ClustalW,
MEGA 5 and BLAST analysis results were experimentally authenticated in a practical
PCR run using 20 ng templates DNA of target and non-target species extracted from raw
and various processed meats. A 120 bp PCR product was obtained only from MBT and

88
other species did not yield any PCR products (Figure 4.2a). Amplifiable DNA in non-
target species was confirmed from an endogenous control which amplified 141 bp PCR
product from all species using a set of universal eukaryotic primers of 18S rRNA gene.
This results reflects the quality DNA extracted from all tested eukaryotic species. The
MBT-specific 120-bp PCR product was purified (Montiel-Sosa et al., 2000), sequenced,
pairwise distance measured (Table 4.3) among the closely matched species, and was
constructed using a maximum composite likelihood method (Ali et al., 2014; Tamura et
al., 2013). The minimum distance was observed between MBT and Chinese box turtle,
Yellow headed box turtle, Pan’s box turtle, Zhou’s box turtle, Vietnamese box turtle,
Indochinese box turtle, Bourret’s box turtle, Chinese three-striped box turtle, chicken,
buffalo (0.06–0.37), and the maximum distance was found between MBT and cucumber
(0.73). These data reflects a large genetic distance, demonstrating the unlikelihood of
cross-species amplification in a practical PCR run. The number of mismatched bases in
the primer-binding sites of the studied species were between 11.4% and 75%or 5 and 33
nucleotides, which made cross-species detection improbable (Table 4.1). The
phylogenetic tree (Figure 4.1) constructed by a neighbour-joining method undoubtedly
reflected a high degree of discrimination among MBT and other animal, fish and plant
species. Several methods such as PCR (Lo et al., 2006) (12 S rRNA, 165 bp and
cytochrome b, 376 bp), PCR-RFLP (Moore et al., 2003) (cytochrome b, 876 bp) and PCR
product sequencing (Hsieh et al. 2008) (cytochrome b, 405 bp) have been documented
for the detection of different turtle species including MBT. However, all the documented
assays are based on long-size amplicons (≥ 150 bp), which frequently fragmented under
food processing treatments and thus may not be suitable for meat-species detection (Ali
et al., 2012; Arslan et al., 2006). Additionally, target stability of these assays was not
tested under food processing conditions. Here the specificity of the newly developed PCR
assay was tested under pure and admixed samples such as binary, ternary and chicken

89
meatball products under raw and processed states and MBT specific 120 bp product was
realised under all conditions, suggesting a robustness and precision of the assay even
under harsh conditions where the shortest target (165 bp) among the published report was
degraded(Figure 4.4-4.6)

90
Species name Primer MismatchForward Reverse
Cuora amoboinensis A G C C C T T C T A A C A T C T C T G C T C T A T GA A A C T T C G GA T C A T T A C T A G G C A C C T G C C T A A T C C T T C A G A T C A C C A C A G GA A T C T T C C T G G C A A T A C A T T A C T C A C C A GA C A T C T C A C T A G C A 0 0
Cuora aurocapitata . . . . . . . . . . . . . . . . . . . . . T . . . . . . . . . . . . . . . . . C . . T . . . . . G . . . . . . . . . . . . . A . . . . . . . T . . . C . . . G . . . . . . . A . . . . . . . . C . . . . . . . . . . . . . . . . . . . . . . . . 1 0
Cuora pani . . . . . . . . . . . . . . . . . . . . . T . . . . . . . . . . . . . . . . . C . . T . . . . . G . . . . . . . . . . . . . A . . . . . . . T . . . C . . . G . . . . . . . A . . . . . . . . C . . . . . . . . . . . . . . . . . . . . . . . . 1 0
Cuora zhoui . . . . . . . . . . . . . . . . . . . . . T . . . . . . . . . . . . . . . . . C . . . . . . . . G . . . . . . . . . . . . . A . . . . . . . T . . . C . . . . . . . . . . . . . . . . . . . . C . . . . . . . . . . . . . . . . . . . . . . . . 1 0
Cuora picturata . . . . . C . . . . . . . . . . . . . . . T . . . . . . . . . . . . . . . . . C . . . . . . . . . T . . . . . . . . . . . . A . . . . . . . T . . . C . . . . . . . . . . . . . . . . . . . . C . . T . . . . . G . . . . . . . . . . . . . . . 2 2
Cuora galbinifrons . . . . . C . . . . . . . . . . . . . . . T . . . . . . . . . . . . . G . . . C . . . . . . . . . . . . . . . . . . . . . . A . . . . . . . T . . . T . . . . . . . . . . . . . . . . . . . . C . . T . . . . . . . . . . . . . . . T . . . . . 2 2
Cuora bourreti . . . . . C . . . . . . . . . . . . . . . T . . . . . . . . . . . . . . . . . C . . . . . . . . . T . . . . . . . . . . . . A . . . . . . . T . . . C . . . . . . . . . . . . . . . . . . . . C . . T . . . . . G . . . . . . . . . . . . . . . 1 2
Cuora trifasciata . . . . . C . . . . . . . . . . . . . . . T . . . . . . . . . . . . . . . . . C . . . . . . . . . . . . . . . . . . . . . . A . . . . . . . T . . . C . . . . . . . . . . . . . . . . . . . . C . . . . . . . . . . . . . C . . . . . . . . . . 2 1
Cuora flavomarginata . . . . . . . . . . . T . . . . . . . . . T . . . . . . . T . . . . . . . . . C . . T . . . . . G . . . . . . . T . . . . . A . . . . . . . T . . . C . . . . . . . . . . . . . . . . . . . . C . . . . . . . . . . . . . . . . . . . . . . . C 2 1
Hoplobatrachus rugulosus G C . . . A G . . . . . C . T . . A T . C T . . . . . . . . . . T . . T . . C C . T . . . . . A T T A . . . . . G . . . A . . . . A . . T G . . . . C . . C C . A . . T . . . . . T . . . . . C . . T A . . G . T . . T . C A . . C . . . . . C 9 9
Gallus gallus G C . . . A . . C . . . . . . . . . . . . T G . . . . . . T . . . . . C . . C C . . T . . . C A G T . . . . . . C . . GA C C . . A . . . C T . . . C . . C C . A C . A . . A . . C . . G . . C . . . A . . G . . . . . . C A . . C . . . . . C 5 6
Ovis aries G C T . . A . . A . . T . . T . . A T . A T G . . . . . . . . . T . . C . . T C . C . . . . . . . T T . . . T . . . . T T . A . . . . . T C T A . . . . . C C . A . . . . . A . . . . . . . . C . . T A . . . . T . . . . C A A . . A C . . . . 11 8
Caprus hicus . C . . . A . . A . . . . . . . . A T . A T G . . . . . . . . . T . . . . . C C . C . . . . . A . T T . . . . . . . . . T . A . . A . . . C T G . . . . . C C . A . . . . . A . . . . . . . . C . . T A . . T . C . . T . C A A T . A C . . . . 7 10
Bos taurus G C . . . A . . A . . . . . T . . A T . A T G . . . . . . T . . . . . T . . C C . C . . G . . A . T . . . . . . . . . . . . A . . A . . . C T . . . . . . C C . A . . . . . A . . . . . . . . C . . . A . . T . C . . . . C A A . . A C . . . . 9 8
Bubalus bubali G C T . . A . . A . . . . . . . . A T . A T G . . . . . . . . . T . . C . . T C . C . . . . . . . T . . . . . . . . . . . . G . . A . . . C T . . . C . . C C . A . . . . . A . . . . . . . . C . . . A . . T . C . . . . C A A . . A C . . . . 9 8
Odocoileus virginianus G C . . . A . . A . . . . . T . . A T . A T G . . . . . . . . . . . . C . . T C . G . . . . . A . T T . . . T . . . . . . . A . . A . . T C T T . . T . . T C . A . . . . . A . . . . . . . . . . . T A . . T . C . . . . C A A T . A C . . . . 10 10
Sus scrofa domestica G C . . . C . . A . . . . . . . . A T . A T G . . . . . . . . . . . . T . . C C . C T . . . . . . T . . . . . . . . . . T . G . . A . . . C T A . . . . . C C . G . . . T . A . . . . . . . . . . . . A . . T . . . . . . C A A . . A C . . . T 8 8
Columba livia . C . . . C . . A . . . . . . . . C . . C T G . . . G . . . . . T . . G . . C C . . . . . . . . . T T . . . T . G C . A A C . . . A . . . C T A . . C . . C T . A C . A . . C . . C G C . . . . . . . A . T G . T . . . . C T A . C . . . . . C 6 8
Anas platyrhychos G C A . . C . . . . . T . . . . . . . . C T G . . . . . . . . . . . . . . . T C . G . . C . C . . T . . . . . . G G C . A C A . . A . . . C T . . . . . . C C . . C . A . . . . . T . . G . . C . . . A . C G . . . . . . C A . . C . . T . . T 7 8
Rattus rattus G C . . . A . . . . . . . . . . . A T . A T G . . . . . . . . . . . . T . . T C . . . . . . . A G T A . . . . . C . . A G . A . . A . . . C T . . . . . . C T . A . . . . . A . . . . . . . . C . . . A . G T . T . . T . C . A T . A C . . . . 7 10
Macaca fascicularis . C . . . G C . C . . . C . T . . C A T A T G . . . . . . . . . . . . C . . . C . T . . C A C A G . . . . T . . . . C . T . A . . A . . . . T . . . . . . C C . A C . . . . A . . . . . . . . C . . . . . . . . . . . . . C . . . C T C C . . C 11 6
Canis lupus familiaris G C G . . G . . . . . . . . . . . . . . . T G . . . G . . . . . . . . . . . C . . . . . . . . A G T A . . . T . G . . T . . A . . . . . T C T A . . . . . T T . A . . . T . A . . T . . G . . C . . T A . . T . G . . . . C A G . C A C . . . T 5 11
Felis catus G C . . . A . . . . . . . . . . . A . . A T G . . . . . . . . . . . . C . . C C . T . . . . . A G T . . . . . . . . C . T . A . . A . . . C T . . . C . . C C . . . . T T . . . . C . . . . . C . . . A . . T . . . . . . C A A T . A C C . . C 6 10
Salmo salar G C A . . A . . . . . . . . . . . A . T . T G . . . . . . . . . T . . C . . . C . C T . . . . . C T A . . T . . . G C . A C C . . A . . . C T T . . C . . G C . . . . . . . A . . C . . . . . C . . . A . C T . C . . T . . . . . . A C . . . T 7 8
Gadus morhua G C . . . C . . C . . T . . . . . A . T A T G . . . . . . T . . T . . C . . T C . T . . . . . . C T T . . . T . . . . T A C . . . A C . T C T A . . . . . . C . A . . T . . A . . C . . . . . C . . T A . C T . . . . . . . . GA GA C . . . C 9 10
Cyprinus carpio . C A . . A . . C . . . . . . . . A . . A T G . . . . . . . . . T . . . . . C C . C . . . . . A C T A . . . T . . . . T A C C . . A . . T T T A . . C . . C C . A . . . . . A . . C . . . . . C . . . A . C T . . . . . . . . . . . A C C . . . 7 6
Macrobrachium rosenbergii . A T . . A G . . . . . . . T . . . A T . . . . . . . . . T . . T . . T . . T C . . . . . . . . . T A . . . T . . . . A G . . . . A . . . G . A . . . A . . C . A . . T T . A A . T . . . . . C . . . A . . G . . A . T G . A GA T T . . . . . 7 10
Cucumis sativus . C . . . GA G C . . T C . T A G . T A . T G G . . G G G G . . . . . T C . G . . . G C . . . T C T T . . T T . . G . . A . . . . . . . A G T G . . T . . C C . T . . T T . A . . T . . G . . . . . . A . . . . T C . T G . G GA T . . . . . T 19 14
Triticum aestivum . C . . . GA G C . . T C . T A G . T A . T G G . . G G G G . . . . . T . . G . . . G C . . . T . T T . . T T . . G . . A . . . . . . . A G T G . . T . . C G . T . . T T . A . . T . . G . . . C . . A . . . . T C . T G . G GA T . . . . . T 13 10
Mismatch analysis of Cuora amboinensis specific amplicon(120 bp) site of cytochrome b gene
Forward Primer Reverse Primer
Table 4.1: The mismatch comparison of the Malayan box turtle specific amplicon (120bp) against tested species and eight Cuora species

91
Table 4.2: The mismatch comparison of the eukaryotic internal control (18S rRNA gene) specific amplicon (141bp) against tested species and
eight Cuora eight species
Note: CSb: Complete sequence. SNFa: Not found, PSc: Partial sequence
Species name Primer Mismatch
Forward Reverse
18S rRNA(Eukryotic) G G T A G T GA C G A A A A A T A A C A A T A C A G G A C T C T T T C GA G G C C C T G T A A T T G GA A T GA G T C C A C T T T A A A T C C T T T A A C GA G GA T C C A T T G GA G G G C A A G T C T G G T G C C A G C A G C C G C G G T A A T T C C A G C T C C A A T A G C G T A T 0 0
Cuora amboinensis(SNFa) ? ? ? ? ? ? ? ? ? ? ? ? ? ? ? ? ? ? ? ? ? ? ? ? ? ? ? ? ? ? ? ? ? ? ? ? ? ? ? ? ? ? ? ? ? ? ? ? ? ? ? ? ? ? ? ? ? ? ? ? ? ? ? ? ? ? ? ? ? ? ? ? ? ? ? ? ? ? ? ? ? ? ? ? ? ? ? ? ? ? ? ? ? ? ? ? ? ? ? ? ? ? ? ? ? ? ? ? ? ? ? ? ? ? ? ? ? ? ? ? ? ? ? ? ? ? ? ? ? ? ? ? ? ? ? ? ? ? ? ? ? ? ?
Cuora aurocapitata(SNFa
) ? ? ? ? ? ? ? ? ? ? ? ? ? ? ? ? ? ? ? ? ? ? ? ? ? ? ? ? ? ? ? ? ? ? ? ? ? ? ? ? ? ? ? ? ? ? ? ? ? ? ? ? ? ? ? ? ? ? ? ? ? ? ? ? ? ? ? ? ? ? ? ? ? ? ? ? ? ? ? ? ? ? ? ? ? ? ? ? ? ? ? ? ? ? ? ? ? ? ? ? ? ? ? ? ? ? ? ? ? ? ? ? ? ? ? ? ? ? ? ? ? ? ? ? ? ? ? ? ? ? ? ? ? ? ? ? ? ? ? ? ? ? ?
Cuora pani(SNFa
) ? ? ? ? ? ? ? ? ? ? ? ? ? ? ? ? ? ? ? ? ? ? ? ? ? ? ? ? ? ? ? ? ? ? ? ? ? ? ? ? ? ? ? ? ? ? ? ? ? ? ? ? ? ? ? ? ? ? ? ? ? ? ? ? ? ? ? ? ? ? ? ? ? ? ? ? ? ? ? ? ? ? ? ? ? ? ? ? ? ? ? ? ? ? ? ? ? ? ? ? ? ? ? ? ? ? ? ? ? ? ? ? ? ? ? ? ? ? ? ? ? ? ? ? ? ? ? ? ? ? ? ? ? ? ? ? ? ? ? ? ? ? ?
Cuora zhoui(SNFa
) ? ? ? ? ? ? ? ? ? ? ? ? ? ? ? ? ? ? ? ? ? ? ? ? ? ? ? ? ? ? ? ? ? ? ? ? ? ? ? ? ? ? ? ? ? ? ? ? ? ? ? ? ? ? ? ? ? ? ? ? ? ? ? ? ? ? ? ? ? ? ? ? ? ? ? ? ? ? ? ? ? ? ? ? ? ? ? ? ? ? ? ? ? ? ? ? ? ? ? ? ? ? ? ? ? ? ? ? ? ? ? ? ? ? ? ? ? ? ? ? ? ? ? ? ? ? ? ? ? ? ? ? ? ? ? ? ? ? ? ? ? ? ?
Cuora picturata(SNFa
) ? ? ? ? ? ? ? ? ? ? ? ? ? ? ? ? ? ? ? ? ? ? ? ? ? ? ? ? ? ? ? ? ? ? ? ? ? ? ? ? ? ? ? ? ? ? ? ? ? ? ? ? ? ? ? ? ? ? ? ? ? ? ? ? ? ? ? ? ? ? ? ? ? ? ? ? ? ? ? ? ? ? ? ? ? ? ? ? ? ? ? ? ? ? ? ? ? ? ? ? ? ? ? ? ? ? ? ? ? ? ? ? ? ? ? ? ? ? ? ? ? ? ? ? ? ? ? ? ? ? ? ? ? ? ? ? ? ? ? ? ? ? ?
Cuora galbinifrons(SNFa
) ? ? ? ? ? ? ? ? ? ? ? ? ? ? ? ? ? ? ? ? ? ? ? ? ? ? ? ? ? ? ? ? ? ? ? ? ? ? ? ? ? ? ? ? ? ? ? ? ? ? ? ? ? ? ? ? ? ? ? ? ? ? ? ? ? ? ? ? ? ? ? ? ? ? ? ? ? ? ? ? ? ? ? ? ? ? ? ? ? ? ? ? ? ? ? ? ? ? ? ? ? ? ? ? ? ? ? ? ? ? ? ? ? ? ? ? ? ? ? ? ? ? ? ? ? ? ? ? ? ? ? ? ? ? ? ? ? ? ? ? ? ? ?
Cuora bourreti(SNFa
) ? ? ? ? ? ? ? ? ? ? ? ? ? ? ? ? ? ? ? ? ? ? ? ? ? ? ? ? ? ? ? ? ? ? ? ? ? ? ? ? ? ? ? ? ? ? ? ? ? ? ? ? ? ? ? ? ? ? ? ? ? ? ? ? ? ? ? ? ? ? ? ? ? ? ? ? ? ? ? ? ? ? ? ? ? ? ? ? ? ? ? ? ? ? ? ? ? ? ? ? ? ? ? ? ? ? ? ? ? ? ? ? ? ? ? ? ? ? ? ? ? ? ? ? ? ? ? ? ? ? ? ? ? ? ? ? ? ? ? ? ? ? ?
Gallus gallus(CSb
) . . . . . . . . . . . . . . . . . . . . . . . . . . . . . . . . . . . . . . . . . . . . . . . . . . . . . . . . . . . . . . . . . . . . . . . . . . . . . . . . . . . . . . . . . . . . . . . . . . . . . . . . . . . . . . . . . . . . . . . . . . . . . . . . . . . . . . . . . . . . . 0 0
Bos taurus(CSb
) . . . . . . . . . . . . . . . . . . . . . . . . . . . . . . . . . . . . G . . . . . . . . . . . . . . . . . . . . . . . . . . . . . . . . . . . . . . . . . . . . . . . . . . . . . . . . . . . . . . . . . . C . . . . . . . . . . . . . . . . . . . . . . . . . . . . . . . . . . . . . 0 0
Capra hircus(PSc) T . . . . . T . . A . C G C C . C G . T T A . . C A C . . C . C . A . . G . A GA . A . C . G . GA C . . A A . T . A A G . C A . . . . C GA . . . G . . T . A . C C A T G . . . . T T . . T . . A . . . C . . . . . . . . C A . . . . . . . C . . A . G . T T A A . C C A . . . T A . C 15 13
Sus scrofa domesticus(PSc) . . . . . . C . T A . C G C C . T G . T C A . . C A C . . C . C C A . . G . A A A . A . C . G . GA T . . A A . T . A A G . C A . G . . C GA . . . G . . T . A . . . T A . . . A . . . . . T . . A . . . C . . . . . . . . C A . . . . . . . C . . A . T . A . C . A . . . . A T A G . . 15 10
Columba livia(CSb
) . . . . . . . . . . . . . . . . . . . . . . . . . . . . . . . . . . . . . . . . . . . . . . . . . . . . . . . . . C G . . . . . . . . . . . . . . G . G . . . . . . . . . . . . . . . . . . . . . . . . . . . . . . . . . . . . . . . . . . . . . . . . . . . . . . . . . . . . . . . . . 0 0
Macaca fascicularis(PSc) . . . . . . . . . . . . . . . . . . . G GA . . - - . T T . . . C C A T GA . A . G C . . T . C C . . . . C . . T C GA G . C G . . C . . A A G . . C G G C T A A . . . T . . . . . . . . . . . . . . . . . . . . . . . . . . . . . . . . . . . . . . . . . . . . . . . . . . . . . . . . 5 0
Rattus norvegicus(CSb
) . . . . . . . . . . . . . . . . . . . . . . . . . . . . . . . . . . . . . . . . . . . . . . . . . . . . . . . . . . . . . . . . . . . . . . . . . . . . . . . . . . . . . . . . . . . . . . . . . . . . . . . . . . . . . . . . . . . . . . . . . . . . . . . . . . . . . . . . . . . . . 0 0
Canis lupus familiaris(PSc) A . . . . . C . T A . C . C C . T G . T . A G . C A C . . C . C C A . . G . A T A . A . C . G . GA T . . A A . T . A A G . C A . . . . C GA . . . G . . T . A . C C A T . C . A A . T . . T . . A . T . C . . . . . . . . C A . . . . . . . C . . A . G . T T A A . C C A . A . T A . . 15 13
Ovis aries(CSb
) . . . . . . . . . . . . . . . . . . . . . . . . . . . . . . . . . . . . . . . . . . . . . . . . . . . . . . . . . . . . . . . . . . . . . . . . . C C G . . . . . . . . . . . . . . . . . . . . . . . . . . . . . . . . . . . . . . . . . . . . . . . . . . . . . . . . . . . . . . . . . 0 0
Anas platyrhynchos(CSb
) . . . . . . . . . . . . . . . . . . . . . . . . . . . . . . . . . . . . . . . . . . . . . . . . . . . . . . . . . . . . . . . . . . . . . . . . . G . G . . . . . . . . . . . . . . . . . . . . . . . . . . . . . . . . . . . . . . . . . . . . . . . . . . . . . . . . . . . . . . . . . 0 0
Bubalus bubalis(CSb
) . . . . . . . . . . . . . . . . . . . . . . . . . . . . . . . . . . . . . . . . . . . . . . . . . . . . . . . . . . . . . . . . . . . . . . . . . C C G . . . . . . . . . . . . . . . . . . . . . . . . . . . . . . . . . . . . . . . . . . . . . . . . . . . . . . . . . . . . . . . . . 0 0
Odocoileus virginianus(PSc) C . . . . . C . T . . C G C C . T G . T C A G . C A C . . C . C C A . . G . A GA . A . C . G . GA T . . A A . T . A A G . . A . . . . C GA . . . G . . T . A . G C T A . . . A . G . . . T . . A . T . C . . . . . . . . C A . . . . . . . C . . A . G . T T A A . C C A . . T T A . . 16 13
Macrobrachium rosebergii(PSc) . . . . . . . . . . . . . . . . . . . . . . G . G . . . . . . . . C . . . . T . T G C . . . . . . . . . . . . . . C A . . . . . . . . . . . . . . . . G . A . C A . C . A . . . . . . . . . . . . . . . . . . . . . . . . . . . . . . . . . . . . . . . . . . . . . . . . . . . . . . . . 2 0
Gadus morhua(CSb
) . . . . . . . . . . . . . . . . . . . . . . . . . . . . . . . . . . . . . . . . . . . . . . . . . . . . . . . . . . G T . . . . . . . . . . . . . . G G . C . . T . C . A . . . . . . . . . . . . . . . . . . . . . . . . . . . . . . . . . . . . . . . . . . . . . . . . . . . . . . . . 0 0
Salmo salar(PSc) . . . . . . . . . . . . . . . . . . . . . . . . . . . . . . . . . . . . . . . . . . . . . . . . . . . . . . . . . . A . . . . . . . . . . . . . . . . . . . . . . . . . . . . . . . . . . . . . . . . . . . . . . . . . . . . . . . . . . . . . . . . . . . . . . . . . . . . . . . . . . 0 0
Cyprinus carpio(PSc) . . . . . . . . . . . . . . . . . . . . . . . . . . . T . . . . . . . . . . . . . . . . . . . . . . . . . . . . . C G T . T C C . . . . C . . A . G G G . . . . . . C . . . . . . . . . . . . . . . . . . . . . . . . . . . . . . . . . . . . . . . . . . . . . . . . . . . . . . . . . . 1 0
Cucumis sativus(CSb
) . . . . . . . . . A . T . . . . . . . . . . . . C . . G . . . . . C - - GA . T . T G . . . . . . . . . . . . . . . A . . A . C . . . . . . . C . . . . . . . . . . . . A . . . . . . . . . . . . . . . . . . . . . . . . . . . . . . . . . . . . . . . . . . . . . . . . . . . . . . . . 4 0
Triticum aestivum(CSb
) . . . . . . . . . A . T . . . . . . . . . . . . C . . G . G . A . . - A G T . T . T G . . . . . . . . . . . . . . . A . . A . C . . . . . . . C . . . . . . . . . . ? ? ? ? ? ? ? ? ? ? ? ? ? ? ? ? ? ? ? ? ? ? ? ? ? ? ? ? ? ? ? ? ? ? ? ? ? ? ? ? ? ? ? ? ? ? ? ? ? ? ? ? ? ? ? ? 4 0
Hoplobatrachus rugulosus(SNFa
) ? ? ? ? ? ? ? ? ? ? ? ? ? ? ? ? ? ? ? ? ? ? ? ? ? ? ? ? ? ? ? ? ? ? ? ? ? ? ? ? ? ? ? ? ? ? ? ? ? ? ? ? ? ? ? ? ? ? ? ? ? ? ? ? ? ? ? ? ? ? ? ? ? ? ? ? ? ? ? ? ? ? ? ? ? ? ? ? ? ? ? ? ? ? ? ? ? ? ? ? ? ? ? ? ? ? ? ? ? ? ? ? ? ? ? ? ? ? ? ? ? ? ? ? ? ? ? ? ? ? ? ? ? ? ? ? ? ? ? ? ? ? ?
Felis catus(PSc) . C . T . . C T . A . . G . T . . . . C . . G . . T . T . . A . A C G C . C . G . T G . . . . G . . A . . C . . A . G . T . A . . . . . . . A G . . . T G . T T C C . T T G G . C . C T C . . T C C . . . C C . A . T T . T . A . T . T . . . . . . . . T . . A G . T . . . . . A . G C C 11 8
Forward primer Reverse primer
Eukryotic internal control specific amplicon(120 bp) site of 18S rRNA gene

92
Table 4.3: Pairwise distances of the Malayan box turtle (MBT) specific amplicon (120 bp) site of cytochrome b gene against corresponding
sites of 29 different species by maximum composite likelihood method
Note: Cuora amboinensis-Malayan Box Turtle(MBT), Cuora flavomarginata-Chinese Box Turtle(CBT), Cuora aurocapitata-Yellow-headed box turtle(YHBT), Cuora Pani-Pan’s
Box Turtle(PBT), Cuora zhoui-Zhou's Box Turtle(ZBT), Cuora picturata-Vietnamese Box Turtle(VBT), Cuora galbinifrons-Indochinese Box Turtle(INDCBT), Cuora bourreti-
Bourret’s Box Turtle(BBT) and Cuora trifasciata-Chinese Three-striped Box Turtle(CTSBT).
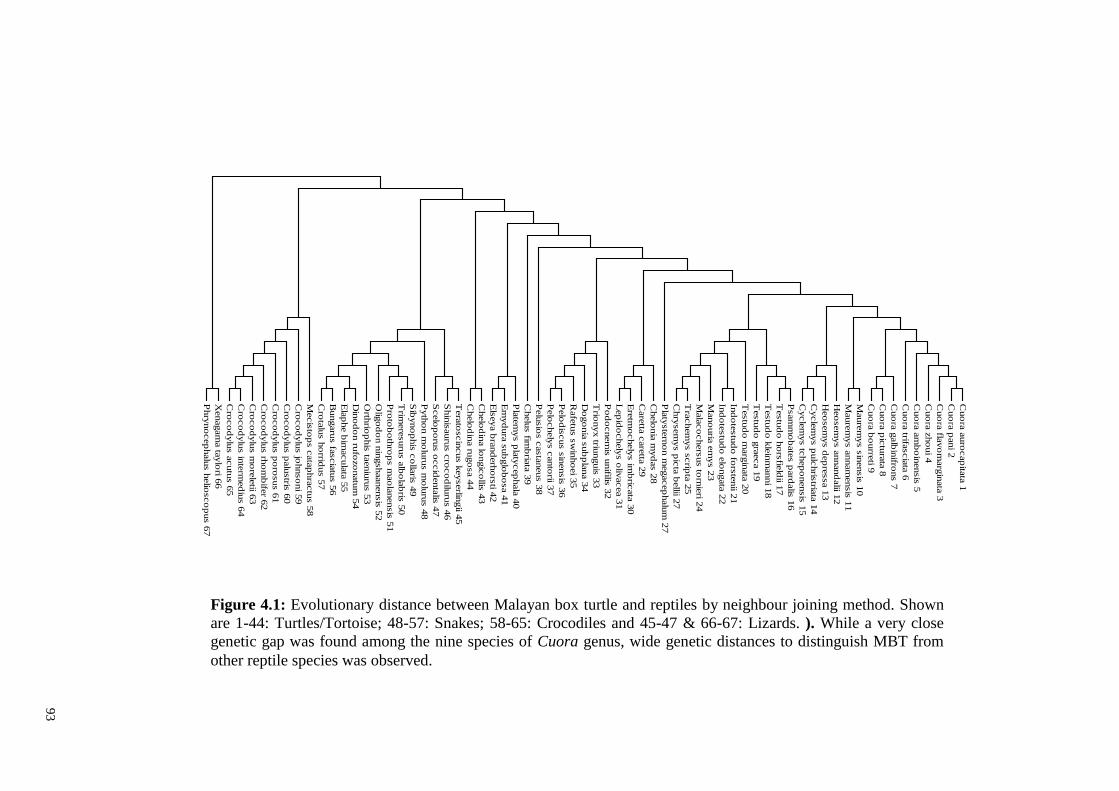
93
Figure 4.1: Evolutionary distance between Malayan box turtle and reptiles by neighbour joining method. Shown
are 1-44: Turtles/Tortoise; 48-57: Snakes; 58-65: Crocodiles and 45-47 & 66-67: Lizards. ). While a very close
genetic gap was found among the nine species of Cuora genus, wide genetic distances to distinguish MBT from
other reptile species was observed.
Cuo
ra a
uro
cap
itata
1
Cuo
ra p
ani 2
Cuo
ra fla
vo
marg
inata
3
Cuo
ra z
ho
ui 4
Cuo
ra a
mb
oin
ensis
5
Cuo
ra trifa
scia
ta 6
Cuo
ra g
alb
inifro
ns 7
Cuo
ra p
ictu
rata
8
Cuo
ra b
ourre
ti 9
Maure
mys s
inensis
10
Maure
mys a
nnam
ensis
11
Heo
sem
ys a
nnand
alii 1
2
Heo
sem
ys d
ep
ressa 1
3
Cycle
mys p
ulc
hris
triata
14
Cycle
mys tc
hep
onensis
15
Psam
mo
bate
s p
ard
alis
16
Testu
do
ho
rsfie
ldii 1
7
Testu
do
kle
inm
anni 1
8
Testu
do
gra
eca 1
9
Testu
do
marg
inata
20
Ind
ote
stu
do
fors
tenii 2
1
Ind
ote
stu
do
elo
ngata
22
Mano
uria
em
ys 2
3
Mala
co
chers
us to
rnie
ri 24
Tra
chem
ys s
crip
ta 2
5
Chry
sem
ys p
icta
bellii 2
7
Pla
tyste
rno
n m
egacep
halu
m 2
7
Chelo
nia
myd
as 2
8
Care
tta c
are
tta 2
9
Ere
tmo
chely
s im
bric
ata
30
Lep
ido
chely
s o
livacea 3
1
Po
do
cnem
is u
nifilis
32
Trio
nyx triu
nguis
33
Do
go
nia
sub
pla
na 3
4
Rafe
tus s
win
ho
ei 3
5
Pelo
dis
cus s
inensis
36
Pelo
chely
s c
anto
rii 37
Pelu
sio
s c
asta
neus 3
8
Chelu
s fim
bria
ta 3
9
Pla
tem
ys p
laty
cep
hala
40
Em
yd
ura
sub
glo
bo
sa 4
1
Els
eya b
rand
erh
ors
ti 42
Chelo
din
a lo
ngic
ollis
43
Chelo
din
a ru
go
sa 4
4
Tera
toscin
cus k
eyserlin
gii 4
5
Shin
isauru
s c
roco
dilu
rus 4
6
Scelo
po
rus o
ccid
enta
lis 4
7
Pyth
on m
olu
rus m
olu
rus 4
8
Sib
yno
phis
co
llaris
49
Trim
ere
suru
s a
lbo
lab
ris 5
0
Pro
tob
oth
rop
s m
ao
lanensis
51
Olig
od
on n
ingshaanensis
52
Orth
riop
his
taeniu
rus 5
3
Din
od
on ru
fozo
natu
m 5
4
Ela
phe b
imacula
ta 5
5
Bungaru
s fa
scia
tus 5
6
Cro
talu
s h
orrid
us 5
7
Mecis
top
s c
ata
phra
ctu
s 5
8
Cro
co
dylu
s jo
hnso
ni 5
9
Cro
co
dylu
s p
alu
stris
60
Cro
co
dylu
s p
oro
sus 6
1
Cro
co
dylu
s rh
om
bife
r 62
Cro
co
dylu
s m
ore
letii 6
3
Cro
co
dylu
s in
term
ed
ius 6
4
Cro
co
dylu
s a
cutu
s 6
5
Xenagam
a ta
ylo
ri 66
Phry
no
cep
halu
s h
elio
sco
pus 6
7

94
Figure 4.2: Specificity of Malayan box turtle specific primers against 20 different
species and 3D plot: (a) PCR products from MBT and other 20 species; and (b)
3D plot of primer mismatch and pairwise distance of 29 species including nine
Cuora species. In (a), lane L: ladder DNA (100, 200, 300, 400, 500, 600, 700,
800, 900, 1000 and1100 bp); and lanes 1–21 : PCR products from Malayan box-
specific target (120 bp) and eukaryotic endogenous control (141 bp). Malayan
box turtle-specific product was amplified only from Malayan box turtle (lane 1),
but endogenous control was amplified from all species (lanes 1–21): Malayan box
turtle, frog, chicken, sheep, goat, cow, water buffalo, deer, pig, duck, pigeon, dog,
monkey, cat, rat, salmon fish, carp fish, cod fish, prawn, wheat and cucumber,
respectively.

95
Figure 4.3: Target (MBT) PCR product (120 bp) DNA sequence and its corresponding eletropherogram

96
4.3 Sensitivity Test for Pure, Admixed and Commercial Meatballs and
Comparison Study for Species Specific PCR assay
In food adulteration studies, beef (Mane et al., 2012), chicken (Mane et al., 2009),
turkey (Rodriguez et al., 2003), goat (Karabasanavar et al., 2011) lamb and pork (Girish
et al., 2004) among the livestock, and deer (Fajardo et al., 2008) and wild boar (Mutalib
et al., 2012) among the wild animals have been extensively studied. However, to the best
of our knowledge, no detection technique has been documented or articulated for MBT
species detection under a complex background or as commercial foods. The previously
published MBT-specific PCR–DNA sequencing assays were used to study evolutionary
(Spinks et al., 2012), taxonomic (Schoppe, 2008a, and b) and phylogenetic relationships
(Lo et al., 2006) among the closely related species. Detection sensitivity was not the main
focus of the earlier assays and hence the lower limit of detection (LOD) or assay
sensitivity was not defined (Spinks et al., 2012). For the first time, the present research
determined PCR assay sensitivity using two approaches. Firstly, extracted DNA
concentration was measured by UV-VIS spectrophotometer (Biochrom Libra S70,
Biochrom) and then DNA solutions of various concentrations were prepared using 10-
fold serial dilution (10, 1, 0.1, 0.01, 0.001, 0.0001 ng) with nuclease-free water starting
from a 10 ng concentration of target DNA templates extracted from raw and pure meats
(Figure 4.4). This method has been used by several researchers to determine PCR
sensitivity for pork (Karabasanavar et al., 2014), dog ( Ali et al., 2014), game birds
(Fajardo et al., 2010) and many other species (Ali et al., 2014). In this study a comparative
analysis of target sensitivity and stability was performed between newly designed (120
bp) and previously documented (165 bp) targets under extreme food processing
treatments (Figures 4.4 and 4.6). While the new target (120 bp) was amplified from as
low as 0.0001 ng DNA template, the lower limit of detection (LOD) for the published
target (165 bp) was limited to 0.001 ng DNA (Figure 4.4), reflecting a better sensitivity

97
of the newly designed target. Secondly, a real process of meat adulteration was simulated
using four sets of base-adulterated meat mixtures (BAM) (Ali et al., 2012). 1%, 0.5%,
0.1% and 0.01% (w/w) of turtle meats in an adjusted amount of beef, goat and chicken in
a 100 g mixture, whereas, 1%, 0.5%, 0.1% and 0.01% turtle meat was spiked in chicken
meatballs (Table 4.4). Figure 4.5(a–c) shows PCR products from turtle–beef and turtle–
goat binary as well as turtle–chicken–wheat ternary admixtures and turtle meat spiked
chicken meatballs. The MBT-specific PCR assay was highly sensitive since it identified
as low as 0.01% (w/w) MBT meat in a mixed species background. The intensity of the
PCR product obtained from the 0.01% MBT admixed suggested that the assay could
detect levels much lower than 0.1%. However, since less than 0.1% adulteration is
unlikely to be done for profit-making purposes (because of the huge risk of defamation
and loss of goodwill), and also because it was difficult to prepare admixes below 0.1%
(Razzak et al., 2015), the LOD was tested up to 0.1%. Previously, Ali et al. (2012)
detected up to 0.0001 ng of swine DNA in pure state formats and 0.01% (w/w) spiked
pork under a mixed background. Karabasanavar et al. (2011b) obtained 0.1% sensitivity
for mutton with a 0.001 ng LOD. Mane et al. (2012) detected less than 1% adulteration
of beef in admixed meat and meat products. Thus, the LOD, obtained in this study was
far below those of previously reported assays.

98
Figure 4.4: PCR sensitivity test with the newly designed 120 bp target and previously
published primers with the shortest amplicon (165 bp) under raw states. Lanes 1–6: 120
bp PCR products from 10, 1, 0.1, 0.001 and 0.0001 ng DNA from box turtle meats; and
lanes 8–13 : 165 bp PCR products under identical conditions. Lane L: ladder DNA (DNA
marker, from 100 -1100 bp); and lane NC: negative control. Tested LOD was 0.0001
and 0.001 ng DNA for 120 and 165 bp targets, respectively.

99
Figure 4.5: Specificity and sensitivity test of the newly designed primers from binary (Malayan box turtle and beef
(a) and Malayan box turtle and goat (b)) and ternary mixtures (Malan box turtle, chicken and wheat flour) (c: lanes
1–5), and commercial chicken meatball products (c: lanes 6–10). Lanes 1–5: PCR products from 10%, 1%, 0.5%,
0.1% and 0.01% binary (a, b) and ternary (c) mixtures; Lanes 6 : pure turtle meatball; lanes 7–10: chicken meatballs
with 1%, 0.5%, 0.1% and 0.01% spiked turtle meats; lane NC : negative control; and lane L : ladder DNA(DNA
marker, from 100 -1100 bp).

100
Table 4.4: Analysis of binary, ternary and commercial meat products using the
Malayan box turtle (MBT) specific PCR assay
Samples and code of
commercial meat
product items
Day 1 Day 2 Day 3 MBT DNA
detection
Detection
Accuracy
(%)
Turtle-beef binary
mixture
3 3 3 9/9 100
Turtle-goat binary
mixture
3 3 3 9/9 100
Turtle-chicken-wheat
ternary mixture
3 3 3 9/9 100
Pure chicken
meatball
3 3 3 0/9 100
Pure turtle meatball 3 3 3 9/9 100
Turtle meat spiked
with chicken
meatball
9 9 9 27/27 100
Commercial chicken
meatball
A 3 3 3 0/9 100
B 3 3 3 0/9 100
C 3 3 3 0/9 100
D 3 3 3 0/9 100
E 3 3 3 0/9 100
4.4 Effect of Processing Treatments and Comparison Study for Species Specific
PCR Assay
Meat samples were treated to study the effect of different thermal processing
treatments on target DNA stability or degradation (Arslan et al., 2006; Haunshi et al.,
2009; Ilhak & Arslan, 2007). In this study, three different heat treatment schemes,
namely, boiling, microwave cooking and autoclaving, were performed. Boiling is a
traditional way of cooking; while microwaving is a modern technique to heat food within
a short time. Autoclaving, on the other hand, is the most appropriate method to simulate

101
the steaming and canning process since it cooks at very high temperature (up to 300 °C)
under pressurized conditions to kill any potential microbes present in the samples.
Figure 4.6 demonstrates that DNA extracted from all the heat-treated sample was
successfully amplified by MBT-specific PCR. Comparison was done between the
designed primers for the 120 bp target and published primers for 165 bp targets at various
processed states. Meat samples were boiled at 100 °C for 60, 90, 120 and 150 min, but no
adverse effect was found for the 120 bp target, whereas the 165 bp target failed to amplify
from 150 min-boiled meat samples (Figure 4. 6(a)). Previously, Haunshi et al. (2009);
Karabasanavar et al. (2011) and Mane et al. (2012) studied the effect of autoclaving on
DNA by treating various types of domestic meat at 121 °C for 15–30 min and found their
samples were stable at this condition (Haunshi et al., 2009; Karabasanavar et al., 2011;
Mane et al., 2012). Further MBT meat was autoclaved at 120 °C for 60, 90, 120 and 150
min for extensive treatment) and found 120 bp PCR products under all conditions.
However, primers for 165 bp length were unable to produce target PCR product (165 bp)
at 150 min of autoclaving treatment (Figure 4.6(b)). Finally, turtle meat was cooked at
extreme microwaving conditions at 600–700 Watt (W) for 30 min and still 120 bp PCR
products were obtained from 20 ng template DNA, whereas the published 165 bp target
could not be detected at 700 W treatments (Figure 4.6(c)). This clearly reflected the fact
that the new target was the better choice over the published targets (Figure 4.6).
According to Rojas et al. (2010), longer than 150 bp of amplicon targets are not stable
under different physical and chemical processes during food preparation (Ilhak & Arslan,
2007). Meat cooked above 700 Watt for 30 min appeared to be dried, burnt and thus was
no longer suitable for consumption (almost ashes powder). Arslan et al. (2006) pan-fried
beef at 190 °C for 80 min and found no PCR product at this regime when cooking was
performed under non-aqueous conditions. However, the DNA extracted from the ashes
was sufficiently amplified for the 120 bp MBT target, suggesting its validity even for

102
degraded specimens (Arslan et al., 2006). In all these assays, MBT specific 120 bp
product was realised under all conditions, suggesting a robustness and precision of the
assay even under harsh conditions whereas the shortest target (165 bp) among the
published report was degraded.
4.5 Target Authentication by PCR-RFLP Assay
Current species identification schemes are mainly based on DNA analysis due to
some of its inherent features, such as the universal information content and excellent
stability of the DNA molecule itself (Fernández et al., 2010). DNA-based approaches
such as species-specific PCR is known as simple, low-cost, reliable and conclusive
Figure 4.6: Stability test of the newly designed (120 bp) and published shortest
(165bp) targets under boiling (a), autoclaving (b) and microwave cooking (c)
treatments. In (a), lanes 1–4 and 5–8: boiling at 100 °C for 60, 90, 120 and 150 min,
respectively. In (b), lanes 1–4 and 5–8: autoclaving at 120 °C for 60, 90, 120 and 150
min, respectively. In (c), lanes 1–3 and 4–6: microwave cooking at 600, 650 and 700
W, respectively, respectively. Lane L: ladder DNA (DNA marker, from 100 -1100
bp); and lane NC: negative control.

103
techniques. It has been widely used for the authentication of species both in simplex
(Karabasanavar et al., 2011) and multiplex (Ali et al., 2014; Kitpipit et al., 2014).
However, it has yet to be considered a definitive analytical method due to certain “hard-
to-control” features of the amplification process (Yang et al., 2005). For example, it
sometimes produces artifacts due to contamination by alien DNA at a minute scale
(Doosti et al., 2014), but these ambiguities or doubts could be eliminated by the
verification of the amplified product through at least one of three different methods,
namely, PCR-RFLP assay, probe hybridization, or target product sequencing (Maede,
2006). Probe hybridization is an attractive technique because it can detect multiple species
in a single experimental run through the use of multiple labeled probes (Do et al., 2010),
but this procedure requires purified DNA and is also laborious, expensive and time-
consuming (Rashid et al., 2015b). In contrast, DNA sequencing is a more efficient and
reliable tool, but it requires an expensive laboratory set-up and is often not suitable for
the analysis of processed food under complex matrices, because co-extracted food
ingredients can complicate the results (Albers et al., 2013). In contrast, the PCR-RFLP
assay can overcome all of these limitations and has been widely used to authenticate the
original PCR product amplified from a particular target (Fajardo et al., 2009; Girish et al.,
2007). It comprises the generations of a specific fragment profile through restriction
digestion with one or two endonucleases. A carefully selected restriction endonuclease
cleaves the PCR product at specific recognition sites, producing a set of DNA fragments
of different lengths that could be separated and visualized by gel electrophoresis (Nicolai
et al., 2009), so it distinguishes the artificial PCR product from the original through the
analysis of the restriction fingerprints (Davey et al., 2003; Doosti et al., 2014; Meyer et
al., 1994). In this study, the restriction site of target DNA sequence was determined in-
silico from the online-available website (http://nc2.neb.com /NEBcutter2/) by inserting
the target sequence and the enzymes were selected based on the; i) restriction site in the

104
sequence, and ii) ability to cut at proper fragment size (at least 10 bp different)(Table
4.5)(Figure 4.7). From the analysis, Bfa1 cutting site was verified where the enzymes that
met these criteria and digested the 120-bp MBT-specific PCR product by the Bfa1-
restriction endonuclease enzyme (New England Biolabs,
http://nc2.neb.com/NEBcutter2/) because in silico analysis showed two restriction sites
for the Bfa1 enzyme with unique fragment lengths: 72 bp, 43 bp and 5 bp (Table 4.4)
(Figure 4.7). The digested products (72 bp, 43 bp and 5 bp) obtained from the MBT-
specific PCR products (120 bp) were separated and visualized by a micro-fluidic chip-
based automated electrophoresis station (Bio-Rad Laboratories, Inc., USA) (Figure 4.7).
Figure 4.7: In Silico digestion of MBT species specific PCR (120 bp) product
with Bfa1 restriction enzyme using online (NEBcutter2 tool
(http://nc2.neb.com/NEBcutter2/). In (a and c) Bfa1 cutting cites in MBT
species specific amplicon and its fragment number. In (b) fragments base pair
after Bfa1 digestion. In (d) DNA marker in gel image.

10
5
Species 1bp 10 bp 43 bp 99bp 115bp 120bp
MBTa
A G C C C T T C T A A C A T C T C T G C T C T T T A C T A G G C A C C T C T C A C C A G A C A T C T C A C T A G C A
CBT . . . . . . . . . . . T . . . . . . . . . T . C . . T . . . . . G . . . . . . . . . . . . . . . . . . . . . . . . C
YHBT c . . . . . . . . . . . . . . . . . . . . . T . C . . T . . . . . G . . . . . . . . . . . . . . . . . . . . . . . . .
PBT d . . . . . . . . . . . . . . . . . . . . . T . C . . T . . . . . G . . . . . . . . . . . . . . . . . . . . . . . . .
ZBT e . . . . . . . . . . . . . . . . . . . . . T . C . . . . . . . . G . . . . . . . . . . . . . . . . . . . . . . . . .
VBT f . . . . . C . . . . . . . . . . . . . . . T . C . . . . . . . . . T . . T . . . . . G . . . . . . . . . . . . . . .
INDCBT g . . . . . C . . . . . . . . . . . . . . . T . C . . . . . . . . . . . . T . . . . . . . . . . . . . . . T . . . . .
BBT h . . . . . C . . . . . . . . . . . . . . . T . C . . . . . . . . . T . . T . . . . . G . . . . . . . . . . . . . . .
CTSBT i . . . . . C . . . . . . . . . . . . . . . T . C . . . . . . . . . . . . . . . . . . . . . . . C . . . . . . . . . .
Frog G . . . . . C . . . T T C . . C A . C . . T . . . . T . . . . T . . T . T A . . G . T . . T . C A . . C . . . . . C
Chicken G C . . . A . . C . . . . . . . . . . . . T . C . . T . . . C A G T . . . A . . G . . . . . . C A . . C . . . . . C
Lamb G C T . . A . . A . . T . . T . . A T . A T A C . C . . . . . . . T T . T A . . . . T . . . . C A A . . A C . . . .
Goat . C . . . A . . A . . . . . . . . A T . A T A C . C . . . . . A . T T . T A . . T . C . . T . C A A T . A C . . . .
Cow G C . . . A . . A . . . . . T . . A T . A T A C . C . . G . . A . T . . . A . . T . C . . . . C A A . . A C . . . .
Buffalo G C T . . A . . A . . . . . . . . A T . A T A C . C . . . . . . . T . . . A . . T . C . . . . C A A . . A C . . . .
Venison G C . . . A . . A . . . . . T . . A T . A T A C . G . . . . . A . T T . T A . . T . C . . . . C A A T . A C . . . .
Pig G C . . . C . . A . . . . . . . . A T . A T A C . C T . . . . . . T . . . A . . T . . . . . . C A A . . A C . . . T
Pigeon . C . . . C . . A . . . . . . . . C . . C T C C . . . . . . . . . T T . . A . T G . T . . . . C T A . C . . . . . C
Duck G C A . . C . . . . . T . . . . . . . . C T C C . G . . C . C . . T . . . A . C G . . . . . . C A . . C . . T . . T
Rat G C . . . A . . . . . . . . . . . A T . A T A C . . . . . . . A G T A . . A . G T . T . . T . C . A T . A C . . . .
Monkey . C . . . G C . C . . . C . T . . C A T A T A C . T . . C A C A G . . . . . . . . . . . . . . C . . . C T C C . . C
Dog G C G . . G . . . . . . . . . . . . . . . T . . . . . . . . . A G T A . T A . . T . G . . . . C A G . C A C . . . T
Cat G C . . . A . . . . . . . . . . . A . . A T A C . T . . . . . A G T . . . A . . T . . . . . . C A A T . A C C . . C
Salmon G C A . . A . . . . . . . . . . . A . T . T . C . C T . . . . . C T A . . A . C T . C . . T . . . . . . A C . . . T
Cod G C . . . C . . C . . T . . . . . A . T A T A C . T . . . . . . C T T . T A . C T . . . . . . . . G A G A C . . . C
Carp . C A . . A . . C . . . . . . . . A . . A T A C . C . . . . . A C T A . . A . C T . . . . . . . . . . . A C C . . .
Prawn . A T . . A G . . . . . . . T . . . A T . . . C . . . . . . . . . T A . . A . . G . . A . T G . A G A T T . . . . .
Cucumber . C . . . G A G C . . T C . T A G . T A . T . . . . G C . . . T C T T . . A . . . . T C . T G . G G A T . . . . . T
Wheat . C . . . G A G C . . T C . T A G . T A . T . . . . G C . . . T . T T . . A . . . . T C . T G . G G A T . . . . . T
Bfa1 cutting site
Table 4.5: In silico analysis of the MBT-specific primers against twenty study species eight species of the Cuora genus with Bfa1-restriction sites

106
4.6 Authentication of Limit of Detection (LOD) Assay by PCR-RFLP Assay
The limit of detection (LOD) of an assay is a critical aspect of the determination of
marginal-level targets in adulterated foodstuffs, and the LOD values for several types of
animal species, such as beef (Mane et al., 2012) chicken, turkey (Mane et al., 2009;
Rodriguez et al., 2003), goat (Karabasanavar et al., 2011), lamb and pork (Girish et al.,
2004), deer (Fajardo et al., 2008) and wild boar (Mutalib et al., 2012), have been defined
for food authenticity studies. However, the Malayan box turtle is a relatively new species
in food chains, so it’s LOD has not been defined under various food matrices. All of the
previous assays for the detection of MBT and other turtle species have described the
evolutionary origins (Spinks et al., 2012), taxonomy (Schoppe, 2008b) and phylogenetic
(Lo et al., 2006) relationships among the closely related species, so this study addressed
this research gap by determining the LOD in two different ways. Firstly, the concentration
of the extracted DNA was measured by UV-VIS spectrophotometer at a relatively high
concentration (100 ngµL-1) (Biochrom Libra S70, Biochrom Ltd, Cambridge, UK), and
then various concentrations (10, 1, 0.1, 0.01, 0.001, 0.0001 ng) were made by dilution in
nuclease-free water because inaccuracies and inconsistencies have been observed in
spectrophotometric readings using low concentrations. A 10-fold serial dilution method
has been used by several studies to determine the PCR sensitivity for porcine, mutton
(Karabasanavar et al., 2011), monkey (Rashid et al., 2015) and cat species (Amin et al.,
2015), and in this study, the amplified PCR product was found from an amount as low as
0.0001 ng DNA extracted from pure meat (Figure 4.8). Previously, Ali et al. (2012) and
Raifana et al. (2015) detected 0.0001 ng of porcine and monkey DNA in pure meat. The
sensitivity of this newly designed PCR assay for MBT detection indicated that the actual
LOD was higher than those in published reports (Ali, et al., 2015a).

107
The aim of the study was to detect a minimal amount of adulterated MBT in raw
and processed meat products, therefore two sets of binary mixed-meat products (MBT-
beef and MBT-goat) and one set of a ternary mixed-meat product (MBT-chicken-wheat)
were made to emulate the most likely forms of adulteration in processed foods. In the
admixtures, 10, 1, 0.1 and 0.01% of the MBT meats were spiked in a balanced amount of
deboned beef and goat, whereas 10, 1, 0.1 and 0.01% of MBT meat were added to chicken
and wheat flour at ratios of 20:80:100, 2:98:100, 0.2:99.8:100 and 0.02:99.98:100
(Figures 4.8 and 4.9). Figure 4.8 shows the MBT-specific PCR products from the binary
(MBT-beef and MBT-goat) and ternary admixtures (turtle-chicken-wheat flour), and all
of these results clearly supported the high sensitivity and specificity of the MBT-specific
primers developed in this study because they amplified the specific target product from
admixtures containing MBT meat in concentrations as low as 0.01% (w/w) under complex
matrices. From a practical point of view and also based on published reports, it is clear
that meat products that are adulterated by less than 0.1% do not yield remarkable profits
in the food industry, and it is very difficult to prepare admixed samples with less than
0.1% contamination. However, the findings obviously suggested that this assay could be
used to detect adulterations much lower than 0.1% (w/w). Previously, Rashid et al.
(2015) detected 0.1% (w/w) monkey DNA under various admixed states, and Ali et al.
(2012) identified up to 0.01% (w/w) pork under different food matrices. In contrast,
Karabasanavar et al. (2011) obtained PCR product from 0.1% (w/w) mutton mixed with
cattle, buffalo, goat pig, and chicken and Mane et al. (2012) found less than 1% beef
adulteration in admixed meat and meat products. Thus, the LOD established in this study
was far below those from the published reports. Furthermore, to verify the specificity, the
PCR products from the 0.01% (w/w)-admixed samples were restriction digested with
Bfa1-restriction endonuclease, and distinctive DNA fragments (72, 43 & 5 bp) or
identifiable MBT fingerprints were obtained (Figures 4.8 and 4.9). All these digested

108
results by PCR-RFLP analysis strongly reflects the assay validity. Due to the inability of
the Bio analyzer to detect the 5 bp fragment, only 72 bp and 43 bp were found in the gel
image. The endogenous control specific to eukaryotic 18S rRNA does not contain the
Bfa1 cutting site, so a clear 141-bp product was detected in all admixture samples.

10
9
Figure 4.8: Sensitivity analysis under pure, binary and ternary admixtures. In the gel image, lanes 1–6: PCR products from
10, 1, 0.1, 0.01, 0.001, and 0.0001 ng MBT DNA, respectively. Lanes 7-10: (MBT and beef) and lanes 12-15: (MBT and goat)
represent PCR products from 10, 1, 0.1, and 0.01% MBT-adulterated binary admixtures, respectively. The Bfa1 digestions of
the MBT-specific PCR product realized from 0.01% MBT admixed with beef and goat are shown in lanes 11 and 16,
respectively. In the gel image, lanes 17-20: represent PCR products from the ternary mixture (MBT, chicken and wheat flour)
containing 10, 1, 0.1, and 0.01% MBT meat, and lane 21 shows the Bfa1 digestion of the MBT-specific PCR products obtained
from the ternary admix containing 0.01% MBT. Lane L: ladder DNA, and lane 22: negative control (NC).

110
4.7 Validation of Stability Assay by PCR-RFLP Assay
Target stability is a key point to consider in the validation of any analytical results,
especially for forensic samples where less stable analytes are frequently decomposed
resulting in false negative identifications. Published reports reflect the significant effort
that scientists have put into the development of short-length DNA targets, which are
thermodynamically more stable than the longer targets and hence persist through extreme
stresses that often break down longer DNA markers (Ali et al., 2015). In several instances,
DNA barcoding has failed to recover longer targets from degraded specimens because of
Figure 4.9: Sensitivity analysis under pure, binary and ternary admixtures using MBT
specific 120 bp by PCR-RFLP assay are shown in electropherogram are demonstrated
by respective labels.

111
the longer and fragile attributes of the targets, which are often more than 600 bp in length
(Frézal & Leblois, 2008). Furthermore, the interference of nuclear integrated
mitochondrial pseudogenes (numt) seriously compromises the reliability of DNA
barcoding in species authentication (Song et al., 2008), so instead of targeting universal
markers, species-specific short amplicon-length PCR assays and short-length barcode
markers (Kress et al., 2005) have been prioritized over the years. In food forensic analysis,
various thermally treated samples have been used to benchmark target biomarker stability
(Arslan et al., 2006; Haunshi et al., 2009), but because there are very few PCR assays
available for the analysis of MBT in the food chain, there is a gap in the evaluation of the
stability and robustness of the MBT-specific targets under various food processing
conditions. This study confirmed the stability of the MBT target through three different
thermal treatment schemes, namely, boiling, microwave cooking and autoclaving. Boiling
simulates traditional cooking, in which meat is cooked in boiling water at 100 C for a
fixed amount of time (Ali et al., 2015a), and over the years, steam cooking or boiling
have increased in popularity over pan frying for health reasons (Figure 4.6). In contrast,
microwave cooking is a modern technique that heats and cooks food through exposure to
electromagnetic radiation in the microwave spectrum (Rashid et al., 2015), while
autoclaving is the most appropriate method to simulate steaming and canning-based meat
processing because it cooks at a high temperature (121 °C) under pressurized conditions
to kill any potential microbes in the samples. Extreme autoclaving (2.5 h at 120 °C and
45 psi) has been used as a benchmark for target DNA stability in several studies (Ali, et
al., 2012, 2014 and 2015). In this study, the MBT-specific target was obtained from all
of the thermally processed samples (Figures 4.10 and 4.11); when MBT meat was boiled
at 100 °C for 60, 90, 120 and 150 min, no adverse effects on the amplification cycle were
found (Figures 4.6 and 4.10). Previously, Ali et al. (2012) detected a 109-bp porcine target
after boiling for 2.5 h, and Haunshi et al. (2009), Karabasanavar et al. (2011) and Mane

112
et al. (2012) identified target species after autoclaving various types of domestic meat at
121 °C for 15–30 min. Here, MBT meat was autoclaved at 120 °C for 60, 90, 120 and
150 min (extensive treatment) under 45 psi and obtained targeted PCR products from all
of the treated samples (Figures 4.6). Finally, extreme microwave cooking was done at
600-700 W for 30 min, and clear a band for the desired product (120 bp) was obtained
(Figures 4.6 and 4.10). This study showed that short-length targets are more stable than
longer ones, but when meat samples were cooked in a microwave at 700 W for 30 min,
the meat turned into ash that was no longer suitable for consumption. Previously, Arslan
et al. (2006) failed to amplify the target product from pan-fried beef meat at 190 °C for
80 min, but in this assay, target amplification from ash-like specimens was a clear
indication that this method could be used to detect the MBT target from highly
decomposed specimens, which are frequently found in forensic samples. Furthermore, to
verify the specificity and stability assay, the PCR products from the boiled (150 min),
autoclaved (150 min) and microwave cooked (700 Watt) samples were restriction digested
with Bfa1-restriction endonuclease, and distinctive DNA fragments or identifiable MBT
fingerprints were obtained (72, 43 bp) (Figures 4.10 and 4.11). This evidence reflects the
higher specificity and stability of the short length DNA amplicon in harsh environments
and the designed primers also showed a higher sensitivity.

11
3
11
3
Figure 4.10: Stability analysis of the MBT-specific target DNA (120 bp) under boiling, autoclaving and microwave
cooking. In the gel image, lanes 1-4: are boiling at 100 C for 60, 90, 120 and 150 min, respectively, and lanes 6-9 are
autoclaving at 121 C for 60, 90, 120 and 150 min under a pressure of 45 psi. Lanes 5 and 10: represent Bfa1 digestion
from samples boiled (lane 5) and autoclaved (lane 10) for 150 min, respectively. In the gel image, lanes 11-13:
represent microwave cooking at 600, 650 and 700 W for 30 min, respectively, and lane 14 is the Bfa1 digestion of the
microwave cooked sample at 700 W. Lane L: ladder DNA, and lane 15: negative control(NC).

114
4.8 Evaluation of Meat Products and Commercial Products Screening
To establish the validity, stability and reliability of the developed PCR-RFLP
assay, various commercially available meat products including beef and chicken
meatballs, burgers and frankfurters, which are widely consumed across Malaysia,
Indonesia, China and most of the world (Rahman et al., 2015; Rahman et al., 2014;
Razzak 2015; Rohman et al., 2011) were experimentally screened. Eight (8)
commercially available Halal-branded chicken and beef meatballs (A-H), seven (7)
chicken and beef burgers (I-O) and eight (6) chicken and beef frankfurters (M-T) were
collected from four different Malaysian outlets located in the states of Kuala Lumpur and
Figure 4.11: Stability analysis of the MBT-specific target DNA (120 bp) under
boiling, autoclaving and microwave cooking are shown in electropherogram are
demonstrated by respective labels.

115
Selangor in Malaysia on three different days (Table 4.6). The adulteration of meat
products was simulated in dummy commercial meat products following Ali et al. (2012),
Rahman et al. (2014), and Razzak et al. (2015), in which dummy meatball, burger and
frankfurter products were spiked with 10, 1, 0.1 and 0.01% of ground MBT meat.
Additionally, the 1% MBT-spiked meat products were subjected to autoclaving for 2.5 h
at 120 °C under 45 psi (Figure 4.12a, b and c) because this treatment is known to break
down DNA. The MBT-specific PCR product was amplified from all levels of adulteration
including the 1% autoclaved samples. However, no MBT-specific PCR product was
observed from the meat products collected from commercial sources (Table 4.6). To
confirm the origin of the amplified target, the PCR products were digested with Bfa1-
restriction endonuclease enzyme, and distinctive MBT fingerprints composed of 72, 43
and 5-bp oligo fragments were obtained from all of the meat products, but only the 72
and 43-bp products were detected in the gel image due to the inability of the currently
available analytical machine to detect a 5-bp product (Figures 4.12 a, b and c and 4.13).
These digestion results completely matched the in silico digested fragments, so the
findings strongly supported that the PCR-RFLP assay was specific to MBT and suitable
for identifying less than 0.01% (w/w) MBT meat adulteration in commercial food. The
endogenous control specific to eukaryotic 18S rRNA does not contain the Bfa1 cutting
site, so a clear 141-bp product was detected in all samples. Thus the analysis of
commercial products screening are also presented in Table 4.6. The endogenous control
specific to eukaryotic 18S rRNA does not contain the Bfa1 cutting site, so a clear 141-bp
product was detected in all samples (Ali et al., 2015). All of the experiments were carried
out in triplicate by three independent analysts on three different dates to confirm the
reproducibility of the results (Ali et al., 2012). The experimental and theoretical
specificity, stability and sensitivity of the developed assay indicated that it was a reliable
and rapid technique for the authentication of MBT adulteration in the food chain.

116
Malaysia is committed to developing a Halal hub industry and to being a competitive
partner in the global Halal food business, so the absence of MBT meat in Malaysian food
was quite encouraging.

11
7
Figure 4.12: MBT meat screening in model meat products. In all figures (a-c), lanes 1, 3, 4 and 6, 8, 9 are PCR products
from 1%, 0.1% and 0.01% MBT meat spiked chicken (lanes 1, 3 and 4), beef (lanes 6, 8, 9) meatballs (a), burgers (b),
frankfurters (c), respectively. Lanes 5 and 10: represent Bfa1 digest of PCR products obtained from of 0.01% MBT meat
spiked chicken and beef meatballs (a), burgers (b), frankfurters (c). Lanes2 and 7 are the Bfa1 digest of PCR products
obtained from of 1% MBT meat spiked chicken and beef meatballs (a), burgers (b), frankfurters (c) after autoclaving
treatment. Lane L: DNA ladder and lane11: Negative control (NC).

118
4.9 Product Authentication by PCR-RFLP Assay
In this study, MBT-specific PCR product was digested by the Bfa1-restriction
endonuclease enzyme (New England Biolabs, see http://nc2.neb.com/NEBcutter2/)
because in silico analysis showed two restriction sites for the Bfa1 enzyme with unique
fragment lengths: 72, 43 and 5 bp. The digested products (72, 43 and 5 bp) obtained from
the MBT specific PCR products (120 bp) were separated and visualized by a micro-fluidic
chip-based automated electrophoresis station (Bio-Rad Laboratories, Inc., USA) (Figures
4.8–4.13), but because the 5-bp fragment size was below the resolution capacity of the
instrument (bioanalyzer), it remained undetected in the gel image (Figures 4.8–4.13). The
endogenous target (141 bp) was amplified from all of the analyzed samples, which
indicated the presence of good quality DNA and thus ruled out the probability of any false
Figure 4.13: MBT meat screening in model meat products and validated by
PCR-RFLP assay, showing 120 bp PCR product before and after Bfa1
digestion.

119
negative results. Two sets of binary mixed-meat products (MBT-beef and MBT-goat) and
1 set of a ternary mixed-meat product (MBT-chicken-wheat) were made to emulate the
most likely forms of adulteration in processed foods. In the admixtures, 10, 1, 0.1 and
0.01% of the MBT meats were spiked in a balanced amount of deboned beef and goat,
whereas 10, 1, 0.1 and 0.01% of MBT meat were added to chicken and wheat flour at
ratios of 20:80:100, 2:98:100, 0.2:99.8:100 and 0.02:99.98:100 (Figures 4.8 and 4.12).
The MBT-specific PCR product (120 bp) was obtained from all forms of adulteration at
a tested limit of detection of 0.01% MBT meat; all of the PCR products were validated
by digestion with the Bfa1 enzyme (Figures 4.8 and 4.12).We further screened for MBT
DNA in various types of food products using laboratory prepared dummy meat products
and commercially available meat products (Tables 4.5). Lower-value meats are
commonly used to replace higher-value meats to increase economic profit (Ali et al.,
2012), so the most popular meat products, such as chicken and beef meatballs, burgers
and frankfurters, were prepared following Ali et al. (2012), Rahman et al. (2014) and
Razzak et al. (2015). All of these meat products were spiked with 10, 1, 0.1 and 0.01%
MBT meat to demonstrate the common forms of adulteration in the commercial food
industry. However, mixing with less than 1% of low-value meat does not yield any
significant economic benefit relative to the great risk of defamation (Razzak et al., 2015).
Consequently, we determined that the sensitivity of this assay using 1% MBT-adulterated
autoclaved dummy meats was suitable for the detection of trace level adulteration in
processed food. The RFLP results indicated clearly unique fragment patterns specific to
MBT in 1% MBT-adulterated meat products (Figure 4.12). Finally to establish the
validity, commercially available meat products including beef and chicken meatballs,
burgers and frankfurters, which are widely consumed across Malaysia, Indonesia, China
and most of the world, were experimentally screened (Table 4.6). No positive
amplification signals from these commercial meat products were observed with the MBT-

120
specific primers. Thus we could not extend further analysis against the collected meat
products samples.
Table 4.6: Analysis of reference and commercial meat products using MBT
specific PCR assay
Items and code of product items Number of
samples
Malayan box turtle
DNA detection
Detection
accuracy (%)
Meat products
Pure chicken meatball 9 0/9 100
Pure beef meatball 9 0/9 100
MBT-spiked chicken meatball 27 27/27 100
MBT-spiked beef meatball 27 27/27 100
Pure chicken burger 9 0/9 100
Pure beef burger 9 0/9 100
MBT-spiked chicken burger 27 27/27 100
MBT-spiked beef burger 27 27/27 100
Pure chicken frankfurter 9 0/9 100
Pure beef frankfurter 9 0/9 100
MBT-spiked chicken frankfurter 27 27/27 100
MBT-spiked beef frankfurter 27 27/27 100
Commercial chicken meatball
A 9 0/9 100
B 9 0/9 100
C 9 0/9 100
D 9 0/9 100
Commercial beef meatball
E 9 0/9 100
F 9 0/9 100
G 9 0/9 100
H 9 0/9 100
Commercial chicken burger
I 9 0/9 100
J 9 0/9 100
K 9 0/9 100
L 9 0/9 100
Commercial beef burger
M 9 0/9 100
N 9 0/9 100
O 9 0/9 100
Commercial chicken frankfurter
P 9 0/9 100
Q 9 0/9 100
R 9 0/9 100
Commercial beef frankfurter
S 9 0/9 100
T 9 0/9 100
U 9 0/9 100

121
4.10 Traditional Chinese Medicines Screening and Validation by PCR-RFLP
Assay
For thousands of years, traditional Chinese medicines (TCM) have been used in
China. Despite of great advance of western medicines, TCM is widely exploited as
healing methods for many countries in Asia and 80% of the developing countries rely on
traditional medicines. With it broad-spectrum effects, TCM have been recognized as
suitable medication for modern diseases such as cancer, cardiovascular disease, asthma
and chronic illness. Moreover, due to increasing global demand, various types of health
care products have been developed from TCM to meet the contemporary trend of “back
to nature”. However, substituents and adulterants of TCMs materials are often introduced
intentionally or accidentally, thus not surprisingly, there are persistent signs that
consumers may face real risks to their health from using these products. Although most
of the TCM claim to be made from plant products, this is not always true. As a result,
several highly endangered species, such as rhinos, crocodiles, turtles, tigers and elephants
which are enlisted in the CITES Appendix I and II, have continued to be killed to supply
the raw materials of these medicines which has a huge market in the Southeast Asia and
Chinese communities around the world (Lee et al., 2014). So, consumers are completely
at the mercy of the manufacturer’s own quality assurance process that must confirm the
presence of the desired substance and also the absence of contaminating substances.
Therefore, we attempted to screen MBT materials in 153 (9X17) traditional Chinese
medicinal products of 17 different brands sold in various Chinese medicine shops across
Malaysia (Table 4.7) 40% of the total(153 smaples) or Sixty two sample (62) of the 153
tested products and up to 33-66% contaminants were found to be MBT positive, reflecting
the wide spread consumption and uses of MBT materials in these medicines. Most of this
information was not indicated in the product labels (Table 4.7). A study reported in the

122
US, 7% undeclared animal materials were found in 260 Asian traditional medicines (Ko,
1998).
To verify the authenticity, the amplified PCR products of the MBT positive
samples were digested with Bfa1-restriction endonuclease enzyme and distinctive MBT
fingerprints (72 and 43 bp) were obtained (Figures 4.14 and 4.15) (Table 4.7). Since
herbal products are regarded as low-risk and natural sources of cure for many diseases,
traditional medicines are not under the stringent labelling regulation what the medicine
contains. In this regard, the TCMs studied here clearly reflect that such declarations are
not correct at all times; the most worrisome concern is that MBT ingredients were not
declared on the labels and that most of these preparations were claimed to be plant
products to prove that there are no religious obligations since plant products are permitted
in all religions. Thus 62 of the total 153 tested TCM samples in this study provided a
100% matching of DNA materials with Cuora amboinensis species, reflecting a clear
break of wildlife conservation law in the preparation and selling of TCMs (Adeola, 1992;
Alves & Rosa, 2005; Angeletti et al., 1992) (Table 4.7). This is also incompatible with
the regulation of the US Food and Drug Administration (FDA) and European (Bennett et
al., 2002; Robinson & Bennett, 2000, 2002) laws, which require a mandatory declaration
of the product ingredients. Moreover, turtle species are considered as zoonotic agents and
heavy metals reservoirs, thus the possibility of threat to the public health should be
seriously considered. Between 1990 and 1992, more than 100 women in Belgium and
France were found to have extensive interstitial fibrosis of the kidneys after using a
weight-loss regimen involving TCM (Liu et al., 2015). Thereby, it is the responsibility of
the manufacturer to ensure safety before a product is marketed.

123
Figure 4.14: Traditional Chinese medicines analysis. In the gel image, lanes
1, 3,5 and 7are for A (Chinese herbal jelly) E (Anti inflammation) I (Sex
stimulator) & N (Leukorrhea) medicines respectively, and lanes 2,4 and 6
represent Bfa1 digestion from samples A E I & N respectively. Lane L: ladder
DNA, and lane 9: negative control (NC).

124
Figure 4.15: Screening of traditional Chinese medicines by PCR-RFLP
assay and showing 120 bp PCR product before Bfa1 digestion and after
Bfa1 digestion of medicinal products are shown in the electropherograms
and demonstrated with labels in insets.

12
5
Table 4.7: Analysis of traditional Chinese medicines using MBT specific PCR assay
Code of
medicinal
items
Information of the products labeling Product applications Number of
samples
Malayan box
turtle DNA
detection
Malayan box turtle
contamination (%)
in individual
product
A Chinese herbal jelly powder Nocturnal enuresis, Anti-inflammation, Dessert soup, Muscle
growth, Relieving itching, Reducing acne and kidney restoration,
Blood circulation,
9 5/9 55.55 %
B Chinese herbal jelly powder Nocturnal enuresis, Anti-inflammation, Dessert soup, Muscle
growth, Relieving itching, Reducing acne and kidney restoration,
Blood circulation
9 4/9 44.44 %
C Herbal jelly powder Nocturnal enuresis, Muscle growth, Relieving itching, Reducing
acne and kidney restoration, Blood circulation, Anti-inflammation
9 4/9 44.44 %
D Herbal jelly powder Nocturnal enuresis, Anti-inflammation, Dessert soup, Muscle
growth, Relieving itching, Reducing acne and kidney restoration,
Blood circulation, Anti-inflammation
9 3/9 33.33 %
E Semen nulumbinis, Mel, Frutus Lycii, Radix
ginseng, Cordyceps, Radix astragali, Radix
codonopsis pilosulae, Radix morindae
Anti-inflammation, Pumpils, Blood Circulation, Male fertility,
Strength of knees, Gall bladder, Hepatitis, Herpes, Shingles, Otitis
meida, Cystitis, Hyperthyroidism, Migraines and Jaundice
9 3/9 33.33 %
F Rhizomz dioscoreae, Fructus ziziphi jujubae,
Radix ginseng, Cordyceps, Radix astragali, Radix
codonopsis pilosulae, Radix morindae
Anti-inflammation, Pumpils, Gall bladder, Hepatitis, Herpes,
Shingles, Otitis meida, Cystitis, Hyperthyroidism, Migraines and
Jaundice
9 4/9 44.44%

12
6
Table 4.7, continued
Code of
medicinal
items
Information of the products labeling Product applications Number of
samples
Malayan box
turtle DNA
detection
Malayan box turtle
contamination (%)
in individual
product
G Semen nelumbinis, Radix ginseng, Cordyceps,
Radix astragali, Radix codonopsis pilosulae,
Radix morindae
Gall bladder, Hepatitis, Herpes, Shingles, Otitis meida, Cystitis,
Hyperthyroidism, Migraines and Jaundice, Anti-inflammation,
Pumpils
9 5/9 55.55 %
H Radix ginseng, Cordyceps, Radix astragali, Radix
codonopsis pilosulae, Radix morindae
Gall bladder, Hepatitis, Herpes, Shingles, Otitis meida, Cystitis,
Hyperthyroidism, Migraines and Jaundice, Pumpils
9 0/9 0.00 %
I Tongkat ali powder Stimulate libido, Promote semen quality, Muscle growth, Pumpils.
Blood circulation, Male enhancement
9 6/9 66.66 %
J 100% Tongkat ali capsule powder Stimulate libido, Promote semen quality, Muscle growth, Anti-
inflammation, Blood circulation, Male fertility
9 3/9 33.33 %
K Tongkat ali capsule powder Stimulate libido, Promote semen quality, Muscle growth, Anti-
inflammation, Blood circulation, Male fertility
9 5/9 55.55 %
L 100% Tongkat ali capsule Stimulate libido, Promote semen quality, and Muscle growth, Anti
inflammation, Blood circulation, Male fertility
9 4/9 44.44 %

12
7
Table 4.7, continued
Code of
medicinal
items
Information of the products labeling Product applications Number of
samples
Malayan box turtle
DNA detection
Malayan box turtle
contamination (%)
in individual
product
M 100% Tongkat ali powder Stimulate libido, Promote semen quality, Muscle growth, Anti-inflammation,
Blood circulation, Male enhancement and fertility
9 5/9 55.55 %
N Radix gentinae, Radix bupleuri, Radix scutellariae,
Fructus gardenia, Semen plantaginis, Radix angelicae
sinensis, Radix rehmsnniae, Radix glycyrrhizae
Deafness, Hypochondriac pain, Irritability, Headache, Dizziness, Swollen
sensation in ears/head, Swollen genitalia, Leucorrhea,
9 4/9 44.44 %
O Radix gentinae, Radix bupleuri, , Rhizomzz alismatis,
Caulis clematidis, Semen plantaginis, Radix angelicae
sinensis, Radix, Radix glycyrrhizae
Hypochondriac pain, Irritability, Headache, Dizziness, Deafness, Swollen
sensation in ears/head, Swollen genitalia, Leucorrhea, Acute icteric
hepatitis, Urethritis
9 0/9 0.00%
P Radix scutellariae, Fructus gardenia, Rhizomzz
alismatis, Caulis clematidis, Semen plantaginis, Radix
angelicae sinensis, Radix rehmsnniae, Radix glycyrrhizae
Liver, Gallbladder fire, Headache, Tinnitus, Hypochondriac pain, Irritability,
Dizziness, Deafness, Swollen genitalia, leucorrhea
9 4/9 44.44 %
Q Radix gentinae, Radix bupleuri, Radix scutellariae,
Fructus gardenia, Rhizomzz alismatis, Caulis clematidis, Semen plantaginis, Radix angelicae sinensis, Radix
rehmsnniae,
Migraine, Headaches, Acute pelvic inflammation , Swollen testes,
Leucorrhea, Hyperthyroidism, Acute conjunctivitis, Acute liver fire
9 3/9 33.33 %

128
4.11 Optimization of SYBR Green Duplex Real-Time PCR System
A novel SYBR Green duplex real-time PCR system for MBT detection was
developed by combining two sets of primers specific for MBT cytb (120 bp) and universal
eukaryotic 18S rRNA (141 bp). Initially a singleplex PCR system was optimized and Ct
values were recorded using DNA templates extracted from meat, skin, shell and bone
tissues of MBT and cross tested against 20 non-target species (Table 4.8). Subsequently,
the duplex system was established by primers for the internal control. However, no
significant differences in Ct values were observed between the two systems. In order to
eliminate any non-specific detection of SYBR Green PCR signal that might come from
the formation of primer dimers and any other non-specific products (Kubista et al., 2006),
melting curve analysis of the post-PCR samples was executed by plotting the variation in
fluorescence as a function of time (dF/dT) against the melting (Tm) temperature of the
reaction products. Since Tm depends on the length, base composition (GC/AT ration) and
concentration of the target DNA sequences, the amplified PCR products for MBT (120
bp) and eukaryotic target (141 bp) were clearly differentiated through the specific Tm for
each target. Two different peaks at 74.63 ± 0.22 and 81.40 ± 0.31 °C in a single melting
curve were the obvious representation of MBT and eukaryotic positive control,
respectively (Ririe et al., 1997; Varga & James, 2006) (Figure 4.16).

129
4.12 Selectivity of the Real-time PCR Assay
Cross-reactivity of the designed primer were checked using the duplex PCR
system wherein the MBT primers were challenged against the DNA templates of 20
different species including the Chinese edible frog (Hoplobatrachus rugulosus accession:
NC_019615.1), chicken (Gallus gallus accession: KP269069.1), cow (Bos taurus
accession: GU947021.1), goat (Capra hircus accession: KR059217.1), pig (Sus scrofa
domestica accession: AP003428.1), pigeon (Columba livia accession: KP168712.1),
sheep (Ovis aries accession: NC_001941.1), duck (Anas platyrhychos accession:
EU755253.1), buffalo (Bubalus bubalis accession: NC_006295.1), giant river prawn
(Macrobrachium rosenbergii accession: NC_006880.1), dog (Canis lupus familiaris
accession: KF907307.1), cat (Felis catus accession: NC_001700.1), rat (Rattus rattus
accession: NC_012374.1), monkey (Macaca fascicularis accession: NC_012670.1),
Figure 4.16: Specificity of Malayan box turtle (MBT) specific primers against 20
different species. Shown are lane L: ladder DNA; and lanes 1–21: PCR products from
MBT target (120 bp) and eukaryotic endogenous control (141 bp). Malayan box turtle-
specific product was amplified only from Malayan box turtle (lane 1), but endogenous
control was amplified from all species (lanes 1–21): Malayan box turtle, pond slider
turtle, chicken, sheep, goat, cow, water buffalo, deer, pig, duck, pigeon, dog, monkey,
cat, rat, salmon fish, carp fish, cod fish, prawn, wheat and cucumber, respectively. The
inset is the melting curve of the SYBR Green PCR for MBT and endogenous control.

130
venison (Odocoileus virginianus accession: KM612279.1), Atlantic cod (Gadus morhua
accession: NC_002081.1), salmon (Salmo salar accession: NC_001960.1), carp
(Cyprinus carpio accession: KU050703.1), wheat (Triticum aestivum accession:
NC_007579.1) and cucumber (Cucumis sativus accession: NC_016005.1); but no cross-
reactivities were observed (Table 4.8). While the amplification signals (Ct values) of the
MBT-specific PCR for the MBT-containing samples were 17.40±0.27–21.61±0.34, Ct
values of the other species were ≥ 38 in a 40-cycle PCR reaction (Table 4.8 and Figure
4.16). On the other hand, the endogenous Ct values for all samples were found to be
18.02±0.20–24.30±0.23; this reflected the presence of good-quality DNA in all
specimens but eliminated the possibilities of potential false-negative detection. The slight
variation found for of Ct values (17–21) for the meat, skin, bone and shell tissues of the
MBT could be attributed to heat, pressure, physical stresses, variable copies of
mitochondrial DNA and presence of various inhibitors in different tissues. In some
instances, negative controls yielded a positive signal at 38.5 cycles and, thus, it was
inferred that any Ct ≥ 38 was non-specific for the MBT targets (Table 4.8). The specificity
of the duplex assay was further confirmed by the melting curve wherein two distinctive
peaks at 74.63 ± 0.22 and 81.40 ± 0.31 °C were the clear signatures for MBT (120 bp)
and endogenous positive control (141 bp), respectively (Ririe et al., 1997; Varga & James,
2006) (Figure 4.16). Several factors such as dye types and concentrations, salt
environment, primer dimers, unpredicted amplicons, inhibitors and variations in melting
programs might result in false positive outcomes (Hennenfent & Herrmann, 2006; Varga
& James, 2006). Thus the duplex PCR products were confirmed and detected in 2%
agarose gel which clearly reflected MBT (120 bp) and universal eukaryotic product (141
bp), eliminating the doubts of any false negative detection (Figure 4.16).

131
Table 4.8: Specificity and Ct values of the SYBR Green duplex real time PCR assay
Samples
Malayan box turtle
specific PCR
system
Eukaryotic
(18SrRNA)
positive control
system
Ct value and Standard deviation (±)
Malayan box turtle raw meat 17.40 ± 0.27 18.20±0.23
Malayan box turtle sterilized meat 18.56± 0.34 19.01±0.23
Malayan box turtle raw skin 18.40± 0.29 18.30±0.40
Malayan box turtle raw shell 20.12± 0.29 19.20± 0.29
Malayan box turtle sterilized skin 21.61± 0.34 20.50±0.38
Malayan box turtle bone 20.20± 0.38 20.09±0.50
Frog meat 39.34±0.11 18.02±0.20
Chicken 38.70±0.23 19.30±0.34
Goat 40.00 21.03±0.24
Pig 39.02±0.23 18.40±0.38
Pigeon 40.00 20.04±0.28
Sheep 39.02±0.27 18.30±0.36
Venison 39.05±0.34 24.04±0.49
Rat 40.00 23.40±0.21
Cat 40.00 17.90±0.31
Dog 38.98±0.23 22.60±0.31
Duck 38.90±0.40 19.20±0.22
Cow 39.50±0.23 20.50±0.23
Monkey 39.50±0.21 19.20±0.23
Buffalo 38.92±0.32 18.30±0.21
Prawn 39.04±0.02 19.11±0.14
Salmon fish 39.50±0.23 24.30±0.23
Cod fish 39.02±0.42 19.42±0.22
Carp fish 40.00 23.20±0.15
Cucumber 39.97±0.31 22.41±0.31
Wheat 40.00 21.02±0.11
4.13 Limit of Detection (LOD) and Quantification (LOQ) and Efficiency of Real
time PCR Assay
The LOD of an assay plays a critical role in the determination of marginal-level
targets in adulterated foodstuffs. Thus, the LOD of this study was determined by two
different indices. Firstly, the concentration of the pure meat DNA was measured at ≥ 100
ng μL–1 (Biochrom Libra S70, Biochrom Ltd, Cambridge, UK) and then various

132
concentrations such as 100 (100%), 10, 1, 0.1, 0.01, 0.001, 0.0001 and 0.00001 ng
(0.00001%) were made by a 10-fold serial dilution using nuclease-free deionized distilled
water (Figure 17(a)), as inaccuracies and inconsistencies had been observed in
spectrophotometric readings when low concentrations (≤ 10 ng μL–1) were used. Ct
(threshold cycle) responses of these series of diluted DNA were measured using the
duplex real-time PCR system and signal (Ct) was detected with as low as 0.00001 ng
DNA template at 38 ± 0.12 cycles (Figure 17(a)). This amplification signal was close to
that of the negative control (≥ 38.50 ± 0.35 cycles) in the 40-cycle PCR system.
Furthermore, several researchers concluded that the highest limit should be set at 38
cycles in the Applied Biosystems SYBR Green PCR Master Mix in order to eliminate the
possibility of any false-positive detection that may come from the cross-reactivity or
primer dimer formation (Druml et al., 2015a and b). Secondly, the validation was
performed with mixed DNAs of MBT using two types of heat-treated (autoclaved) binary
admixtures (Figure 4.17(b)) and six types of reference meat products (chicken and beef
meatballs, burgers and frankfurters) (Figure 4.18), and clear signals were detected as low
as 0.001% (w/w) MBT contamination. The amplification signals (Ct values) of reference
meat products were in the range of 30.90 ± 0.20 to 33.32 ± 0.12 for 0.001% of MBT. The
Ct values of the endogenous controls were in the range and 19.67 ± 0.32 to 21.17±0.65
of internal positive control (18S rRNA) in various specimens (Tables 4.10). There was
no significant variation of Ct values of the endogenous positive control (18S rRNA) due
to it (internal control) being responsible for all the meat DNA (target and non-target). The
melting curves reflected target products from MBT and internal control at 74.63 ± 0.22
and 81.40 ± 0.31 °C, respectively. Since the Ct for the 0.001% MBT mix was 33.32 ±
0.12 or far below the LOD (≥ 38.5), the assay could be used to detect MBT materials in
food items at levels much lower than 0.001% (Figures 4.17c and d and 4.18b-g). The limit
of quantification(LOQ) was determined from the linear correlation of the logarithm of
133
DNA concentration and the Ct value obtained from binary admixtures (Table 4.9) and
laboratory-made reference (Tables 4.9 and 4.10) meat products (Figures 4.17(b) and
4.18(a)). The contents of MBT and total DNA in unknown food samples were calculated
from the standard curve for MBT (Cytb) and the reference eukaryotic (18S rRNA gene)
control. The Ct values of the analyzed samples were normalized against the admixture
standard curve and plotted against the logarithmic concentrations of the spiked MBT in
binary admixtures and laboratory-made reference meat products. This resulted in a linear
standard curve in the range of 10 to 0.001% (Figures 4.17(b) and 4.18(a)) with slopes that
ranged between -3.36 and -3.52, which resulted in PCR efficiencies (E%) between 98.15
and 92.23% ; these were very close to the ideal value (100%) that comes from a slope of
–3.32. The correlation coefficient (R2) was between 0.9939 and 0.9994, indicating high
linear relationship between the Ct value and the logarithm of the DNA concentration
(Figures 4.17(a and b) and 4.18(a)). These results are in accordance with the European
Network of GMO Laboratories (ENGL) guidelines (ENGL, 2008).
Finally, the lowest concentrations that were recovered from the admixtures and
reference meat products were between 0.0005 and 0.003 ng, which arose from 0.001 %
MBT spiked into the samples (Tables 4.8-4.10). While recoveries in reference meat
products containing 10 to 1 % MBT meat were 98.19–124.97 %, they were 157.69–
166.57 % for 0.001 % MBT contamination, suggesting some degrees of inaccuracies at
lower concentrations (Tables 4.9 and 4.12). Earlier studies also reflect a higher percentage
(144-178%) of recovery at lower (2% spiked samples) concentration (Druml, et al., 2015).
It is difficult to find the same quantity DNA in all cells due to fivefold variation of DNA
content per cell between tissues. (Floren et al., 2015). However, when real-time PCR-
recovered values (y-axis) (Table 4.13) were plotted against the reference value (x axis), a
calibration model was found with a very high correlation coefficient (R2 ≥ 0.999) (Figure
4.19). The deviation from the reference values at lower concentrations most probably

134
resulted from the unequal distributions of the trace amount of contaminated meat or
higher error in the preparation of reference samples (Druml et al., 2015a and b). However,
since most of the fraudulent mixing takes place at higher concentrations in order that
companies may make extra profit, a little inaccuracy at lower level contamination does
not practically hinder assay applicability since detection was performed at all
concentrations (Moore et al., 2012). Tables 4.9 and 4.10 reflect a high content of MBT
(10%) in reference meatball, burger, and frankfurter products, which does not show
significant/cause a systematic error in MBT quantification. Furthermore, the repeatability
of this assay was investigated with two different DNA-extraction kits, PCR master mixes
and PCR machines along with a change of analyst on three independent days (Tables 4.8–
4.12). The results indicated that these external variables such as operator, DNA extraction
kit, PCR master mix and PCR instrument do not influence the final results; instead, all
these indicate the assay reliability and robustness under various circumstances.

13
5
Figure 4.17: Standard (a) calibration curves for pure DNA(100 ng to 0.00001 ng) and (b) for binary admixtures DNA(10 ng to 0.001 ng)
and melting (c and d) curves for binary admixtures. In the standard curve (b) shown are the recovery of MBT DNA from MBT- beef (1)
and MBT – chicken (2) binary admixtures containing 10, 1, 0.1, 0.01 and 0.001% (w/w) MBT tissues with the balanced amount of beef and
chicken, respectively. (c) and (d) are the melting curves for binary (1&2) admixture(MBT-beef and MBT-chicken) showing the distinctive
peaks at 74.63 ± 0.22 °C and 81.40 ± 0.31 for MBT (120bp) and endogenous (141bp) targets.
(1) y = -3.33x + 21.36
R² = 0.99
(2) y = -3.33x + 22.33
R² = 0.99
0
10
20
30
40
50
-6 -4 -2 0 2 4
Mea
n C
t v
alu
e
Log DNA concentration [ng/µL
(a) Calibration curve for pure MBT and eukaryotic
(18S rRNA) DNA
(1) MBT
(2) Euk(18S rRNA)
(2) y = -3.47x + 22.73
R² = 0.99
(1) y = -3.45x + 22.15
R² = 0.99
0
10
20
30
40
-4 -2 0 2
Mea
n C
t v
alu
e
Log DNA concentration [ng/µL]
(b) Calibration curve for binary admixture
(MBT-chicken and MBT-beef)
(1) Binary(MBT-Beef)
(2) Binary(MBT-Chicken)

13
6
Figure 17, continued

13
7
Table 4.9: Repeatability and recovery of MBT targets in binary admixture (MBT-beef and MBT-chicken) (w/w%)
Meat Product Name MBT Ct
Value
Mean
Ct
Value
RSD(
%)
Recov
(%)
Syst
error
(%)
MBT
DNA
(ng/µL)
MBT Ct
Value
Mean
Ct
Value
RSD
(%)
Recov
(%)
Syst
error
(%)
MBT
DNA
(ng/µL)
MBT Ct
Value
Mean
Ct
Value
RSD
(%)
Recov
(%)
Syst
error
(%)
MBT
DNA
(ng/µL)
MBT Ct
Value
Mean
Ct
Value
RSD
(%)
Recov
(%)
Syst
error
(%)
MBT
DNA
(ng/µL)
MBT Ct
Value
Mean
Ct
Value
RSD
(%)
Recov
(%)
Syst
error
(%)
MBT
DNA
(ng/µL)
Binary(MBT-Beef) 18.56 19.58 4.43 101.3 1.32 5.56 23.11 22.08 4.17 112.4 12.4 1.05 27.34 26.83 2.65 132.5 32.5 0.044 29.45 29.39 2.32 148.7 48.7 0.008 30.24 30.74 3.92 158.1 58.1 0.003
21.00 22.54 26.58 30.25 29.76
20.00 20.54 25.78 28.56 32.67
19.45 22.65 26.58 28.67 29.46
18.87 21.56 27.85 30.00 31.56
Binary(MBT-Chicken) 18.34 19.93 4.85 99.34 -0.7 6.40 24.35 22.24 4.88 110.2 10.2 1.38 28.56 27.2 4.04 136 36.00 0.051 27.78 29.9 6.11 151.4 51.4 0.009 29.57 31.33 6.51 161.2 61.2 0.003
20.14 22.16 27.00 30.00 34.65
21.34 21.75 26.34 29.54 32.76
20.15 21.46 25.75 28.95 29.56
19.68 21.48 28.34 33.24 30.11
Binary admixture(10-0.001)(w/w)%
Spike level: 10% Spike level: 1.0% Spike level: 0.1% Spike level: 0.01% Spike level: 0.001%

13
8
y = -3.47x + 22.19
R² = 0.9
0
10
20
30
40
-4 -3 -2 -1 0 1 2
Mea
n C
t va
lue
Log DNA concentration [ng/µL]
(1) Calibration curve for chicken meatball
y = -3.36x + 22.16
R² = 0.9
0
10
20
30
40
-4 -3 -2 -1 0 1 2
Mea
n C
t va
lue
Log DNA concentration [ng/µL]
(2) Calibration curve for chicken burger
y = -3.48x + 22.22
R² = 0.9
0
10
20
30
40
-4 -3 -2 -1 0 1 2
Mea
n C
t va
lue
Log DNA concentration [ng/µL]
(3) Calibration curve for chicken
frankfurter
y = -3.40x + 21.90
R² = 0.9
0
10
20
30
40
-4 -3 -2 -1 0 1 2
Mea
n C
t va
lue
Log DNA concentration [ng/µL]
(4) Calibration curve for beef meatbally = -3.52x + 22.12
R² = 0.9
0
10
20
30
40
-4 -3 -2 -1 0 1 2
Mea
n C
t va
lue
Log DNA concentration [ng/µL]
(6) Calibration curve for beef frankfurter
y = -3.38x + 22.14
R² = 0.9
0
10
20
30
40
-4 -3 -2 -1 0 1 2
Mea
n C
t va
lue
Log DNA concentration [ng/µL]
(5) Calibration curve for beef burger
(a)
Figure 4.18: Standard (a) and melting (b-g) curves for chicken (b, c, d) and beef (e, f, g) meat products. In the standard curve
(a) shown are the recovery of MBT DNA from chicken (1-3) and beef (4-6) meatball (1, 4), burger (2, 5) and frankfurter (3, 6)
products containing 10, 1, 0.1, 0.01 and 0.001% (w/w) MBT tissues, respectively. (b)-(g) are the melting curves for (1)-(6).

13
9
Figure 4.18, continued

14
0
Table 4.10: Repeatability and recovery of MBT targets in reference meat products using Yeastern genomic DNA extraction kit
Note: RSD (Relative standard deviation), Recov (Recovery), Syst (System)
Meat Product Name MBT Ct
Value
Mean
Ct
Value
RSD(
%)
Recov
(%)
Syst
error
(%)
MBT
DNA
(ng/µL)
MBT Ct
Value
Mean
Ct
Value
RSD
(%)
Recov
(%)
Syst
error
(%)
MBT
DNA
(ng/µL)
MBT Ct
Value
Mean
Ct
Value
RSD
(%)
Recov
(%)
Syst
error
(%)
MBT
DNA
(ng/µL)
MBT Ct
Value
Mean
Ct
Value
RSD
(%)
Recov
(%)
Syst
error
(%)
MBT
DNA
(ng/µL)
MBT Ct
Value
Mean
Ct
Value
RSD
(%)
Recov
(%)
Syst
error
(%)
MBT
DNA
(ng/µL)
Chicken meatball 20.20 20.23 2.50 102.49 2.49 3.670 22.54 22.32 3.15 114.44 14.44 0.9200 24.76 25.18 2.67 127.13 27.13 0.1370 30.20 29.08 3.21 143.11 43.11 0.0100 29.54 30.90 3.89 157.69 57.69 0.0030
20.13 22.14 24.11 28.56 30.10
21.12 21.14 25.67 27.81 32.00
19.56 23.30 26.00 30.12 32.65
20.12 22.50 25.34 28.70 30.21
Chicken burger 19.30 19.67 4.83 98.19 -1.81 5.500 22.10 23.71 4.82 120.58 20.58 0.3450 28.00 27.45 2.66 136.75 36.75 0.0260 28.07 29.06 2.97 143.37 43.37 0.0088 34.22 33.32 2.32 161.31 61.31 0.0005
20.03 24.43 26.32 29.76 32.15
18.67 25.12 27.02 28.14 34.14
19.00 22.65 27.52 30.25 33.00
21.34 24.26 28.40 29.10 33.11
Chicken frankfurter 21.32 21.32 3.62 104.99 4.99 1.811 24.31 24.31 3.15 124.97 24.97 0.2510 28.32 28.32 4.49 136.47 36.47 0.0188 30.12 30.12 3.60 150.27 50.27 0.0053 30.76 31.62 3.82 159.46 59.46 0.0019
20.00 23.00 28.78 31.36 29.67
22.15 25.14 26.64 28.36 32.65
21.11 24.10 30.40 31.12 32.76
22.03 25.00 27.46 29.64 32.26
Yeastern Genomic DNA Mini Kit
Spike level: 10% Spike level: 1.0% Spike level: 0.1% Spike level: 0.01% Spike level: 0.001%

14
1
Table 4.10, continued
Note: RSD (Relative standard deviation), Recov (Recovery), Syst (System)
Meat Product Name MBT Ct
Value
Mean
Ct
Value
RSD(
%)
Recov
(%)
Syst
error
(%)
MBT
DNA
(ng/µL)
MBT Ct
Value
Mean
Ct
Value
RSD
(%)
Recov
(%)
Syst
error
(%)
MBT
DNA
(ng/µL)
MBT Ct
Value
Mean
Ct
Value
RSD
(%)
Recov
(%)
Syst
error
(%)
MBT
DNA
(ng/µL)
MBT Ct
Value
Mean
Ct
Value
RSD
(%)
Recov
(%)
Syst
error
(%)
MBT
DNA
(ng/µL)
MBT Ct
Value
Mean
Ct
Value
RSD
(%)
Recov
(%)
Syst
error
(%)
MBT
DNA
(ng/µL)
Beef meatball 19.86 20.12 1.53 99.63 -0.37 3.347 25.03 24.80 0.81 120.87 20.87 0.1400 28.21 28.34 2.49 131.43 31.43 0.0100 31.26 30.11 4.99 144.78 44.78 0.0038 32.54 31.76 3.25 159.57 59.57 0.0013
19.75 24.67 28.34 27.80 29.83
20.10 24.76 27.83 32.10 31.56
20.62 24.52 29.67 30.11 32.60
20.25 25.03 27.67 29.30 32.27
Beef burger 22.00 21.34 3.12 102.64 2.64 1.721 23.04 23.07 2.63 111.19 11.19 0.5300 28.04 28.00 2.18 134.67 34.67 0.0184 30.67 30.67 1.71 150.64 50.64 0.0029 32.46 32.46 2.23 162.68 62.68 0.0080
21.23 23.01 28.36 29.87 33.00
20.30 23.00 26.84 31.24 33.25
21.07 24.11 28.61 30.36 32.45
22.12 22.20 28.15 31.23 31.15
Beef frankfurter 22.34 21.81 4.93 109.29 9.29 1.233 25.02 24.14 2.09 113.92 13.92 0.2640 29.12 28.56 3.68 139.37 39.37 0.0188 31.56 31.56 5.06 158.81 58.81 0.0021 33.45 33.23 1.79 166.57 66.57 0.0007
21.00 24.17 28.00 32.34 34.16
23.70 23.45 27.00 30.25 33.00
21.00 24.06 28.56 29.56 33.20
21.03 24.00 30.13 34.10 32.34
Yeastern Genomic DNA Mini Kit
Spike level: 10% Spike level: 1.0% Spike level: 0.1% Spike level: 0.01% Spike level: 0.001%

14
2
Table 4.11: Repeatability and recovery of MBT targets in reference meat products using NucleoSpin® extraction kit
Note: RSD (Relative standard deviation), Recov (Recovery), Syst (System)
Meat Product Name MBT Ct
Value
Mean
Ct
Value
RSD(
%)
Recov
(%)
Syst
error
(%)
MBT
DNA
(ng/µL)
MBT Ct
Value
Mean
Ct
Value
RSD
(%)
Recov
(%)
Syst
error
(%)
MBT
DNA
(ng/µL)
MBT Ct
Value
Mean
Ct
Value
RSD
(%)
Recov
(%)
Syst
error
(%)
MBT
DNA
(ng/µL)
MBT Ct
Value
Mean
Ct
Value
RSD
(%)
Recov
(%)
Syst
error
(%)
MBT
DNA
(ng/µL)
MBT Ct
Value
Mean
Ct
Value
RSD
(%)
Recov
(%)
Syst
error
(%)
MBT
DNA
(ng/µL)
Chicken meatball 20.15 20.64 4.63 101.79 1.79 2.800 22.10 22.65 4.75 116.09 16.09 0.7370 25.13 25.25 3.48 128.69 28.69 0.1310 29.45 29.03 2.07 145.16 45.16 0.0106 32.00 31.28 3.28 158.95 58.95 0.0024
21.00 21.45 26.65 28.56 30.00
20.18 23.00 24.35 28.45 31.56
22.32 24.56 25.76 30.00 32.65
19.56 22.12 24.35 28.67 30.21
Chicken burger 20.34 19.79 3.91 99.77 -0.23 5.073 23.17 24.14 3.87 121.83 21.83 0.2570 28.34 27.27 2.82 135.99 36.00 0.0302 28.07 28.62 3.33 144.36 44.36 0.0119 34.00 33.18 2.69 162.50 62.50 0.0005
20.67 25.67 27.56 27.56 31.65
18.73 24.35 27.67 28.14 34.14
19.00 24.35 26.45 30.25 33.00
20.21 23.14 26.32 29.10 33.11
Chicken frankfurter 21.23 20.35 4.20 106.97 6.97 3.440 24.43 24.11 3.59 123.96 32.96 0.2860 28.34 28.36 1.89 137.29 37.29 0.0172 30.45 30.37 3.32 150.82 50.82 0.0045 31.23 32.03 2.09 161.15 61.15 0.0015
21.32 24.32 27.87 32.14 31.23
19.00 25.00 28.43 29.11 32.65
20.10 24.36 29.31 30.35 32.76
20.12 22.45 27.83 29.78 32.26
NucleoSpin(R) DNA Extraction Kit
Spike level: 10% Spike level: 1.0% Spike level: 0.1% Spike level: 0.01% Spike level: 0.001%
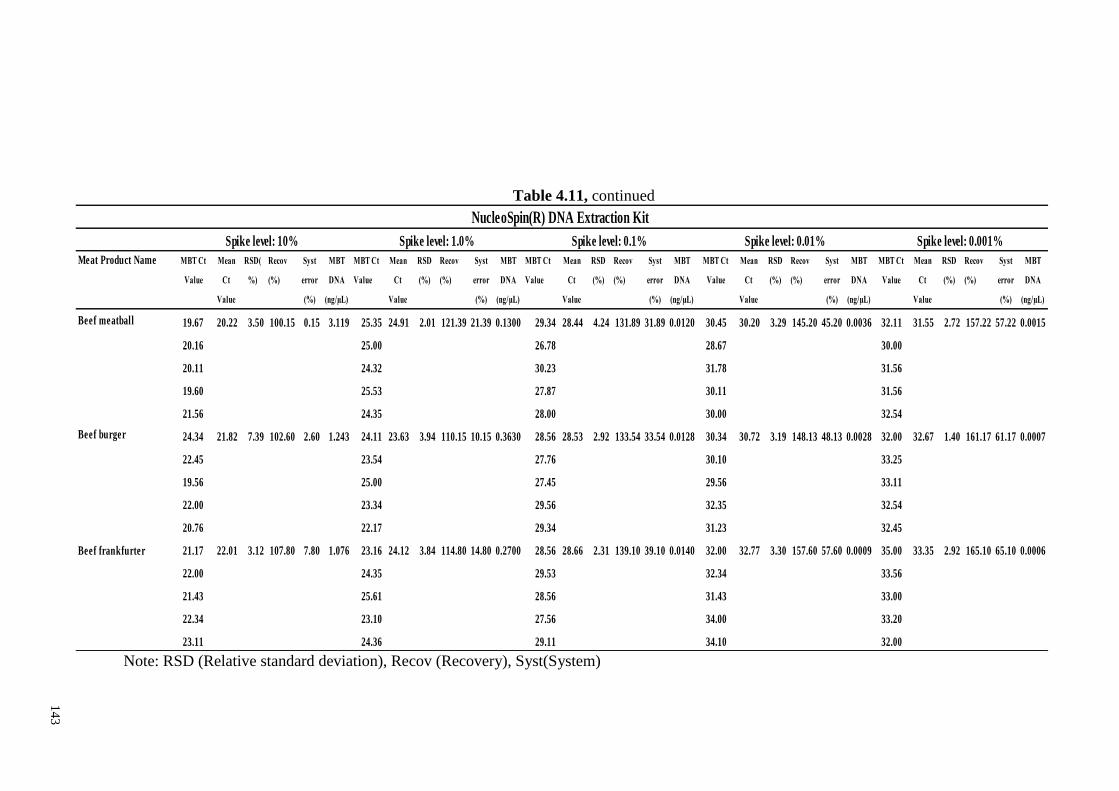
14
3
Table 4.11, continued
Note: RSD (Relative standard deviation), Recov (Recovery), Syst(System)
Meat Product Name MBT Ct
Value
Mean
Ct
Value
RSD(
%)
Recov
(%)
Syst
error
(%)
MBT
DNA
(ng/µL)
MBT Ct
Value
Mean
Ct
Value
RSD
(%)
Recov
(%)
Syst
error
(%)
MBT
DNA
(ng/µL)
MBT Ct
Value
Mean
Ct
Value
RSD
(%)
Recov
(%)
Syst
error
(%)
MBT
DNA
(ng/µL)
MBT Ct
Value
Mean
Ct
Value
RSD
(%)
Recov
(%)
Syst
error
(%)
MBT
DNA
(ng/µL)
MBT Ct
Value
Mean
Ct
Value
RSD
(%)
Recov
(%)
Syst
error
(%)
MBT
DNA
(ng/µL)
Beef meatball 19.67 20.22 3.50 100.15 0.15 3.119 25.35 24.91 2.01 121.39 21.39 0.1300 29.34 28.44 4.24 131.89 31.89 0.0120 30.45 30.20 3.29 145.20 45.20 0.0036 32.11 31.55 2.72 157.22 57.22 0.0015
20.16 25.00 26.78 28.67 30.00
20.11 24.32 30.23 31.78 31.56
19.60 25.53 27.87 30.11 31.56
21.56 24.35 28.00 30.00 32.54
Beef burger 24.34 21.82 7.39 102.60 2.60 1.243 24.11 23.63 3.94 110.15 10.15 0.3630 28.56 28.53 2.92 133.54 33.54 0.0128 30.34 30.72 3.19 148.13 48.13 0.0028 32.00 32.67 1.40 161.17 61.17 0.0007
22.45 23.54 27.76 30.10 33.25
19.56 25.00 27.45 29.56 33.11
22.00 23.34 29.56 32.35 32.54
20.76 22.17 29.34 31.23 32.45
Beef frankfurter 21.17 22.01 3.12 107.80 7.80 1.076 23.16 24.12 3.84 114.80 14.80 0.2700 28.56 28.66 2.31 139.10 39.10 0.0140 32.00 32.77 3.30 157.60 57.60 0.0009 35.00 33.35 2.92 165.10 65.10 0.0006
22.00 24.35 29.53 32.34 33.56
21.43 25.61 28.56 31.43 33.00
22.34 23.10 27.56 34.00 33.20
23.11 24.36 29.11 34.10 32.00
NucleoSpin(R) DNA Extraction Kit
Spike level: 10% Spike level: 1.0% Spike level: 0.1% Spike level: 0.01% Spike level: 0.001%

144
Samples Efficiency(%) LOD (%) LOQ (ng/µL) Mean LOQ (ng/µL)
Binary (MBT-Chicken) 94.08 0.001 0.0031 0.003
Binary (MBT-Beef) 94.50 0.001 0.003
Chicken Meatball 94.08 0.001 0.003 0.0021
Beef Meatball 96.78 0.001 0.0013
Chicken Burger 98.15 0.001 0.0005 0.0042
Beef Burger 97.60 0.001 0.008
Chicken Frankfurters 93.77 0.001 0.0019 0.0013
Beef Frankfurters 92.23 0.001 0.0007
Table 4.12: PCR efficiency and limit of detection (LOD) and quantification (LOQ)
of MBT specific SYBR Green PCR for the admixed and reference meat products of
chicken and beef origins

14
5
Table 4.13: Average recovery value of the real time PCR using 150 reference meat products samples
RSD (Relative standard deviation)
Product name Spike level 10% Spike level 1% Spike level 0.1% Spike level 0.01% Spike level 0.001%
Recovery (% ) Mean(% ) RSD(% ) Recovery(% ) Mean(% ) RSD(% ) Recovery(% ) Mean(% ) RSD(% ) Recovery(% )Mean(% ) RSD(% ) Recovery(% ) Mean(% ) RSD(% )
Chicken meatball 102.49 102.87 3.51 114.44 117.66 4.08 127.13 134.30 2.98 143.11 148.50 3.72 157.69 161.21 1.77
Chicken burger 98.19 120.58 136.75 143.37 161.31
Chicken frankfurter 104.99 124.97 136.47 150.27 159.46
Beef meatball 99.63 120.87 131.43 144.78 159.57
Beef burger 102.64 111.19 134.67 150.64 162.68
Beef frankfurter 109.29 113.92 139.37 158.81 166.57
Product name Spike level 10% Spike level 1% Spike level0.1% Spike level 0.01% Spike level0.001%
Recovery (% ) Mean RSD(% ) Recovery(% ) Mean RSD(% ) Recovery(% ) Mean RSD(% ) Mean RSD(% ) Recovery(% ) Mean RSD(% )
Chicken meatball 101.79 103.18 3.03 116.09 118.04 4.05 128.69 134.42 2.59 145.16 148.54 3.10 158.95 161.01 3.77
Chicken burger 99.77 121.83 135.99 144.36 162.50
Chicken frankfurter 106.97 123.96 137.29 150.82 161.15
Beef meatball 100.15 121.39 131.89 145.20 157.22
Beef burger 102.60 110.15 133.54 148.13 161.17
Beef frankfurter 107.80 114.80 139.10 157.60 165.10
Yeastern Genomic DNA Mini Kit
NucleoSpin(R) DNA Extraction Kit

146
4.14 Meat Product Analysis
In order to validate the real-time technique for screening meat adulteration in food
products, deliberately adulterated reference meat products (chicken and beef meatballs,
frankfurters and burgers) were prepared (Ali et al., 2012; Razzak et al., 2015) having 10,
1, 0.1, 0.01 and 0.001% (Table 4.6) contribution from ground MBT meat. All meat
products were autoclaved at 120 °C under 45 psi pressure for 2.5 h on three different days
to address the stability issues when denaturated (Tables 4.8-4.10; Figures 4.18 (b)–(g))
since this thermal treatment was previously used in food forensic investigations to
benchmark target biomarker stability (Arslan et al., 2006; Haunshi et al., 2009; Ilhak &
Arslan, 2007). The Ct and Tm values were in the range of 19.67 ± 0.42 to 33.32 ± 0.32
(Tables 4.9) and 74.63–74.65 ± 0.22°C for MBT and 81.40-81.76 ± 0.30 °C for internal
Figure 4.19: Relationship between the reference and recovery value (%). Relationship
between the reference and recovery value (%). The MBT tissues were determined by
SYBR Green duplex PCR from various meat products (meatballs, burgers, frankfurters
from chicken beef, respectively) and plotted against the reference values.
(1) y = 1.02x + 0.03
R² = 0.99
(2) y = 0.97x + 0.06
R² = 0.99
(3) y = 1.04x + 0.05
R² = 0.99
(4) y = 0.99x + 0.05
R² = 0.99
(5) y = 1.02x + 0.02
R² = 0.99
(6) y = 1.09x + 0.01
R² = 1
0
2
4
6
8
10
12
0 2 4 6 8 10 12
Rec
over
y v
alu
e(w
/w)%
Referecne value(w/w)%
(1) Chicken meatball
(2)Chicken burger
(3) Chichen frankfurter
(4) Beef meatball
(5) Beef burger
(6) Beef frankfurter

147
control (Figures 4.18 (b)–(g)), respectively, for all the reference meat products,
demonstrating that the fluctuations in assay outcomes were insignificant in response to
changes in the extraction kit or other variables. Furthermore, 33.32 ± 0.32 Ct for 0.001%
MBT in meatball, burger and frankfurter products showed that this novel technique could
be used to trace MBT meat in the food chain to detect even less than 0.001% (w/w)
adulteration. Finally, a total of 189 samples including eight Halal branded meatballs (A–
H), seven burgers (I–O) and six frankfurters (P–U) from each of chicken and beef origins
were screened with the duplex SYBR Green real time PCR assay (Table 4.6), but none of
the commercial meat products yielded a positive amplification signal for MBT, reflecting
the respect for Halal products in Malaysia. On the other hand, the Ct and Tm values for
the eukaryotic controls were 19.20 ± 0.32 to 23.42 ± 0.25 and 81.40 ± 0.31 to 81.50 ±
0.28 °C, demonstrating the presence of amplifiable DNA in all specimens (Fajardo et al.,
2008). Thus, the experimental as well as the theoretical specificity, stability and
sensitivity of this novel assay show it as a reliable and rapid technique for the
authentication of MBT materials in the food chain. Malaysia has shown a strong
commitment towards the development of Halal hub industries and as a competitive
partner in the global Halal food business. Therefore, the absence of MBT materials in the
Malaysian Halal food chain was not a surprise (Ali et al., 2012).
4.15 Quantitative Screening of Traditional Chinese Medicines
The widespread trade in various TCMs, which are claimed to provide multi-cure
and natural remedies to common ailments, has become a disastrous threat to the existence
of several wild species, including MBT. Although most of them are claimed to be plant
products, several highly endangered species, such as rhinos, crocodiles, turtles, tigers and
elephants, which are enlisted in the CITES Appendix I and II, have continued to be killed
to supply the raw materials of these medicines which have a huge market in Southeast
Asia and Chinese communities around the world (Lee et al., 2014). In many cases,

148
enforcement of regulation becomes impossible because the endangered animals are sold
in forms, such as powder and jellies made from ground bones, shells and skins, which are
difficult to detect by customs officials (Alves & Rosa, 2005; Lee et al., 2014). Herbal
jelly powder is a jelly-like Chinese medicine traditionally sold and consumed as
‘guilinggao’ or ‘turtle jelly’ or ‘Chinese medicine dessert’ among the vast Chinese
communities around the world. It is popular natural desert with Wuzhou origins and its
typically made with secrete recipes that have been passed from generation to generation.
According to the Chinese medicines, herbal jelly is thought to be good for the skin,
promoting a healthier complexion upon repeated consumption and it able to clean toxins
from the body. Other positive effects include the improvement in circulation, muscle
growth, kidney and liver functions, relief of itching and dermatitis (Chen et al., 2009b;
Dharmananda, 2005). Herbal jelly is made from powdered plastron, which is the bottom
shell of the turtle Cuora trifasciata, which is commonly known as ‘three-lined box turtle’
or ‘golden coin turtle’, along with a variety of herbal products such as China roots, Smilax
glabra, known to contain natural remedies for many diseases (CARR, 1991; Chen et al.,
2009b; Dharmananda, 2005). Despite commercial farming across China, the golden coin
turtle is extremely expensive (Haitao, et al., 2008), encouraging the use of more
commonly available turtle species in guilinggao or herbal jelly powder (Chen et al.,
2009b; da Nóbrega et al., 2008; Dharmananda, 2005). Considering this, we attempted to
screen MBT materials in 120 traditional Chinese jelly powder of eight different brands
sold in various Chinese medicines shops across Malaysia (Table 4.14). About 23.33 % of
the 120 tested products were found to be MBT-positive, reflecting the widespread
consumption and uses of MBT materials in these medicines, but the information was not
included in the product labels (Table 4.14). The MBT presence was reflected through the
Ct values and melting curves at 26.37 ± 0.32 to 31.67 ± 0.42 (Table 4.14) and 74.63 to
74.71.65 ± 0.22 °C, respectively. Due to the unavailability of the medicinal formulas or

149
documents containing sufficient information, dummy medicinal products could not be
made in the laboratory for medicinal product screening validation. However, the amount
of the contaminating MBT target (0.00157 to 0.0612 ng/ µL corresponding to 26.37 ±
0.32 to 31.67 ± 0.42 Ct values) in the tested samples was calculated by plotting the Ct
values in the pure DNA standard curve (pure MBT DNA) and using equations (1) to (3)
and was found in the range of 25.33 ± 0.50% to 38.23 ± 0.34% (Table 4.14), when only
the total DNA of the source materials was considered and other materials like
polysaccharides and non-DNA biomaterials were not measured (Table 4.14).
Since herbal products are regarded as low risk and natural sources for the cure for
many diseases, traditional medicines are not under stringent regulation. In this regard, the
herbal products studied here clearly reflect that such declarations are not correct at all
times; the grave concern is that MBT ingredients were not declared in the labels and that
most of these preparations were claimed to be plant products and hence there are no
religious obligations since plant products are permitted in all religions. Recently, an
Australian study found that high rates of adulteration (92%), substitution and mislabeling
are widespread in herbal TCMs; the undeclared ingredients were either illegal or
potentially hazardous to consumers (Alves et al., 2013; Coghlan et al., 2015; Ernst &
Coon, 2001). Thus the 23.33% herbal jelly powder samples tested in our laboratory
provided a 100% matching of DNA materials with Cuora amboinensis species, reflecting
a clear breach of wildlife conservation law in the preparation and selling of traditional
Chinese herbal products (Adeola, 1992; Alves & Rosa, 2005; Angeletti et al., 1992). This
is also contrary to the regulation of the United States (USFDA), UK (MHRA) and
Australia (TGA) (Bennett et al., 2002; Robinson & Bennett, 2000, 2002), which demand
the mandatory declaration of product ingredients. Published reports show that wild and
domestic animals and their by-products, such as hooves, skins, bones, feathers and tusks,
are used in the preparation of curative, protective and preventive medicines (Anyinam,

150
1995), causing over-hunting and massive threats to wildlife (Bennett et al., 2002).
Moreover, some organs and animal by-products, such as bones and bile, can be a source
of Salmonella infection that causes chronic diarrhoea and endotoxic shock. In this
context, the possibility of transmitting infections or ailments from animal preparations
should be seriously considered (Still, 2003).

15
1
Table 4.14: Analysis of traditional Chinese herbal jelly powder using MBT specific PCR assay
Code of
medicinal
items
Information of the
products labeling
Product applications Number
of
samples
Number
of
detection
samples
Contamination
(%) of Malayan
box turtle
Mean Ct value &
Concentration[ng/µL]
A Chinese herbal jelly
powder
Nocturnal enuresis, Anti-
inflammation, Dessert soup, Muscle
growth, Relieving itching, Reducing
acne and kidney restoration, Blood
circulation, Appetizer
15 3/15 25.33-28.37 26.37 & 0.0612;
27.12 & 0.037;
28.14 & 0.018
B Chinese herbal jelly
powder
Nocturnal enuresis, Anti-
inflammation, Dessert soup, Muscle
growth, Relieving itching, Reducing
acne and kidney restoration, Blood
circulation, Appetizer
15 4/15 25.48-27.70 27.54 & 0.0272;
29.15 & 0.009;
30.00 & 0.005;
31.67 & 0.00157
C Herbal jelly powder Nocturnal enuresis, Muscle growth,
Relieving itching, Reducing acne and
kidney restoration, Blood circulation,
Anti-inflammation, Appetizer
15 4/15 35.50-37.20 27.46 & 0.028;
29.31 & 0.008;
29.75 & 0.006;
31.17 & 0.0022
D Herbal jelly powder Nocturnal enuresis, Anti-
inflammation, Dessert soup, Muscle
growth, Relieving itching, Reducing
acne and kidney restoration, Blood
circulation, Anti-inflammation,
Appetizer
15 5/15 36.32-38.23 26.38 & 0.0613;
28.45 & 0.0145;
28.67 & 0.0125;
28.74 & 0.012;
29.24 & 0.0084

15
2
Code of
medicinal
items
Information of the
products labeling
Product applications Number
of
samples
Number
of
detection
samples
Contamination
(%) of Malayan
box turtle
Mean Ct value &
Concentration[ng/µL]
E Guilinggao powder
(Chinese herbal jelly
powder)
Pimples, Blood Circulation, Male
fertility, Strength of knees,
Nocturnal enuresis, Anti-
inflammation, Dessert soup, Muscle
growth, Relieving itching, Reducing
acne and kidney restoration, Blood
circulation, Appetizer
15 3/15 30.45-36.72 28.14 & 0.0180;
28.76 & 0.0117;
30.15 & 0.0044
F Chinese herbal jelly
powder (guilinggao)
Gall bladder, Hepatitis, Herpes,
Shingles, Hyperthyroidism,
Migraines and Jaundice, Nocturnal
enuresis, Anti-inflammation, Dessert
soup, Muscle growth, Relieving
itching, Reducing acne and kidney
restoration, Blood circulation,
Appetizer
15 6/15 35.56-37.60 26.37 & 0.0612;
27.46 & 0.028;
29.31 & 0.008;
30.00 & 0.005;
30.56 & 0.0033;
31.43 & 0.0037
G Guilinggao
powder(herbal jelly
powder)
Nocturnal enuresis, Anti-
inflammation, Dessert soup, Muscle
growth, Relieving itching, Reducing
acne and kidney restoration, Blood
circulation, Appetizer
15 3/15 31.23-33.56 27.54& 0.0272;
29.75 & 0.006;
30.67 & 0.0031
H Chinese herbal jelly
powder
Nocturnal enuresis, Anti-
inflammation, Dessert soup, Muscle
growth, Relieving itching, Reducing
acne and kidney restoration, Blood
circulation, Appetizer
15 0/15 0.00 0.00-0.00

153
CHAPTER 5: CONCLUSION AND RECOMMENDATION FOR FUTURE
WORK
5.1 Conclusion
The Malayan box turtle (Cuora amboinensis) is one of 18 native freshwater turtle
and tortoise species in Malaysia. The highest rate of exploitation of this species has been
reported in East Asian countries for use in sex stimulants and invigorating traditional
Chinese medicines, resulting in a significant decline of its population and putting it at risk
of extinction. Moreover, its slow reproductive cycle due to late maturity as well as the
production of few eggs has placed this species on the verge of disappearance, causing
enormous potential harm to biodiversity. Therefore, it is feared that continuous, high-
volume exploitation combined with its vulnerable life history characteristics might lead
to a serious population decline, making the MBT extinct, at least locally. Since, 2005, the
Malaysian government banned the hunting of this species for sale in domestic or
international markets, but it clandestine trade under the labels of permissible meat is
greatly suspected. Thus, there is a need for a reliable tracing method for MBT
identification and quantification before this vulnerable species disappears from its natural
habitats.
Stability, sensitivity, robustness and precision under various food-processing
conditions are the benchmarks of an assay to be acceptable for authentication studies.
Moreover, short-length PCR targets perform better over longer ones. Consequently, two
different PCR targets (120 bp, which was developed in this study, and 165 bp, which was
shortest in length among the published reports) were subjected to extensive boiling (100
°C for 60, 90, 120 and 150 min), harsh autoclaving (120 °C for 60, 90, 120 and 150 min
at 45 psi) and microwaving treatments (600, 650 and 700 W for 30 min). It was found
that the 120 bp target survived and, hence, was amplified under all treatment conditions.
But the 165 bp target failed to withstand boiling at 100 °C for 150 min, autoclaving at

154
120 °C for 150 min, and microwaving stress at 700 W for 30 min. Furthermore, the
sensitivity of the newly developed target (120 bp) (0.0001 ng at pure state and 0.01% at
complex background) was higher than that of the published target (165 bp) (0.001 ng at
pure). This superior target stability and sensitivity under extreme treatments of boiling,
autoclaving and microwave cooking suggests that this newly developed assay would be
suitable for any forensic identification of Malayan box turtle species, even in severely
degraded specimen and better than those of previously reported assays. The assay
performed outstanding specificity when cross-challenged against 20 commercially
important species. Additionally, theoretical analysis reflected very close matching with
the nine critically endangered Cuora species, but there was a huge genetic distance from
the other reptile species such as tortoise and turtles that belong to non-Cuora genera,
crocodiles, snakes and lizards. Thus the designed assay has the potential to be used as a
universal probe for the detection of vulnerable Cuora genus.
The originality of the PCR products was confirmed firstly, by sequencing and
secondly by RFLP analysis. For sequencing, PCR products were cloned in a plasmid
vector (PJTI1.2) and using the TOPOTM TA Cloning Kit (Invitrogen, Carlsbad,
CA, USA). DH5α-T1 Escherichia coli (Invitrogen) were used and incubated at 37 °C on
agar plate containing X-Gal (5-bromo-4-chloro-3-indolyl-β-D-galactopyranoside) for
transformation and multiplication. Forty colonies were selected from each agar plate, and
plasmid DNA were purified using the QIAprep Spin Miniprep Kit (Qiagen Gmbh, Hilden,
Germany). Cloned DNAs were analyzed by sequencing with universal LpJET1.2 forward
and reverse primers using an ABI Prism 3100 genetic analyzer (Applied Biosystems,
Perkin-Elmer/Cetus, Norwalk, Connecticut, USA). Chromatogram sequencing files were
inspected with Chromas 2.2 (Technelysium) (http://technelysium.com.au/wp/), and
similarity analysis of the obtained DNA sequence was carried out using ClustalW
software and online based BLAST software in NCBI.

155
The study of PCR-RFLP assay for the detection of MBT under complex food
matrices increased the confirmation and validity in assay authentication with eliminating
the ambiguities. Furthermore, the use of an endogenous control (141 bp) effectively
eliminated the chances of a false negative detection, and the false positive identification
was similarly avoided through the use of a negative control. Additionally, the lower limit
of detection (0.01% MBT meat and 0.0001 ng DNA) has made the assay suitable for the
detection of marginal levels of adulteration in popular food products such as meatballs,
burgers and frankfurters.
Furthermore, the study emulated the real forms of adulteration practices by
making binary and ternary admixtures with various percentages of the target meat in a
wide range of food products. Commercially available meat products and Chinese
traditional medicine were screened to optimize and establish the validity of the assay for
the analysis of marketed food, and medicine and the distinctive Bfa1-restriction profiles
further authenticated the origin of the amplified products.
One of the biggest challenges was the extraction of DNA from the Chinese Herbal
Jelly powder. Herbal jelly powder is made with multiple herbal components with turtle
plastron and shell materials. There was no optimized method for the extracting DNA from
the herbal jelly powder. For the first time, this study has optimized and validated DNA
extraction protocol by extracting DNA from 120 herbal jelly powder.
Nevertheless, the duplex SYBR Green real-time PCR system for the detection and
quantification of Malayan box turtle (MBT) materials in food chain is a significant
contribution to forensic science and conservation biology. Distinctive Ct values and
melting curves for MBT (120bp) and eukaryotic control (141bp) even at lower
concentrations (0.00001 ng pure DNA or 0.001% (w/w) MBT meat) have made it
trustworthy for the unambiguous tracing of MBT materials in food chain or any forensic

156
or archaeological investigations. Furthermore, a high correlation coefficient (R2=0.999)
between the recovered and reference values for 10-0.001% MBT adulteration was a
strong piece of evidence that this automated real-time PCR assay has sufficient merit to
be used for the confirmed MBT detection in any forensic studies.
To validate the assay, 273 commercial traditional medicines and 183 commercial
food samples were analysed and 66% of the 273 TCM tested samples were found to be
MBT positive but no commercial food were contaminated, although positive results were
found in lab made reference meat products. The proven success of the assay to identify
authentic MBT target DNA from various food matrices and traditional Chinese medicine
strongly suggested that the assay could be used by the regulatory bodies, archaeologists
and wildlife protection agencies to prevent or reduce the illegal trades of MBT materials
in all possible routes and safeguard this endangered species in natural habitats, preserving
the biodiversity and ecological balances.
5.2 Recommendations for Future Work
The developed food and TCM authentication assay described in this study is a
promising tool to detect and quantify specific DNA targets from contaminated and highly
degraded samples. Detection of specific DNA targets is very useful technique to
distinguish permissible and non-permissible animal materials in food and medicinal
products and to safe guard human health, religious views and to secure fare trade as well
as to prevent the illegal wildlife trade. Although the designed primers were speculated to
be a universal marker for all 12 Cuora species, we could not cross-challenged the primers
against the DNA of all Cuora species because of the unavailability of the samples from
all species. This was due to geographical distance and sample unavailability in one
country, regional embargo and legal and regulatory issues for the transportation of
samples from other countries. So it would be ideal if samples could be collected from all

157
Cuora species and a confirmatory test performed to prove universality of the developed
primers. The developed method was applied and successfully detected MBT in food and
traditional Chinese medicine specimens; the reliability of the assay could be further
enhanced if it could be tested for cosmetics and other health care products.
Human food and medicinal products are composed of multiple species. So the
development of multiple species’ targets and detecting them in a multiplex PCR platform
might ensure better customer satisfaction since it could identify whether other elements
are present or not. So future work can explore the application of multiple species’ targets
which can detect and quantify different species’ DNA from complex pools of food
matrices. A multiplex PCR assay platform can be designed by incorporating specific
primer pairs from different potential Haram (not allowed) meat species such as pork, cat,
rat, horse etc. in a single assay run. Such an assay technique definitely could save time
and deliver more information to the consumers. Additionally, target biomarker could be
integrated with the new technology such as Single Molecule Detection Technique for the
determination of single DNA molecules of the target species in forensic samples analysis
(https://www.thebalance.com/what-s-required-for-superior-pcr-results-375480).

158
REFERENCES
Act.(2006). Land Conservation 1960. The commission of law revision, Malaysia under
the authority of the revision of laws act 1968 in collaboration with percetakan
nasional Malaysia BHD. Laws of Malaysia [Downloaded on 2017 Jan 21].
Available from: http://www.kptg.gov.my/sites/default/files/article/Act%20385-
land%20conserve .pdf
Act, Food. (1983). Laws of Malaysia: Food Act and Regulations: Kuala Lumpur: MDC
Publishers Printers. [Downloaded on 2017 August 21]. Available from:
http://www.hdcglobal.com/upload-web/cms-editor-files/HDC-26/file/Act%
20281 % 20-%20Food%20Act%201983.pdf
Abd-Elsalam, Kamel A. (2003). Bioinformatic tools and guideline for PCR primer design.
african Journal of biotechnology, 2(5), 91-95.
Adams, D. S. (2013). Lab math: a handbook of measurements, calculations, and other
quantitative skills for use at the bench: Cold Spring Harbor Laboratory Press.
Addis, M, F., Cappuccinelli, R., Tedde, V., Pagnozzi, D., Porcu, M.C., Bonaglini, E.,
Uzzau, S. (2010). Proteomic analysis of muscle tissue from gilthead sea bream
(Sparus aurata, L.) farmed in offshore floating cages. Aquaculture, 309(1), 245-
252.
Adeola, M. O. (1992). Importance of wild animals and their parts in the culture, religious
festivals, and traditional medicine, of Nigeria. Environmental Conservation,
19(02), 125-134.
AFP. (2011). Malaysia Seizes 450 protected snakes, turtles. Muscatdaily.com;
[Downloaded on 2016 Jul 21] Available from: http://www.muscatdaily
com/Archive/World/Malaysia-seizes-450-protected-snakes-turtles.
Albers, C. N., Jensen, A., Bælum, J., & Jacobsen, C. S., (2013). Inhibition of DNA
polymerases used in Q-PCR by structurally different soil-derived humic
substances. Geomicrobiology Journal, 30(8), 675-681.
Ali, M.E., Amin, M.A., Razzak, M. A., Hamid, S. B. A., Rahman, M. M., & Rashid, N.
R. A. (2016). Short Amplicon-Length PCR Assay Targeting Mitochondrial
Cytochrome b Gene for the Detection of Feline Meats in Burger Formulation.
Food Analytical Methods, 9(3), 571-581.
Ali, M. E., Razzak, M. A., Hamid, S. B.A., Rahman, M.M., Amin, M.A., & Rashid, N.
R. A. (2015). Multiplex PCR assay for the detection of five meat species forbidden
in Islamic foods. Food chemistry, 177, 214-224.
Ali, M. E., Razzak, M. A., & Abd Hamid, S. B. (2014). Multiplex PCR in Species
authentication: probability and prospects-A review. Food Analytical Methods,
7(10), 1933-1949.
159
Ali, M.E., Rahman, M. M., Hamid, S.B.A., Mustafa, S., Bhassu, S., & Hashim, U. (2014).
Canine-specific PCR assay targeting cytochrome b gene for the detection of dog
meat adulteration in commercial frankfurters. Food Analytical Methods, 7(1),
234-241.
Ali, M. E., Hashim, U., Mustafa, S., & Man, Y. B. (2012). Swine-specific PCR-RFLP
sssay targeting mitochondrial cytochrome b gene for semiquantitative detection
of pork in commercial meat products. Food Analytical Methods, 5(3), 613-623.
Alves, R. R.N., & Rosa, I. L. (2005). Why study the use of animal products in traditional
medicines? Journal of Ethnobiology and Ethnomedicine, 1(1), 1.
Alves, R. R.N., & Santana, G. G. (2008). Use and commercialization of podocnemis
expansa (Schweiger 1812)(Testudines: Podocnemididae) for medicinal purposes
in two communities in North of Brazil. Journal of Ethnobiology and
Ethnomedicine, 4(1), 1.
Alves, R. R. N., Rosa, I. L., Albuquerque, U, P., & Cunningham, A. B. (2013). Medicine
from the wild: an overview of the use and trade of animal products in traditional
medicines Animals in Traditional Folk Medicine (pp. 25-42): Springer.
Amin, A. Hamid, S.B.A., & Ali, M.E. (2015). A Method for the detection of potential
fraud of bringing feline feat in food chain. International Journal of Food
Properties, 1645-1658.
Angeletti, L. R., Agrimi, U., French, D., Curia, C., & Mariani, C. R. (1992). Healing
rituals and sacred serpents. The Lancet, 340(8813), 223-225.
Anonymous. (2016a). Malayan box terrapin. Elology Asia. [Downloaded on 2016 Aug
27]. Available from: http://www.ecologyasia.com/verts/turtles/malayan_box
_terrapin.htm.
Anonymous. (2016b). Wildlife crime unit seizes 1,070 tortoises in two raids,
Malaymail.com. [Downloaded on 2015 Jun 21]. Available from:
http://www.themalaymailonline.com/malaysia/article/wildlife-crime-unit-seizes-
1070-tortoises-in-two-raids.
Anonymous. (2015). US companies plead guilty to conspiring to export misbranded halal
products, Theguardian. [Downloaded on 2016 Aug 27]. Available from:
https://www.theguardian.com/us-news/2015/sep/10/us-companies-plead-guilty-
to-conspiring-to-export-misbranded-halal-products.
Anonymous. (2014). Malaysia: marketing to Muslim consumers. [Downloaded on 2015
November 20]. Available from: http://economists-pick-research.hktdc.com
/business-news/article/Research-Articles/Malaysia-marketing-to-Muslim
consumers/rp/en/1/1X000000/1X09XTD8.htm
Anyinam, C. (1995). Ecology and ethnomedicine: exploring links between current
environmental crisis and indigenous medical practices. Social Science &
Medicine, 40(3), 321-329.

160
Aristoy, M. C., & Toldrá, F. (2004). Histidine dipeptides HPLC-based test for the
detection of mammalian origin proteins in feeds for ruminants. Meat Science,
67(2), 211-217.
Aristoy, M.C., & Toldrá, F. (1998). Concentration of free amino acids and dipeptides in
porcine skeletal muscles with different oxidative patterns. Meat Science, 50(3),
327-332.
Arnesen, J.A., & Gildberg, A. (2006). Extraction of muscle proteins and gelatine from
cod head. Process Biochemistry, 41(3), 697-700.
Arslan, A., Ilhak, O. I., & Calicioglu, M. (2006). Effect of method of cooking on
identification of heat processed beef using polymerase chain reaction (PCR)
technique. Meat science, 72(2), 326-330.
Asensio, L., González, I., García, T., & Martín, R. (2008). Determination of food
authenticity by enzyme-linked immunosorbent assay (ELISA). Food Control,
19(1), 1-8.
Ayaz, Y, A. N.D., & Erol, I. (2006). Detection of species in meat and meat products using
Enzyme‐Linked Immunosorbent Assay. Journal of Muscle Foods, 17(2), 214-
220.
Baghurst, K. (1999). Red meat consumption in Australia: intakes, contributions to
nutrient intake and associated dietary patterns. European Journal of Cancer
Prevention, 8(3), 185-191.
Baghurst, K., Record, S., Leppard, P. (2000). Red meat consumption in Australia: Intakes,
nutrient contribution and changes over time, Australian Journal of Nutrition and
Dietetics, 57 (2000), pp. S3–S36.
Balizs, G., Weise, C., Rozycki, C., Opialla, T., Sawada, S., Zagon, J., & Lampen, A.
(2011). Determination of osteocalcin in meat and bone meal of bovine and porcine
origin using matrix-assisted laser desorption ionization/time-of-flight mass
spectrometry and high-resolution hybrid mass spectrometry. Analytica Chimica
Acta, 693(1), 89-99.
Ball, M.J., & Ackland, M.L. (2000). Zinc intake and status in Australian vegetarians.
British Journal of Nutrition, 83(01), 27-33.
Ballin, N. Z. (2010). Authentication of meat and meat products. Meat Science, 86(3), 577-
587.
Ballin, N. Z., Vogensen, F. K., & Karlsson, A. H. (2009). Species determination–Can we
detect and quantify meat adulteration? Meat science, 83(2), 165-174.
BBC. (2013). Muslim parents' concern over gelatine delays flu vaccine in schools,
http://www.bbc.com/news/uk-scotland-24394844.
Bellorini, S., Strathmann, S., Baeten, V., Fumière, O., Berben, G., Tirendi, S., & Von
H.C. (2005). Discriminating animal fats and their origins: assessing the potentials
of Fourier transform infrared spectroscopy, gas chromatography, immunoassay

161
and polymerase chain reaction techniques. Analytical and Bioanalytical
Chemistry, 382(4), 1073-1083.
Bennett, E. L., Milner G., E.J., Bakarr, M., Eves, H. E, Robinson, J. G., & Wilkie, D.S.
(2002). Hunting the world's wildlife to extinction. Oryx, 36(04), 328-329.
Berger, R.G., Mageau, R.P., Schwab, B., & Johnston, R.W. (1987). Detection of poultry
and pork in cooked and canned meat foods by enzyme-linked immunosorbent
assays. Journal-Association of Official Analytical Chemists, 71(2), 406-409.
Berrini, A., Tepedino, V., Borromeo, V., & Secchi, C. (2006). Identification of freshwater
fish commercially labelled “perch” by isoelectric focusing and two-dimensional
electrophoresis. Food Chemistry, 96(1), 163-168.
Bhat, M.M.,Jalal, H., Para, A.P., Bukhari, S. A., Ganguly, S., Bhat, A.A., Wakchaure,
R., & Qadr, K.(2015). Fraudulent adulteration/substitution of meat: a review.
International Journal of Recent Research and Applied Studies, 2, 12 (5).
Biasi, F., Mascia, C., & Poli, G. (2008). The contribution of animal fat oxidation products
to colon carcinogenesis, through modulation of TGF-β1 signaling.
Carcinogenesis, 29(5), 890-894.
Bingham, S, A., Hughes, R., & Cross, A. J. (2002). Effect of white versus red meat on
endogenous N-nitrosation in the human colon and further evidence of a dose
response. The Journal of Nutrition, 132(11), 3522S-3525S.
Blancou, J., Chomel, B. B., Belotto, A., & Meslin, F. X. (2005). Emerging or re-emerging
bacterial zoonoses: factors of emergence, surveillance and control. Veterinary
Research, 36(3), 507-522.
BNF.(2009). Minerals and trace elements, British nutrition foundation, London.
[Downloaded on 2017 Jan 20]. Available from: https://www.nutrition.org.
uk/nutritionscience/nutrients-food-and-ingredients/minerals-and-trace-elements.
html?showall=1&limitstart.
BNF. (2001). Selenium and health. British Nutrition Foundation: London. [Donwloaded
on 2017 Jan 10]. Available from: https://www.nutrition.org.uk/publications
/briefingpapers/selenium-and-health.html.
Bohari, A. M., Cheng, W. H., & Fuad, N. (2013). An analysis on the competitiveness of
halal food industry in Malaysia: an approach of SWOT and ICT strategy.
Geografia: Malaysian Journal of Society and Space, 9(1), 1-11.
Bottero, M. T., & Dalmasso, A. (2011). Animal species identification in food products:
evolution of biomolecular methods. The Veterinary Journal, 190(1), 34-38.
Bouley, J., Chambon, C., & Picard, B. (2004). Mapping of bovine skeletal muscle
proteins using two‐dimensional gel electrophoresis and mass spectrometry.
Proteomics, 4(6), 1811-1824.
Bowes, J.H., & Moss, J.A. (1962). The effect of gamma radiation on collagen. Radiation
Research, 16(3), 211-223.

162
Bouwman., Freek, G., De R., Baukje, Rubio, A., Isabel, Crosley, Katie., Duthie., Susan
J., Mayer., Claus., Coort., Susan, L. M. (2011). 2D-electrophoresis and multiplex
immunoassay proteomic analysis of different body fluids and cellular components
reveal known and novel markers for extended fasting. BMC medical genomics,
4(1), 24.
Bowler, J. K. (1977). Longevity of reptiles and amphibians in North American collections
as of 1 November, 1975: Society for the Study of Amphibians and Reptiles.
Bramble, D. M., & Lieberman, D. E. (2004). Endurance running and the evolution of
Homo. Nature, 432(7015), 345-352.
Brown, B. (2013). Findus beef lasagne contained up to 100% horsemeat, FSA says (7
February). BBC News. Available from: www.bbc.com/news/uk-21375594
Burke, C. J., Hsu, T.A., & Volkin, D. B. (1999). Formulation, stability, and delivery of
live attenuated vaccines for human use. Critical Reviews™ in Therapeutic Drug
Carrier Systems, 16(1).
Burt, A. (2016). Jainism: A Guide for the Perplexed. By Sherry Fohr. Alternative
Spirituality and Religion Review, 7(2), 337-338.
Cai, J., Chao, G.C., Chen, D.J., Chen, K.J., Chen, X.Q., & Cheng, X.Z. (1995). Advanced
textbook on traditional Chinese medicine and pharmacology vol. 1: Beijing: New
World Press.
Calder, P C. (2002). Conjugated linoleic acid in humans-reasons to be cheerful? Current
Opinion in Clinical Nutrition & Metabolic Care, 5(2), 123-126.
Calle, E. E., & Kaaks, R. (2004). Overweight, obesity and cancer: epidemiological
evidence and proposed mechanisms. Nature Reviews Cancer, 4(8), 579-591.
Calvo, J. H., Rodellar, C. Z. P., & Osta, R. (2002). Beef-and bovine-derived material
identification in processed and unprocessed food and feed by PCR amplification.
Journal of Agricultural and Food Chemistry, 50(19), 5262-5264.
Carr, H. S.(1991). The Maya medicinal turtle, xkokak, and a suggested alternate reading
of two Yucatec ethnomedical texts. Journal of Ethnobiology, 11(2), 187-192.
Cawthorn, D.M., Steinman, H. A., & Hoffman, L. C. (2013). A high incidence of species
substitution and mislabelling detected in meat products sold in South Africa. Food
Control, 32(2), 440-449.
Chan, W. (1995). Meat poultry and game: fifth supplement to the fifth edition of McCance
and Widdowson's the composition of foods: Jouirnal of Royal Society of
Chemistry.
Chaze, T., Bouley, J., Chambon, C., Barboiron, C., & Picard, B. (2006). Mapping of
alkaline proteins in bovine skeletal muscle. Proteomics, 6(8), 2571-2575.

163
Chen, F.C., & Hsieh, Y.H. (2000). Detection of pork in heat-processed meat products by
monoclonal antibody-based ELISA. Journal of AOAC International, 83(1), 79-
85.
Chen, Chien, L., Lin, Tsung, S., Tsai, Cheng, H., Wu, Chih, C., Chung., Ting., Chien.,
Kun,Y., Chen., Yi, T. (2013). Identification of potential bladder cancer markers
in urine by abundant-protein depletion coupled with quantitative proteomics.
Journal of proteomics, 85, 28-43.
Chen, T.H., Chang, H. C., & Lue, K.Y (2009). Unregulated trade in turtle shells for
Chinese traditional medicine in East and Southeast Asia: the case of Taiwan.
Chelonian Conservation and Biology, 8(1), 11-18.
Cheng, C. (2014). Ethical Treatment of Animals in Early Chinese Buddhism: Beliefs and
Practices: Cambridge Scholars Publishing.
Cheung, S. M., & Dudgeon, D. (2006). Quantifying the Asian turtle crisis: market surveys
in southern China, 2000–2003. Aquatic Conservation: Marine and Freshwater
Ecosystems, 16(7), 751-770.
Chou, C. C., Lin, Show,S.P., Lee, K.M., Hsu, C.T., Vickroy, T.W., & Zen, J.M. (2007).
Fast differentiation of meats from fifteen animal species by liquid
chromatography with electrochemical detection using copper nanoparticle plated
electrodes. Journal of Chromatography B, 846(1), 230-239.
Coghlan, M. L., Maker, G., Crighton, E., Haile, J., Murray, D, C., White, N. E., Trengove,
R. (2015). Combined DNA, toxicological and heavy metal analyses provides an
auditing toolkit to improve pharmacovigilance of traditional Chinese medicine
(TCM). Scientific Reports, 5.
Coghlan, M. L., Haile, J., Houston, J., Murray, D. C., White, N.E., Moolhuijzen, P,
Bunce, M. (2012). Deep sequencing of plant and animal DNA contained within
traditional Chinese medicines reveals legality issues and health safety concerns.
PLoS Genet, 8(4), e1002657.
CEU. (2002). Regulation (EC) no. 1774/2002 of the European parliament and of the
council of 3 October 2002 laying down health rules concerning animal by-
products not intended for human consumption. Commission, European Union,
Off. J. Eur. Communities L, 273, 1-95.
CEU (2001). Regulation (EC) No. 999/2001 of the European parliament and of the
council of 22 May 2001 laying down rules for the prevention, control and
eradication of certain transmissible spongiform encephalopathies. Commission,
European Union, Off. J. Eur. Commun., 147, 1-40.
Concannon, S. P., Wimberley, P B., & Workman, W. E. (2011). A quantitative PCR
method to quantify ruminant DNA in porcine crude heparin. Analytical and
Bioanalytical Chemistry, 399(2), 757-762.
Cosgrove, M., Flynn, A., & Kiely, M. (2005). Impact of disaggregation of composite
foods on estimates of intakes of meat and meat products in Irish adults. Public
Health Nutrition, 8(03), 327-337.

164
Cross, A. J., Leitzmann, M. F., Gail, M. H., Hollenbeck, A. R., Schatzkin, A., & Sinha,
R. (2007). A prospective study of red and processed meat intake in relation to
cancer risk. PLoS Med, 4(12), e325.
D'evoli, L., Salvatore, P., Lucarini, M., Nicoli, S., Aguzzi, A., Gabrielli, P., & Lombardi-
Boccia, G. (2009). Nutritional value of traditional Italian meat-based dishes:
influence of cooking methods and recipe formulation. International Journal of
Food Sciences and Nutrition, 60(sup5), 38-49.
D’Amato, M. E, Alechine, E. C. K. W., Davison, S., & Corach, D. (2013). Where is the
game? Wild meat products authentication in South Africa: a case study.
Investigative Genetics, 4(1), 1.
Da N. A., R. R., Da S. V. W. L., & Santana, G. G. (2008). Reptiles used in traditional
folk medicine: conservation implications. Biodiversity and Conservation, 17(8),
2037-2049.
Damiens, R., Rhee, H., Hwang, Y., Park, S.J., Hammi, Y., Lim, H., & Horstemeyer, M.F.
(2012). Compressive behavior of a turtle’s shell: experiment, modeling, and
simulation. Journal of the Mechanical Behavior of Biomedical Materials, 6, 106-
112.
Darrell S., Chris T.(2004), Malayan box turtle (Cuora amboinensis). World Chelonian
Trust, PO Box 1445, Vacaville CA 95696, [Downloaded on 2016 Aug 21].
Available from: www.chelonia.org- http://www.chelonia.org/articles/C.
amboinensiscare.htm.
Davey, G. K., Spencer, E. A., Appleby, P. N., Allen, N. E., Knox, K. H., & Key, T. J.
(2003). EPIC–Oxford: lifestyle characteristics and nutrient intakes in a cohort of
33 883 meat-eaters and 31 546 non meat-eaters in the UK. Public Health
Nutrition, 6(03), 259-268.
Davidson, J. A. (2003). World religions and the vegetarian diet. Journal of the Adventist
Theological Society, 14(2).
De S. F. (2000). Faunistic resources used as medicines by artisanal fishermen from
siribinha beach, state of Bahia, Brazil,’. Journal of Ethnobiology, 20(1), 93-109.
Dharmananda, S. (2006). Tortoise shell with brief reports on treating aplastic anemia and
parkinson’s disease. Head Office, Institute for Traditional Medicine, Portland,
Oregon. [Downloaded on 2015 Jan 20]. Avaliable from:
http://www.itmonline.org/arts/tortois2.htm#figure.
Dharmananda, S. (2005). Endangered species issues affecting turtles and tortoises used
in chinese medicine: ITM.
DIFVR. (2005). Dietary Habits in Denmark 2000–2002 Main Results. Danish Institute
for Food and Veterinary Research: Søborg, Denmark.
Do N. C., De A. R. F., Monesi, N., & Candido, S. Juliana, A. (2010). Alternative method
for direct DNA probe labeling and detection using the checkerboard hybridization
format. Journal of Clinical Microbiology, 48(8), 3039-3040.

165
Doherty, M.K., McLean, L., Hayter, J. R,, Pratt, J. M., Robertson, D.H.L., El, S. A.,
Beynon, R. J. (2004). The proteome of chicken skeletal muscle: changes in soluble
protein expression during growth in a layer strain. Proteomics, 4(7), 2082-2093.
Domingo, J.L., & Nadal, M. (2016). Carcinogenicity of consumption of red and processed
meat: What about environmental contaminants? Environmental Research, 145,
109-115.
Domínguez, R. M., Pickering, T.R., Semaw, S., & Rogers, M. J. (2005). Cutmarked bones
from pliocene archaeological sites at Gona, Afar, Ethiopia: implications for the
function of the world's oldest stone tools. Journal of Human Evolution, 48(2),
109-121.
Dooley, J. J., Paine, K. E., Garrett, S. D., & Brown, H. M. (2004). Detection of meat
species using TaqMan real-time PCR assays. Meat Science, 68(3), 431-438.
Doosti, A, Dehkordi, P. G., & Rahimi, E. (2014). Molecular assay to fraud identification
of meat products. Journal of food Science and Technology, 51(1), 148-152.
Druml, B., Hochegger, R., & Cichna, M. M. (2015a). Duplex real-time PCR assay for the
simultaneous determination of the roe deer (Capreolus capreolus) and deer (sum
of fallow deer, red deer and sika deer) content in game meat products. Food
Control, 57, 370-376.
Druml, B., Mayer, W., Cichna, M., M., & Hochegger, R. (2015b). Development and
validation of a TaqMan real-time PCR assay for the identification and
quantification of roe deer (Capreolus capreolus) in food to detect food
adulteration. Food Chemistry, 178, 319-326.
Dunussi J. K., Hancock, G. E., Kunz, A., Hegen, M., Zhou, X. X., Sheppard, B. J.,
Hamann, P. R. (2005). B-cell depletion inhibits arthritis in a collagen-induced
arthritis (CIA) model, but does not adversely affect humoral responses in a
respiratory syncytial virus (RSV) vaccination model. Blood, 106(7), 2235-2243.
Elasrag, Hussein. (2016). Halal industry: Key challenges and opportunities: Hussein
Elasrag.
Ehrlich, P. R. (2000). Human natures: Genes, cultures, and the human prospect: Island
Press.
ENGL. (2008). Definition of minimum performance requirements for analytical methods
of GMO testing. European Network of GMO Laboratories. [Downloaded on 2016
Aug 5]. Available from: http://gmocrl.jrc.ec.europa.eu/guidancedocs.htm.
Ernst, C.H., & Altenburg, R.G.M. (2000). Turtles of the world. World biodiversity series.
Biodiversity Center of ETI, ETI/NLBIF, online version as of January 6, 2006.
Ernst, E. (2004). Risks of herbal medicinal products. Pharmacoepidemiology and Drug
Safety, 13(11), 767-771.
Ernst, E. (2002). Toxic heavy metals and undeclared drugs in Asian herbal medicines.
Trends in Pharmacological Sciences, 23(3), 136-139.

166
Ernst, E., & Coon, J. T. (2001). Heavy metals in traditional Chinese medicines: a
systematic review. Clinical Pharmacology & Therapeutics, 70(6), 497-504.
Ernst, E. (2000). Adverse effects of herbal drugs in dermatology. British Journal of
Dermatology, 143(5), 923-929.
Evelyn, B (1995). Task force report; Iron: nutritional and physiological significance.
British nutrition foundation: London: Chapman & Hall for the British Nutrition
Foundation, London. [Downloaded on 2016 Dec 10]. Available from:
https://capitadiscovery.co.uk/greenwich-ac/items/257577
Fairbrother, K.S., Hopwood, A.J., Lockley, A.K., & Bardsley, R.G. (1998). The actin
multigene family and livestock speciation using the polymerase chain reaction.
Animal Biotechnology, 9(2), 89-100.
Fajardo, V., González, I., Rojas, M., García, T., & Martín, R. (2010). A review of current
PCR-based methodologies for the authentication of meats from game animal
species. Trends in Food Science & Technology, 21(8), 408-421.
Fajardo, V., González, I., Dooley, J., Garret, S., Brown, H. M., García, T., & Martín, R.
(2009). Application of polymerase chain reaction–restriction fragment length
polymorphism analysis and lab‐on‐a‐chip capillary electrophoresis for the specific
identification of game and domestic meats. Journal of the Science of Food and
Agriculture, 89(5), 843-847.
Fajardo, V., González, I., Martín, I., Rojas, M., Hernández, P. E., García, T., & Martín,
R. (2008). Real-time PCR for detection and quantification of red deer (Cervus
elaphus), fallow deer (Dama dama), and roe deer (Capreolus capreolus) in meat
mixtures. Meat Science, 79(2), 289-298.
Fang, D.R., Zhang, D.L., & Liu, Y.W. (1989). Constituents of tortoise plastron and turtle
carapace. Chin. Trad. Pat. Med, 11, 31-32.
Fang, X., & Zhang, C. (2016). Detection of adulterated murine components in meat
products by TaqMan© real-time PCR. Food Chemistry, 192, 485-490.
FAO. (2014). Animal production and health, food and agricuture organization of the
united nations for a world without hunger.[Download on 2016 Aug 23]. Available
from: http://www.fao.org/ag/againfo/themes/en/meat/backgr_sources.html.
FAO. (2013). Current worldwide annual meat consumption per capita, livestock and fish
primary equivalent, Food and Agriculture Organization of the United Nations,
viewed 31st March, 2013,[Downloaded on 2016 June 21]
http://faostat.fao.org/site/610/DesktopDefault.aspx?PageID=610#ancor.
FAO. (2010). Guidelines on performance criteria and validation of methods for detection,
identification and quantification of specific DNA sequences and specific proteins
in foods((CAC/GL 74-2010). Food and Agriculture Organization. [Downloaded
on 2016 Dec 25]. Available from: www.fao.org/fileadmin/userupload/gmfp
/resources/CXG074e.pdf.

167
FAO. (2009). Agribusiness handbook, Red Meat, Food and Agriculture Organization of
the United Nations (FAO),Rome, Italy
FAO. (2002). Diet, nutrition and the prevention of chronic diseases: report of a joint of
the Food and Agriculture Organization of the United Nations (FAO), FAO expert
consultation, Geneva, Switzerland. [Downloaded on 2016 June 11]. Avaliable
from: ftp://ftp.fao.org/docrep/fao/005/ac911e/ac911e01.pdf.
FAO.(1991). Protein quality evaluation: Report of the joint FAO/WHO expert
consultation, FAO food and nutrition paper no. 51. Rome (Italy).
Felbab B. V. (2011). The disappearing act: The illicit trade in wildlife in Asia. Brookings.
July, 2011 ed. 2011, The Brookings Institution: 1775 Massachusetts Ave., NW
Washington, DC 20036.
Fernández, T, J., Freire, R., & Méndez, J. (2010). A simple one-step PCR method for the
identification between European and American razor clams species. Food
Chemistry, 118(4), 995-998.
Fernández G. J. M., Fernández L. J., Sayas‐B. E., & Pérez‐A., J. (2005). Meat products
as functional foods: A review. Journal of Food Science, 70(2), R37-R43.
Fink, G. (1993). Nutrition, residues and health. Fleischwirtsch Internation 2: 3–13.
Fischer, J. (2008). Religion, science and markets. EMBO Reports, 9(9), 828-831.
Floren, C., Wiedemann, I., Brenig, B., Schütz, E., & Beck, J. (2015). Species
identification and quantification in meat and meat products using droplet digital
PCR (ddPCR). Food Chemistry, 173, 1054-1058.
Flores, M. M.E., Bermudez, A. M.C., & Vázquez, M. L. (2000). A research note: detection
of adulteration in processed traditional meat products. Journal of Muscle Foods,
11(4), 319-325.
FDA (2010). Federal food, drug, and cosmetic act, chap. IV. 21 (USC) 342: 402.
Adulterated food. US Food and Drug Administration, Washington, DC.
Frézal, L., & Leblois, R. (2008). Four years of DNA barcoding: current advances and
prospects. Infection, Genetics and Evolution, 8(5), 727-736.
Fund. (2002). A global action plan for conservation of tortoises and freshwater turtles.
Turtle Conservation. Strategy and Funding Prospectus, 2007, 30.
Gans, J.D., Dunbar, J., Eichorst, Stephanie A, Wolinsky, M, & Kuske, C. R. (2012b). A
robust PCR primer design platform applied to the detection of Acidobacteria
Group 1 in soil. Nucleic Acids Research, 40(12), e96-e96..
Garg, A., & Misra, A. (2002). Hepatic steatosis, insulin resistance, and adipose tissue
disorders. The Journal of Clinical Endocrinology & Metabolism, 87(7), 3019-
3022.
Garriguet, D. (2007). Canadians' eating habits. Health Reports, 18(2), 17.

168
Gerba, C. P., Rose, J. B., & Haas, C. N. (1996). Sensitive populations: who is at the
greatest risk? International Journal of Food Microbiology, 30(1), 113-123.
Ghovvati, S., Nassiri, M. R., Mirhoseini, S. Z., Moussavi, A. H., & Javadmanesh, A.
(2009). Fraud identification in industrial meat products by multiplex PCR assay.
Food Control, 20(8), 696-699.
Gilbert, N. (2011). Regulations: Herbal medicine rule book. Nature, 480(7378), S98-S99.
Gilsenan, P. M., & Ross M. S. B. (1999). Structure and rheology of gelatin gels. The
Wiley Polymer Networks Group Review Series, 2, 237-273.
Giovannacci, I., Guizard, C., Carlier, M., Duval, V., Martin, J.L., & Demeulemester, C.
(2004). Species identification of meat products by ELISA. International journal
of Food Science & Technology, 39(8), 863-867.
Giovannucci, E., Rimm, E. B., Stampfer, M. J., Colditz, G. A., Ascherio, A, & Willett,
W. C. (1994). Intake of fat, meat, and fiber in relation to risk of colon cancer in
men. Cancer Research, 54(9), 2390-2397.
Girish, P.S., Anjaneyulu, A.S.R., Viswas, K.N., Santhosh, F.H., Bhilegaonkar, K.N.,
Agarwal, R.K., Nagappa, K. (2007). Polymerase chain reaction–restriction
fragment length polymorphism of mitochondrial 12S rRNA gene: a simple
method for identification of poultry meat species. Veterinary Research
Communications, 31(4), 447-455.
Girish, P.S, Anjaneyulu, A.S.R., Viswas, K.N., Anand, M, Rajkumar, N.b., Shivakumar,
BM, & Bhaskar, Sharma. (2004). Sequence analysis of mitochondrial 12S rRNA
gene can identify meat species. Meat Science, 66(3), 551-556.
Giroux, M., & Lacroix, M., (1998). Nutritional adequacy of irradiated meat—a review.
Food Research International, 31(4), 257-264.
Gómez G.MC, Turnay, J., Fernández D. M.D., Ulmo, N., Lizarbe, M.A., & Montero, P.
(2002). S.tructural and physical properties of gelatin extracted from different
marine species: a comparative study. Food Hydrocolloids, 16(1), 25-34.
Gong, S.P., Chow, A.T., Fong, J.J., & Shi, H.T. (2009). The chelonian trade in the largest
pet market in China: scale, scope and impact on turtle conservation. Oryx, 43(02),
213-216.
Goudsblom, J. (1992). Fire and civilization: Viking Adult.[Downloaded on 2016 Oct 25].
Available from: https://www.abebooks.com/book-search/title/fire-and-
civilization/author/goudsblom-johan.
Grabenstein, J.D. (2013). What the world's religions teach, applied to vaccines and
immune globulins. Vaccine, 31(16), 2011-2023.
Graham, R.D. (2011). Biodiversity: endangered and in demand. Nature, 480(7378),
S101-S103.

169
Gregory, R., & Sharma, D.S.K.(1997). Review of legislation affecting marine and
freshwater turtle, terrapin and tortoise conservation and management in Malaysia:
recommendations for change. Project MYS, 343, 96.
Grossman, S., & Bergman, M. (1992). Process for the production of gelatin from fish
skins: Google Patents.
Haitao, S., Parham, J. F., Ziyong, F., Meiling, H., & Feng, Y. (2008). Evidence for the
massive scale of turtle farming in China. Oryx, 42(01), 147-150.
Hambræus, L. (1999). Animal-and plant-food-based diets and iron status: benefits and
costs. Proceedings of the Nutrition Society, 58(02), 235-242.
Hamelin, M., Sayd, T., Chambon, C., Bouix, J., Bibé, B., Milenkovic, D., Marinova, P.
(2007). Differential expression of sarcoplasmic proteins in four heterogeneous
ovine skeletal muscles. Proteomics, 7(2), 271-280.
Han, J., Pang, X., Liao, B., Yao, H., Song, J., & Chen, S. (2016). An authenticity survey
of herbal medicines from markets in China using DNA barcoding. Scientific
reports, 6.
Haunshi, S., Basumatary, R., Girish, P.S, Doley, S., Bardoloi, R.K, & Kumar, A. (2009).
Identification of chicken, duck, pigeon and pig meat by species-specific markers
of mitochondrial origin. Meat Science, 83(3), 454-459.
Heinz, G., & Hautzinger, P. (2009). Meat processing technology for small to medium
scale producers: FAO.
Hempen, C.H., & Fischer, T. (2009). A materia medica for Chinese medicine: plants,
minerals, and animal products: Elsevier Health Sciences.
Henderson, L., Gregory, J., Irving, K., & Swan, G. (2004). The national diet & nutrition
survey: adults aged 19 to 64 years. Energy, protein, fat and carbohydrate intake,
2.
Henderson, L., Gregory, J., & Swan, G. (2003). The national diet & nutrition survey:
adults aged 19 to 64 years.
Hennenfent, G., & Herrmann, F. J. (2006). Application of stable signal recovery to
seismic data interpolation. Paper presented at the SEG Technical Program
Expanded Abstracts.
Herman, L. (2001). Determination of the animal origin of raw food by species-specific
PCR. Journal of Dairy Research, 68(03), 429-436.
Heubl, G. (2010). New aspects of DNA-based authentication of Chinese medicinal plants
by molecular biological techniques. Planta medica, 76(17), 1963-1974.
Hoffman, L.C., & Wiklund, E. (2006). Game and venison–meat for the modern consumer.
Meat Science, 74(1), 197-208.

170
Holm, Lotte, & Kildevang, Helle. (1996). Consumers' views on food quality. A
qualitative interview study. Appetite, 27(1), 1-14.
Hollung, K., Grove, H., Færgestad, E. M., Sidhu, M. S., & Berg, P. (2009). Comparison
of muscle proteome profiles in pure breeds of Norwegian Landrace and Duroc at
three different ages. Meat Science, 81(3), 487-492.
Holzer, D. (1996). Gelatin production: Google Patents.
Houghton, P. J., & Mukherjee, P.K. (2009). Evaluation of herbal medicinal products:
Perspectives on quality, safety and efficacy: Pharmaceutical press.
Hsieh, H.M., Liao,S.P., Huang, L.H., Kuo, Y.C., Lin, A., Lee, J., & Tsai, L.C. (2008).
Species identification of fragmented turtle shells by cytochrome b gene. Journal
of Forensic Science, 7, 45-47.
Hsieh, Y.H.P., Woodward, B. B., & Ho, S.H. (1995). Detection of species substitution in
raw and cooked meats using immunoassays. Journal of Food Protection®, 58(5),
555-559.
Hsu, Y.C., Pestka, J.J., & Smith, D.M. (1999). ELISA to quantify triose phosphate
isomerase to potentially determine processing adequacy in ground beef. Journal
of Food Science, 64(4), 623-628.
Huang, Q., Xu, T, Wang, G.Y.,Huan, J. F., Xia, H., Yin, R., Fu, W.L. (2012). Species-
specific identification of ruminant components contaminating industrial crude
porcine heparin using real-time fluorescent qualitative and quantitative PCR.
Analytical and Bioanalytical Chemistry, 402(4), 1625-1634.
Iberahim, Hadijah, Kamaruddin, Rohana, & Shabudin, Alwi. (2012). Halal development
system: The institutional framework, issues and challenges for halal logistics.
Paper presented at the Business, Engineering and Industrial Applications
(ISBEIA), 2012 IEEE Symposium on.
Ilhak, O. I., & Arslan, A. (2007). Identification of meat species by polymerase chain
reaction (PCR) technique. Turkish Journal of Veterinary and Animal Sciences,
31(3), 159-163.
INSRJ. (2006). Tabela de composição de alimentos (2006), Lisbon.Portugal.
IRD. (2006). Nutrient Reference Values for Australia and New Zealand including
recommended dietary intakes. national health and medical research council.
canberra: commonwealth department of health and aging. [Downloaded on 2015
Oct 5]. Available from: https://www.nhmrc.gov.au/_files_nhmrc
/publications/attachments/n35.pdf.
Jamal, A. (2003). Marketing in a multicultural world: The interplay of marketing,
ethnicity and consumption. European Journal of Marketing, 37(11/12), 1599-
1620.
Jayaraj, P. (2010). Regulation of traditional and complementary medicinal products in
Malaysia. International Journal of Green Pharmacy, 4(1), 10.

171
Jensen, J. H. (1981). Meat in international dietary patterns. Proceedings. Meat in
Nutrition and Health.
Ji, H.F., Li, X.J., & Zhang, H.Y. (2009). Natural products and drug discovery. EMBO
Reports, 10(3), 194-200.
Johnson, J.M., & Walker, P.M.. (1992). Zinc and iron utilization in young women
consuming a beef-based diet. Journal of the American Dietetic Association,
92(12), 1474-1478.
Karabasanavar, N.S., Singh, S.P., Kumar, D., & Shebannavar, S. N. (2014). Detection of
pork adulteration by highly-specific PCR assay of mitochondrial D-loop. Food
Chemistry, 145, 530-534.
Karabasanavar, N. S., Singh, S.P., Umapathi, V., Kumar, D., Patil, G., & Shebannavar,
S. N. (2011a). A highly specific PCR assay for identification of raw and heat
treated mutton (Ovis aries). Small Ruminant Research, 100(2), 153-158.
Karabasanavar, N. S., Singh, S.P, Umapathi, V., Kumar, D., & Shebannavar, S.N.
(2011b). Identification of goat meat using highly species-specific polymerase
chain reaction. Journal of Food Quality, 34(2), 142-149.
Karesh, W.B., Cook, R.A., Bennett, E.L., & Newcomb, J. (2005). Wildlife trade and
global disease emergence. Emerg Infect Dis, 11(7), 1000-1002.
Kelemen, L.E., Kushi, L.H., Jacobs, D.R., & Cerhan, J.R. (2005). Associations of dietary
protein with disease and mortality in a prospective study of postmenopausal
women. American Journal of Epidemiology, 161(3), 239-249.
Kelleher, K. (2005). Discards in the world's marine fisheries: an update: Food &
Agriculture Org.
Kerry, J. (2009). Improving the sensory and nutritional quality of fresh meat: Elsevier.
Khan, R. (1982). Chelonians of Bangladesh and their conservation. Journal of the
Bombay Natural History Society. Bombay, 79(1), 110-116.
Khattak, J.Z.K., Mir, A., Anwar, Z., Abbas, G., Khattak, H.Z.K., & Ismatullah, H. (2011).
Concept of halal food and biotechnology. Advance Journal of Food Science and
Technology, 3.
Kim, S.H., Huang, T.S., Seymour, T. A., Wei, C. K., Stephen C., Bridgman, C R., An, H.
(2004). Production of monoclonal antibody for the detection of meat and bone
meal in animal feed. Journal of Agricultural and Food Chemistry, 52(25), 7580-
7585.
Kitpipit, T., Sittichan, K., & Thanakiatkrai, P. (2014). Direct-multiplex PCR assay for
meat species identification in food products. Food Chemistry, 163, 77-82. doi:
10.1016/j.foodchem.2014.04.062

172
Klein, P. N. (2004). Game meat: a complex food safety and animal health issue,
http://www.foodsafetymagazine.com/magazine-archive1/december-2004january
-2005/game-meat-a-complex-food-safety-and-animal-health-issue/.
Klemens, M. W. (2000). Turtle conservation. Washington, DC.: Smithsonian Institution
Press.
Ko, R. J. (1998). Adulterants in Asian patent medicines. New England Journal of
Medicine, 339(12), 847-847.
Koh, M.C., Lim, C.H, Chua, S.B., Chew, S.T., & Phang, S.T.W. (1998). Random
amplified polymorphic DNA (RAPD) fingerprints for identification of red meat
animal species. Meat Science, 48(3), 275-285.
Kontogianni, M.D., Panagiotakos, D.B., Pitsavos, C., Chrysohoou, C., & Stefanadis, C..
(2008). Relationship between meat intake and the development of acute coronary
syndromes: The CARDIO2000 case–control study. European Journal of Clinical
Nutrition, 62(2), 171-177.
Kress, W. J., Wurdack, K.J., Zimmer, E.A., Weigt, L. A., & Janzen, D. H., (2005). Use
of DNA barcodes to identify flowering plants. Proceedings of the National
Academy of Sciences of the United States of America, 102(23), 8369-8374.
Kubista, M, A., José, M.A., Bengtsson, M., Frootan, A., Jonák, J., Lind, K., Strömbom,
L. (2006). The real-time polymerase chain reaction. Molecular Aspects of
Medicine, 27(2), 95-125.
Kunin, W.E, & Lawton, J.H.(1996). Does biodiversity matter? Evaluating the case for
conserving species. Biodiversity: a biology of numbers and differences. Edited
by: Gaston KJ. 1996: Oxford, Blackwell Sci Publ.
La N. F., Civera, T., Mucci, N., & Bottero, M.T. (2008). Authentication of meat from
game and domestic species by SNaPshot minisequencing analysis. Meat Science,
80(2), 216-224.
Larsen, C. S. (2003). Animal source foods and human health during evolution. The
Journal of Nutrition, 133(11), 3893S-3897S.
Lau, M. C. B., Crow, P., Ades, G. (2000). Trade and conservation of turtles and tortoises
in the Hong Kong special administrative region, People’s Republic of China.
Asiaii turtle trade: Proceedings ofa 1Voikhop oji Coiie,’citio,z and trade of
fieslntatei turtles and tortoises in Asia. 2:39—44, 2000’ Chelonian Reseaicli
Foundation.
Law. (2002). Regulation (EC) No. 178/2002 of the European parliament and of the
council of 28 january 2002, laying down the general principles and requirements
of food law, establishing the European food safety authority, and laying down
procedures in matters of food safety. OJ L, 31(1.2).
Lee, T. M., Sigouin, A., Pinedo V.M., & Nasi, R. (2014). The harvest of wildlife for
bushmeat and traditional medicine in East, South and Southeast Asia: Current

173
knowledge base, challenges, opportunities and areas for future research (Vol.
115): CIFOR.
Leonard, W. R., Snodgrass, J J., & Robertson, M. L. (2007). Effects of brain evolution
on human nutrition and metabolism. Annu. Review. Nutrition., 27, 311-327.
Levy, S. B., Fitzgerald, G.B., & Macone, A.B. (1976). Spread of antibiotic-resistant
plasmids from chicken to chicken and from chicken to man.
Lili, D. (1987). Treatment of rickets with the new drug Longmu Zhuanggu Infusion.
Zhongchengyao Yanjiu 1987; 3: 20–21.
Lim, B. L., & Das, I. (1999). Turtles of Borneo and peninsular Malaysia: Natural History
Publications (Borneo).
Liu, S.H., Chuang, W.C., Lam, W., Jiang, Z., & Cheng, Y.C. (2015). Safety surveillance
of traditional Chinese medicine: current and future. Drug safety, 38(2), 117-128.
Lo, C. F., Lin, Y. R., Chang, H. C., & Lin, J. H. (2006). Identification of turtle shell and
its preparations by PCR-DNA sequencing method. Journal of Food and Drug
Analysis, 14(2), 153-158.
Lombardi B.G., Lanzi, S., & Aguzzi, A. (2005). Aspects of meat quality: trace elements
and B vitamins in raw and cooked meats. Journal of Food Composition and
Analysis, 18(1), 39-46.
Luo, A., Zhang, A., Ho, Simon Y.W., Xu, W., Zhang, Y., Shi, W., Zhu, C., (2011).
Potential efficacy of mitochondrial genes for animal DNA barcoding: a case study
using eutherian mammals. BMC genomics, 12(1), 1.
Ma, X.Q., Duan, J.A., Zhu, D.Y., Dong, T.T.X., & Tsim, K.W.K. (2000). Species
identification of Radix astragali (Huangqi) by DNA sequence of its 5S-rRNA
spacer domain. Phytochemistry, 54(4), 363-368.
Macedo S.A., Shimokomaki, M., Vaz, A.J., Yamamoto, Y.Y., & Tenuta F. A., (2001).
Textured soy protein quantification in commercial hamburger. Journal of Food
Composition and Analysis, 14(5), 469-478.
Maede, D. (2006). A strategy for molecular species detection in meat and meat products
by PCR-RFLP and DNA sequencing using mitochondrial and chromosomal
genetic sequences. European Food Research and Technology, 224(2), 209-217.
MAFF. (1998). Fatty Acids. supplement to McCance and widdowson's the composition
of foods. Ministry of agriculture fisheries and food, HMSO: London.
Mafra, I, Ferreira, Isabel M.P.L.V.O., & Oliveira, M. B.P.P., (2008). Food authentication
by PCR-based methods. European Food Research and Technology, 227(3), 649-
665.
Magnino, S., Colin, P., Dei C. E., Madsen, M., McLauchlin, J. Nöckler, K., Van P. C.
(2009). Biological risks associated with consumption of reptile products.
International journal of food microbiology, 134(3), 163-175.

174
MS.(2004). Halal food-production, preparation, handling and storage-general guidelines
(First revision). Malaysian Standard, Department of standards Malaysia.
Mane, B.G., Mendiratta, S.K., & Tiwari, A.K. (2012). Beef specific polymerase chain
reaction assay for authentication of meat and meat products. Food Control, 28(2),
246-249.
Mane, B.G., Mendiratta, S.K., & Tiwari, A.K. (2009). Polymerase chain reaction assay
for identification of chicken in meat and meat products. Food Chemistry, 116(3),
806-810.
Marbaix, Helene, Budinger, Dimitri, Dieu, Marc, Fumiere, Olivier, Gillard, Nathalie,
Delahaut, Philippe, Raes, Martine. (2016). Identification of proteins and peptide
biomarkers for detecting banned Processed Animal Proteins (PAPs) in meat and
bone meal by mass spectrometry. Journal of agricultural and food chemistry,
64(11), 2405-2414.
Marques, J.G.W. (1997). Fauna medicinal: Recurso do ambiente ou ameaça à
biodiversidade. Mutum, 1(1), 4.
Martín, R., Wardale, R J., Jones, S.J., Hernández, P. E., & Patterson, R. L.S. (1991).
Monoclonal antibody sandwich ELISA for the potential detection of chicken meat
in mixtures of raw beef and pork. Meat science, 30(1), 23-31.
Martinez, I., & Jakobsen F.T. (2004). Application of proteome analysis to seafood
authentication. Proteomics, 4(2), 347-354.
Matsunaga, T., Chikuni, K., Tanabe, R., Muroya, S., Shibata, K., Yamada, J., &
Shinmura, Y. (1999). A quick and simple method for the identification of meat
species and meat products by PCR assay. Meat science, 51(2), 143-148.
Matthews, K, & Strong, M. (2005). Salt its role in meat products and the industry's action
plan to reduce it. Nutrition Bulletin, 30(1), 55-61.
McHenry, H. M., & Coffing, K. (2000). Australopithecus to homo: transformations in
body and mind. Annual review of Anthropology, 125-146.
Meyer R., Victor, B. (2009). Food taboos: their origins and purposes. Journal of
Ethnobiology and Ethnomedicine, 5(1), 1.
Meyer, R., Höfelein, C, Lüthy, J., & Candrian, U. (1994). Polymerase chain reaction-
restriction fragment length polymorphism analysis: a simple method for species
identification in food. Journal of AOAC International, 78(6), 1542-1551.
Meyer, W., Seger, H., & Hulmann, G. (1995). Remarks on specific adaptive scale
structure of the hair cuticle in some European bats. European journal of
morphology, 33(5), 509-513.
Mitchell, D. (2014). 10 Most common (and Kinda Gross) animal ingredients found in
prescription medications.[Downloaded on 2016 Aug 21]. Available
from:http://naturallysavvy.com/live/10-most-common-and-kinda-gross-animal-
ingredients-found-in-prescription-edications#sthash.4CyTX9B4.dpuf.

175
Moll, E. O., & Vijaya, J. (1986). Distributional records for some Indian turtles. J. Bombay
Natur. Hist. Soc, 83(1), 57-62.
Montiel, S. J.F., Ruiz P. E., Montoya, J. R.P., López, P.M.J., & Pérez,M. A. (2000). Direct
and highly species-specific detection of pork meat and fat in meat products by
PCR amplification of mitochondrial DNA. Journal of Agricultural and Food
Chemistry, 48(7), 2829-2832.
Moore, J. C,, Spink, J., & Lipp, M. (2012). Development and application of a database of
food ingredient fraud and economically motivated adulteration from 1980 to
2010. Journal of Food Science, 77(4), R118-R126.
Moore, M. K., Bemiss, J.A., Rice, S.M, Quattro, J.M., & Woodley, C.M. (2003). Use of
restriction fragment length polymorphisms to identify sea turtle eggs and cooked
meats to species. Conservation Genetics, 4(1), 95-103.
Morrison, N.A., Clark, R.C, Chen, Y.L., Talashek, T., & Sworn, G. (1999). Gelatin
alternatives for the food industry Physical chemistry and industrial application of
gellan gum (pp. 127-131): Springer.
Murugaiah, C., Noor, Z.M., Mastakim, M., Bilung, L.M., Selamat, J., & Radu, S. (2009).
Meat species identification and Halal authentication analysis using mitochondrial
DNA. Meat science, 83(1), 57-61.
Mutalib, S. A., Nazri, W. S., W, Shahimi, S., Yaakob, N., Sani, N. A., Abdullah, A, Ghani,
M.A.,(2012). Comparison between pork and wild boar meat (Sus scrofa) by
polymerase chain reaction-restriction fragment length polymorphism (PCR-
RFLP). Sains Malaysiana, 41(2), 199-204.
Nagai, T., & Suzuki, N. (2000). Isolation of collagen from fish waste material—skin,
bone and fins. Food Chemistry, 68(3), 277-281.
Nakyinsige, K., Man, Y.B.C., Sazili, A.Q., Zulkifli, I., & Fatimah, A.B. (2012). Halal
meat: A niche product in the food market. Paper presented at the 2nd International
Conference on Economics, Trade and Development IPEDR.
Nakyinsige, K., Man, Y. B. C., & Sazili, A. Q. (2012). Halal authenticity issues in meat
and meat products. Meat Science, 91(3), 207-214.
Nathan, I., Hackett, A.F., & Kirby, S. (1997). A longitudinal study of the growth of
matched pairs of vegetarian and omnivorous children, aged 7–11 years, in the
North-West of England. European journal of clinical nutrition, 51(1).
Nejad, F. P., Tafvizi, Erahimi, M.T., & Hosseni, S. E. (2014). Optimization of multiplex
PCR for the identification of animal species using mitochondrial genes in
sausages. European Food Research and Technology, 239(3), 533-541.
Newmaster, S.G., Grguric, M., Shanmughanandhan, D, Ramalingam, S, & Ragupathy, S.
(2013). DNA barcoding detects contamination and substitution in North American
herbal products. BMC medicine, 11(1), 222.

176
NHMRC.(2006). Nutrient reference values for Australia and New Zealand including
recommended dietary intakes. Canberra: National health and medical research
council, Commonwealth Department of Health and Ageing, 2006.
Nijman, V. (2010). An overview of international wildlife trade from Southeast Asia.
Biodiversity and conservation, 19(4), 1101-1114.
Notermans, S, Boot, R., Tips, P.D., & De N., M.P. (1983). Extraction of staphylococcal
enterotoxins (SE) from minced meat and subsequent detection of SE with enzyme-
linked immunosorbent assay (ELISA). Journal of Food Protection®, 46(3), 238-
241.
Nutaphand, W. (1979). The turtles of Thailand: Siam Farm Zoological Garden.
O'Mahony, P.J. (2013). Finding horse meat in beef products-a global problem. QJM,
106(6), 595-597.
WHO.(2002).WHO traditional medicine strategy 2002-2005.World Health Organization,
Retrived from: http://apps.who.int/iris/handle/10665/67163
Othman, R. A., Zainal A., & Zailani, S. (2009). The effect of institutional pressures in the
Malaysian halal food industry. International Business Management, 3(4), 80-84.
Özpınar, H., Tezmen, G., Gökçe, İ., & Tekiner, İ. H. (2013). Detection of animal species
in some meat and meat products by comparatively using DNA microarray and real
time PCR methods. Kafkas Univ Vet Fak Derg, 19(2), 245-252.
Panduranga R. K. (1996). Recent developments of collagen-based materials for medical
applications and drug delivery systems. Journal of Biomaterials Science, Polymer
Edition, 7(7), 623-645.
Park, J.K., Shin, Ki,H.S., Sung, C.C., Ku. Y, & Chung, E.R. (2007). Identification of meat
species using species-specific PCR-RFLP fingerprint of mitochondrial 12S rRNA
gene. Korean Journal for Food Science of Animal Resources, 27(2), 209-215.
Pelser, C., Mondul, A.M., Hollenbeck, A. R., & Park, Y. (2013). Dietary fat, fatty acids,
and risk of prostate cancer in the NIH-AARP diet and health study. Cancer
Epidemiology Biomarkers & Prevention, 22(4), 697-707.
Pergande, Melissa R, & Cologna, Stephanie M. (2017). Isoelectric Point Separations of
Peptides and Proteins. Proteomes, 5(1), 4.
Peter, C., Brünen-N.C., Cammann, K., & Börchers, T. (2004). Differentiation of animal
species in food by oligonucleotide microarray hybridization. European Food
Research and Technology, 219(3), 286-293.
Phelps, Norm. (2004). The great compassion: Buddhism and animal rights: Lantern
Books.Source: https://books.google.com.my/books?id=Ljdiy2JiN78C&printsec=
frontcover&source=gbs_ge_summary_r&cad=0#v=onepage&q&f=false
Phillipson, J. D. (2001). Phytochemistry and medicinal plants. Phytochemistry, 56(3),
237-243.

177
Pischetsrieder, M., & Baeuerlein, R. (2009). Proteome research in food science. Chemical
Society Reviews, 38(9), 2600-2608.
Pollack, S. V. (1990). Silicone, fibrel, and collagen implantation for facial lines and
wrinkles. The Journal of dermatologic surgery and oncology, 16(10), 957-961.
Praedicow, G. (1985). Langjaehrige erfahrung bei der Pflege von Cuora amboinensis
(Daudin). Herpetofauna, 7(37), 6-14.
Premanandh, J. (2013). Horse meat scandal–a wake-up call for regulatory authorities.
Food Control, 34(2), 568-569.
Psouni, E., Janke, A., & Garwicz, M. (2012). Impact of carnivory on human development
and evolution revealed by a new unifying model of weaning in mammals. PloS
one, 7(4), e32452.
Purchas, R, Zou, M., Pearce, P., & Jackson, F. (2007). Concentrations of vitamin D3 and
25-hydroxyvitamin D3 in raw and cooked New Zealand beef and lamb. Journal
of Food Composition and Analysis, 20(2), 90-98.
Quillen, K., & Murphy, K. (2006). Quality improvement to decrease specimen
mislabeling in transfusion medicine. Archives of pathology & laboratory
medicine, 130(8), 1196-1198.
Quinto, C. A., Tinoco, R., & Hellberg, R.S., (2016). DNA barcoding reveals mislabeling
of game meat species on the US commercial market. Food Control, 59, 386-392.
Rahman, M. M., Ali, M. E., Hamid, S. B.A., Mustafa, S., Hashim, U., & Hanapi, U. K.
(2014). Polymerase chain reaction assay targeting cytochrome b gene for the
detection of dog meat adulteration in meatball formulation. Meat Sci, 97(4), 404-
409.
Rahman, M., Ali, M.E., Hamid, S.B.A., Bashu, S., Mustafa, S., Amin, M.A., & Razzak,
M.A. (2015). Lab-on-a-chip PCR-RFLP assay for the detection of canine DNA in
burger formulations. Food Analytical Methods, 8(6), 1598-1606.
Rashid, N. R., Ali, M.E., Hamid, SB.A., Rahman, M. M., Razzak, M.A., Asing, & Amin,
M.A. (2015b). A suitable method to detect a potential fraud of bringing Macaque
monkey meat into the food chain. Food Additives & Contaminants: Part A, 32(7),
1013-1022.
Razzak, M.A, Hamid, S.B.A., & Ali, M.E. (2015). A lab-on-a-chip-based multiplex
platform to detect potential fraud of introducing pig, dog, cat, rat and monkey
meat into the food chain. Food Additives & Contaminants: Part A, 32(11), 1902-
1913.
Regenstein, J.M., Chaudry, M.M., & Regenstein, C.E. (2003). The kosher and halal food
laws. Comprehensive reviews in food science and food safety, 2(3), 111-127.
Rehman, A.U, & Shahbaz, S.M.,(2010). The relationship between religiosity and new
product adoption. Journal of Islamic Marketing, 1(1), 63-69.

178
Riaz, Mian N, & Chaudry, Muhammad M. (2003). Halal food production: CRC press.
https://www.crcpress.com/Halal-Food-Production/Riaz-Chaudry/p/book/
9781587160295
Riccio, F, Mennella, C., & Fogliano, V., (2006). Effect of cooking on the concentration
of Vitamins B in fortified meat products. Journal of pharmaceutical and
biomedical analysis, 41(5), 1592-1595.
Ririe, K.M., Rasmussen, R.P., & Wittwer, C.T. (1997). Product differentiation by
analysis of DNA melting curves during the polymerase chain reaction. Analytical
biochemistry, 245(2), 154-160.
Robinson, J. G., & Bennett, E.L. (2002). Will alleviating poverty solve the bushmeat
crisis? Oryx, 36(04), 332-332.
Robinson, J.G., & Bennett, E.L. (2000). Carrying capacity limits to sustainable hunting
in tropical forests. Hunting for sustainability in tropical forests, 13-30.
Rodríguez, M.A., García, T., González, I., Asensio, L., Hernández, P.E, & Martín, R.
(2004). PCR identification of beef, sheep, goat, and pork in raw and heat-treated
meat mixtures. Journal of Food Protection®, 67(1), 172-177.
Rodriguez, M.A., Garcia, T., Gonzalez, I., Asensio, L., Mayoral, B., López-C, I., Martín,
R. (2003). Identification of goose, mule duck, chicken, turkey, and swine in foie
gras by species-specific polymerase chain reaction. Journal of Agricultural and
Food Chemistry, 51(6), 1524-1529.
Roe, M.T., & Pillai, S.D. (2003). Monitoring and identifying antibiotic resistance
mechanisms in bacteria. Poultry science, 82(4), 622-626.
Rohman, A., Erwanto, Y., & Man, Y.B. C. (2011). Analysis of pork adulteration in beef
meatball using Fourier transform infrared (FTIR) spectroscopy. Meat Science,
88(1), 91-95.
Rojas, M., González, I., Pavón, M.Á, Pegels, N., Hernández, P.E., García, T., & Martín,
R. (2011). Mitochondrial and nuclear markers for the authentication of partridge
meat and the specific identification of red-legged partridge meat products by
polymerase chain reaction. Poultry science, 90(1), 211-222.
Rojas, M., González, I., Pavón, M.A., Pegels, N., Lago, A., Hernández, P.E.,Martín, R.
(2010). Novel TaqMan real-time polymerase chain reaction assay for verifying
the authenticity of meat and commercial meat products from game birds. Food
Additives and Contaminants, 27(6), 749-763.
Russell, D.G., Parnell, W.R., Wilson, N.C., Faed, J., Ferguson, E., Herbison, P., Walker,
R. (1999). NZ food: NZ people. Key results of the 1997 national nutrition survey.
Wellington: Ministry of Health, p71.
Rychlik, W.J.S.W., Spencer, W.J, & Rhoads, R.E. (1990). Optimization of the annealing
temperature for DNA amplification in vitro. Nucleic acids research, 18(21), 6409-
6412.

179
Saddler, J.M., & Horsey, P.J. (1987). The new generation gelatins. Anaesthesia, 42(9),
998-1004.
Saez, R., Sanz, Y., & Toldra, F. (2004). PCR-based fingerprinting techniques for rapid
detection of animal species in meat products. Meat Science, 66(3), 659-665.
Sahoo, N., Manchikanti, P., & Dey, S. (2010). Herbal drugs: Standards and regulation.
Fitoterapia, 81(6), 462-471.
Sakurai, M. (2011). Perspective: herbal dangers. Nature, 480(7378), S97-S97.
Schoeninger, M.J. (2012). Palaeoanthropology: The ancestral dinner table. Nature,
487(7405), 42-43.
Schoppe, S., & Das, I. (2011). Cuora amboinensis (Riche in Daudin 1801)–Southeast
Asian box turtle. Chelonian Research Monographs, 5, 053.051-053.013.
Schoppe, S. (2009). Status, trade dynamics and management of the Southeast Asian box
turtle Cuora amboinensis in Indonesia. TRAFFIC, Southeast Asia. Petaling Jaya,
Selangor, Malaysia
Schoppe, S. (2008a). Science in CITES: the biology and ecology of the Southeast Asian
Box Turtle Cuora amboinensis and its uses and trade in Malaysia: TRAFFIC,
Southeast Asia, Petaling Jaya, Selangor, Malaysia.
Schoppe, S. (2008b). The Southeast Asian box turtle Cuora amboinensis (Daudin, 1802)
in Indonesia. Paper presented at the NDF Workshop Case Studies, Doc. WG.
Schoppe, S. (2008c). The Southeast Asian box turtle Cuora amboinensis (Daudin, 1802)
in Malaysia. Paper presented at the NDF Workshop Case Studies, Doc. WG.
Schrieber, R., & Gareis, H. (2007). Gelatine handbook: theory and industrial practice:
John Wiley & Sons.
Schulz, M. D., Atay, Ç., Heringer, J., Romrig, Franziska K, Schwitalla, S., Aydin, B., et
al.(2014). High-fat-diet-mediated dysbiosis promotes intestinal carcinogenesis
independently of obesity. Nature, 514(7523), 508-512.
See, S.F., Hong, P.K., Ng, K.L., Wan A. W.M., & Babji, A. S. (2010). Physicochemical
properties of gelatins extracted from skins of different freshwater fish species.
International Food Research Journal, 17(3), 809-816.
Sentandreu, M. Á., & Sentandreu, E. (2014). Authenticity of meat products: Tools against
fraud. Food Research International, 60, 19-29.
Sentandreu, Miguel A, Fraser, Paul D, Halket, John, Patel, Raj, & Bramley, Peter M.
(2010). A proteomic-based approach for detection of chicken in meat mixes.
Journal of proteome research, 9(7), 3374-3383.

180
Shackell, G.H. (2008). Traceability in the meat industry–the farm to plate continuum.
International journal of food science & technology, 43(12), 2134-2142.
Sharma, D. S. K. (1999). Tortoise and freshwater turtle trade and utilisation in Peninsular
Malaysia. TRAFFIC Southeast Asia, Petaling Jaya, Malaysia.
Sharma, S. K., Tisen, O B. (2000). Freshwater turtle and tortoise utilization and
conservation status in Malaysia. Asian turtle trade, 2, 120-128.
Shepherd, C. (2014). 19,000 protected tortoises and freshwater turtles seized in Thailand
in 6 Years. [Downloaded on 2016 dec 20]. Available from:
http://annamiticus.com/2014/09/19/19000-protected-tortoises-and-freshwater-
turtles-seized-in-thailand-in-6-years/.
Shepherd, R., Rockey, J., Sutherland, I. W., & Roller, S. (1995). Novel bioemulsifiers
from microorganisms for use in foods. Journal of Biotechnology, 40(3), 207-217.
Shipman, P. (2010). The animal connection and human evolution. Current Anthropology,
51(4), 519-538.
Sim, C.H., Loganathan, M.T., Ramakrishna, S., & Santharamohana, M. (2002). A Guide
to the endangered and endemic flora and fauna of tasek bera ramsar site, Pahang,
Malaysia: Produced by Wetlands International-Malaysia Programme.
Sionneau, P. (1997). Dui Yao: the art of combining Chinese medicinals: Blue Poppy
Enterprises, Inc.
Smil, V. (2002). Eating meat: evolution, patterns, and consequences. Population and
development review, 28(4), 599-639.
Smith, D.M, Desrocher, L.D., Booren, A.M., Wang, C.H., Abouzied, M.M., Pestka, J.J.,
& Veeramuthu, G.J. (1996). Cooking temperature of turkey ham affects lactate
dehydrogenase, serum albumin and immunoglobulin G as determined by ELISA.
Journal of food science, 61(1), 209-212.
Smithers, G., Finch, S., Doyle, W., Lowe, C., Bates, C.J., Prentice, A., & Clarke, P.C.
(1998). The national diet and nutrition survey: people aged 65 years and over.
Nutrition & Food Science, 98(3), 133-134.
Smithers, G., Gregory, J.R., Bates, C.J., Prentice, A., Jackson, L.V., & Wenlock, R.
(2000). The national diet and nutrition survey: young people aged 4–18 years.
Nutrition Bulletin, 25(2), 105-111.
Soares, S., Amaral, J.S., Oliveira, M.B.P.P, & Mafra, I. (2014). Quantitative detection of
soybean in meat products by a TaqMan real-time PCR assay. Meat science, 98(1),
41-46.
Sobhy, H., & Colson, P. (2012). Gemi: PCR primers prediction from multiple alignments.
Comparative and functional genomics, 2012.
Song, H., Buhay, J. E., Whiting, M.F., & Crandall, K.A. (2008). Many species in one:
DNA barcoding overestimates the number of species when nuclear mitochondrial

181
pseudogenes are coamplified. Proceedings of the National Academy of Sciences,
105(36), 13486-13491.
Spinks, P. Q., Thomson, R. C., Zhang, Y., Che, J., Wu, Y., & Shaffer, H. B. (2012).
Species boundaries and phylogenetic relationships in the critically endangered
Asian box turtle genus Cuora. Mol Phylogenet Evol, 63(3), 656-667.
Stanford,C.B., & Bunn, H.T. (2001). Meat-eating and human evolution: Oxford
University Press.
Stanford, C. B. (1999). The hunting apes: Meat eating and the origins of human behavior:
Princeton University Press.
Stanner, S. (2008). Cardiovascular Disease: Diet, Nutrition and Emerging Risk Factors
(The Report of the British Nutrition Foundation Task Force): John Wiley & Sons.
Stewart, James. (2015). Vegetarianism and animal ethics in contemporary Buddhism
(Vol. 16): Routledge.
Still, J. (2003). Use of animal products in traditional Chinese medicine: environmental
impact and health hazards. Complementary therapies in medicine, 11(2), 118-122.
Tamura, K., Peterson, D., Peterson, Nicholas, S., Glen, Nei, M., & Kumar, S. (2011).
MEGA5: molecular evolutionary genetics analysis using maximum likelihood,
evolutionary distance, and maximum parsimony methods. Molecular biology and
evolution, 28(10), 2731-2739.
Tatham, K. C., & Patel, K. P. (2014). Suitability of common drugs for patients who avoid
animal products. BMJ, 348, g401.
Tauxe, R. V. (1997). Emerging foodborne diseases: an evolving public health challenge.
Emerging infectious diseases, 3(4), 425.
Taylor, L. H., Latham, S.M., & Mark, EJ. (2001). Risk factors for human disease
emergence. Philosophical Transactions of the Royal Society of London B:
Biological Sciences, 356(1411), 983-989.
TRAFFIC. (2010). Customs seize tons of reptiles in Malaysia. [Downloaded on 2016 june
20]. Available from: http://www.traffic.org/home/2010/12/24/customs-seize-
tonnes-of-reptilesin-malaysia.html
Triplett, D.A. (1979). Heparin: biochemistry, therapy, and laboratory monitoring.
Therapeutic drug monitoring, 1(2), 173-198.
Turna J,, Bielikova, M.,Domenico P. (2010). Polymerase chain reaction–restriction
fragment length polymorphism (PCR-RFLP) as a molecular discrimination tool
for raw and heat-treated game and domestic animal meats. Journal of Food and
Nutrition Research, 49(3), 134-139.
USDA. (2011). National Nutrient database for standard reference, release 24 (2011).
[Downloaded on 2015 Jun 12] (Available from
http://www.ars.usda.gov/nutrientdata).

182
Vallejo C.B., González, C., Aarón F., Mazorra M.M.A., & Rodríguez R.R, (2005).
Caillary electrophoresis for the analysis of meat authenticity. Journal of
separation science, 28(9‐10), 826-836.
Van, D., Peter, P., Stuart, B. L., & Rhodin, A.G.J. (2000). Asian Turtle Trade:
Proceedings of a Workshop on Conservation and Trade of Freshwater Turtles
and Tortoises in Asia--Phnom Penh, Cambodia, 1-4 December 1999: Lunenburg,
Mass.: Chelonian Research Foundation.
Vannuccini, S. (2004). Overview of fish production, utilization, consumption and trade.
Rome: FAO, Fishery Information, Data, and Statistics Unit.
Varga, A., & James, D. (2006). Real-time RT-PCR and SYBR green I melting curve
analysis for the identification of plum pox virus strains C, EA, and W: effect of
amplicon size, melt rate, and dye translocation. Journal of virological methods,
132(1), 146-153.
Ventura, R.J., Ching, P.K., De l R., Vikki Carr, Sucaldito, M.N., & Tayag, E. (2015).
Chelonitoxism outbreak caused from consuming turtle, Eastern Samar,
Philippines, August 2013. Western Pacific Surveillance and Response Journal,
6(2), 12-16.
Wahab, Norazla A, Shahwahid, Farah M, Hamid, Nor‘Adha Ab, Othman, Norziah, Ager,
Syaripah N Syed, Abdullah, Marliana, Saidpudin, Wawarah. (2016).
Contributions Of Malaysia and Singapore In The Development Of Halal Industry
In The Asean Region. Asian Journal of Social Sciences & Humanities Vol, 5, 2.
WAM. (2016). Halal market to top $3.7 trillion by 2019. The Gulf News. [Downloaded
on 2016 Dec 11]. http://gulfnews.com/gn-focus/special-reports/events/halal-
market-to-top-3-7-trillion-by-2019-1.1664332.
Wang, S., Li, Y., Devinsky, O., Schachter, SC., & Pacia, S. (2005). Traditional chinese
medicine. Complementary and alternative therapies for epilepsy, 177-182.
Wasswa, J., Tang, J., & Gu, X. (2007). Utilization of fish processing by-products in the
gelatin industry. Food Reviews International, 23(2), 159-174.
Whittaker, R.G., Spencer, T.L., & Copland, J.W. (1982). Enzyme‐linked immunosorbent
assay for meat species testing. Australian veterinary journal, 59(4), 125-125.
WHO. (2015). Q&A on the carcinogenicity of the consumption of red meat and processed
meat, World Health Organization, [Downloaded on 2016 Dec 11]. Available
from: http://www.who.int/features/qa/cancer-red-meat/en/.
Williams, P. (2007). Nutritional composition of red meat. Nutrition & Dietetics, 64(4),
S113-S119.
Wong, S.K., Friedman, C.R., Zane, S., & Frederick, J.A. (2003). Reducing transmission
of Salmonella from reptiles to zoo patrons: a cross-sectional study of zoos and
aquariums in the United States. Journal of Herpetology Medicine and Surgery,
13, 11-13.

183
Wood, J.D., Enser, M., Fisher, A.V., Nute, G.R., Richardson, R.I., & Sheard, P.R. (1999).
Manipulating meat quality and composition. Proceedings of the nutrition society,
58(02), 363-370.
Wrangham, R. (2013). The evolution of human nutrition. Current Biology, 23(9), R354-
R355.
WRI. (2000). World Resources Report (2000-2001). People and ecosystems: the fraying
web of life. Washington D.C.World Resources Institute, 389 p. [Downloaded on
2016 Nov 23]. Available from: https://www.wri.org/sites/default/files/pdf
/world_resources_2000-2001_people _and_ecosystems.pdf.
Wu, G. (2009). Amino acids: metabolism, functions, and nutrition. Amino acids, 37(1),
1-17.
Wu, J.H., Hong, P.Y., & Liu, W.T. (2009). Quantitative effects of position and type of
single mismatch on single base primer extension. Journal of microbiological
methods, 77(3), 267-275.
Xia, H., Ma, S.M.M., Wang, S., & Sun, G. (2015). Meta-Analysis of Saturated Fatty Acid
Intake and Breast Cancer Risk. Medicine, 94(52), e2391.
Xie, P., Chen, S., Liang, Y.Z., Wang, X., Tian, R., & Upton, R., (2006). Chromatographic
fingerprint analysis-a rational approach for quality assessment of traditional
Chinese herbal medicine. Journal of chromatography A, 1112(1), 171-180.
Xu, Y.J., Jin, M.L., Wang, L.J., Zhang, A.D., Zuo, B., Xu, D.Q., Li, F.E. (2009).
Differential proteome analysis of porcine skeletal muscles between Meishan and
Large White. Journal of animal science, 87(8), 2519-2527.
Yang, I.K., Young, H.B., J,Y., & Park, S.R., (2005). Use of multiplex polymerase chain
reactions to indicate the accuracy of the annealing temperature of thermal cycling.
Analytical biochemistry, 338(2), 192-200.
Yang, Y. (2010). Chinese herbal formulas: Treatment principles and composition
strategies: Elsevier Health Sciences.
Yirka, B. (2002 ). Anthropologist pushes back date of first humans hunting for meat to
two million years ago, http://phys.org/news/2012-09-anthropologist-date-
humans-meat-million.html.
Yusoff, A.A.M., Ahmad, Farizan, I., Zamzuri, J.H., & Abdullah, J.M., (2015).
Understanding mitochondrial DNA in brain tumorigenesis.
Zambori, C., Cumpanasoiu, C., Mladin, B., & Tirziu, E., (2013). Biofilms in oral cavity
of dogs and implication in zoonotic infections. Scientific Papers Animal Science
and Biotechnologies, 46(1), 155-158.
Zanovec, M., O'Neil, C. E., Keast, D. R., Fulgoni, V. L., & Nicklas, T. A., (2010). Lean
beef contributes significant amounts of key nutrients to the diets of US adults:
National health and nutrition examination survey 1999-2004. Nutrition Research,
30(6), 375-381.

184
Zhang, Y.B., Shaw, P.C., Sze, C.W., Wang, Z.T., & Tong, Y., (2007). Molecular
authentication of chinese herbal materials (Review Article). Journal of Food and
Drug Analysis, 15(1).

185
APPENDIX A
Front Pages of Publication

186

187

188
APPENDIX B
Conferences

189

190
APPENDIX C
Ethical Clearance Letter