short form tool 13 itttm tool #13 short form “statistical foundations for data-based improvement,...
TRANSCRIPT

Short Form Tool 13
ITTTM
Tool #13 Short Form“Statistical Foundations For Data-based Improvement, Lean, Six Sigma Solutions”
Topics1. Focus and benefits of data2. Foundational definitions of quality3. Attributes, defects, defectives4. Inspection, data gathering systems5. Tool applications………

Short Form Tool 13
ITTTM
Focus And Benefits Of Data
Monitors process for team problem solving• Prevention rather than detection• Knowledge based to modify, adjust, correct• Disciplined approach, ongoing improvement• Uniformity decreases nonconformance• Core communication device • Fewer samples, inspection costs reduced• Provides enhanced measure of capability• Enables data based decisions to be made• Less scrap, rework and other waste

Short Form Tool 13
ITTTM
Documentation Tools, Lean
Data Tools, Six Sigma
Service, Tools Manufacturing, Non- Manufacturing
Synchronous Tools, New Product Development
Project Team
Cultural Change And Continuous Improvement
Information Analysis,Communication Systems
Applied Research, Project Structure
Enhanced Problem Solving, Decision Making
Internal, External, E-commerce Relationships
Quality Management Systems (QMS)International Standards Organization (ISO)
Professional Outcomes, Growth, Knowledge
Technological Infrastructure
Industrial Technologists’ Toolkit For Technical Management
Focus And Benefits Of Data

Short Form Tool 13
ITTTM
CharacteristicsAnd StandardsIdentification,
Evaluation
Standard Deviation, SPC DataCollected
Documentation,Process Control
By OperatorsUsing SOP
Brainstorming For
Corrective Action
OngoingImprovement
In Teams
Basic Relationships In Data, SPC, Teams, Documentation, Improvement
Focus And Benefits Of Data

Short Form Tool 13
ITTTM
Tracking, Collecting Data,
Short/Long Runs
Sampling Conformance To Standards
Attribute Data
Variable Data
In-process Control By
Operators ViaForms, SOP’s
Capability Studies And Gage R & R
SOP’s, Ongoing Process Control
Plan (OPCP)
BrainstormingFor Corrective
Action
Bar And Pie Charts, Paretos, Graphs
Cause/Effect, Failure Mode And Effects
Analysis (FMEA)
Disciplined Problem Solving
Ongoing Improvement Teams
Cost Reduction, Enhanced Communication, Competitiveness
Expanded Relationships In Data, SPC, Teams, Documentation, Improvement.
Characteristics And Standards Identification, Evaluation
Standard Deviation, SPC Data Collected
Focus And Benefits Of Data

Short Form Tool 13
ITTTM
0 4 8 12 16 20 24 28
Range Range = 20 - 4 R = 16
Range
Foundational Definitions Of Quality
1046 = 4.6X =
3, 3, 4, 4, 5, 5, 5, 5, 6, 6
Mean

Short Form Tool 13
ITTTM
Normal Curve, Standard Deviation 1 s 2 s 3 s -3 s -2 s -1 s
68.26%
95.46%
99.73%
Lower Spec Limit
Upper Spec Limit
Nominal
Foundational Definitions Of Quality
• +/- 1 standard deviation, 68% of population• +/- 2 standard deviation, 95% of population • +/- 3 standard deviation, 99.7% of population

Short Form Tool 13
ITTTM
Variation: range; variance; standard deviation • Variance is square of standard deviation• Broader look, range, behavior around mean • Standard deviation is total variation at mean
Normal Curve, Standard Deviation 1 s 2 s 3 s -3 s -2 s -1 s
68.26%
95.46%
99.73%
Lower Spec Limit
Upper Spec Limit
Nominal
Foundational Definitions Of Quality

Short Form Tool 13
ITTTM
Example calculation of standard deviation: Data 5, 6, 7, 6, 8 n = 5 X = 6.4
List the Xi List Xi - X List (Xi - X)2
5 - 1.4 1.966 - 0.4 0.167 0.6 0.366 - 0.4 0.168 1.6 2.56 Sum ( ) 5.20
Normal Curve, Standard Deviation
Foundational Definitions Of Quality

Short Form Tool 13
ITTTM
The formula for sample standard deviation is:
= ∑ (Xi - X)2
n -1
Normal Curve, Standard Deviation
= “the sum of”Xi = individual measuresX = averagen = sample sizes, standard deviation
2
n -1s, = ∑(Xi - X)
s, = 5.204
s, =1.30
s, = 1.14
s,
Foundational Definitions Of Quality

Short Form Tool 13
ITTTM
Foundational Definitions Of Quality
Central Tendancy
• Mean or average• Mode or most• Median or position
Inferential Statistics
• Inferences in data • Probabilities
Descriptive Statistics
• Distribution• Range, highs to lows• Tolerance, acceptance range
Defects
• Non-functional• Non-conforming• Varies from specification• Defect may not spoil product• Defect, unacceptable product• Judged as unfit for use
Defective
• Multiple defects• Unacceptable or acceptable• Depends on severity• Customer demands

Short Form Tool 13
ITTTM
Attributes, Defects, Defectives
Attributes Defined
• Not measurable• Good or bad• Judgement calls• May not be gaged• Obvious characteristics• Go, no-go gages
Attribute Examples• Appearance• Texture, touch• Color coordinates• General fit
Variable Defined
• Measurable, such as diameter• Discreet differences• Variation defined precisely• Instrumentation• Defined, detailed characteristics• Objectivity is goal
Variable Examples• Diameter• Length• Cloth density• Surface finish

Short Form Tool 13
ITTTM
Shifting Attribute To Variable Data
Clothing Characteristics
Attribute Characteristics
Variable Characteristics
Overall Appearance
Color Coordinates
Material Texture
General Fit
Length
Diameter
Cloth Density
Cloth Color
Attribute And Variable Clothing Characteristics.
Attributes, Defects, Defectives

Short Form Tool 13
ITTTM
Characteristics, Charting, Data, Foundations
Analyze,
Assess Process
Compare Characteristics
Documentation,
Improvement
Provide, Pursue
Benchmark
Data
Vendor
Certification, Communication
Baseline For Adjustments
Determine
Consistency, Capability
Evaluate For
Standard Procedures
Attributes As Broad Foundational Characteristics’ Relationships.
Attributes, Defects, Defectives

Short Form Tool 13
ITTTM
Quality characteristics are important features
• Defined by customer• Refined by engineering and design groups• Variable or attribute data • Explained in context of print, notes• Characteristics may be ranked by importance• Goal is to further define a characteristic• Use characteristic as a measure for quality• Continuously evaluating characteristics• Shift from attribute to variable data over time
Attributes Identified, Inspection, Start For Charting
Inspection, Data Gathering Systems

Short Form Tool 13
ITTTM
Freq-uency
Of Occur-rence
20 42
% Of Total Occur-rence
%
General Shape Of Chart Is Constant, But Frequency And % Values Shift To Present Relationships Inherent In Facts Being Shown.Pareto Is Often Done Early In Analyses, Piggy-Backed On Histograms. It Is Used To Show Areas Needing Attention Versus Those We Can Postpone. Thus It Is A Good Decision Tool.
18 38
16 34
14 30
12 26
10 21
8 17
6 13
4 9
2 5
0 1
Shade Columns To Show Differences Among FindingsRank Findings From Highest To Lowest And Left To Right
High RPM Squeal
Noise Level
Finish Blemishes
Too Heavy
Availability
% Of Occurrences Is For Each Attribute Relative To Total Of All Occurrences.Chart Can Be Expanded To Show Unlimited Numbers Of Attributes
Histograms, Bar, Pie, Pareto Charts, ChecklistsInspection, Data Gathering Systems

Short Form Tool 13
ITTTM
Histograms, Bar, Pie, Pareto Charts, ChecklistsWork function:
Date ofObservation
Talking Idle, Not AtWork Area
Walking Idle, Work Station
Other Non- Productive
GeneralObservations
Part: Reviewed By: General Inspection Description:
Supplier: Gage/Device:
Operation: Characteristic:
No. Date Operator Run Quantity
Sample Size
Number Rejected
Number Accepted
Corrective Actions
1
2
……Forms The Base For The Inspection System
Inspection, Data Gathering Systems

Short Form Tool 13
ITTTM
Attributes Identified, Inspection, Start For ChartingInspection, Data Gathering Systems
Operation: Example Part: Example Characteristic/Attributes: Shape, Color, Buldge, Rip
Operator: Example
Shape
Color
Buldge
Rip General Corrective Actions/Other:
Location: Example
# SampleSize (n)
NumberDef.(np)
Explanations/Reasons For Rejects:
1 60 10 5 1 3 1
2 60 7 4 1 2
3 60 6 2 2 2
4 60 5 3 1 1
5 60 9 5 3 1
6 60 8 2 2 2 2
7 60 8 3 4 1
8 60 11 5 4 2
9 60 12 5 3 3 1
10 60 7 4 3

Short Form Tool 13
ITTTM
Tool Applications…….
Tool 13 applications are:• VSPC, introduced, continuously built, not just at start• PASPC also introduced, built gradually, evolved• Documentation System Design, Communication, DSDC• ISOQSAOPP, designed to help set a plan for team• GOTA, vacabulary, glossary of terms• All follow through, do and post, independently
Toolkit applications are a key part of the courseware• Located in separate folder of the CD• Provides the template for team portfolio• Each application s part of team project, portfolio• Designed to be done by all, each team member• First read long form, then short review, applications• Total contribution in application form is compiled• Portfolio is gradually evolved around applications
Short Form Tool 13
ITTTM
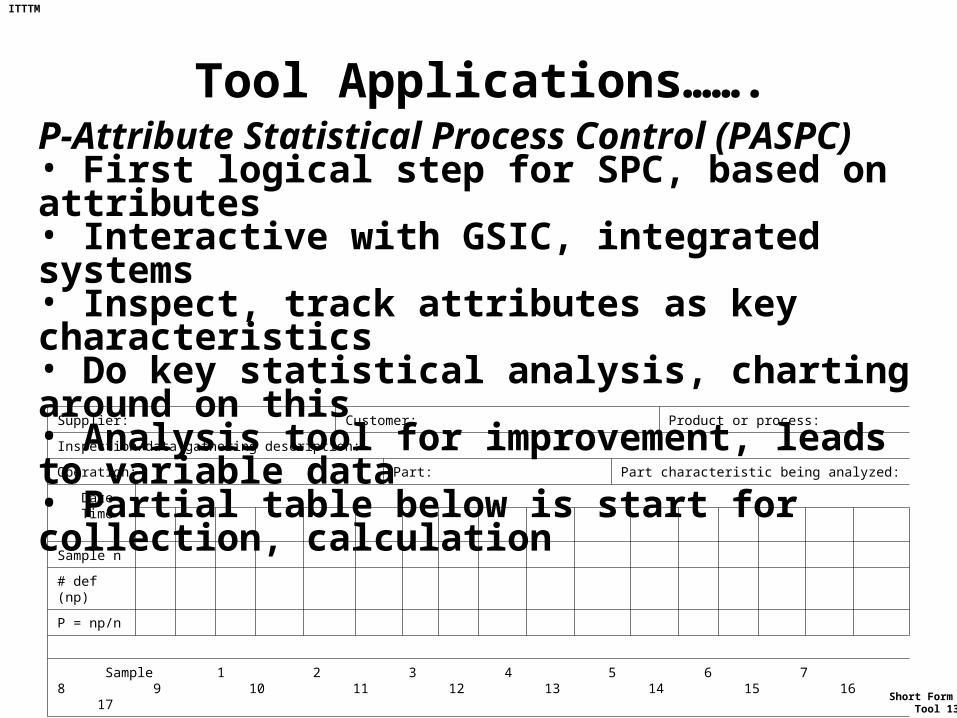
Tool Applications…….P-Attribute Statistical Process Control (PASPC)• First logical step for SPC, based on attributes• Interactive with GSIC, integrated systems• Inspect, track attributes as key characteristics• Do key statistical analysis, charting around on this• Analysis tool for improvement, leads to variable data• Partial table below is start for collection, calculation
Supplier: Customer: Product or process:
Inspection/data gathering description:
Operation: Part: Part characteristic being analyzed:
Date Time
Sample n
# def (np)
P = np/n
Sample 1 2 3 4 5 6 7 8 9 10 11 12 13 14 15 16 17

Short Form Tool 13
ITTTM
Tool Applications…….Variable Statistical Process Control (VSPC)• Interactive with, base for, most other statistical systems• Inspect, track key characteristics, document process• Do key statistical analysis, charting around on this• Analysis tool for improvement, leads to variable data• Partial table starts continuous development in project
Part: Operator: Inspection, Data Gathering Description (Attach Pertinent Information):
Characteristic: Operation:
Date Time
MeasureValue
1
2
3
4
5
Sum
Average
Range
Calculate Grand Mean or X Double Bar = All Averages Summed/n
Calculate UCL = X Double Bar + (A2) (R Bar); Calculate LCL = X Double Bar – (A2) (R Bar) Where A2 = .58 Constant
Calculate R Bar = All Ranges Summed/n
Calculate UCL R = (D4) (R Bar); And LCL R = (D3) (R Bar) Where D3 = 0 And D4 = 2.11 Constants
Configure Graphs To Accommodate Values Calculated, And To Fit Within Work Areas, Illustrating Process
Sample 1 2 3 4 5 6 7 8 9 10 11 12 13 14 15 16 17 18

Short Form Tool 13
ITTTM
Tool Applications…….Glossary Of Terms, Applications (GOTA)• Continuously added to over entire course, by all• Helps enhance vocabulary, get all on same page• Terms are in toolkit, various parts, not just this course• A sampling of the form (partial) is shown……..
Provide A Definition For Each Term Identified, Explain How Your Team Will Apply The Concepts, Principles To Your Project:
Ongoing Process Control Plan:
Corrective Action System:
QFD:
Pareto Analysis:
Statistical Process Control:
Variable Measurement, Charting:
Attribute Measurement, Charting:
Capability:
Mean, Range:
Gage Repeatability & Reproducibility:
Normal Curve:

Short Form Tool 13
ITTTM
Tool Applications…….ISO/QS Audit, Objective Prioritization Plan (ISOQSAOPP)• Preliminary plan, setup of assessments, work for team• Familiarize with ISO, auditing, all on same page, terms• Strategic planning, team level, change and improvement• Project 50% done when “problem” nailed down• “hot spots” focus, project objectives, gradually PPDPOA• Gantt from SDA form or template, for time, sequence• Partial form is shown……..
Organization Under Discussion: Current Operation: Location:
General Description Of Operations/Production Functions/Systems Being Assessed As An Internal Audit:
ISO/QS Element (TS 16949 2002—Others) Technical Function Description Audit Preliminary Information Actions, Recommendations For Change
(list each element separately for analysis/audit)
(describe technical function being audited) (How does function compare to standard) (explain anticipated necessary actions, changes)
Planning Statement Or Issue, Particularly As Associated With The Service Environment: Criticality Level: HML (H = 5; M = 3; L = 1)
Fac = Facility issues; Cost = Cost issues; Time = Time issues; Pers = Personnel issues
Objectives Prioritized, 5 Being Highest: Criticality HML
Fac Cost Time Pers
5, 4, 3, 2, 1
Problem Background: Resources? (Budget/Other Concerns)?
Task/Deliverable/Objective: Who Will Do? How Measured?

Short Form Tool 13
ITTTM
Tool Applications…….
Documentation System Design, Communication (DSDC)• Initial design, plan for how the team will work• Given that all work is about communications…….• Documentation is blackboard is critical• Must consider initially how this will happen, DSDC• DSDC provides opportunity to reflect on, discuss
Researcher Communication Method, Internal And External Customers:
Toolkit/Blackboard Design Element, How Does It Work?
How To Improve Professional Relationships, Communication?
1. 1. 1. 1.
Identify How The Systems’ Design You Are Advocating Can Assist IN Tieing Together PPDPOA, TPMSS, FACR, TRIRPA And Other Elements Of Team Problem Solving And Improvement:
Explain ISO/QS Characteristics And Other Necessary Entities To Be Possessed By Documentation And Communication Systems, Categorically, Particularly Focused On Service Functions:
Using The Template At The End Of The Applications Complete A Cause And Effect Diagram Indicating Issues And Opportunities For Systemic Documentation Relationships/Improvements, Particularly Focused On Service Functions:
Identify And Explain Why Your Organization Is Well Suited To The Documentation And Communication System Being Developed, Particularly Focused On Service Functions: