shore capital group limited · shore capital group limited ... commenting on the results, howard...
TRANSCRIPT
Annual Report and Accounts 2016
Sho
re Cap
ital Gro
up Lim
ited Annual R
eport and A
ccounts 2016
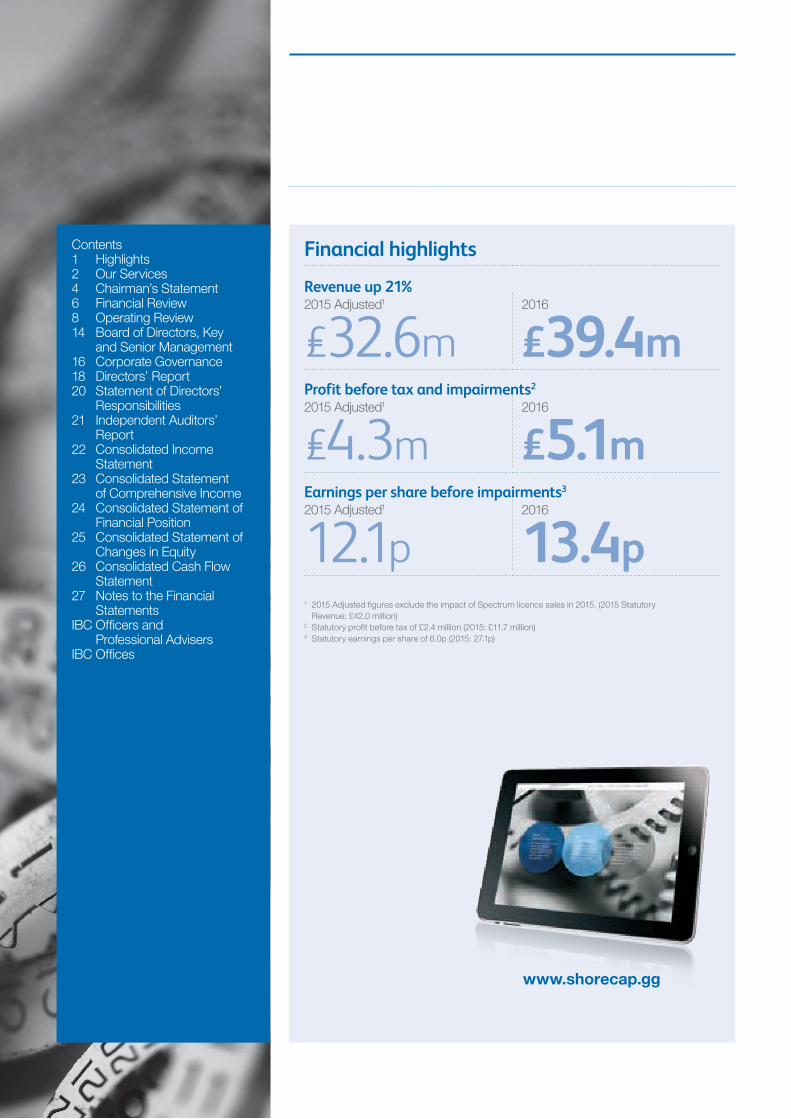
Financial highlights
Revenue up 21% 2015 Adjusted1
£32.6m2016
£39.4mProfit before tax and impairments2 2015 Adjusted1
£4.3m2016
£5.1mEarnings per share before impairments3 2015 Adjusted1
12.1p2016
13.4p1 2015 Adjusted figures exclude the impact of Spectrum licence sales in 2015. (2015 Statutory
Revenue: £42.0 million) 2 Statutory profit before tax of £2.4 million (2015: £11.7 million) 3 Statutory earnings per share of 6.0p (2015: 27.1p)
Contents1 Highlights2 Our Services4 Chairman’s Statement6 Financial Review8 Operating Review14 Board of Directors, Key
and Senior Management 16 Corporate Governance 18 Directors’ Report 20 Statement of Directors’ Responsibilities 21 Independent Auditors’ Report 22 Consolidated Income Statement 23 Consolidated Statement
of Comprehensive Income 24 Consolidated Statement of Financial Position 25 Consolidated Statement of Changes in Equity 26 Consolidated Cash Flow Statement 27 Notes to the Financial Statements IBC Officers and
Professional Advisers IBC Offices
www.shorecap.gg
Commenting on the results, Howard Shore, Executive Chairman, said:
“Despite the market uncertainty immediately pre-and-post the Brexit vote, and the period leading up to the US Presidential election, I am delighted by the performance of our Capital Markets business and the strong progress made in our Asset Management division.
“We have seen companies wanting to get on with growing their businesses and institutions that want to buy into them. That cannot happen in a vacuum, demonstrating that markets are again open for business, focusing on the fundamentals of the deal, rather than market participants sitting on their hands and worrying about uncertainty.
“Having led the Group’s growth and development for 32 years I am relinquishing my operational responsibilities as Group Chief Executive whilst remaining Chairman to focus on our international investment strategy, including developing new relationships as well as investment opportunities. Simon Fine and David Kaye have worked closely with me for many years and I am delighted that they have agreed to lead the Group’s future development as Joint Chief Executives. Our independence puts us in an ideal place to make the most of the opportunities that will arise as market conditions improve.”
1Shore Capital Group Limited Annual Report and Accounts 2016
Highlights 2016
Operational highlights• Capital Markets advised on four IPOs, the
largest AIM fundraise of 2016 for Sirius Minerals plc and Poundland Group plc’s £600 million takeover by Steinhoff International
• Won 11 new clients, including Dairy Crest Group plc, Chesnara plc, Stride Gaming plc and Earthport plc
• Puma Investments again achieved the largest limited life VCT fundraising of the tax year (over half of the total raised in its category)
• Puma AIM Inheritance Tax Service named Best AIM Investment Manager at 2016’s Growth Investor Awards
2 Shore Capital Group Limited Annual Report and Accounts 2016
Our Services
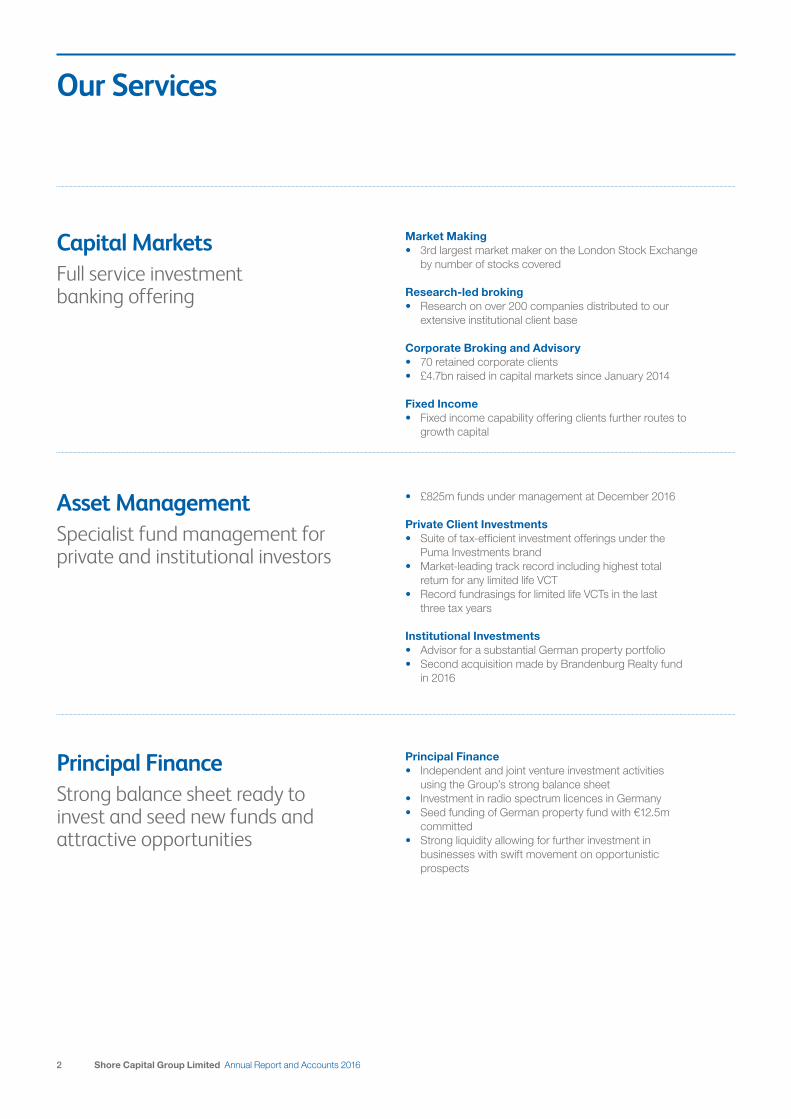
Capital MarketsFull service investment banking offering
Market Making• 3rd largest market maker on the London Stock Exchange
by number of stocks covered
Research-led broking• Research on over 200 companies distributed to our
extensive institutional client base
Corporate Broking and Advisory• 70 retained corporate clients• £4.7bn raised in capital markets since January 2014
Fixed Income• Fixed income capability offering clients further routes to
growth capital
Asset ManagementSpecialist fund management for private and institutional investors
• £825m funds under management at December 2016
Private Client Investments• Suite of tax-efficient investment offerings under the
Puma Investments brand• Market-leading track record including highest total
return for any limited life VCT• Record fundrasings for limited life VCTs in the last
three tax years
Institutional Investments• Advisor for a substantial German property portfolio• Second acquisition made by Brandenburg Realty fund
in 2016
Principal FinanceStrong balance sheet ready to invest and seed new funds and attractive opportunities
Principal Finance• Independent and joint venture investment activities
using the Group’s strong balance sheet• Investment in radio spectrum licences in Germany• Seed funding of German property fund with €12.5m
committed• Strong liquidity allowing for further investment in
businesses with swift movement on opportunistic prospects
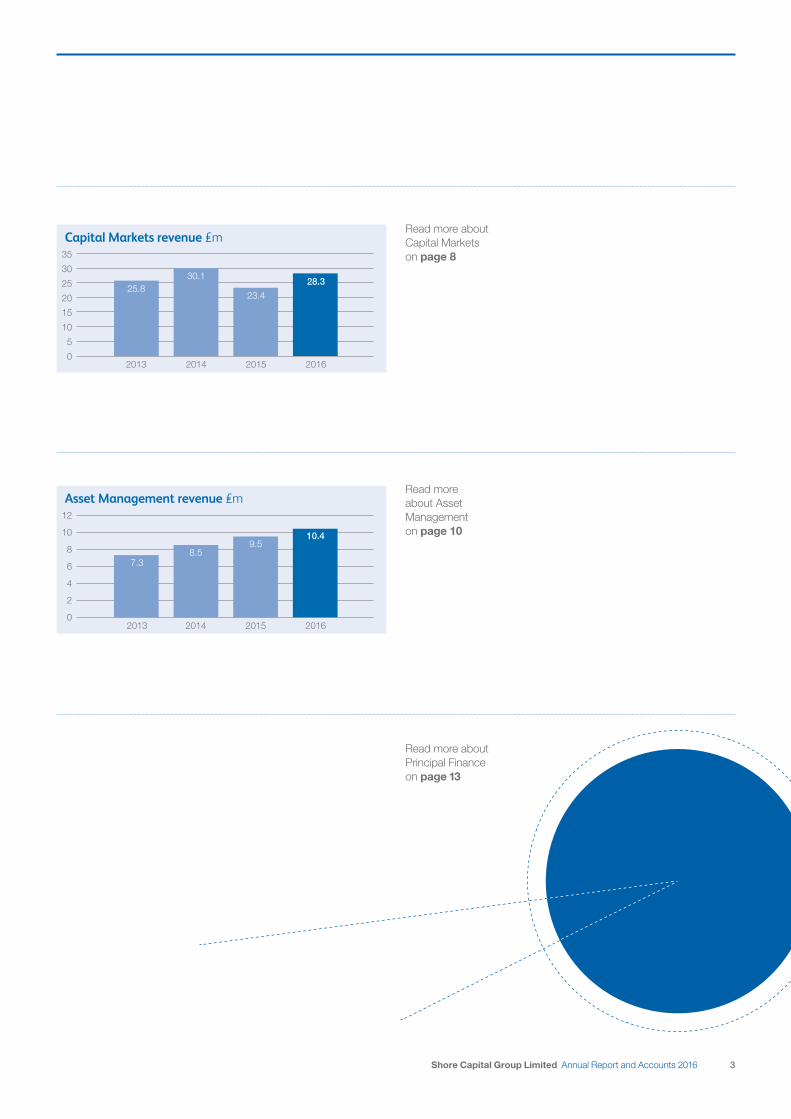
Capital Markets revenue £m
2013 2014 2015 2016
25.830.1
23.4
28.3
0
5
10
15
20
25
30
35
0
2
4
6
8
10
12
Asset Management revenue £m
2013 2014 2015
7.38.5
9.5
2016
10.4
3Shore Capital Group Limited Annual Report and Accounts 2016
Read more about Capital Markets on page 8
Read more about Asset Management on page 10
Read more about Principal Finance on page 13
On a reported basis the Group’s performance includes the year-on-year comparison of 2015, during which it sold German spectrum licences. Setting the licence sale to one side, Group revenues grew by 21% to £39.4 million.
Of particular note is the excellent performance in our Capital Markets business, where revenues grew 21% to £28.3 million; profits rose 45% to £6.8 million; and net margins increased to 24%. This performance was driven by the addition of 11 new retained corporate clients, including Dairy Crest Group plc; and the team’s work on an array of capital markets transactions, including four IPOs, the largest AIM fundraise of 2016 for Sirius Minerals plc, and advising Poundland Group plc on its £600 million takeover by Steinhoff International.
The range and complexity of work our Capital Markets team has undertaken during the year results from its ability to exploit market opportunities arising in a challenging environment, as bigger banks focused on the implications of Brexit. Looking ahead, we believe there will continue to be high-quality opportunities where our service-orientated approach will prove to be attractive to more clients.
Having positioned our business to benefit from improving market conditions, we are continually exploring new ways to develop our proposition. As the quantity of equity capital markets research decreases in future, it is clear that the demand for high-quality investment opportunities and valuable ideas will only increase. Accordingly, during the year we committed additional resources to our research and distribution capabilities, enhancing our coverage across a number of industries.
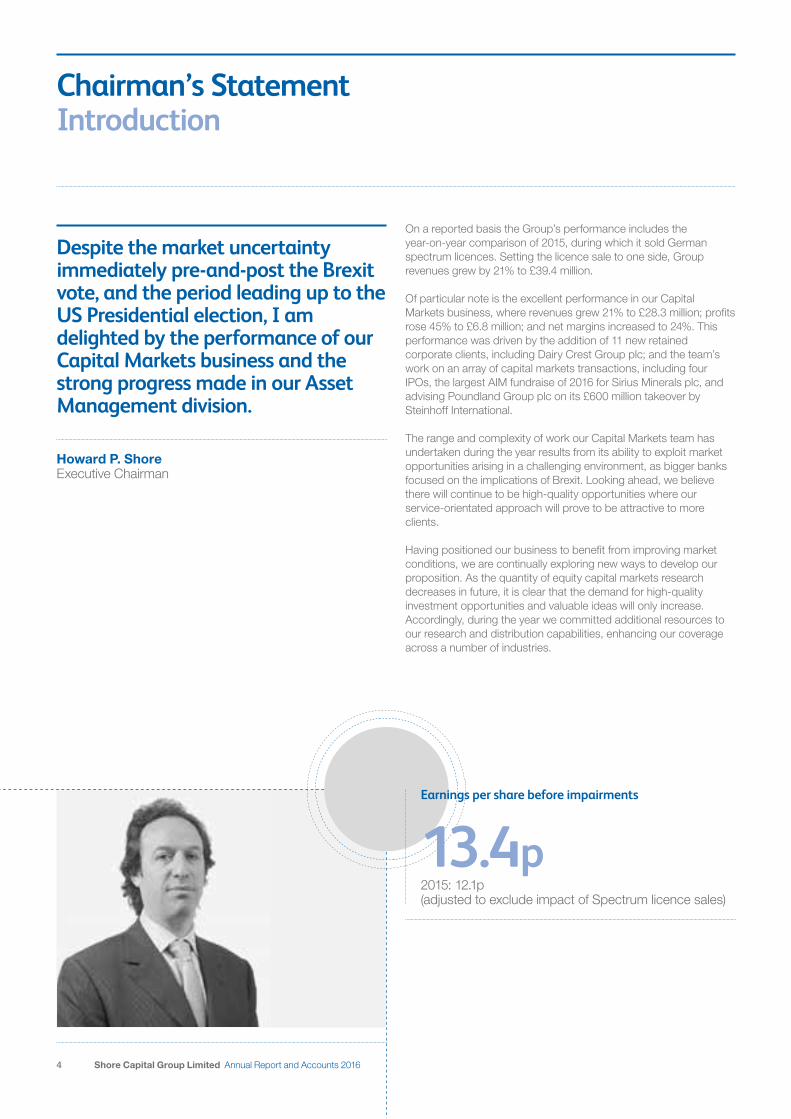
Despite the market uncertainty immediately pre-and-post the Brexit vote, and the period leading up to the US Presidential election, I am delighted by the performance of our Capital Markets business and the strong progress made in our Asset Management division.
Howard P. ShoreExecutive Chairman
4 Shore Capital Group Limited Annual Report and Accounts 2016
Chairman’s Statement Introduction
Earnings per share before impairments
13.4p2015: 12.1p (adjusted to exclude impact of Spectrum licence sales)

In a year of significant market volatility driven by geopolitical events, the Group’s market making operation performed strongly, providing significant liquidity in the immediate aftermath of the Brexit referendum and US election results. The team grew both revenues and profits by double-digit percentages, reinforcing our position as the third largest market maker on the London Stock Exchange.
Our Asset Management business grew revenues by 10% to £10.4 million and whilst our investment in the business led to lower profits of £2.0 million and a net margin of 19%, we have increased the team’s capabilities and capacity, enabling the business to implement the next stage of its growth strategy.
The Private Client division increased funds under management to £200 million (2015: £155 million), again achieving a record-breaking £31 million fundraise for Puma VCT 12, as well as securing and allotting significant inflows to the Puma EIS Service, which is approaching £50 million under management. Puma Heritage and the Puma AIM Inheritance Tax Service celebrated their third and second anniversaries respectively, both continuing to deliver impressive returns for investors, with the latter being named Best AIM Investment Manager at 2016’s Growth Investor Awards.
In Institutional Asset Management, Brandenburg Realty completed its second investment. Using Shore Capital’s advisory services, it is focused on developing its existing portfolio and seeking new acquisition opportunities. At Puma Brandenburg, the Group assisted with a number of disposals and continued to look for new ways to optimise capital resources and actively manage its asset base.
In Principal Finance, we incurred a £2.7 million pre-tax write down of various assets during the year, which equated to £1.6 million after tax and minority interests. These impairments relate to reassessments of the fair value of various Group assets at the year end. Elsewhere in the division, DBD continues to hold its remaining 32 regional radio spectrum licences which cover many of Germany’s largest metropolitan centres. An initial pilot utilising a temporary licence has commenced in Berlin.
Finally, as announced separately, I am relinquishing my operational responsibilities as Group Chief Executive and these will be taken over by Simon Fine and David Kaye as joint Chief Executive Officers. I will continue as Chairman of the Group, focusing on our international investment strategy, including developing new relationships as well as investment opportunities.
Having led the Group’s growth and development for 32 years I am extremely excited by the favourable environment for our operating businesses. Simon and David have worked closely with me for many years and I am delighted that they have agreed to lead the Group’s future development.
5Shore Capital Group Limited Annual Report and Accounts 2016
50
40
30
20
10
0
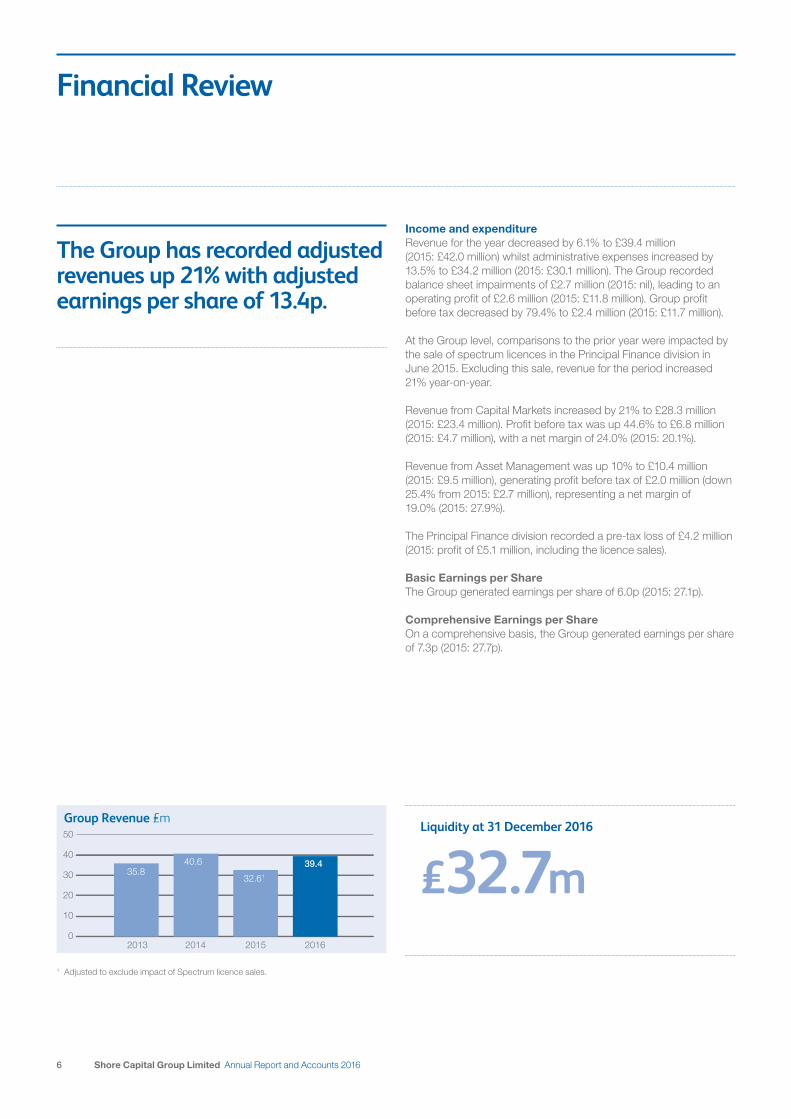
Group Revenue £m
2013 2014 2015
32.61
2016
39.435.8
40.6
6 Shore Capital Group Limited Annual Report and Accounts 2016
Financial Review
Income and expenditureRevenue for the year decreased by 6.1% to £39.4 million (2015: £42.0 million) whilst administrative expenses increased by 13.5% to £34.2 million (2015: £30.1 million). The Group recorded balance sheet impairments of £2.7 million (2015: nil), leading to an operating profit of £2.6 million (2015: £11.8 million). Group profit before tax decreased by 79.4% to £2.4 million (2015: £11.7 million).
At the Group level, comparisons to the prior year were impacted by the sale of spectrum licences in the Principal Finance division in June 2015. Excluding this sale, revenue for the period increased 21% year-on-year.
Revenue from Capital Markets increased by 21% to £28.3 million (2015: £23.4 million). Profit before tax was up 44.6% to £6.8 million (2015: £4.7 million), with a net margin of 24.0% (2015: 20.1%).
Revenue from Asset Management was up 10% to £10.4 million (2015: £9.5 million), generating profit before tax of £2.0 million (down 25.4% from 2015: £2.7 million), representing a net margin of 19.0% (2015: 27.9%).
The Principal Finance division recorded a pre-tax loss of £4.2 million (2015: profit of £5.1 million, including the licence sales).
Basic Earnings per ShareThe Group generated earnings per share of 6.0p (2015: 27.1p).
Comprehensive Earnings per ShareOn a comprehensive basis, the Group generated earnings per share of 7.3p (2015: 27.7p).
The Group has recorded adjusted revenues up 21% with adjusted earnings per share of 13.4p.
Liquidity at 31 December 2016
£32.7m
1 Adjusted to exclude impact of Spectrum licence sales.
7Shore Capital Group Limited Annual Report and Accounts 2016
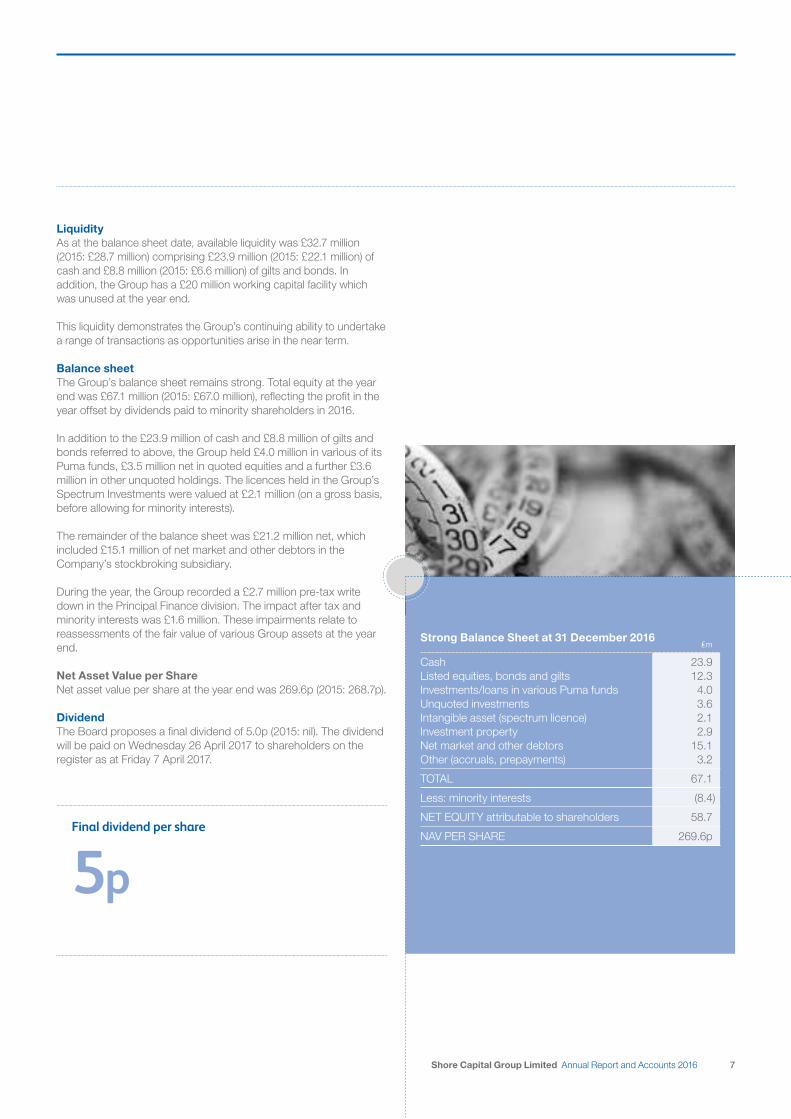
LiquidityAs at the balance sheet date, available liquidity was £32.7 million (2015: £28.7 million) comprising £23.9 million (2015: £22.1 million) of cash and £8.8 million (2015: £6.6 million) of gilts and bonds. In addition, the Group has a £20 million working capital facility which was unused at the year end.
This liquidity demonstrates the Group’s continuing ability to undertake a range of transactions as opportunities arise in the near term.
Balance sheetThe Group’s balance sheet remains strong. Total equity at the year end was £67.1 million (2015: £67.0 million), reflecting the profit in the year offset by dividends paid to minority shareholders in 2016.
In addition to the £23.9 million of cash and £8.8 million of gilts and bonds referred to above, the Group held £4.0 million in various of its Puma funds, £3.5 million net in quoted equities and a further £3.6 million in other unquoted holdings. The licences held in the Group’s Spectrum Investments were valued at £2.1 million (on a gross basis, before allowing for minority interests).
The remainder of the balance sheet was £21.2 million net, which included £15.1 million of net market and other debtors in the Company’s stockbroking subsidiary.
During the year, the Group recorded a £2.7 million pre-tax write down in the Principal Finance division. The impact after tax and minority interests was £1.6 million. These impairments relate to reassessments of the fair value of various Group assets at the year end.
Net Asset Value per ShareNet asset value per share at the year end was 269.6p (2015: 268.7p).
DividendThe Board proposes a final dividend of 5.0p (2015: nil). The dividend will be paid on Wednesday 26 April 2017 to shareholders on the register as at Friday 7 April 2017.
Final dividend per share
5p
Strong Balance Sheet at 31 December 2016£m
Cash 23.9Listed equities, bonds and gilts 12.3Investments/loans in various Puma funds 4.0Unquoted investments 3.6Intangible asset (spectrum licence) 2.1Investment property 2.9Net market and other debtors 15.1Other (accruals, prepayments) 3.2
TOTAL 67.1
Less: minority interests (8.4)
NET EQUITY attributable to shareholders 58.7
NAV PER SHARE 269.6p

No.1 Insurance2016
No.1 Banks & FinancialServices
2016
THOMSON REUTERSANALYST AWARDS2016 WINNER
8 Shore Capital Group Limited Annual Report and Accounts 2016
Operating Review
Capital MarketsOverviewDespite a turbulent geopolitical environment, the Capital Markets division performed strongly in 2016, increasing revenues by 21% to £28.3 million. The year saw the business grow its client base, develop its service offering and act on a significant number of high-profile transactions. The team participated in four IPOs and a large number of transformational fundraisings for its growing client base, to which 11 new, retained corporate clients were added during the year. Particular highlights included acting on the largest AIM fundraise of 2016, for Sirius Minerals plc; and advising Poundland Group plc on its £600 million takeover by Steinhoff International. Additional investment has been made to augment our research and distribution proposition, enhancing our sector coverage across a number of industries during the year. The high quality of our research product continued to gain recognition during the year, scoring strongly with clients and in external surveys, such as Extel and Starmine. Our Market Making and Fixed Income businesses have performed very well in the face of substantial market uncertainty, delivering increased levels of revenue and profitability and providing key sources of liquidity in turbulent times. The business remains alive to opportunities and will continue to invest in high calibre individuals and teams where the Company identifies opportunities for incremental growth.
Corporate Broking and AdvisoryDuring 2016, the team has continued to be very active and participated in four IPOs, 20 secondary fundraisings and a number of significant transactions including:
• sole sponsor and joint bookrunner to Chesnara plc on its £70 million placing and open offer to fund the €160 million acquisition of L&G Netherland;
• joint bookrunner to John Menzies plc on its £75 million rights issue to fund the US$202 million acquisition of ASIG from BBA Aviation plc;
• co-lead manager on the £370 million placing and open offer equity element of Sirius Minerals plc’s US$1.2 billion stage one financing, the largest fundraise on AIM in 2016;
• co-bookrunner on the Main Market IPO of Motorpoint Group plc, raising £100 million;
• co-lead manager on a placing by Playtech plc, raising £329 million;
• joint bookrunner on a placing by Vernalis plc, raising £40 million; • joint bookrunner on the £27 million placing by Stride Gaming plc
to fund the acquisition of Tarco, Netboost Media and 8Ball;• sponsor and joint bookrunner to two placings by NextEnergy
Solar Fund Limited, raising £115 million and £42 million; • joint bookrunner on the €23 million placing of founder stock by
Applegreen plc; and• nominated adviser and sole broker on the IPOs of Cerillion plc
and Yü Group plc and nominated adviser and joint broker on the IPO of Amryt Pharma plc.
Our advisory work included acting as joint financial adviser and joint broker to Market Tech Holdings Limited in connection with its move from AIM to the Main Market and as corporate broker to Poundland Group plc in connection with its £600 million takeover by Steinhoff International.
We continue to attract high quality corporate clients, adding 11 new retained corporate clients in the year, including Dairy Crest Group plc, Chesnara plc, Motorpoint Group plc; Stride Gaming plc, and Earthport plc.
Increase in Capital Markets revenue
21%

9Shore Capital Group Limited Annual Report and Accounts 2016
Research and SalesEquity capital markets continue to evolve within the context of considerable macro-economic, political and industry-specific change, not least the forthcoming implementation of MiFID II. In these respects it is pleasing to see that the high calibre of our equity research retains its relevance to portfolio managers and the broader corporate community alike.
During the year we carefully grew the team, expanding our coverage and capabilities, adding stock coverage in building materials, healthcare, industrials, media and technology. The team’s stability and experience continued to resonate with the asset management community, reflected in strong internal voting scores from our clients and continuing excellent positions in the Extel and Starmine surveys, where person-for-person we punch materially above our weight.
Looking to the future, we remain confident in our team’s capabilities to compete and ultimately further expand our coverage, reach and corporate client base. In this respect, our stock execution function will evolve from its firm foundations so that it continues to offer value and relevance to clients, whilst focusing research coverage and capabilities where it can have the most beneficial impact. Market MakingIn a year of significant market volatility driven by geopolitical events, the Group’s market making operation performed strongly, growing both revenues and profits by double-digit percentages. Trading volumes were 12% higher than in 2015, a commendable result considering the market uncertainty that prevailed throughout the year.
The team positioned its inventory prudently during the year, enabling us to provide significant liquidity in the immediate aftermath of the Brexit referendum and US election results. This approach, reflected in the wide variety of equities to which we provide access, enabled us to reinforce our position as the third largest market maker on the London Stock Exchange.
Although clearly sensitive to the overall market environment, Shore Capital remains focused and adaptable to changes in trading conditions and to the needs of clients. Market making operations continue to benefit from the team’s wide stock coverage and its reputation as a strong and trusted counterparty. The market making team comprises highly experienced traders who are able to identify revenue opportunities despite challenging market conditions, whilst operating within a risk framework that ensures loss days are a rare occurrence.
Fixed IncomeThe fixed income team’s extensive experience enables the Group to offer its clients a fuller range of financing options for mid-sized corporates, creating exciting opportunities for growth in the Capital Markets business. The team enjoyed its first full year within the Group, having joined from Edmond de Rothschild in late 2015, and made a positive contribution to the business in what has been a challenging environment, demonstrating its capability to grow primary capital opportunities for clients.
A leading capability amongst London brokers• Leading edge trading platform connecting to multiple
MTFs, dark pools and crossing networks • London Stock Exchange statistics show us as the third
largest market maker on the LSE by number of stocks covered. We currently cover 1,400 stocks
• Large highly regarded team processing several thousand trades a day
• Retained clients are supported by an experienced dedicated corporate market making team
• Established electronic distribution network providing service to c.150 brokers, leading UK institutions and hedge funds
• Direct electronic links to all leading retail brokers including:
• Direct electronic links to major institutions
10 Shore Capital Group Limited Annual Report and Accounts 2016
Operating Review continued
Asset Management OverviewThe Asset Management division enjoyed notable successes during the period across its institutional and private client businesses such that during the year total assets under management grew from £770 million to £825 million.
In the institutional business, our German advisory team assisted Brandenburg Realty in the completion of its second acquisition for €32 million; and helped Puma Brandenburg to complete a €90 million refinancing. The team also helped Puma Brandenburg to advance the implementation of its strategic objectives, particularly with the sale of its housing estate in Neukoelln and progress development works at its flagship Hyatt Regency Hotel in Cologne.
The Private Client division increased funds under management to £200 million (2015: £155 million), again achieving a record-breaking fundraise for its latest VCT, Puma VCT 12, as well as securing and allotting significant inflows to the Puma EIS Service, which is approaching £50 million under management. Puma Heritage and the Puma AIM Inheritance Tax Service celebrated their third and second anniversaries respectively, both continuing to deliver impressive returns for investors.
During the course of the year we continued our commitment to invest in the business, hiring several key personnel, particularly in the Private Client division, adding to its investment and business development teams as it continues implementing its growth strategy.
Institutional Asset ManagementBrandenburg RealtyIn line with its strategy to invest in German residential and commercial real estate, Brandenburg Realty (the “Fund”) completed its second acquisition in May 2016 of a €32 million commercial and residential portfolio located in the city of Potsdam near Berlin. This portfolio benefits from high quality commercial tenants and the possibility to develop additional residential space. The asset advisory team continues to seek and recommend additional acquisition opportunities for the Fund, helping it to implement the agreed strategy for this asset and also for the Monumenten Strasse residential building, which was acquired in the prior period. At this asset, the team assisted in the sale of five apartments, achieving an average price per square metre significantly in excess of expectations.
Puma Brandenburg Limited (“PBL”) The Group has continued to assist PBL to achieve success across its portfolio, including:
• the sale of the Sonnensiedlung housing estate located in Neukoelln, Berlin through a share sale in July 2016;
• the planning and execution of a capital project to add and enlarge conference and food and beverage facilities at the Hyatt Regency, Cologne. These works, which are co-funded by Hyatt, commenced in June 2016 and were completed on schedule at the end of November 2016;
• as previously reported, the successful drawdown in June 2016 of an eight year, €90 million loan facility for the refinancing of a commercial portfolio. The portfolio includes the Hyatt Regency Cologne and IBIS Nuremberg.
St Peter Port Capital (“SPPC”)SPPC announced its interim results for the six months ended 30 September 2016 on 26 October 2016. As at that date, excluding investments written off, it had investments in 17 companies and reported that it had generated £161,000 from realisations since 1 April 2016.
Prior to the release of its results, the company had announced that it was launching a review of the strategic options available to it, including a potential sale of the company. Accordingly, the company entered an offer period, enabling any potentially interested parties to approach it without having to make any formal announcement.
The strategic review was launched in order to stimulate liquidity in what remains a challenging market for its portfolio companies. It reported its view that any significant cash return is predicated on one or more of its top five holdings progressing to the next planned phase of growth, which for several of them relies on their raising significant further funds.
Assets under management
£825m
11Shore Capital Group Limited Annual Report and Accounts 2016
Private Client InvestmentsOverviewThe Group’s private client business, Puma Investments, continues to make strong progress. During the year the company invested in the next phase of its growth, hiring key personnel to expand its capabilities.
Of particular note was the launch of Puma VCT 12, which closed in 2016 having raised £31 million – accounting for more than half of the total funds raised in the limited-life VCT market in the 2015/16 tax year. In addition, we have seen continued expansion of Puma EIS, Puma Heritage and the Puma AIM Inheritance Tax Service. We were particularly proud that the strong performance of the AIM service was recognised by the industry and named Best AIM Investment Manager at 2016’s Growth Investor Awards.
Puma Venture Capital Trusts (“VCTs”)The Group’s Puma VCTs are each limited-life vehicles, aiming to distribute the initial capital and returns to their investors after five years. Since 2005 over £223 million has been raised for Puma VCTs and more than £89 million has been distributed back to shareholders.
Puma’s strong VCT track record is reflected in the fact that each of the first five Puma VCTs have led their peer group for total returns, with Puma VCT V having returned 106.3p per share (on a net cost of investment of 70p) in cash distributions to shareholders over its life. The current stable of funds are all performing well and have paid out tax-free dividends of between 5p and 7p per annum to shareholders.
Puma VCT 12 closed for subscriptions during the period, raising £31 million which accounted for more than half of the total funds raised in the limited-life VCT market in the 2015/16 tax year. The Group considers this fundraising to be a considerable achievement and an endorsement of Puma’s standing in the VCT sector.
In view of the many changes to VCT investment rules which have been introduced in recent months, the launch of our latest VCT, Puma VCT 13, has been delayed whilst we await clarification on the new rules in guidance notes which have not yet been issued by HMRC.
The Group considers that the responsible approach is to allow some time for these rules to bed in and to review the accompanying guidance notes before raising additional capital. We are making good progress in deploying the funds raised in previous VCTs and have sufficient capital to continue to back businesses that meet our stringent investment criteria.
Puma EIS The Puma EIS portfolio service (the “EIS Service”) was launched in November 2013 to offer investors the opportunity to invest in asset-backed Enterprise Investment Scheme qualifying companies utilising the team’s strong track record and expertise in asset-backed investing gained from their experience running the Puma VCTs. Fundraising continued successfully throughout 2016, raising the amount in the EIS Service to c.£47 million. To date the EIS Service has invested into seven portfolio companies and has a good pipeline of further deployment opportunities.
Puma VCT 12 – Funds raised
£31mPuma VCT 12 was the largest fundraise in the VCT Planned Exit sector
12 Shore Capital Group Limited Annual Report and Accounts 2016
Operating Review continued
Puma Heritage plcPuma Heritage was launched in June 2013 to operate in a range of sectors, with a primary focus on secured lending. It focuses on capital preservation, whilst seeking to produce regular returns for shareholders intended to counter long-term inflationary pressures. An investment in Puma Heritage is intended to benefit from 100% relief from Inheritance Tax after two years.
The company celebrated its third anniversary in June 2016, having recorded a significant acceleration in its net asset value (“NAV”) during the period. Subscriptions from new shareholders and good levels of return generated from its diversified loan book have increased the NAV of the company to over £28 million by 31 December 2016. Puma Heritage has participated in loans totalling £162 million to date. The business has a strong pipeline of loans to deploy current and future funds and remains optimistic about the prospects for further NAV growth over the coming months and years.
During the period, we advised Puma Heritage plc on the completion of several asset-backed loans across a number of sectors, all secured with a first charge over real estate at conservative lending ratios. As at 31 December 2016, Puma Heritage had made 384 loans of which 38 were live and 346 had been repaid in full. The team continues to assist the business, helping it to source and analyse new lending opportunities. Puma Heritage remains open for investment and having reached critical mass, is in a position to continue growing rapidly.
Puma AIM Inheritance Tax ServiceThe Puma AIM IHT Service (the “AIM Service”) is a discretionary portfolio service that seeks to mitigate Inheritance Tax by investing in a carefully selected portfolio of AIM shares and is particularly attractive for those that wish to invest via an ISA. Since launch in July 2014 to the end of 2016 the AIM Service has delivered a 43.9% return, outperforming the FTSE AIM All Share Index by 36.3%.
Our strong performance has resulted in us winning the Best AIM Investment Manager award at the Growth Investor Awards for 2016. Additionally, we were Highly Commended in the Best AIM IHT Portfolio Service category at the Investment Week Tax Efficiency Awards 2016/17.
The AIM Service has continued to grow assets and investor numbers during the year and we are confident of growing the service in the future. At the end of June 2017 we will reach our three year track record; a key hurdle for many financial advisers. In early 2017 we announced that the service is available through the Ascentric and Standard Life Investment Platforms, enabling us to access a wider range of Financial Advisers.
The Puma AIM IHT Service will celebrate its third anniversary in July 2017
36.3%Out performance of the FTSE AIM All Share Index, since inception
13Shore Capital Group Limited Annual Report and Accounts 2016
Principal FinanceThe Principal Finance division seeks to use the Group’s strong balance to invest in attractive opportunities and seed new funds.
During the year, the division incurred a £2.7 million pre-tax write down relating to various assets held in the division, which equates to £1.6 million after tax and minority interests.
This division also holds the Group’s investment in DBD, which holds, through a subsidiary, 32 regional radio spectrum licences in Germany of indefinite duration (the “Licences”). Shore Capital holds a 59.94% interest in Spectrum Investments Limited, the parent company of DBD.
DBD has been given consent by the German Telecoms Regulator (“BNetzA”) to test the LTE TDD technology which will support its business plan for the future use of the Licences, premised upon a small radio cells network concept. An initial pilot scheme has commenced in Berlin and DBD plans to roll out additional pilots in other areas covered by the Licences.
For the initial Berlin trial, at the request of BNetzA, DBD is using a temporary test licence granted to it by BNetzA. However, DBD believes that, as a result of Article 9a of the EU Framework Directive (2002/21/EC, as amended), implemented in Germany by Sec. 150 para 8 of the German Telecommunications Act, it should be permitted to use its existing Licences to conduct the pilot schemes and to support the roll out of its services in the future. BNetzA has yet to confirm its agreement.
In correspondence with DBD, BNetzA has noted that its ongoing consideration of the status and use of the Licences should be taken in the context of its ongoing review of spectrum frequency planning for the years after 2021/2022 and in particular its frequency concept for the 3.5GHz band, into which the Licences fall.
Current Trading and ProspectsWe have seen companies wanting to get on with growing their businesses and institutions that want to buy into them. That cannot happen in a vacuum, demonstrating that markets are again open for business, focusing on the fundamentals of the deal, rather than market participants sitting on their hands and worrying about uncertainty.
Our independence puts us in an ideal place to make the most of the opportunities that will arise as market conditions improve.
Howard ShoreChairman29 March 2017

14 Shore Capital Group Limited Annual Report and Accounts 2016
Board of Directors, Key and Senior Management
Board of Directors
Howard Shore Executive Chairman
Howard Shore founded Shore Capital in 1985. He began his career in private client discretionary fund management with Grieveson Grant & Co. After obtaining a degree in Economics from Cambridge, he worked as a financial futures broker when LIFFE was being established. As Executive Chairman he is responsible for the strategy of the Group. He is also a director of Puma Brandenburg Limited and Chairman of Spectrum Investments Limited.
James Rosenwald IIINon-executive Director
James Rosenwald is a co-founder and the managing partner of Dalton Investments, LLC, an asset management company. He has more than thirty five years’ experience investing in the Pacific Rim. He formerly co-managed Rosenwald, Roditi & Company Ltd. which he founded in 1992 with Nicholas Roditi. James advised a number of Soros Group funds between 1992 and 1998. He commenced his investment career with the Grace Family of the United States at their securities firm Sterling Grace & Co. He is a CFA charter holder and a director of numerous investment funds. He is a member of the Los Angeles Society of Financial Analysts and the CFA Institute.
In addition to securities investments, James has invested in real estate since 1997. He co-founded Beach Front Properties in California in February 1997, Grand River Properties in Shanghai in June 2003 and Dalton REIT 1 GmbH & Co. KG. James holds an MBA from New York University and is an adjunct Professor of Finance at New York University’s Stern Graduate Business School. At Shore Capital he is a member of the Audit Committee and is Chairman of the Remuneration Committee.
Lynn BruceDirector
Lynn Bruce is a Chartered Accountant (Scotland) having trained at KPMG, London and has a BSc Hons in Business Mathematics and Accountancy from Dundee University. She was the CFO of an international wealth management group, Stenham Limited, for 11 years where she was also a member of both their Risk and Audit Committees. Prior to that she was the Financial Controller at AT&T Capital Europe. She chairs the Audit Committee.
Dr Zvi Marom Non-executive Director
Dr Marom is founder and CEO of BATM Advanced Communications Limited. A former first lieutenant in the Israeli Navy, he graduated first (with excellence) in electronics from the Naval Academy and first (with excellence) from the Advanced Naval Command Course. He has a post-graduate degree in medicine from the Sackler School of Medicine, Israel and an MSc in industrial electronics. Dr Marom is on the boards of several national and international academic committees for computing and communications. He has close links with Governmental bodies funding research for Israeli high tech companies. He is a member of the Audit Committee and the Remuneration Committee.
Key Management
Michael van MesselHead of Finance and Tax
Michael van Messel graduated from Imperial College, London, with a degree in Physics after which he joined Hacker Young and qualified as a Chartered Accountant. He then worked as a specialist in their tax department and subsequently for Coopers & Lybrand within its financial services group. He joined Shore Capital in 1993 as Group Financial Controller and became Operations Director in 2000. He is a Fellow of the Institute of Chartered Accountants, is the head of the Group’s finance team and is also responsible for all operations at Shore Capital Group.
David KayeChief Executive of Asset Management
David Kaye graduated from Oxford University with a degree in law and was called to the Bar in 2000. David practised as a barrister at a leading London set of chambers for five years, specialising in advising on a range of complex commercial legal issues with a particular focus on financial investments and real estate. He joined Shore Capital in January 2006 and having been Commercial Director and General Counsel for the Group, became CEO of the asset management division in May 2012.

15Shore Capital Group Limited Annual Report and Accounts 2016
Senior Management
Simon FineChief Executive of Shore Capital Markets
Simon Fine joined Shore Capital in 2002 as CEO of Shore Capital Markets, responsible for all aspects of trading and brokerage as well as the integration of related corporate broking activities. He is the former Managing Director and Co-Head of Pan European Equity Cash Trading at Lehman Brothers. Prior to that, Simon spent the previous 14 years at Dresdner Kleinwort Benson, latterly as Head of Pan European Equity Cash Trading – developing its UK operations into one of the leading players in UK and German equities.
Dr Clive BlackHead of Research
Dr Clive Black has been highly ranked in fund manager surveys for many years. In 2011 he was No. 3 in the whole market in the Thomson Reuters UK survey (No.1 in retail in 2014 & 2015) and in 2012 he was voted ‘Analyst of the Year’ at the prestigious City AM awards. His work on the food industry is widely referenced in financial and industry journals. He holds a Ph.D from The Queen’s University of Belfast on the Northern Ireland food industry where he is now Chair of the Industry Advisory Board of the internationally renowned Institute of Global Food Security; he was awarded the alumni of the year at Queen’s in 2013. From research he become Head of Food Policy at the NFU in London before joining Northern Foods plc. He moved into equity research with Charterhouse Tilney where he was a Director; he became Head of Pan-European Retail research when it was acquired by ING Financial Markets. He joined Shore Capital in 2003 as Head of Research.
Eamonn FlanaganHead of the Liverpool Office
Eamonn Flanagan is one of the UK’s top stockbroking analysts in the insurance and speciality finance sectors, and was rated first for coverage of mid-to small-cap companies in these sectors in the last Reuters survey. After a degree in mathematics, he qualified as an actuary with Royal Insurance where he worked for nine years and is a Fellow of the Institute of Actuaries. He moved into stockbroking research with Charterhouse Tilney where he was for nine years when it latterly became ING Financial Markets. He joined Shore Capital in 2003 as Head of the Liverpool office.
Heydan von FrankenbergShore Capital Germany – Managing Director
Heydan von Frankenberg graduated with a degree in business administration, and began his career with Ernst & Young in Frankfurt in 2002, and has since worked in Berlin and Abu Dhabi. He qualified as a chartered surveyor (MRICS) in 2008.Working in the real estate department, he has advised banks, institutional investors and private equity firms on all real estate related matters. Heydan joined Shore Capital in 2017, and is the Managing Director of Shore Capital’s German team in Berlin and also responsible for asset management.
Dru DanfordChief Executive of Shore Capital and Corporate Limited
Dru Danford is an experienced corporate financier who joined Shore Capital and Corporate Limited in November 2004 and was appointed Head of Corporate Broking and Advisory in April 2012. Dru qualified as a Chartered Accountant (South Africa) at Ernst & Young (Cape Town) in 1997 and then spent two years at Ernst & Young (London) working in the Investment Management Group before moving into investment banking in 1999. Since that time Dru has specialised in advising small and mid-cap companies in a wide range of sectors and transactions including IPOs, secondary fundraisings, takeovers, acquisitions, disposals and restructurings.
16 Shore Capital Group Limited Annual Report and Accounts 2016
Corporate Governance
GeneralShore Capital Group Limited (the “Company” or the “Group”) has sought to comply with a number of provisions contained in the UK Corporate Governance Code, issued by the Financial Reporting Council (the “Code”) in relation to matters for which the Board is accountable to shareholders, so far as is considered appropriate for a company of its size and nature. Further explanation of how the principles and supporting principles have been applied is set out below.
Board of DirectorsThe Board currently comprises two executive and two non-executive directors. It carries ultimate responsibility for the conduct of the business of the Group. The Board maintains full control and direction over appropriate strategic and financial issues through regular meetings and reports to ensure that the Board is supplied with all the information it needs. The Board considers each of the non-executive directors, Dr Zvi Marom and James Rosenwald III, to be independent in character and judgement as whilst both own shares in the Company, each have significant other business interests and activities. The Board as a whole considers their shareholdings in the Company to be an advantage for the shareholders as in addition to their fiduciary duties, their interests are aligned with shareholders generally. The terms and conditions of appointment of the non-executive directors are available for inspection by any person at the Company’s registered office and also at the Company’s AGM.
The directors provide the Group with the knowledge, mix of skills, experience and networks of contacts required. The non-executive directors combine breadth of business and commercial experience with independent and objective judgement. The combination of non-executive and executive directors enables the Board to provide effective leadership and maintain a high standard of integrity across the Group.
Howard Shore is Executive Chairman of the Board and has also undertaken the function of full-time Chief Executive. On 29 March 2017, the Group announced that Howard Shore is relinquishing his role as Chief Executive. The Board has two committees, the Audit Committee and the Remuneration Committee (see below). The Board does not have a Nominations Committee or a senior independent director. This is because with two non-executive directors and a Board of only four in total, nominations can be readily handled without a committee by the Board as a whole, whilst the non-executive directors are accessible to shareholders in the event of issues arising.
The Board has an informal annual review process to assess how each of the directors is performing. The performance of the executive director is reviewed by the Chief Executive against previously agreed objectives and the Chief Executive’s performance is in turn appraised by the non-executive directors. Remuneration is directly linked to these reviews and determined by the Remuneration Committee. Remuneration is set at the level required to attract, retain and motivate high calibre directors and a significant proportion of total remuneration is linked to corporate and individual performance.
The Board of Shore Capital Group Limited met five times during 2016. The number of meetings of the Board and the Audit and Remuneration Committees and individual attendance by members is set out in the following table.
Board Audit Remuneration
Total number of meetings in 2016 5 3 1
Number of meetings attended in 2016:
Howard Shore 5 n/a n/aLynn Bruce 5 3 n/aDr Zvi Marom 5 2 1James Rosenwald III 5 2 1
The Board has a formal schedule of matters reserved for its decision and delegates certain matters to committees as set out below. The Board determines the Group’s overall strategy; creation, acquisition or disposal of material corporate entities and investments; development and protection of the Group’s reputation; public announcements including statutory accounts; significant changes in accounting policy, capital structure and dividend policy, operating plans and review of key performance indicators, resolution of litigation, Group remuneration policy and Board structure, composition and succession.
Audit CommitteeThe Board has appointed an Audit Committee with written terms of reference. The terms of reference of the Audit Committee are available for inspection by any person at the Company’s registered office during normal business hours and for 15 minutes prior to and during the Company’s Annual General Meeting. It comprises two non-executive directors, Dr Zvi Marom and James Rosenwald III, together with Lynn Bruce and is chaired by Lynn Bruce. The Audit Committee undertakes a detailed review of the Company’s half yearly and annual financial reports, is responsible for reviewing whether the accounting policies are appropriate and for monitoring internal compliance and external audit functions, including the cost effectiveness, independence and objectivity of the auditor. The committee meets periodically with the auditor to receive a report on matters arising from their work.
The committee receives a report from the external auditor concerning their internal processes to ensure that the independence and objectivity of the auditor are safeguarded at all times. The committee is satisfied that the safeguards and procedures established by the auditor are sufficient to counter threats or perceived threats to their objectivity.
17Shore Capital Group Limited Annual Report and Accounts 2016
Remuneration CommitteeThe Board has appointed a Remuneration Committee which comprises two non executive directors, James Rosenwald III and Dr Zvi Marom, and is chaired by James Rosenwald III. The terms of reference of the Remuneration Committee are available for inspection by any person at the Company’s registered office during normal business hours. The Remuneration Committee has given full consideration to Section B of the Best Practice Provisions annexed to the Listing Rules of the UK Listing Authority. The principal function of the Remuneration Committee is to determine the Group’s policy on executive remuneration. It makes its decisions in consultation with the Chairman and Chief Executive. No director plays a part in any decision about their own remuneration. The Committee meets periodically when it has proposals to consider and in any event no less than once each year.
The main aim of the committee’s policy is to attract, retain and motivate high calibre individuals with a competitive remuneration package. Remuneration for executives comprises basic salary, performance related bonus, pension benefits, other benefits in kind and options granted pursuant to the Shore Capital Group Share Option Plan. No director has a service contract for longer than 12 months.
Going concernThe Group’s business activities, together with the factors likely to affect its future development, performance and position are set out in the Chairman’s Statement, together with the financial position of the Group, its liquidity position and borrowing facilities. In addition note 25 to the financial statements includes policies and processes for managing its capital; its financial risk management objectives; details of its financial instruments and hedging activities; and its exposures to credit risk and liquidity risk.
The Group has considerable financial resources together with an established business model. As a consequence, the directors believe that the Group is well placed to manage its business risks successfully.
After making enquiries, the directors have a reasonable expectation that the Company and the Group have adequate resources to continue in operational existence for the foreseeable future. Accordingly, they continue to adopt the going concern basis in preparing the financial statements.
Internal controlIn accordance with Principle C.2 of the Code, the Board of Directors has overall responsibility for the Group’s systems of internal controls, including financial, operational and compliance, which are designed to provide reasonable, but not absolute, assurance against material misstatement or loss and comply with the Financial Reporting Council risk guidance. The controls are used in identifying, evaluating and managing significant risks of the Group on an ongoing basis. These internal controls have been in place from the start of the year through to the date of approval of this report. They include:
• ensuring that an appropriate organisational structure exists with clear lines of responsibility and delegation of authority;
• the allocation of responsibility for important business functions to experienced and suitably qualified staff;
• detailed budgets and plans which are approved by the Group Board;
• regular consideration by the Board of actual results compared with budgets and forecasts;
• compliance by subsidiaries with Group operating procedures and policies;
• annual review of the Group’s insurance cover;• defined procedures for the appraisal and authorisation of capital
expenditure and capital disposals; and• regular reporting of the Company’s liquidity position.
An internal annual review has been carried out of the effectiveness of the Group’s systems of internal financial controls. In addition, the Group has considered the need to introduce a group internal audit function but has decided that it is inappropriate for a Group of this size. It should be noted that many of the activities which would be covered by such a function are already carried out as part of the compliance function.
Relations with shareholdersThe Group communicates with shareholders through both the interim and annual reports. In addition, all shareholders may attend the Company’s Annual General Meeting where they may raise matters relating to their shareholdings and the business of the Group.
Communication with the Group’s largest institutional shareholders is undertaken as part of the Group’s investor relations programme and any feedback arising is provided to the Board.
18 Shore Capital Group Limited Annual Report and Accounts 2016
Directors’ Report
The directors present their annual report and the audited financial statements of the Group for the financial year ended 31 December 2016.
Activities and business reviewThe main activities of the Group consist of investment related activities, including stockbroking, market-making, Corporate Broking and Advisory advice, asset management including specialist fund management and principal finance.
A review of the year and future developments is contained in the Chairman’s statement. The statement also includes details of the key performance indicators which management use.
Results and dividendsThe results for the financial year are set out in the Income Statement. No interim dividend was paid during the year (2015: nil). The directors propose a final dividend of 5.0p for the year ended 2016 (2015: nil) making a total of 5.0p for the year (2015: nil). Capital structureDetails of the issued share capital, together with details of the movements in the company’s issued share capital during the year are shown in note 24 of the financial statements. The Company has one class of ordinary shares which carry no right to fixed income. Each share carries the right to one vote at general meetings of the Company.
There are no restrictions on the size of a holding nor on the transfer of shares, which are both governed by the general provision of the Articles of Association. No person has any special rights of control over the Company’s share capital and all issued shares are fully paid.
Regulatory Capital (unaudited)Capital resources*, capital requirements and surplus capital at the balance sheet dates were as follows:
2016
£’0002015
£’000
Group Capital resources per statement of
financial position 67,085 67,042 Less non EU resources (31,091) (38,805)
Capital resources 35,994 28,237 Less Capital Resources
Requirement (8,741) (8,675)
Surplus capital resources 27,253 19,562
The Group’s lead regulator is the Financial Conduct Authority (FCA) in the UK. Four of the Group’s operating subsidiaries are regulated by the FCA which imposes a minimum level of regulatory capital which must be maintained by each company and also an overall level of regulatory capital which must be maintained by the Group’s UK businesses*. The Group has maintained a surplus throughout the year over its regulatory capital requirements.
As a result of the Group’s history of strong organic growth, retained reserves have been the primary source of capital resources. The Group’s balance sheet is strong and it continues to generate cash from its operations.
Capital resources are largely comprised of share capital and reserves, net of intangible assets. Capital requirements are derived from credit risk, market risk and operational risk considerations.
* The calculation of Capital Resources for the purposes of these rules only permits the inclusion of resources that are located in EU countries. Accordingly, the amount of Capital resources as presented in the table above excludes the assets and liabilities that are held by the Group’s Guernsey based companies.
Risk managementThe Group’s policies for managing the financial risks arising from its activities, including the use of derivative instruments, are set out in note 25. In addition the Group has policies and procedures in place to mitigate the other risks to which it is exposed, including reputational risk, operational risk and insurance risk. The Group’s activities comprise capital market activities, asset management and principal finance, and its income is therefore subject to the level of general activity, sentiment and market conditions in each of the markets in which it operates.
19Shore Capital Group Limited Annual Report and Accounts 2016
DirectorsThe directors who served the Company during the financial year and their beneficial interests in the ordinary shares of the Company were:
Ordinary shares of Nil par value
31 December 2016
31 December 2015
Howard Shore 8,941,497 8,941,497 Lynn Bruce 27,027 27,027Dr Zvi Marom 45,182 45,182James Rosenwald III 138,412 138,412
The beneficial interests of the directors in share options over ordinary shares of the Company are set out in note 6e to the financial statements.
The Company makes qualifying third-party indemnity provisions for the benefit of its directors which are in force at the date of this report.
Charitable donationsThe Group made charitable donations of £43,000 (2015: £233,000) during the year.
Events after the balance sheet dateDetails of events after the balance sheet date are set out in note 26.
Going concernThe Group’s liquidity position is set out in note 19 and its borrowing facilities in note 21. In addition, note 25 includes details of policies and processes for managing its capital; its financial risk management objectives; details of its financial instruments and hedging activities; and its exposures to credit risk and liquidity risk.
The Group has considerable financial resources together with an established business model. As a consequence, the directors believe that the Group is well placed to manage its business risks successfully.
After making enquiries, the directors have a reasonable expectation that the Company and the Group have adequate resources to continue in operational existence for the foreseeable future. Accordingly, they continue to adopt the going concern basis in preparing the financial statements.
Environmental policyThe Group aims wherever appropriate to be environmentally conscious. During the year, it recycled a large amount of waste paper and arranged for used printer cartridges and office furniture and equipment to be collected for recycling and environmentally sound disposal. It has adopted low energy lighting systems where appropriate.
Major shareholdingsOther than directors, the following shareholders had notified the Company of holdings of 3% or more of the shares of the Company as at 30 March 2017:
Ordinary Shares %
G B Shore (direct and beneficial interest) 1,962,079 9.01J P Morgan Asset Management Holdings (UK) Limited 1,543,196 7.09Aralon Resources and Investment Company Limited 1,267,380 5.82Miton Group plc 1,149,079 5.28Helium Special Situations Fund Limited 696,600 3.20
AuditorEach of the persons who is a director at the date of approval of this annual report confirms that:
• so far as the director is aware, there is no relevant audit information of which the Company’s auditor is unaware; and
• the directors have taken all the steps which they ought to have taken as a director in order to make themselves aware of any relevant audit information and to establish that the Company’s auditor is aware of that information.
This confirmation is given and should be interpreted in accordance with the provisions of s249(2) of the Companies (Guernsey) Law, 2008.
Deloitte LLP have expressed their willingness to continue in office. A resolution to re-appoint them as auditor of the Company will be proposed at the forthcoming Annual General Meeting. By order of the Board
Lynn BruceCompany Secretary3 April 2017
Martello CourtAdmiral ParkSt Peter PortGuernsey GY1 3HB
20 Shore Capital Group Limited Annual Report and Accounts 2016
Statement of Directors’ Responsibilities
The directors are responsible for preparing the Annual Report and the Group financial statements in accordance with applicable rules and regulations.
International Accounting Standard 1 requires that IFRS financial statements present fairly for each financial year the Company’s financial position, financial performance and cash flows. This requires the faithful representation of the effects of transactions, other events and conditions in accordance with the definitions and recognition criteria for assets, liabilities, income and expenses set out in the International Accounting Standards Board’s ‘Framework for the preparation and presentation of financial statements’. In virtually all circumstances, a fair presentation will be achieved by compliance with all applicable IFRSs.
The directors are required to prepare Group financial statements for each financial year, in accordance with applicable Guernsey law and those International Financial Reporting Standards (IFRS) as adopted by the European Union, which present fairly the financial position of the Group and the financial performance and cash flows of the Group for that period. In preparing those financial statements the directors are required to:
• select suitable accounting policies in accordance with IAS 8: “Accounting Policies, Changes on Accounting Estimates and Errors” and then apply them consistently;
• present information, including accounting policies, in a manner that provides relevant, reliable, comparable and understandable information;
• provide additional disclosures when compliance with the specific requirements in IFRS is insufficient to enable users to understand the impact of particular transactions, other events and conditions on the Company’s financial position and financial performance;
• state that the Group has complied with IFRS, subject to any material departures disclosed and explained in the financial statements; and
• prepare the financial statements on the going concern basis unless it is inappropriate to presume that the Group will continue in business.
The directors are responsible for keeping proper accounting records which disclose with reasonable accuracy at any time the financial position of the Group and enable them to ensure that its financial statements comply with the Companies (Guernsey) Law, 2008. They are also responsible for safeguarding the assets of the Group and hence for taking reasonable steps for the prevention and detection of fraud and other irregularities.
The directors are responsible for the maintenance and integrity of the corporate and financial information included on the company’s website.
21Shore Capital Group Limited Annual Report and Accounts 2016
We have audited the consolidated financial statements of Shore Capital Group Limited for the year ended 31 December 2016 which comprise the Consolidated Income Statement, the Consolidated Statement of Comprehensive Income, the Consolidated Statement of Financial Position, the Consolidated Statement of Changes in Equity, the Consolidated Cash Flow Statement and the related notes 1 to 26. The financial reporting framework that has been applied in their preparation is applicable law and International Financial Reporting Standards (IFRSs) as adopted by the European Union.
This report is made solely to the Company’s members, as a body, in accordance with Section 262 of the Companies (Guernsey) Law, 2008. Our audit work has been undertaken so that we might state to the Company’s members those matters we are required to state to them in an auditor’s report and for no other purpose. To the fullest extent permitted by law, we do not accept or assume responsibility to anyone other than the Company and the Company’s members as a body, for our audit work, for this report, or for the opinions we have formed.
Respective responsibilities of directors and auditorAs explained more fully in the Statement of Directors’ Responsibilities, the directors are responsible for the preparation of the financial statements and for being satisfied that they give a true and fair view. Our responsibility is to audit and express an opinion on the financial statements in accordance with applicable law and International Standards on Auditing (UK and Ireland). Those standards require us to comply with the Auditing Practices Board’s Ethical Standards for Auditors.
Scope of the audit of the financial statementsAn audit involves obtaining evidence about the amounts and disclosures in the financial statements sufficient to give reasonable assurance that the financial statements are free from material misstatement, whether caused by fraud or error. This includes an assessment of: whether the accounting policies are appropriate to the Company’s circumstances and have been consistently applied and adequately disclosed; the reasonableness of significant accounting estimates made by the directors; and the overall presentation of the financial statements. In addition, we read all the financial and non-financial information in the annual report to identify material inconsistencies with the audited financial statements and to identify any information that is apparently materially incorrect based on, or materially inconsistent with, the knowledge acquired by us in the course of performing the audit. If we become aware of any apparent material misstatements or inconsistencies we consider the implications for our report.
Opinion on financial statementsIn our opinion the financial statements:
• give a true and fair view of the state of the Group’s affairs as at 31 December 2016 and of its profit for the year then ended;
• have been properly prepared in accordance with International Financial Reporting Standards (IFRSs) as adopted by the European Union; and
• have been prepared in accordance with the requirements of the Companies (Guernsey) Law, 2008.
Matters on which we are required to report by exceptionWe have nothing to report in respect of the following matters where the Companies (Guernsey) Law, 2008 requires us to report to you if, in our opinion:
• proper accounting records have not been kept; or• the financial statements are not in agreement with the accounting
records; or• we have not received all the information and explanations we
require for our audit.
Deloitte LLPChartered AccountantsGuernsey, Channel Islands3 April 2017
Independent Auditor’s Report to the Members of Shore Capital Group Limited
22 Shore Capital Group Limited Annual Report and Accounts 2016
Consolidated Income StatementFor the year ended 31 December 2016
Notes
Total 2016
£’000
Total 2015
£’000
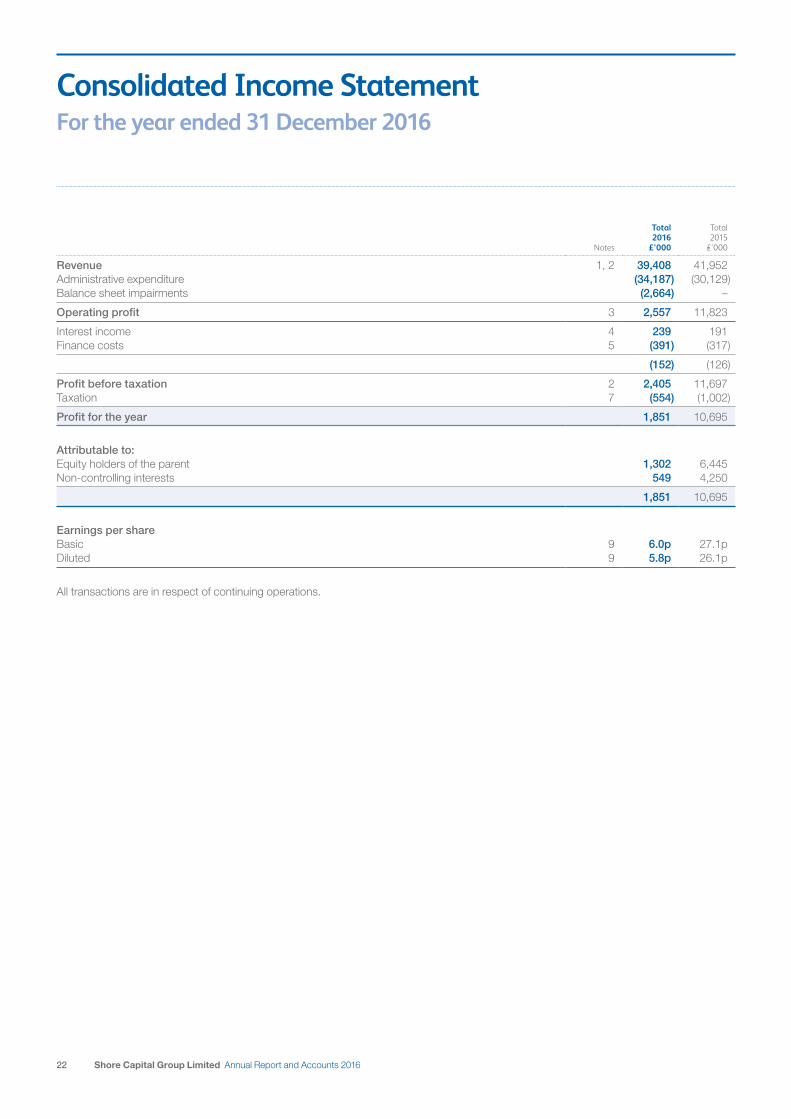
Revenue 1, 2 39,408 41,952 Administrative expenditure (34,187) (30,129)Balance sheet impairments (2,664) –
Operating profit 3 2,557 11,823
Interest income 4 239 191 Finance costs 5 (391) (317)
(152) (126)
Profit before taxation 2 2,405 11,697 Taxation 7 (554) (1,002)
Profit for the year 1,851 10,695
Attributable to: Equity holders of the parent 1,302 6,445 Non-controlling interests 549 4,250
1,851 10,695
Earnings per share Basic 9 6.0p 27.1p Diluted 9 5.8p 26.1p
All transactions are in respect of continuing operations.
23Shore Capital Group Limited Annual Report and Accounts 2016
Consolidated Statement of Comprehensive IncomeFor the year ended 31 December 2016
Notes
Total 2016
£’000
Total 2015
£’000
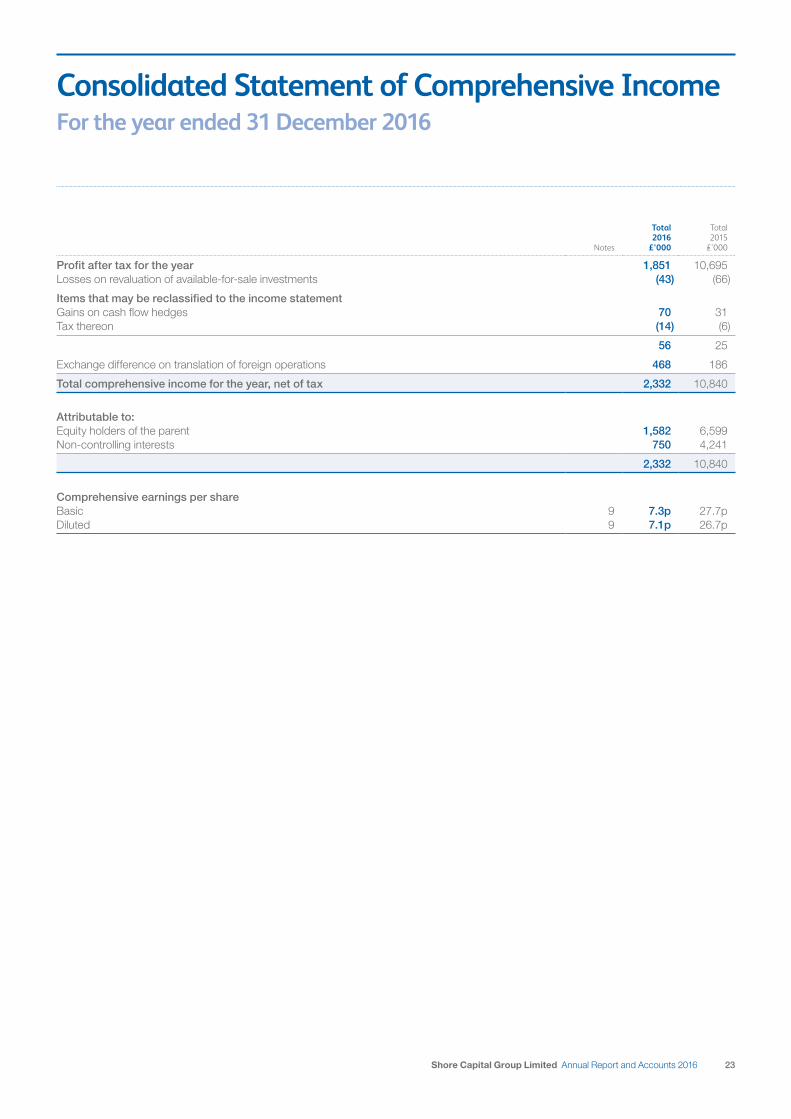
Profit after tax for the year 1,851 10,695 Losses on revaluation of available-for-sale investments (43) (66)
Items that may be reclassified to the income statement Gains on cash flow hedges 70 31 Tax thereon (14) (6)
56 25
Exchange difference on translation of foreign operations 468 186
Total comprehensive income for the year, net of tax 2,332 10,840
Attributable to: Equity holders of the parent 1,582 6,599 Non-controlling interests 750 4,241
2,332 10,840
Comprehensive earnings per share Basic 9 7.3p 27.7p Diluted 9 7.1p 26.7p
24 Shore Capital Group Limited Annual Report and Accounts 2016
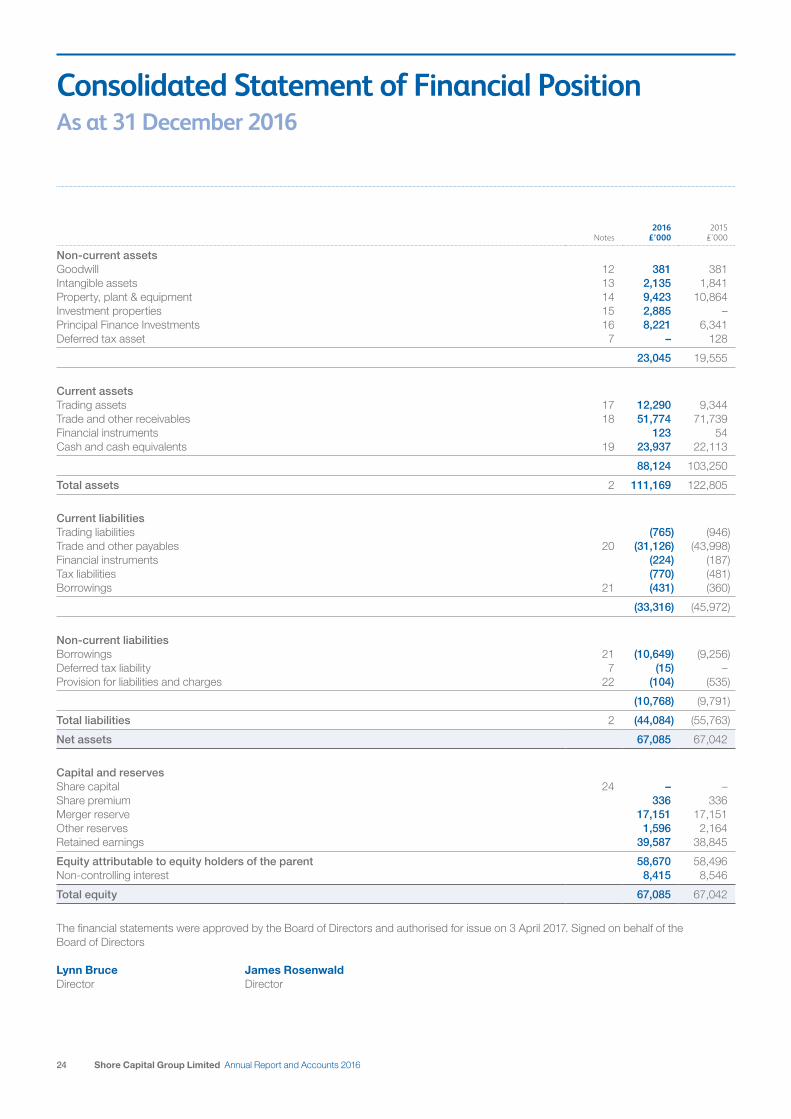
Consolidated Statement of Financial PositionAs at 31 December 2016
Notes2016
£’0002015
£’000
Non-current assets Goodwill 12 381 381 Intangible assets 13 2,135 1,841 Property, plant & equipment 14 9,423 10,864 Investment properties 15 2,885 – Principal Finance Investments 16 8,221 6,341 Deferred tax asset 7 – 128
23,045 19,555
Current assets Trading assets 17 12,290 9,344 Trade and other receivables 18 51,774 71,739 Financial instruments 123 54 Cash and cash equivalents 19 23,937 22,113
88,124 103,250
Total assets 2 111,169 122,805
Current liabilities Trading liabilities (765) (946)Trade and other payables 20 (31,126) (43,998)Financial instruments (224) (187)Tax liabilities (770) (481)Borrowings 21 (431) (360)
(33,316) (45,972)
Non-current liabilities Borrowings 21 (10,649) (9,256)Deferred tax liability 7 (15) – Provision for liabilities and charges 22 (104) (535)
(10,768) (9,791)
Total liabilities 2 (44,084) (55,763)
Net assets 67,085 67,042
Capital and reserves Share capital 24 – – Share premium 336 336 Merger reserve 17,151 17,151 Other reserves 1,596 2,164 Retained earnings 39,587 38,845
Equity attributable to equity holders of the parent 58,670 58,496 Non-controlling interest 8,415 8,546
Total equity 67,085 67,042
The financial statements were approved by the Board of Directors and authorised for issue on 3 April 2017. Signed on behalf of the Board of Directors
Lynn Bruce James RosenwaldDirector Director
25Shore Capital Group Limited Annual Report and Accounts 2016
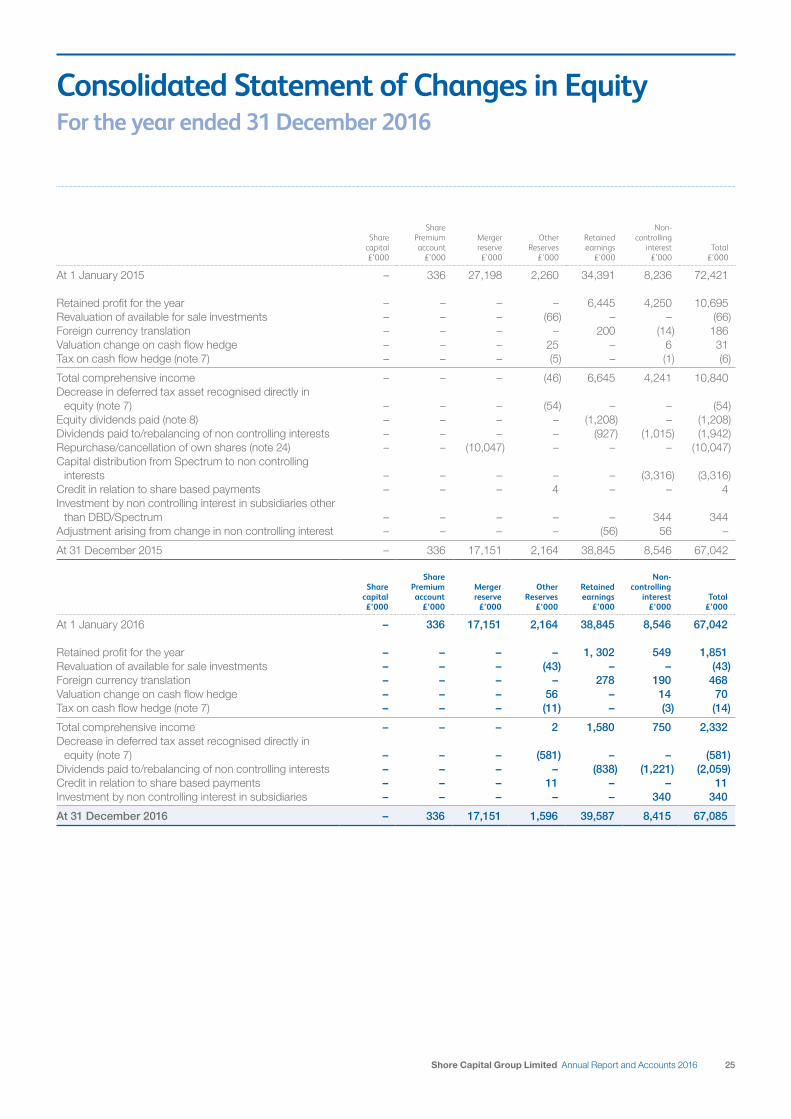
Consolidated Statement of Changes in EquityFor the year ended 31 December 2016
Share capital £’000
Share Premium account
£’000
Merger reserve £’000
Other Reserves
£’000
Retained earnings
£’000
Non-controlling
interest £’000
Total £’000
At 1 January 2015 – 336 27,198 2,260 34,391 8,236 72,421
Retained profit for the year – – – – 6,445 4,250 10,695 Revaluation of available for sale investments – – – (66) – – (66)Foreign currency translation – – – – 200 (14) 186 Valuation change on cash flow hedge – – – 25 – 6 31 Tax on cash flow hedge (note 7) – – – (5) – (1) (6)
Total comprehensive income – – – (46) 6,645 4,241 10,840 Decrease in deferred tax asset recognised directly in
equity (note 7) – – – (54) – – (54)Equity dividends paid (note 8) – – – – (1,208) – (1,208)Dividends paid to/rebalancing of non controlling interests – – – – (927) (1,015) (1,942)Repurchase/cancellation of own shares (note 24) – – (10,047) – – – (10,047)Capital distribution from Spectrum to non controlling
interests – – – – – (3,316) (3,316)Credit in relation to share based payments – – – 4 – – 4 Investment by non controlling interest in subsidiaries other
than DBD/Spectrum – – – – – 344 344 Adjustment arising from change in non controlling interest – – – – (56) 56 –
At 31 December 2015 – 336 17,151 2,164 38,845 8,546 67,042
Share capital £’000
Share Premium account
£’000
Merger reserve
£’000
Other Reserves
£’000
Retained earnings
£’000
Non-controlling
interest £’000
Total £’000
At 1 January 2016 – 336 17,151 2,164 38,845 8,546 67,042
Retained profit for the year – – – – 1, 302 549 1,851 Revaluation of available for sale investments – – – (43) – – (43)Foreign currency translation – – – – 278 190 468 Valuation change on cash flow hedge – – – 56 – 14 70 Tax on cash flow hedge (note 7) – – – (11) – (3) (14)
Total comprehensive income – – – 2 1,580 750 2,332 Decrease in deferred tax asset recognised directly in
equity (note 7) – – – (581) – – (581)Dividends paid to/rebalancing of non controlling interests – – – – (838) (1,221) (2,059)Credit in relation to share based payments – – – 11 – – 11 Investment by non controlling interest in subsidiaries – – – – – 340 340
At 31 December 2016 – 336 17,151 1,596 39,587 8,415 67,085
26 Shore Capital Group Limited Annual Report and Accounts 2016
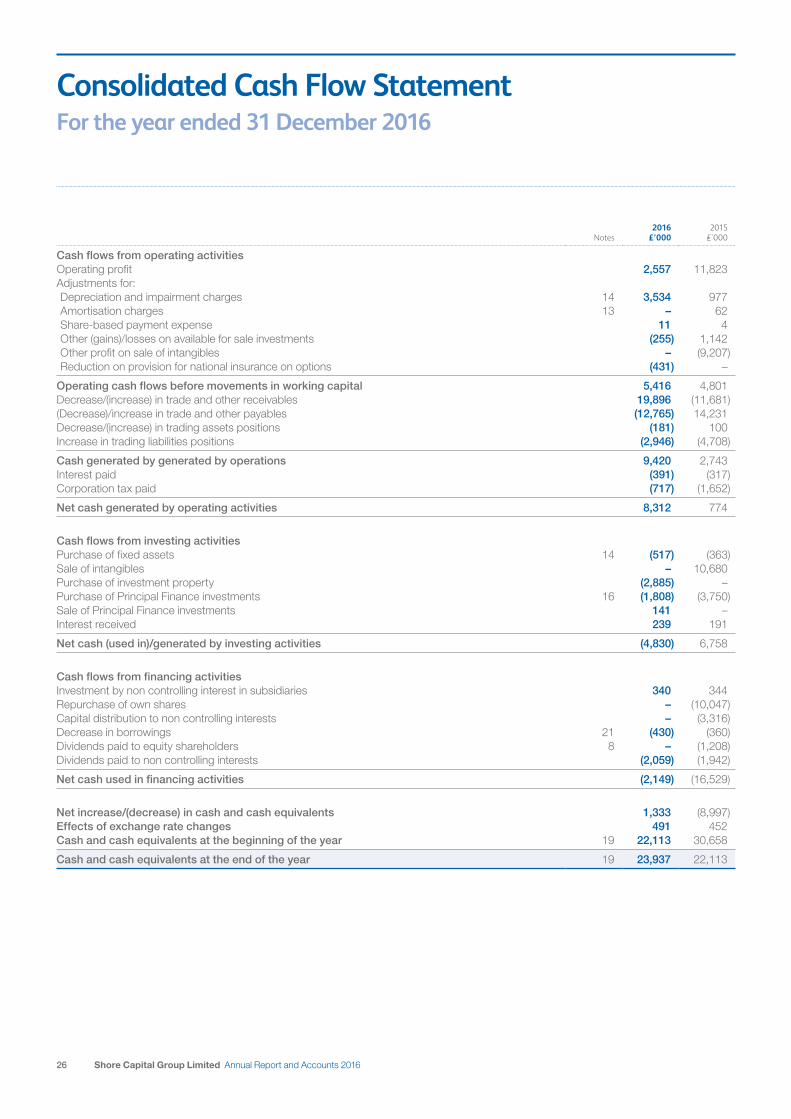
Consolidated Cash Flow StatementFor the year ended 31 December 2016
Notes2016
£’0002015
£’000
Cash flows from operating activities Operating profit 2,557 11,823 Adjustments for: Depreciation and impairment charges 14 3,534 977 Amortisation charges 13 – 62 Share-based payment expense 11 4 Other (gains)/losses on available for sale investments (255) 1,142 Other profit on sale of intangibles – (9,207)Reduction on provision for national insurance on options (431) –
Operating cash flows before movements in working capital 5,416 4,801 Decrease/(increase) in trade and other receivables 19,896 (11,681)(Decrease)/increase in trade and other payables (12,765) 14,231 Decrease/(increase) in trading assets positions (181) 100 Increase in trading liabilities positions (2,946) (4,708)
Cash generated by generated by operations 9,420 2,743 Interest paid (391) (317)Corporation tax paid (717) (1,652)
Net cash generated by operating activities 8,312 774
Cash flows from investing activities Purchase of fixed assets 14 (517) (363)Sale of intangibles – 10,680 Purchase of investment property (2,885) – Purchase of Principal Finance investments 16 (1,808) (3,750)Sale of Principal Finance investments 141 – Interest received 239 191
Net cash (used in)/generated by investing activities (4,830) 6,758
Cash flows from financing activities Investment by non controlling interest in subsidiaries 340 344 Repurchase of own shares – (10,047)Capital distribution to non controlling interests – (3,316)Decrease in borrowings 21 (430) (360)Dividends paid to equity shareholders 8 – (1,208)Dividends paid to non controlling interests (2,059) (1,942)
Net cash used in financing activities (2,149) (16,529)
Net increase/(decrease) in cash and cash equivalents 1,333 (8,997)Effects of exchange rate changes 491 452 Cash and cash equivalents at the beginning of the year 19 22,113 30,658
Cash and cash equivalents at the end of the year 19 23,937 22,113
27Shore Capital Group Limited Annual Report and Accounts 2016
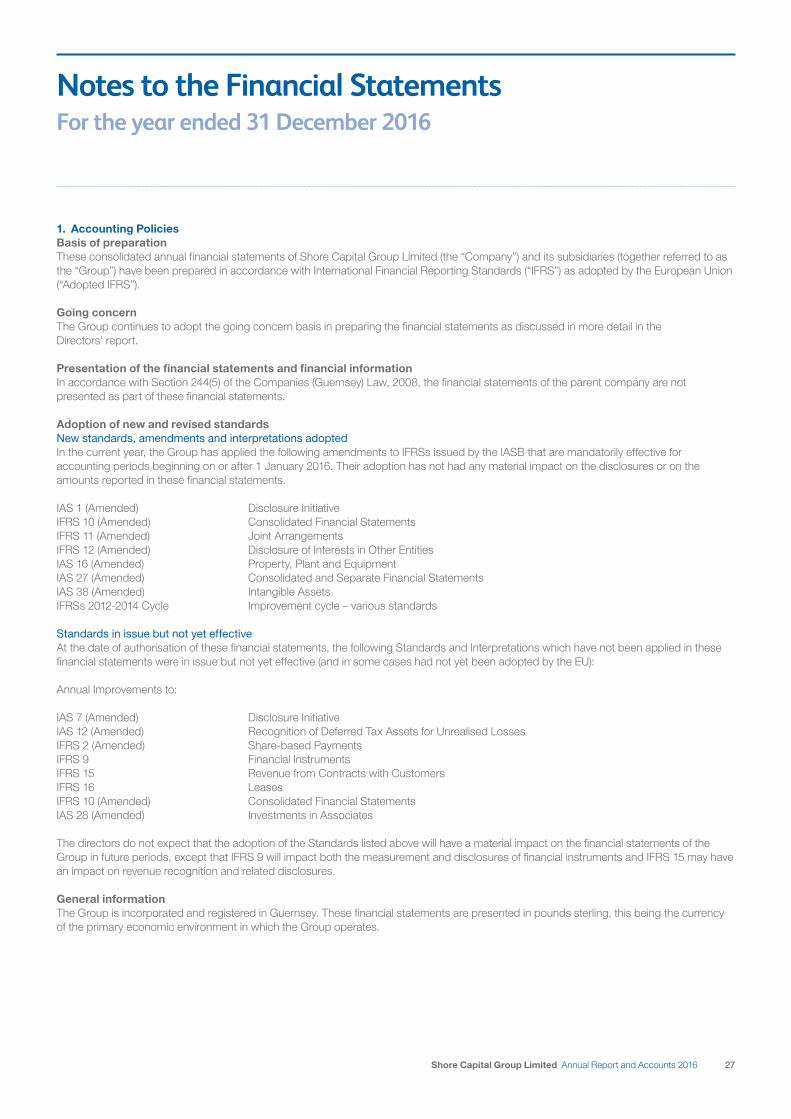
Notes to the Financial StatementsFor the year ended 31 December 2016
1. Accounting PoliciesBasis of preparationThese consolidated annual financial statements of Shore Capital Group Limited (the “Company”) and its subsidiaries (together referred to as the “Group”) have been prepared in accordance with International Financial Reporting Standards (“IFRS”) as adopted by the European Union (“Adopted IFRS”).
Going concernThe Group continues to adopt the going concern basis in preparing the financial statements as discussed in more detail in the Directors’ report.
Presentation of the financial statements and financial informationIn accordance with Section 244(5) of the Companies (Guernsey) Law, 2008, the financial statements of the parent company are not presented as part of these financial statements.
Adoption of new and revised standardsNew standards, amendments and interpretations adoptedIn the current year, the Group has applied the following amendments to IFRSs issued by the IASB that are mandatorily effective for accounting periods beginning on or after 1 January 2016. Their adoption has not had any material impact on the disclosures or on the amounts reported in these financial statements.
IAS 1 (Amended) Disclosure InitiativeIFRS 10 (Amended) Consolidated Financial Statements IFRS 11 (Amended) Joint ArrangementsIFRS 12 (Amended) Disclosure of Interests in Other Entities IAS 16 (Amended) Property, Plant and EquipmentIAS 27 (Amended) Consolidated and Separate Financial StatementsIAS 38 (Amended) Intangible Assets IFRSs 2012-2014 Cycle Improvement cycle – various standards
Standards in issue but not yet effectiveAt the date of authorisation of these financial statements, the following Standards and Interpretations which have not been applied in these financial statements were in issue but not yet effective (and in some cases had not yet been adopted by the EU):
Annual Improvements to:
IAS 7 (Amended) Disclosure InitiativeIAS 12 (Amended) Recognition of Deferred Tax Assets for Unrealised LossesIFRS 2 (Amended) Share-based PaymentsIFRS 9 Financial InstrumentsIFRS 15 Revenue from Contracts with CustomersIFRS 16 LeasesIFRS 10 (Amended) Consolidated Financial Statements IAS 28 (Amended) Investments in Associates
The directors do not expect that the adoption of the Standards listed above will have a material impact on the financial statements of the Group in future periods, except that IFRS 9 will impact both the measurement and disclosures of financial instruments and IFRS 15 may have an impact on revenue recognition and related disclosures.
General informationThe Group is incorporated and registered in Guernsey. These financial statements are presented in pounds sterling, this being the currency of the primary economic environment in which the Group operates.
28 Shore Capital Group Limited Annual Report and Accounts 2016
Notes to the Financial Statements continued For the year ended 31 December 2016
Basis of accountingThe financial statements have been prepared on the historical cost basis, except for the revaluation of certain financial instruments. The financial statements are rounded to the nearest thousand (expressed as thousands and with no decimal place – £’000), except where otherwise indicated. The principal accounting policies adopted are set out below.
During the year it was noted that certain investments had historically been presented incorrectly in the Statement of Financial Position. These have been re-presented in note 16, correctly allocating the relevant balances between Non Current – Available for Sale Assets and Non Current Fair Value Through Profit and Loss Assets. See note 16 for further details.
Basis of consolidationThe consolidated financial statements incorporate the financial statements of the Company and entities controlled by the Company (its subsidiaries) made up to 31 December each year. Control is achieved where the Company has the power to govern the financial and operating policies of an investee entity so as to obtain benefits from its activities.
Non-controlling interests in the net assets of consolidated subsidiaries are identified separately from the Group’s equity therein. Non-controlling interests consist of the amount of those interests at the date of the original business combination and the non controlling interest’s share of changes in equity since the date of the combination.
Where necessary, adjustments are made to the financial statements of subsidiaries to bring the accounting policies used into line with those used by the Group. All intra-group transactions, balances, income and expenses are eliminated on consolidation.
Judgements and key sources of estimation uncertaintyThe preparation of the financial statements requires management to make judgements, estimates and assumptions that affect the amounts reported for assets and liabilities as at the balance sheet date and the amounts reported for revenues and expenses during the year. However, the nature of estimation means that actual outcomes could differ from those estimates.
JudgementsIn the process of applying the Group’s accounting policies, management has made the following judgements, apart from those involving estimations, which have the most significant effect on the amounts recognised in the financial statements:
TaxationThe Company and its subsidiaries are subject to routine tax audits and also a process whereby tax computations are discussed and agreed with the appropriate authorities. Whilst the ultimate outcome of such tax audits and discussions cannot be determined with certainty, management estimates the level of provision required for both current and deferred tax on the basis of professional advice and the nature of any current discussions with the tax authority concerned.
Deferred tax assetsManagement judgement is required to determine the amount of deferred tax assets that can be recognised based upon the likely timing and level of future taxable profits together with an assessment of the effect of future tax planning strategies. The carrying value of deferred tax assets is set out in note 7.
Estimates and assumptionsThe key assumptions concerning the future and other key sources of estimation uncertainty at the balance sheet date that have a significant risk of causing a material adjustment to the carrying amounts of assets and liabilities within the next financial year are discussed below.
Fair value of unquoted equity instrumentsWhere there is no available representative external valuation, judgement is required to determine the most appropriate valuation method for unquoted equity instruments. Further details are set out later in this note 1 and in notes 16, 17 and 25(f).
Share-based paymentsThe Group measures the cost of equity settled transactions with employees by reference to the fair value of the equity instruments at the date at which they are granted. Judgement is required in determining the most appropriate valuation model for a grant of equity instruments, depending on the terms and conditions of the grant. Management are also required to use judgement in determining the most appropriate inputs to the valuation model. Details of the assumptions and model used are set out in note 6(c).
1. Accounting Policies continued
29Shore Capital Group Limited Annual Report and Accounts 2016
IntangiblesWhere there is no available representative external valuation, judgement is required to determine the fair value at each balance sheet date to establish any indicators of impairment. Where the asset does not currently generate cash flows, the Group estimates the future cash flows discounted to their present values using a pre-tax discount rate.
RevenueRevenue includes the net profit/loss on principal trading, commission income, corporate advisory fees, fund management fees and other ancillary fees.
Dividends and interest arising on bull and bear positions in securities form part of dealing profits and, because they are also reflected by movements in market prices, are not identified separately.
Fees from advisory engagements for which the work is substantially complete or which are at a stage where work for which separate payment is due, and which will become due but are not yet invoiced are recorded on a right to consideration basis. Where such fees are contingent on the outcome of a transaction they are only accounted for after the transaction has exchanged.
Revenue, including revenue from Stock Exchange transactions, is accounted for at trade/contract date rather than settlement date. Revenue on construction contracts is recognised by reference to the stage of completion of the contract activity at the balance sheet date. When it is probable that total contract costs will exceed total contract revenue, the expected loss is recognised as an expense immediately.
Borrowing costsBorrowing costs directly attributable to the acquisition, construction or production of an asset that necessarily takes a substantial period of time to get ready for its intended use or sale are capitalised as part of the cost of the respective assets. All other borrowing costs are expensed in the period they occur. Borrowing costs consist of interest and other costs that an entity incurs in connection with the borrowing of funds.
Foreign currency translationThe Group’s consolidated financial statements are presented in sterling, which is the Group’s functional currency. That is the currency of the primary economic environment in which the Group operates. Each entity in the Group determines its own functional currency and items included in the financial statements of each entity are measured using that functional currency. Transactions in foreign currencies are initially recorded at the functional currency rate prevailing at the date of the transaction. Monetary assets and liabilities denominated in foreign currencies are retranslated at the functional currency spot rate of exchange ruling at the balance sheet date. All differences are taken to the income statement with the exception of differences on foreign currency borrowings accounted for as a hedge of a net investment in a foreign operation. These are taken directly to equity until the disposal of the net investment, at which time they are recognised in the income statement. Tax charges and credits attributable to exchange differences on those borrowings are also dealt with in equity. Non-monetary items that are measured in terms of historical cost in a foreign currency are translated using the exchange rates as at the dates of the initial transactions. Non-monetary items measured at fair value in a foreign currency are translated using the exchange rates at the date when the fair value is determined.
The assets and liabilities of foreign operations are translated into sterling at the rate of exchange prevailing at the balance sheet date and their income statements are translated at average exchange rates for the period. The exchange differences arising on the translation are taken directly to a separate component of equity. On disposal of a foreign operation, the deferred cumulative amount recognised in equity relating to that particular foreign operation is recognised in the income statement.
Pension costsThe charge against profits is the amount of contributions payable in respect of defined contribution pension arrangements for directors and employees in the year.
TaxationIncome tax expense represents the sum of the tax currently payable and deferred tax.
Current taxThe tax currently payable is based on taxable profit for the year. Taxable profit differs from profit as reported in the income statement because it excludes items of income or expense that are taxable or deductible in other years and it further excludes items that are never taxable or deductible. The Group’s liability for current tax is calculated using tax rates that have been enacted or substantively enacted by the balance sheet date.
1. Accounting Policies continued
30 Shore Capital Group Limited Annual Report and Accounts 2016
Notes to the Financial Statements continued For the year ended 31 December 2016
Deferred tax Deferred tax is the tax expected to be payable or recoverable on differences between the carrying amounts of assets and liabilities in the financial statements and the corresponding tax bases used in the computation of taxable profit, and is accounted for using the balance sheet liability method. Deferred tax liabilities are generally recognised for all taxable temporary differences and deferred tax assets are recognised to the extent that it is probable that taxable profits will be available against which deductible temporary differences can be utilised. Such assets and liabilities are not recognised if the temporary difference arises from goodwill or from the initial recognition (other than in a business combination) of other assets and liabilities in a transaction that affects neither the taxable profit nor the accounting profit.
Deferred tax liabilities are recognised for taxable temporary differences arising on investments in subsidiaries and associates, and interest in joint ventures, except where the Group is able to control the reversal of the temporary difference and it is probable that the temporary difference will not reverse in the foreseeable future.
The carrying amount of deferred tax assets is reviewed at each balance sheet date and reduced to the extent that it is no longer probable that sufficient taxable profits will be available to allow all or part of the asset to be recovered.
Deferred tax is calculated at the tax rates that are expected to apply in the period when the liability is settled or the asset is realised. Deferred tax is charged or credited in the income statement, except when it relates to items charged or credited directly to equity, in which case the deferred tax is also dealt with in equity.
Deferred tax assets and liabilities are offset when there is a legally enforceable right to set off current tax assets against current tax liabilities and when they relate to income taxes levied by the same taxation authority and the Group intends to settle its current tax assets and liabilities on a net basis.
Share-based paymentsThe Group has applied the requirements of IFRS 2 Share-based Payments. In accordance with the transitional provisions, IFRS 2 has been applied to all grants of equity instruments after 7 November 2002 that had not vested by 1 January 2005.
The Group engages in equity settled share-based payment transactions in respect of services received from certain employees and directors. The fair value of the services received is measured by reference to the fair value of the shares or share options granted on the date of the grant. The cost of the employee services received in respect of the share options granted is recognised in the income statement over the period that the services are received, which is the vesting period, together with a corresponding increase in equity. The fair value of the options granted is determined using the Black-Scholes Option Pricing Model, which takes into account the exercise price of the option, the current share price, the risk-free interest rate, the expected volatility of the Group’s share price over the life of the option and other relevant factors. The cumulative expense recognised for equity-settled transactions at each reporting date until the vesting date reflects the extent to which the vesting period has expired and the Group’s best estimate of the number of equity instruments that will ultimately vest. The income statement expense for the year represents the movement in cumulative expense recognised as the beginning and end of the year.
Employer’s National Insurance (“NI”) is accrued at the current rate of NI on differences between the market value at the balance sheet date of the shares that would be acquired when the options are exercised and the exercise price of those options.
The dilutive effect of outstanding share options is reflected as additional share dilution in the computation of diluted earnings per share (further details are given in note 9).
Business CombinationsAcquisitions of subsidiaries and businesses are accounted for using the acquisition method. The consideration for each acquisition is measured at the aggregate of the fair values (at the date of exchange) of assets given, liabilities incurred or assumed, and equity instruments issued by the Group in exchange for control of the acquiree.
Where applicable, the consideration for the acquisition includes any asset or liability resulting from a contingent consideration arrangement, measured at its acquisition-date fair value. Subsequent changes in such fair values are adjusted against the cost of acquisition where they qualify as measurement period adjustments (see below). All other subsequent changes in the fair value of contingent consideration classified as an asset or liability are accounted for in accordance with relevant IFRSs. Changes in the fair value of contingent consideration classified as equity are not recognised.
Where a business combination is achieved in stages, the Group’s previously-held interests in the acquired entity are re-measured to fair value at the acquisition date (i.e. the date the Group attains control) and the resulting gain or loss, if any, is recognised in profit or loss. Amounts arising from interests in the acquiree prior to the acquisition date that have previously been recognised in other comprehensive income are reclassified to profit or loss, where such treatment would be appropriate if that interest were disposed of.
1. Accounting Policies continued

31Shore Capital Group Limited Annual Report and Accounts 2016
The acquiree’s identifiable assets, liabilities and contingent liabilities that meet the conditions for recognition under IFRS 3(2008) are recognised at their fair value at the acquisition date.
If the initial accounting for a business combination is incomplete by the end of the reporting period in which the combination occurs, the Group reports provisional amounts for the items for which the accounting is incomplete. Those provisional amounts are adjusted during the measurement period, or additional assets or liabilities are recognised, to reflect new information obtained about facts and circumstances that existed as of the acquisition date that, if known, would have affected the amounts recognised as of that date.
The measurement period is the period from the date of acquisition to the date the Group obtains complete information about facts and circumstances that existed as of the acquisition date, and is subject to a maximum of one year.
GoodwillOn the acquisition of a business or an interest in a business which is to be consolidated, fair values are attributed to the share of identifiable net assets acquired. Where the cost of acquisition exceeds the fair value attributable to such assets, the difference is treated as purchased goodwill. Goodwill arising on acquisitions before the date of transition to IFRS has been retained at the previous UK GAAP amounts subject to being tested for impairment at that date. The Group evaluates goodwill annually and whenever circumstance indicates the possibility of impairment. Such evaluation is based on comparing the fair value of the cash-generating unit to its carrying value. Where the carrying value exceeds its fair value, an impairment loss is recorded for the difference.
Intangible assetsIntangible assets purchased are measured initially at purchase cost, unless they are acquired as part of a business combination in which case they are measured initially at fair value which has been calculated on the basis of arm’s length transactions.
Where such intangible assets have a remaining life of less than 20 years, they are amortised on a straight line basis over their estimated useful lives.
Where such intangible assets have a remaining life of over 20 years, they are subject to an annual impairment test in accordance with the Group’s accounting policy for the treatment of its non-financial assets.
Impairment of goodwill and other non-financial assetsAt each balance sheet date, the Group reviews the carrying amounts of its assets to determine whether there is any indication that those assets have suffered an impairment loss. If any such indication exists, the recoverable amount of the asset is estimated in order to determine the extent of the impairment loss (if any). Where the asset does not generate cash flows that are independent from other assets (e.g. goodwill), the Group estimates the recoverable amount of the cash generating unit to which the asset belongs. The recoverable amount is the higher of fair value less any cost to sell and value in use. In assessing value in use, the estimated future cash flows are discounted to their present values using a pre-tax discount rate that reflects current market assessments of the time value of money and the risks specific to the asset for which the estimates of future cash flows have not been adjusted.
If the recoverable amount of an asset or cash generating unit is estimated to be less than its carrying amount, the carrying amount of the asset or cash generating unit is reduced to its recoverable amount.
Impairment losses are recognised as an expense immediately. Where an impairment loss subsequently reverses, the carrying amount of the asset or cash generating unit is increased to the revised estimate of its recoverable amount, but so that the increased carrying amount does not exceed the carrying amount that would have been determined had no impairment loss been recognised for the asset or cash generating unit in prior years. A reversal of an impairment loss is recognised as income immediately, unless the relevant asset is carried at a revalued amount, in which case the reversal of the impairment loss is treated as a revaluation increase. However, impairment losses relating to goodwill may not be reversed.
1. Accounting Policies continued
32 Shore Capital Group Limited Annual Report and Accounts 2016
Notes to the Financial Statements continued For the year ended 31 December 2016
Property, plant and equipmentProperty, plant & equipment are stated at cost less accumulated depreciation and impairment. Depreciation is calculated so as to write off the cost of property, plant and equipment by equal annual instalments over their estimated useful lives at the following rates:
Leasehold premises – over the unexpired term of the leaseFixtures and equipment – 25-33% per annumAsset rental – 4% per annumMotor vehicles – 16.7% per annum
Depreciation of an asset commences when it is available for use, i.e., when it is in the location and condition necessary for it to be capable of operating in the manner intended by management.
Property and operating leasesRentals paid under operating leases are charged to income statement evenly over the primary period of the contract.
Investment propertyInvestment property which is held to earn rental income is held at fair value at the balance sheet date. Gains or losses arising from changes in the fair value of the investment property are included in profit or loss for the period in which they arise.
An investment property is derecognised upon disposal or when the investment property is permanently withdrawn from use and no future economic benefits are expected from the disposal. Any gain or loss arising on derecognition of the property (calculated as the difference between the net disposal proceeds and the carrying amount of the asset) is included in profit or loss in the period in which the property is derecognised.
Financial instrumentsFinancial assets and financial liabilities are recognised in the Group’s balance sheet when the Group becomes a party to the contractual provisions of the instrument.
Financial assets and liabilities Investments are recognised and derecognised on trade date where the purchase or sale of an investment is under a contract whose terms require delivery of the investment within the timeframe established by the market concerned, and are initially measured at fair value, plus transaction costs, except for those financial assets classified as at fair value through profit or loss, which are initially measured at fair value.
Financial assets are classified into the following specified categories: financial assets ‘at fair value through profit or loss’ (FVTPL), ‘available-for-sale’ (AFS) financial assets and ‘loans and receivables’. The classification depends on the nature and purpose of the financial assets and is determined at the time of initial recognition.
Financial liabilities are classified as either financial liabilities ‘at FVTPL’ or ‘other financial liabilities’.
Financial assets and liabilities at FVTPLFinancial assets and liabilities are classified as at FVTPL where the financial asset or liability is either held for trading or it is designated as at FVTPL. A financial asset or liability is classified as held for trading if:
• it has been acquired principally for the purpose of selling in the near future; or• it is a part of an identified portfolio of financial instruments which the Group manages together and has a recent actual pattern of
short-term profit-taking; or • it is a derivative which is not designated as an effective as a hedging instrument.
Financial instruments which are classified as held for trading through profit or loss comprise bull and bear positions in securities and derivative instruments. Bull and bear positions are valued at closing out prices at the close of business on the balance sheet date, namely bull positions at the bid price and bear positions at the offer price.
Derivatives are initially recognised at the contract value at the date a derivative contract is entered into and are subsequently re-measured to their fair value at each balance sheet date. The resulting gain or loss is recognised in profit or loss immediately.
1. Accounting Policies continued
33Shore Capital Group Limited Annual Report and Accounts 2016
A financial asset or liability, other than a financial asset or liability held for trading, may be designated as at FVTPL upon initial recognition if:
• such designation eliminates or significantly reduces a measurement or recognition inconsistency that would otherwise arise; or • the financial asset forms part of a group of financial assets or financial liabilities or both, which is managed and its performance is
evaluated on a fair value basis, in accordance with the Group’s documented risk management or investment strategy; or• it forms part of a contract containing one or more embedded derivatives, and IAS 39 Financial Instruments: Recognition and
Measurement permits the entire combined contract (asset or liability) to be designated as at FVTPL.
Financial assets and liabilities at FVTPL are stated at fair value, with any resultant gain or loss recognised in profit or loss within operating profit. The net gain or loss recognised in profit or loss incorporates any dividend or interest earned on the financial asset or financial liability.
The Group’s financial assets designated as at FVTPL upon initial recognition include positions in quoted and unquoted securities. The valuation technique and assumptions used to fair value these instruments are disclosed within note 16.
Available-for-sale investmentsAvailable-for-sale investments are revalued to their fair value with such revaluation being taken directly to equity. Where such investments are in unlisted securities, they are valued by the directors at the most recent available representative arm’s length price. Investments in listed securities held as available-for-sale investments are valued by reference to the market price of the shares. They are re-measured to their fair value at each balance sheet date.
Loans and receivablesTrade receivables and other receivables which have fixed or determinable payments which are not quoted in an active market are classified as loans and receivables. Loans and receivables are measured at amortised cost using the effective interest method, less any impairment. Interest income is recognised by applying the effective interest rate, except for short-term receivables when the recognition of interest would be immaterial.
Effective interest methodThe effective interest method is a method of calculating the amortised cost of a financial asset and of allocating interest income over the relevant period. The effective interest rate is the rate that exactly discounts estimated future cash receipts (including all fees paid or received that form an integral part of the effective interest rate, transaction costs and other premiums or discounts) through the expected life of the financial asset, or, where appropriate, a shorter period.
Derecognition of financial assetsThe Group derecognises a financial asset only when the contractual rights to the cash flows from the asset expire; or it transfers the financial asset and substantially all the risks and rewards of ownership of the asset to another entity. If the Group neither transfers nor retains substantially all the risks and rewards of ownership and continues to control the transferred asset, the Group recognises its retained interest in the asset and an associated liability for amounts it may have to pay. If the Group retains substantially all the risks and rewards of ownership of a transferred financial asset, the Group continues to recognise the financial asset and also recognises a collateralised borrowing for the proceeds received.
Impairment of financial assetsAt each balance sheet date, the Group reviews whether there is any objective evidence that a financial asset or a group of financial assets is impaired. A financial asset or a group of financial assets is deemed to be impaired if, and only if, there is objective evidence of impairment as a result of one or more events that has occurred after the initial recognition of the asset (an incurred ‘loss event’) and that loss event has an impact on the estimated future cash flows of the financial asset or the group of financial assets that can be reliably estimated. Evidence of impairment may include indications that the debtors or a group of debtors is experiencing significant financial difficulty, default or delinquency in interest or principal payments, the probability that they will enter bankruptcy or other financial reorganisation and where observable data indicate that there is a measurable decrease in the estimated future cash flows, such as changes in arrears or economic conditions that correlate with defaults.
Financial assets carried at amortised costFor financial assets carried at amortised cost the Group first assesses individually whether objective evidence of impairment exists individually for financial assets that are individually significant, or collectively for financial assets that are not individually significant. If the Group determines that no objective evidence of impairment exists for an individually assessed financial asset, whether significant or not, it includes the asset in a group of financial assets with similar credit risk characteristics and collectively assesses them for impairment. Assets that are individually assessed for impairment and for which an impairment loss is, or continues to be, recognised are not included in a collective assessment of impairment.
1. Accounting Policies continued
34 Shore Capital Group Limited Annual Report and Accounts 2016
Notes to the Financial Statements continued For the year ended 31 December 2016
If there is objective evidence that an impairment loss has incurred, the amount of the loss is measured as the difference between the asset’s carrying amount and the present value of estimated future cash flows (excluding future expected credit losses that have not yet been incurred). The present value of the estimated future cash flows is discounted at the financial assets original effective interest rate. If a loan has a variable interest rate, the discount rate for measuring any impairment loss is the current effective interest rate.
The carrying amount of the asset is reduced through the use of an allowance account and the amount of the loss is recognised in the income statement. Interest income continues to be accrued on the reduced carrying amount and is accrued using the rate of interest used to discount the future cash flows for the purpose of measuring the impairment loss. The interest income is recorded as part of finance income in the income statement. Loans together with the associated allowance are written off when there is no realistic prospect of future recovery and all collateral has been realised or has been transferred to the Group. If, in a subsequent year, the amount of the estimated impairment loss increases or decreases because of an event occurring after the impairment was recognised, the previously recognised impairment loss is increased or reduced by adjusting the allowance account. If a future write-off is later recovered, the recovery is credited to finance costs in the income statement.
The present value of the estimated future cash flows is discounted at the financial asset’s original effective interest rate. If a loan has a variable interest rate, the discount rate for measuring any impairment loss is the current effective interest rate.
Available-for-sale financial investmentsFor available-for-sale financial investments, the Group assesses at each reporting date whether there is objective evidence that an investment or a group of investments is impaired.
In the case of equity investments classified as available-for-sale, objective evidence would include a significant or prolonged decline in the fair value of the investment below its cost. ‘Significant’ is to be evaluated against the original cost of the investment and ‘prolonged’ against the period in which the fair value has been below its original cost. Where there is evidence of impairment, the cumulative loss – measured as the difference between the acquisition cost and the current fair value, less any impairment loss on that investment previously recognised in the income statement – is removed from other comprehensive income and recognised in the income statement. Impairment losses on equity investments are not reversed through the income statement; increases in their fair value after impairment are recognised directly in other comprehensive income.
In the case of debt instruments classified as available-for-sale, impairment is assessed based on the same criteria as financial assets carried at amortised cost. However, the amount recorded for impairment is the cumulative loss measured as the difference between the amortised cost and the current fair value, less any impairment loss on that investment previously recognised in the income statement.
Cash flow hedgesThe effective portion of the gain or loss on the hedging instrument is recognised directly in equity, while any ineffective portion is recognised immediately in the income statement.
Amounts taken to equity are transferred to the income statement when the hedged transaction affects profit or loss, such as when the hedged financial income or financial expense is recognised or when a forecast sale occurs. Where the hedged item is the cost of a non-financial asset or non-financial liability, the amounts taken to equity are transferred to the initial carrying amount of the non-financial asset or liability.
If the forecast transaction or firm commitment is no longer expected to occur, amounts previously recognised in equity are transferred to the income statement. If the hedging instrument expires or is sold, terminated or exercised without replacement or rollover, or if its designation as a hedge is revoked, amounts previously recognised in equity remain in equity until the forecast transaction or firm commitment occurs. Cash and cash equivalentsCash comprises cash in hand and on-demand deposits which may be accessed without penalty. For the purposes of the consolidated cash flow statement, cash and cash equivalents consist of cash and cash equivalents as defined above, net of outstanding bank overdrafts.
Trade and other payablesTrade and other payables are measured on initial recognition at fair value, and are subsequently measured at amortised cost.
Equity instrumentsEquity instruments issued by the Company are recorded at the proceeds received, net of direct issue costs. An equity instrument is any contract which evidences a residual interest in the assets of the Group after deducting all of its liabilities.
1. Accounting Policies continued
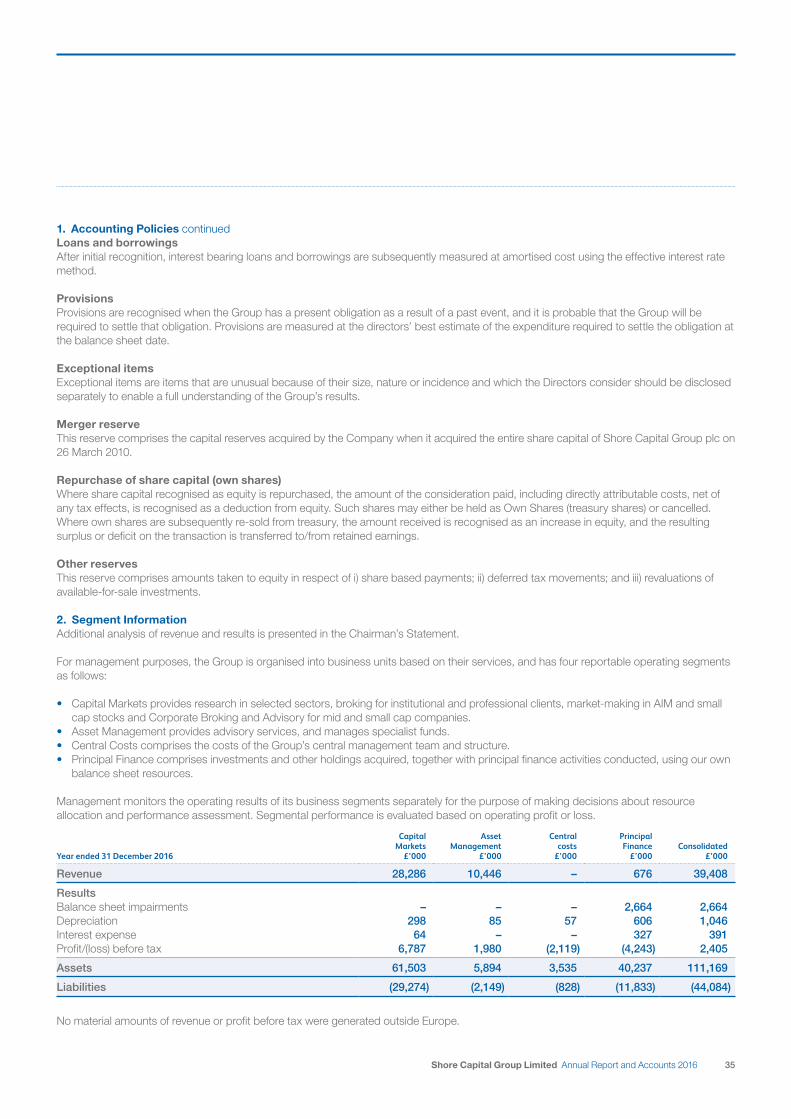
35Shore Capital Group Limited Annual Report and Accounts 2016
Loans and borrowingsAfter initial recognition, interest bearing loans and borrowings are subsequently measured at amortised cost using the effective interest rate method.
ProvisionsProvisions are recognised when the Group has a present obligation as a result of a past event, and it is probable that the Group will be required to settle that obligation. Provisions are measured at the directors’ best estimate of the expenditure required to settle the obligation at the balance sheet date.
Exceptional itemsExceptional items are items that are unusual because of their size, nature or incidence and which the Directors consider should be disclosed separately to enable a full understanding of the Group’s results.
Merger reserveThis reserve comprises the capital reserves acquired by the Company when it acquired the entire share capital of Shore Capital Group plc on 26 March 2010.
Repurchase of share capital (own shares)Where share capital recognised as equity is repurchased, the amount of the consideration paid, including directly attributable costs, net of any tax effects, is recognised as a deduction from equity. Such shares may either be held as Own Shares (treasury shares) or cancelled. Where own shares are subsequently re-sold from treasury, the amount received is recognised as an increase in equity, and the resulting surplus or deficit on the transaction is transferred to/from retained earnings.
Other reservesThis reserve comprises amounts taken to equity in respect of i) share based payments; ii) deferred tax movements; and iii) revaluations of available-for-sale investments.
2. Segment InformationAdditional analysis of revenue and results is presented in the Chairman’s Statement.
For management purposes, the Group is organised into business units based on their services, and has four reportable operating segments as follows:
• Capital Markets provides research in selected sectors, broking for institutional and professional clients, market-making in AIM and small cap stocks and Corporate Broking and Advisory for mid and small cap companies.
• Asset Management provides advisory services, and manages specialist funds.• Central Costs comprises the costs of the Group’s central management team and structure.• Principal Finance comprises investments and other holdings acquired, together with principal finance activities conducted, using our own
balance sheet resources.
Management monitors the operating results of its business segments separately for the purpose of making decisions about resource allocation and performance assessment. Segmental performance is evaluated based on operating profit or loss.
Year ended 31 December 2016
Capital Markets
£’000
Asset Management
£’000
Central costs
£’000
Principal Finance
£’000Consolidated
£’000
Revenue 28,286 10,446 – 676 39,408
Results Balance sheet impairments – – – 2,664 2,664Depreciation 298 85 57 606 1,046 Interest expense 64 – – 327 391 Profit/(loss) before tax 6,787 1,980 (2,119) (4,243) 2,405
Assets 61,503 5,894 3,535 40,237 111,169
Liabilities (29,274) (2,149) (828) (11,833) (44,084)
No material amounts of revenue or profit before tax were generated outside Europe.
1. Accounting Policies continued
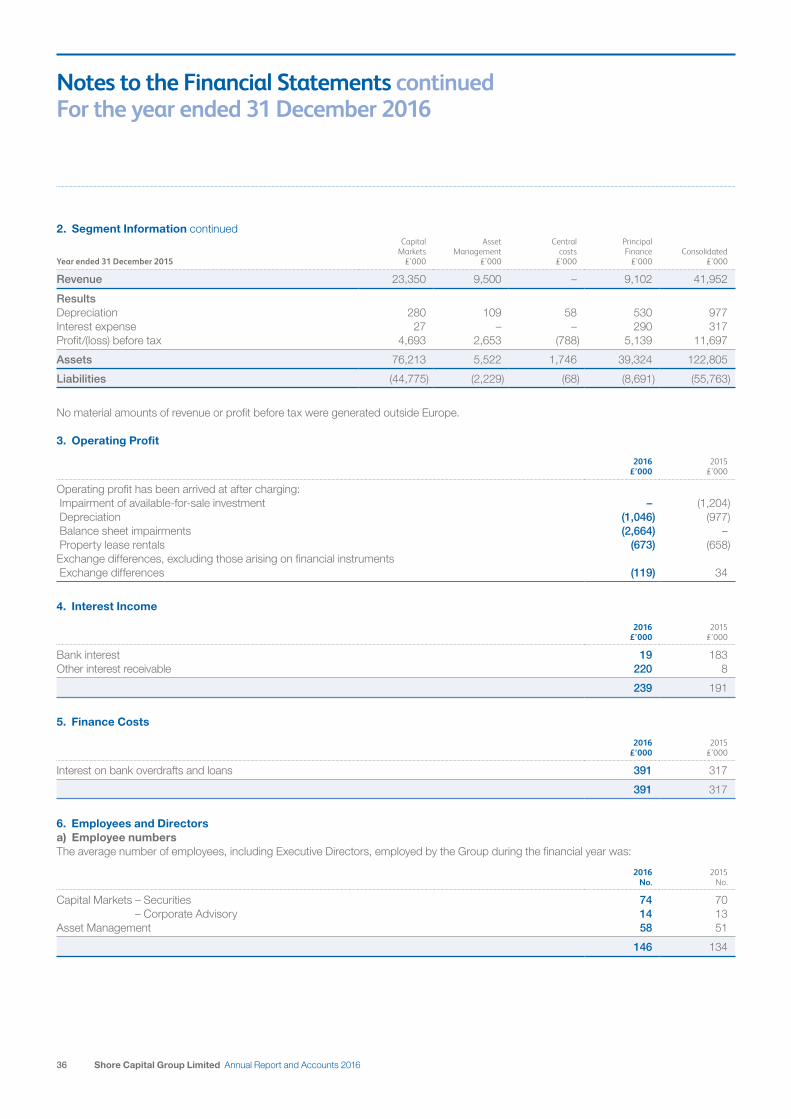
36 Shore Capital Group Limited Annual Report and Accounts 2016
Notes to the Financial Statements continued For the year ended 31 December 2016
Year ended 31 December 2015
Capital Markets
£’000
Asset Management
£’000
Central costs
£’000
Principal Finance
£’000Consolidated
£’000
Revenue 23,350 9,500 – 9,102 41,952
ResultsDepreciation 280 109 58 530 977 Interest expense 27 – – 290 317 Profit/(loss) before tax 4,693 2,653 (788) 5,139 11,697
Assets 76,213 5,522 1,746 39,324 122,805
Liabilities (44,775) (2,229) (68) (8,691) (55,763)
No material amounts of revenue or profit before tax were generated outside Europe. 3. Operating Profit
2016 £’000
2015 £’000
Operating profit has been arrived at after charging: Impairment of available-for-sale investment – (1,204) Depreciation (1,046) (977) Balance sheet impairments (2,664) – Property lease rentals (673) (658)Exchange differences, excluding those arising on financial instruments Exchange differences (119) 34
4. Interest Income
2016
£’0002015
£’000
Bank interest 19 183 Other interest receivable 220 8
239 191
5. Finance Costs
2016
£’0002015
£’000
Interest on bank overdrafts and loans 391 317
391 317
6. Employees and Directorsa) Employee numbersThe average number of employees, including Executive Directors, employed by the Group during the financial year was:
2016
No.2015
No.
Capital Markets – Securities 74 70 – Corporate Advisory 14 13 Asset Management 58 51
146 134
2. Segment Information continued
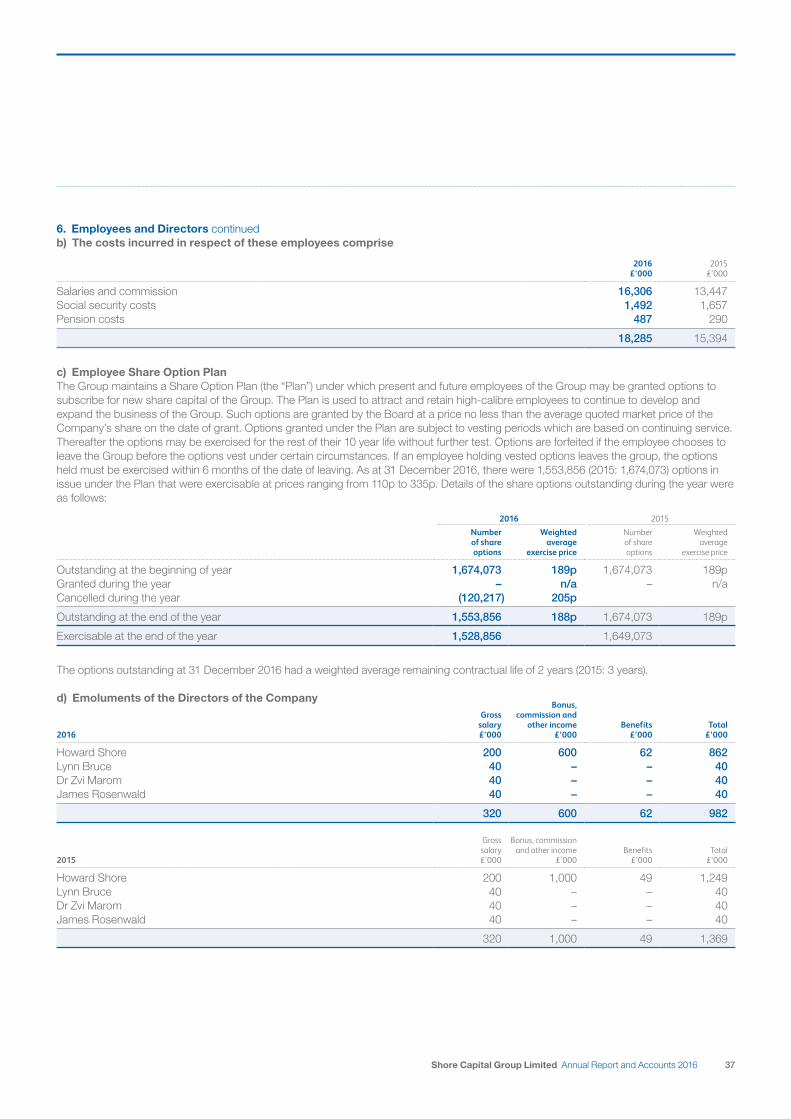
37Shore Capital Group Limited Annual Report and Accounts 2016
b) The costs incurred in respect of these employees comprise
2016
£’0002015
£’000
Salaries and commission 16,306 13,447 Social security costs 1,492 1,657 Pension costs 487 290
18,285 15,394
c) Employee Share Option PlanThe Group maintains a Share Option Plan (the “Plan”) under which present and future employees of the Group may be granted options to subscribe for new share capital of the Group. The Plan is used to attract and retain high-calibre employees to continue to develop and expand the business of the Group. Such options are granted by the Board at a price no less than the average quoted market price of the Company’s share on the date of grant. Options granted under the Plan are subject to vesting periods which are based on continuing service. Thereafter the options may be exercised for the rest of their 10 year life without further test. Options are forfeited if the employee chooses to leave the Group before the options vest under certain circumstances. If an employee holding vested options leaves the group, the options held must be exercised within 6 months of the date of leaving. As at 31 December 2016, there were 1,553,856 (2015: 1,674,073) options in issue under the Plan that were exercisable at prices ranging from 110p to 335p. Details of the share options outstanding during the year were as follows:
2016 2015
Number of share options
Weighted average
exercise price
Number of share options
Weighted average
exercise price
Outstanding at the beginning of year 1,674,073 189p 1,674,073 189pGranted during the year – n/a – n/aCancelled during the year (120,217) 205p
Outstanding at the end of the year 1,553,856 188p 1,674,073 189p
Exercisable at the end of the year 1,528,856 1,649,073
The options outstanding at 31 December 2016 had a weighted average remaining contractual life of 2 years (2015: 3 years).
d) Emoluments of the Directors of the Company
2016
Gross salary £’000
Bonus, commission and
other income £’000
Benefits £’000
Total £’000
Howard Shore 200 600 62 862Lynn Bruce 40 – – 40Dr Zvi Marom 40 – – 40James Rosenwald 40 – – 40
320 600 62 982
2015
Gross salary £’000
Bonus, commission and other income
£’000Benefits
£’000Total
£’000
Howard Shore 200 1,000 49 1,249Lynn Bruce 40 – – 40Dr Zvi Marom 40 – – 40James Rosenwald 40 – – 40
320 1,000 49 1,369
6. Employees and Directors continued
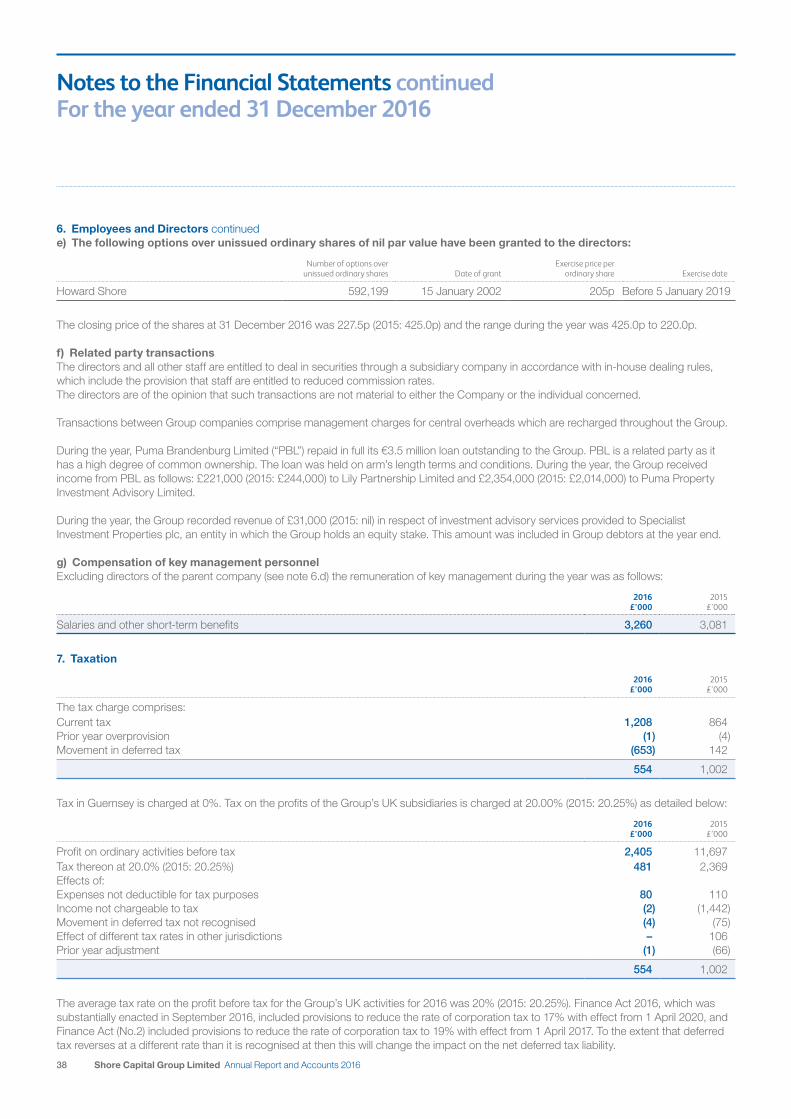
38 Shore Capital Group Limited Annual Report and Accounts 2016
Notes to the Financial Statements continued For the year ended 31 December 2016
e) The following options over unissued ordinary shares of nil par value have been granted to the directors:
Number of options over unissued ordinary shares Date of grant
Exercise price per ordinary share Exercise date
Howard Shore 592,199 15 January 2002 205p Before 5 January 2019
The closing price of the shares at 31 December 2016 was 227.5p (2015: 425.0p) and the range during the year was 425.0p to 220.0p.
f) Related party transactions The directors and all other staff are entitled to deal in securities through a subsidiary company in accordance with in-house dealing rules, which include the provision that staff are entitled to reduced commission rates. The directors are of the opinion that such transactions are not material to either the Company or the individual concerned.
Transactions between Group companies comprise management charges for central overheads which are recharged throughout the Group.
During the year, Puma Brandenburg Limited (“PBL”) repaid in full its €3.5 million loan outstanding to the Group. PBL is a related party as it has a high degree of common ownership. The loan was held on arm’s length terms and conditions. During the year, the Group received income from PBL as follows: £221,000 (2015: £244,000) to Lily Partnership Limited and £2,354,000 (2015: £2,014,000) to Puma Property Investment Advisory Limited.
During the year, the Group recorded revenue of £31,000 (2015: nil) in respect of investment advisory services provided to Specialist Investment Properties plc, an entity in which the Group holds an equity stake. This amount was included in Group debtors at the year end.
g) Compensation of key management personnel Excluding directors of the parent company (see note 6.d) the remuneration of key management during the year was as follows:
2016 £’000
2015 £’000
Salaries and other short-term benefits 3,260 3,081
7. Taxation
2016£’000
2015 £’000
The tax charge comprises: Current tax 1,208 864 Prior year overprovision (1) (4)Movement in deferred tax (653) 142
554 1,002
Tax in Guernsey is charged at 0%. Tax on the profits of the Group’s UK subsidiaries is charged at 20.00% (2015: 20.25%) as detailed below:
2016£’000
2015 £’000
Profit on ordinary activities before tax 2,405 11,697 Tax thereon at 20.0% (2015: 20.25%) 481 2,369 Effects of: Expenses not deductible for tax purposes 80 110 Income not chargeable to tax (2) (1,442)Movement in deferred tax not recognised (4) (75)Effect of different tax rates in other jurisdictions – 106 Prior year adjustment (1) (66)
554 1,002
The average tax rate on the profit before tax for the Group’s UK activities for 2016 was 20% (2015: 20.25%). Finance Act 2016, which was substantially enacted in September 2016, included provisions to reduce the rate of corporation tax to 17% with effect from 1 April 2020, and Finance Act (No.2) included provisions to reduce the rate of corporation tax to 19% with effect from 1 April 2017. To the extent that deferred tax reverses at a different rate than it is recognised at then this will change the impact on the net deferred tax liability.
6. Employees and Directors continued
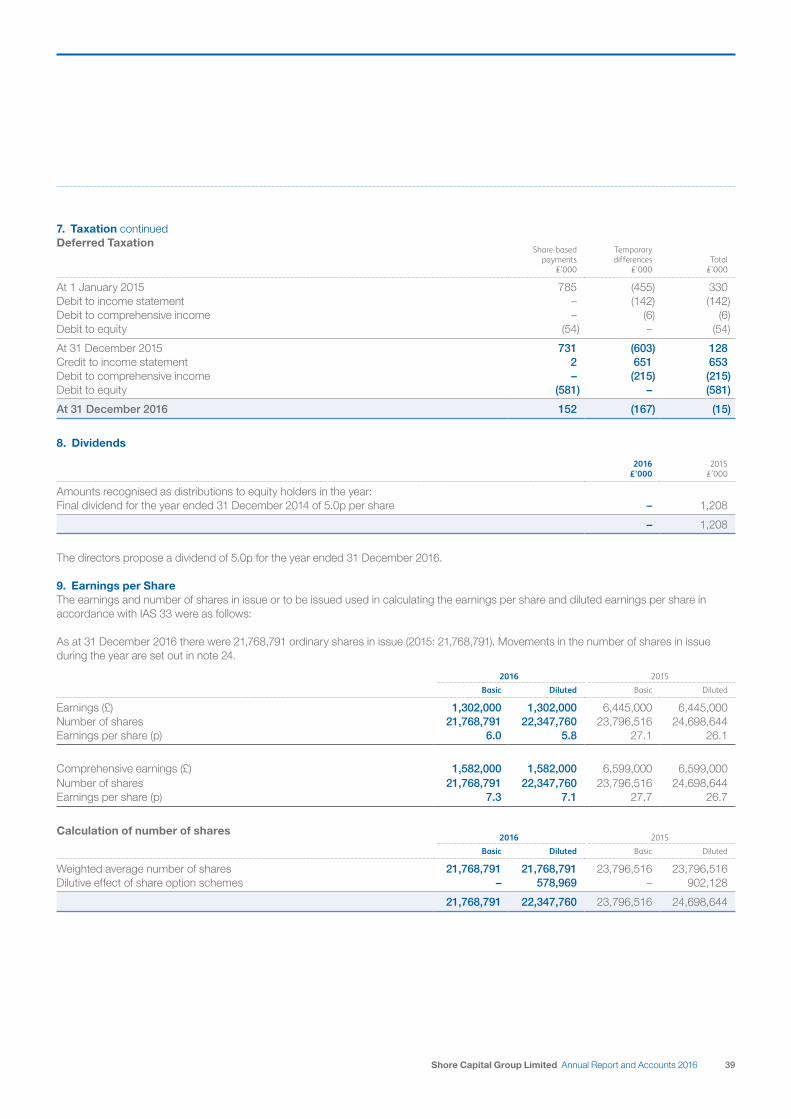
39Shore Capital Group Limited Annual Report and Accounts 2016
Deferred TaxationShare-based
payments £’000
Temporary differences
£’000Total
£’000
At 1 January 2015 785 (455) 330 Debit to income statement – (142) (142)Debit to comprehensive income – (6) (6)Debit to equity (54) – (54)
At 31 December 2015 731 (603) 128 Credit to income statement 2 651 653 Debit to comprehensive income – (215) (215)Debit to equity (581) – (581)
At 31 December 2016 152 (167) (15)
8. Dividends
2016 £’000
2015 £’000
Amounts recognised as distributions to equity holders in the year:Final dividend for the year ended 31 December 2014 of 5.0p per share – 1,208
– 1,208
The directors propose a dividend of 5.0p for the year ended 31 December 2016.
9. Earnings per ShareThe earnings and number of shares in issue or to be issued used in calculating the earnings per share and diluted earnings per share in accordance with IAS 33 were as follows:
As at 31 December 2016 there were 21,768,791 ordinary shares in issue (2015: 21,768,791). Movements in the number of shares in issue during the year are set out in note 24.
2016 2015
Basic Diluted Basic Diluted
Earnings (£) 1,302,000 1,302,000 6,445,000 6,445,000 Number of shares 21,768,791 22,347,760 23,796,516 24,698,644 Earnings per share (p) 6.0 5.8 27.1 26.1
Comprehensive earnings (£) 1,582,000 1,582,000 6,599,000 6,599,000 Number of shares 21,768,791 22,347,760 23,796,516 24,698,644 Earnings per share (p) 7.3 7.1 27.7 26.7
Calculation of number of shares2016 2015
Basic Diluted Basic Diluted
Weighted average number of shares 21,768,791 21,768,791 23,796,516 23,796,516 Dilutive effect of share option schemes – 578,969 – 902,128
21,768,791 22,347,760 23,796,516 24,698,644
7. Taxation continued
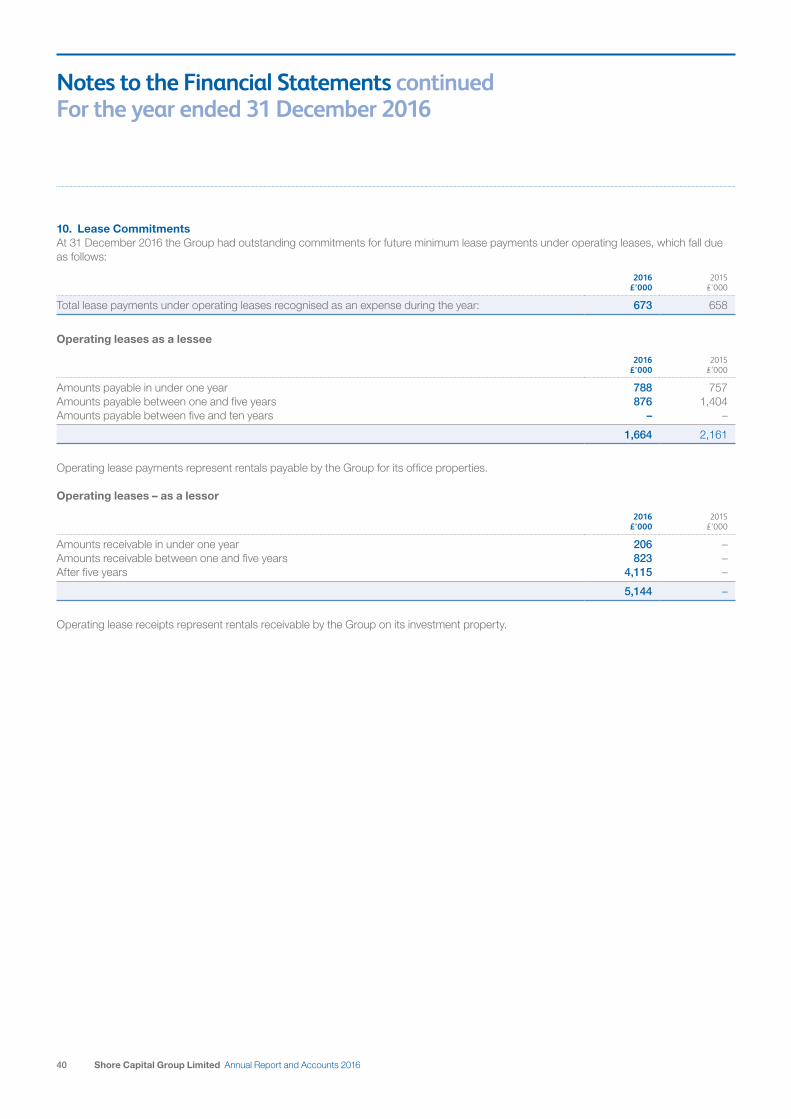
40 Shore Capital Group Limited Annual Report and Accounts 2016
Notes to the Financial Statements continued For the year ended 31 December 2016
10. Lease CommitmentsAt 31 December 2016 the Group had outstanding commitments for future minimum lease payments under operating leases, which fall due as follows:
2016 £’000
2015 £’000
Total lease payments under operating leases recognised as an expense during the year: 673 658
Operating leases as a lessee
2016 £’000
2015 £’000
Amounts payable in under one year 788 757 Amounts payable between one and five years 876 1,404 Amounts payable between five and ten years – –
1,664 2,161
Operating lease payments represent rentals payable by the Group for its office properties.
Operating leases – as a lessor
2016 £’000
2015 £’000
Amounts receivable in under one year 206 – Amounts receivable between one and five years 823 – After five years 4,115 –
5,144 –
Operating lease receipts represent rentals receivable by the Group on its investment property.
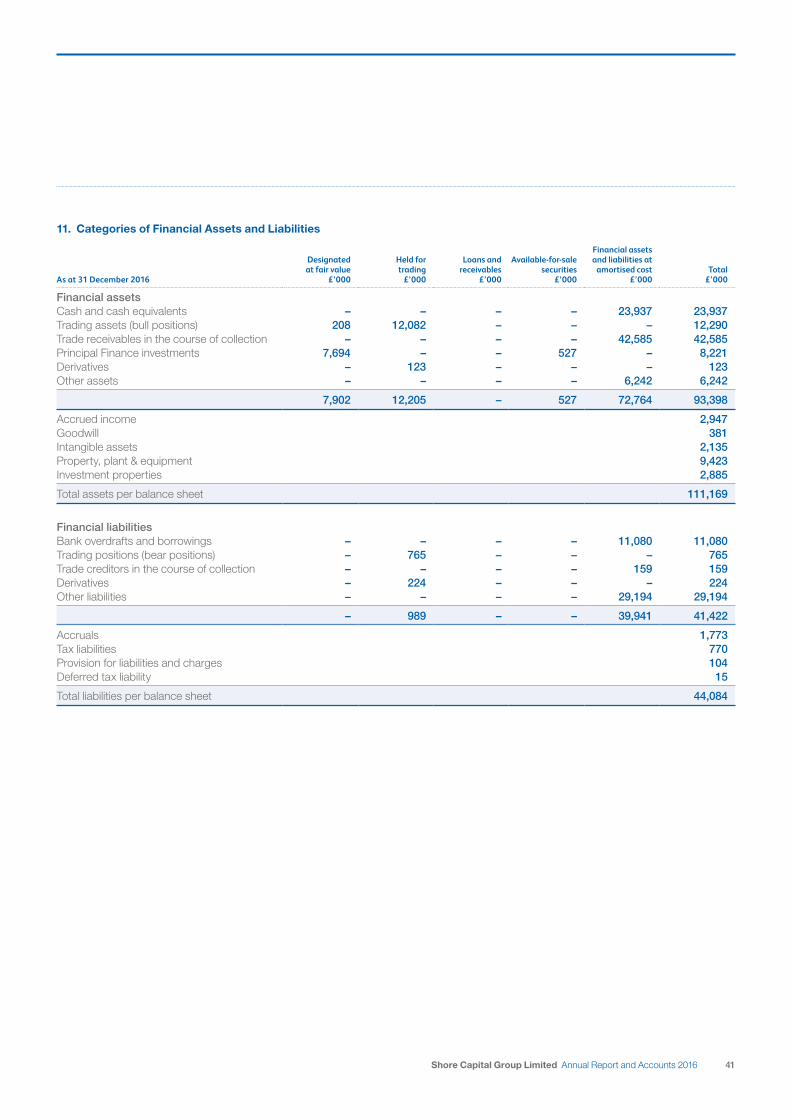
41Shore Capital Group Limited Annual Report and Accounts 2016
11. Categories of Financial Assets and Liabilities
As at 31 December 2016
Designated at fair value
£’000
Held for trading
£’000
Loans and receivables
£’000
Available-for-sale securities
£’000
Financial assets and liabilities at
amortised cost £’000
Total £’000
Financial assets Cash and cash equivalents – – – – 23,937 23,937 Trading assets (bull positions) 208 12,082 – – – 12,290 Trade receivables in the course of collection – – – – 42,585 42,585 Principal Finance investments 7,694 – – 527 – 8,221 Derivatives – 123 – – – 123 Other assets – – – – 6,242 6,242
7,902 12,205 – 527 72,764 93,398
Accrued income 2,947 Goodwill 381 Intangible assets 2,135 Property, plant & equipment 9,423 Investment properties 2,885
Total assets per balance sheet 111,169
Financial liabilities Bank overdrafts and borrowings – – – – 11,080 11,080 Trading positions (bear positions) – 765 – – – 765 Trade creditors in the course of collection – – – – 159 159 Derivatives – 224 – – – 224 Other liabilities – – – – 29,194 29,194
– 989 – – 39,941 41,422
Accruals 1,773 Tax liabilities 770 Provision for liabilities and charges 104 Deferred tax liability 15
Total liabilities per balance sheet 44,084
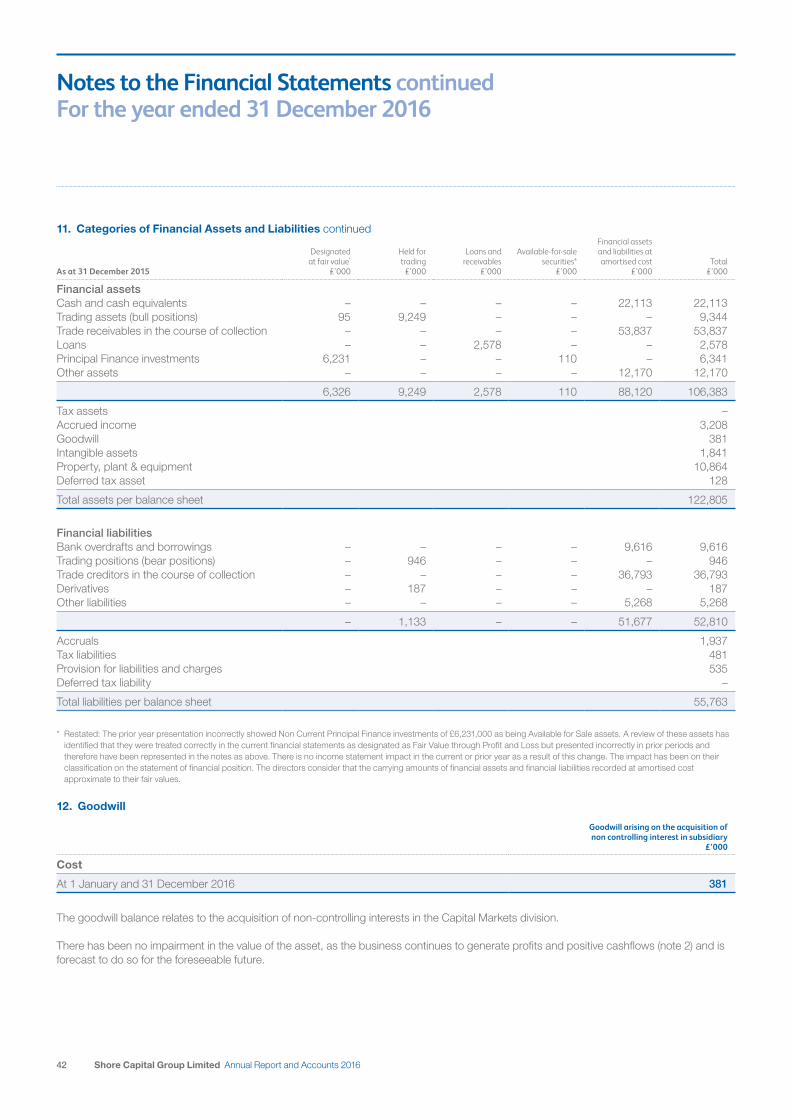
42 Shore Capital Group Limited Annual Report and Accounts 2016
Notes to the Financial Statements continued For the year ended 31 December 2016
As at 31 December 2015
Designated at fair value*
£’000
Held for trading
£’000
Loans and receivables
£’000
Available-for-sale securities*
£’000
Financial assets and liabilities at amortised cost
£’000Total
£’000
Financial assetsCash and cash equivalents – – – – 22,113 22,113 Trading assets (bull positions) 95 9,249 – – – 9,344 Trade receivables in the course of collection – – – – 53,837 53,837 Loans – – 2,578 – – 2,578 Principal Finance investments 6,231 – – 110 – 6,341 Other assets – – – – 12,170 12,170
6,326 9,249 2,578 110 88,120 106,383
Tax assets – Accrued income 3,208 Goodwill 381 Intangible assets 1,841 Property, plant & equipment 10,864 Deferred tax asset 128
Total assets per balance sheet 122,805
Financial liabilitiesBank overdrafts and borrowings – – – – 9,616 9,616 Trading positions (bear positions) – 946 – – – 946 Trade creditors in the course of collection – – – – 36,793 36,793 Derivatives – 187 – – – 187 Other liabilities – – – – 5,268 5,268
– 1,133 – – 51,677 52,810
Accruals 1,937 Tax liabilities 481 Provision for liabilities and charges 535 Deferred tax liability –
Total liabilities per balance sheet 55,763
* Restated: The prior year presentation incorrectly showed Non Current Principal Finance investments of £6,231,000 as being Available for Sale assets. A review of these assets has identified that they were treated correctly in the current financial statements as designated as Fair Value through Profit and Loss but presented incorrectly in prior periods and therefore have been represented in the notes as above. There is no income statement impact in the current or prior year as a result of this change. The impact has been on their classification on the statement of financial position. The directors consider that the carrying amounts of financial assets and financial liabilities recorded at amortised cost approximate to their fair values.
12. Goodwill
Goodwill arising on the acquisition of non controlling interest in subsidiary
£’000
Cost
At 1 January and 31 December 2016 381
The goodwill balance relates to the acquisition of non-controlling interests in the Capital Markets division.
There has been no impairment in the value of the asset, as the business continues to generate profits and positive cashflows (note 2) and is forecast to do so for the foreseeable future.
11. Categories of Financial Assets and Liabilities continued
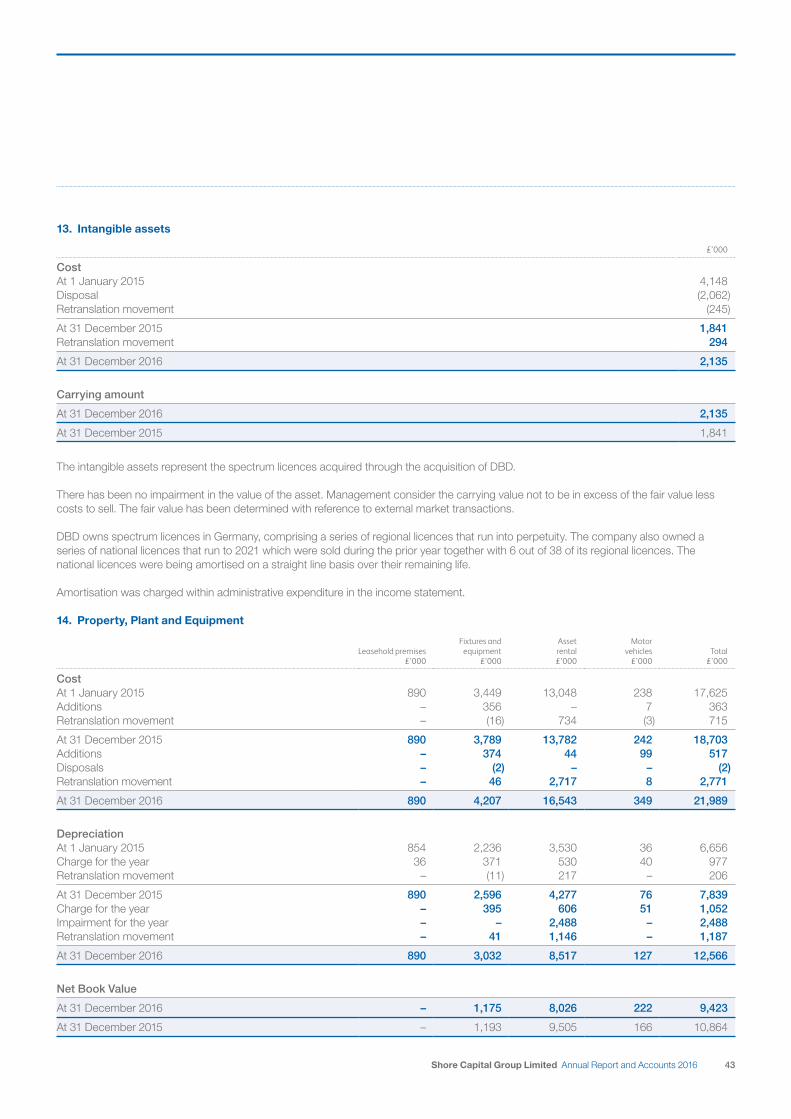
43Shore Capital Group Limited Annual Report and Accounts 2016
13. Intangible assets
£’000
Cost At 1 January 2015 4,148 Disposal (2,062)Retranslation movement (245)
At 31 December 2015 1,841 Retranslation movement 294
At 31 December 2016 2,135
Carrying amount
At 31 December 2016 2,135
At 31 December 2015 1,841
The intangible assets represent the spectrum licences acquired through the acquisition of DBD.
There has been no impairment in the value of the asset. Management consider the carrying value not to be in excess of the fair value less costs to sell. The fair value has been determined with reference to external market transactions.
DBD owns spectrum licences in Germany, comprising a series of regional licences that run into perpetuity. The company also owned a series of national licences that run to 2021 which were sold during the prior year together with 6 out of 38 of its regional licences. The national licences were being amortised on a straight line basis over their remaining life.
Amortisation was charged within administrative expenditure in the income statement.
14. Property, Plant and Equipment
Leasehold premises £’000
Fixtures and equipment
£’000
Asset rental £’000
Motor vehicles
£’000Total
£’000
CostAt 1 January 2015 890 3,449 13,048 238 17,625 Additions – 356 – 7 363 Retranslation movement – (16) 734 (3) 715
At 31 December 2015 890 3,789 13,782 242 18,703 Additions – 374 44 99 517 Disposals – (2) – – (2)Retranslation movement – 46 2,717 8 2,771
At 31 December 2016 890 4,207 16,543 349 21,989
Depreciation At 1 January 2015 854 2,236 3,530 36 6,656 Charge for the year 36 371 530 40 977 Retranslation movement – (11) 217 – 206
At 31 December 2015 890 2,596 4,277 76 7,839 Charge for the year – 395 606 51 1,052 Impairment for the year – – 2,488 – 2,488 Retranslation movement – 41 1,146 – 1,187
At 31 December 2016 890 3,032 8,517 127 12,566
Net Book Value
At 31 December 2016 – 1,175 8,026 222 9,423
At 31 December 2015 – 1,193 9,505 166 10,864
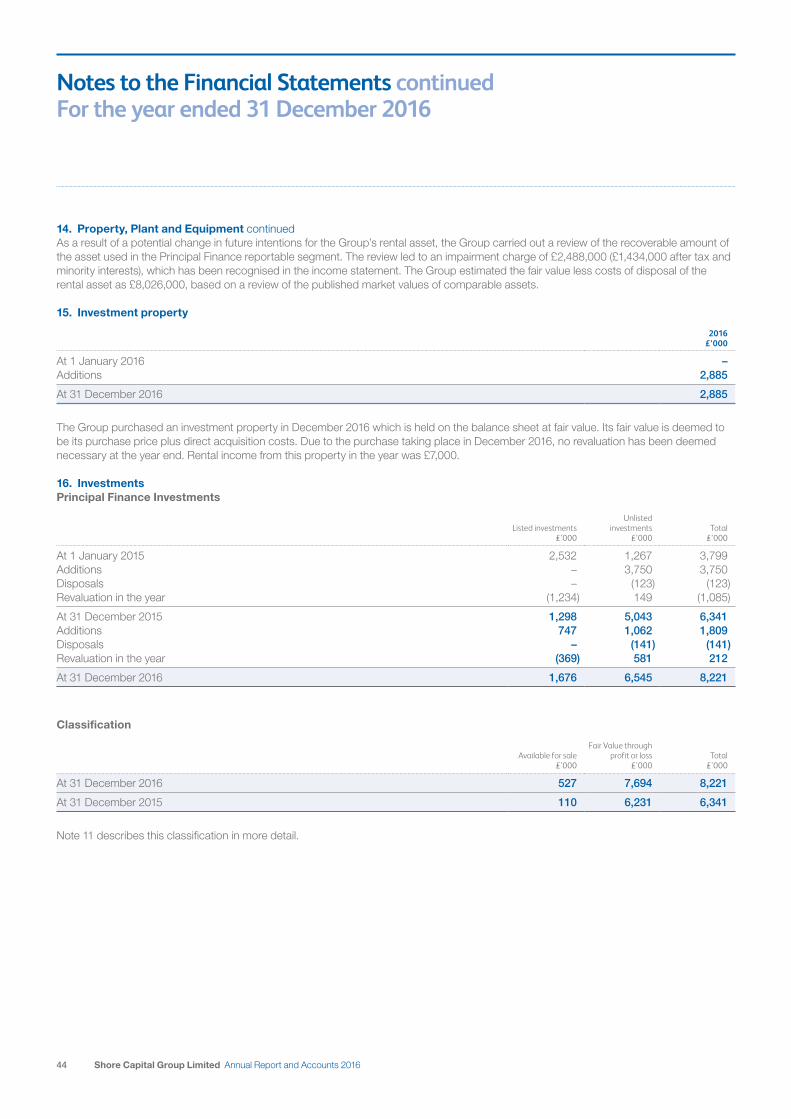
44 Shore Capital Group Limited Annual Report and Accounts 2016
Notes to the Financial Statements continued For the year ended 31 December 2016
As a result of a potential change in future intentions for the Group’s rental asset, the Group carried out a review of the recoverable amount of the asset used in the Principal Finance reportable segment. The review led to an impairment charge of £2,488,000 (£1,434,000 after tax and minority interests), which has been recognised in the income statement. The Group estimated the fair value less costs of disposal of the rental asset as £8,026,000, based on a review of the published market values of comparable assets.
15. Investment property
2016 £’000
At 1 January 2016 – Additions 2,885
At 31 December 2016 2,885
The Group purchased an investment property in December 2016 which is held on the balance sheet at fair value. Its fair value is deemed to be its purchase price plus direct acquisition costs. Due to the purchase taking place in December 2016, no revaluation has been deemed necessary at the year end. Rental income from this property in the year was £7,000.
16. InvestmentsPrincipal Finance Investments
Listed investments£’000
Unlisted investments
£’000Total
£’000
At 1 January 2015 2,532 1,267 3,799 Additions – 3,750 3,750 Disposals – (123) (123)Revaluation in the year (1,234) 149 (1,085)
At 31 December 2015 1,298 5,043 6,341 Additions 747 1,062 1,809 Disposals – (141) (141)Revaluation in the year (369) 581 212
At 31 December 2016 1,676 6,545 8,221
Classification
Available for sale£’000
Fair Value through profit or loss
£’000Total
£’000
At 31 December 2016 527 7,694 8,221
At 31 December 2015 110 6,231 6,341
Note 11 describes this classification in more detail.
14. Property, Plant and Equipment continued
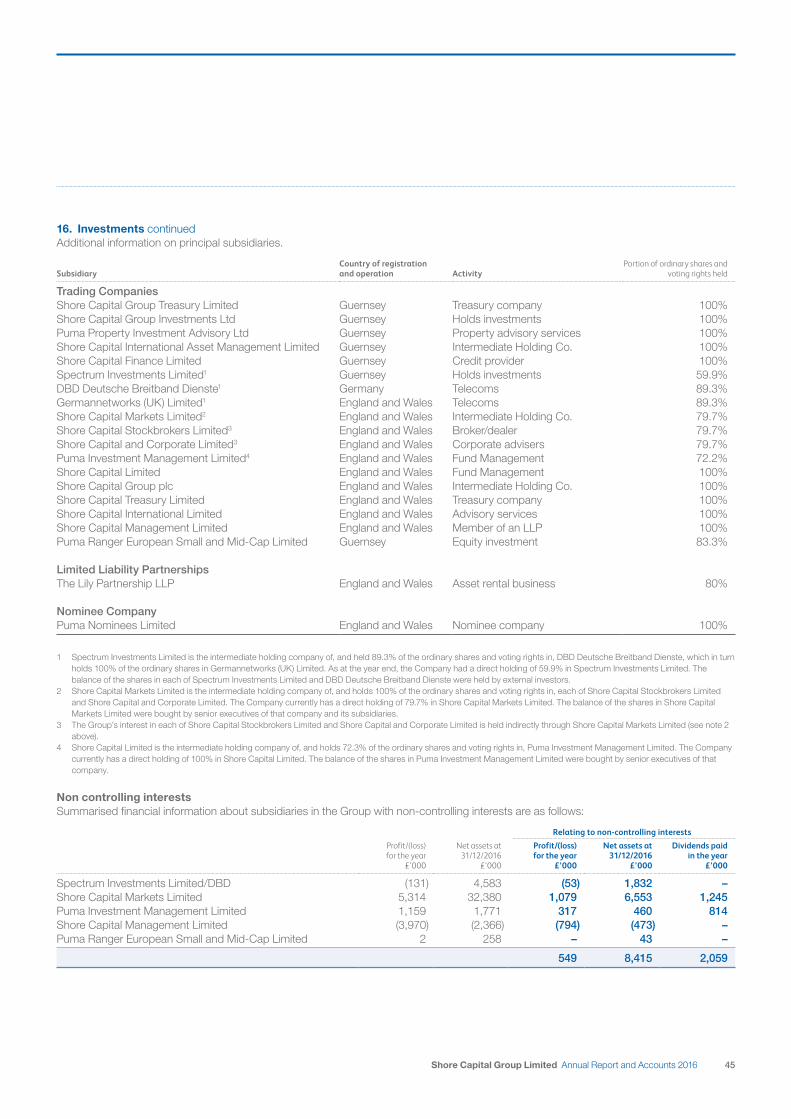
45Shore Capital Group Limited Annual Report and Accounts 2016
Additional information on principal subsidiaries.
SubsidiaryCountry of registration and operation Activity
Portion of ordinary shares and voting rights held
Trading CompaniesShore Capital Group Treasury Limited Guernsey Treasury company 100%Shore Capital Group Investments Ltd Guernsey Holds investments 100%Puma Property Investment Advisory Ltd Guernsey Property advisory services 100%Shore Capital International Asset Management Limited Guernsey Intermediate Holding Co. 100%Shore Capital Finance Limited Guernsey Credit provider 100%Spectrum Investments Limited1 Guernsey Holds investments 59.9%DBD Deutsche Breitband Dienste1 Germany Telecoms 89.3%Germannetworks (UK) Limited1 England and Wales Telecoms 89.3%Shore Capital Markets Limited2 England and Wales Intermediate Holding Co. 79.7%Shore Capital Stockbrokers Limited3 England and Wales Broker/dealer 79.7%Shore Capital and Corporate Limited3 England and Wales Corporate advisers 79.7%Puma Investment Management Limited4 England and Wales Fund Management 72.2%Shore Capital Limited England and Wales Fund Management 100%Shore Capital Group plc England and Wales Intermediate Holding Co. 100%Shore Capital Treasury Limited England and Wales Treasury company 100%Shore Capital International Limited England and Wales Advisory services 100%Shore Capital Management Limited England and Wales Member of an LLP 100%Puma Ranger European Small and Mid-Cap Limited Guernsey Equity investment 83.3%
Limited Liability PartnershipsThe Lily Partnership LLP England and Wales Asset rental business 80%
Nominee CompanyPuma Nominees Limited England and Wales Nominee company 100%
1 Spectrum Investments Limited is the intermediate holding company of, and held 89.3% of the ordinary shares and voting rights in, DBD Deutsche Breitband Dienste, which in turn holds 100% of the ordinary shares in Germannetworks (UK) Limited. As at the year end, the Company had a direct holding of 59.9% in Spectrum Investments Limited. The balance of the shares in each of Spectrum Investments Limited and DBD Deutsche Breitband Dienste were held by external investors.
2 Shore Capital Markets Limited is the intermediate holding company of, and holds 100% of the ordinary shares and voting rights in, each of Shore Capital Stockbrokers Limited and Shore Capital and Corporate Limited. The Company currently has a direct holding of 79.7% in Shore Capital Markets Limited. The balance of the shares in Shore Capital Markets Limited were bought by senior executives of that company and its subsidiaries.
3 The Group’s interest in each of Shore Capital Stockbrokers Limited and Shore Capital and Corporate Limited is held indirectly through Shore Capital Markets Limited (see note 2 above).
4 Shore Capital Limited is the intermediate holding company of, and holds 72.3% of the ordinary shares and voting rights in, Puma Investment Management Limited. The Company currently has a direct holding of 100% in Shore Capital Limited. The balance of the shares in Puma Investment Management Limited were bought by senior executives of that company.
Non controlling interestsSummarised financial information about subsidiaries in the Group with non-controlling interests are as follows:
Relating to non-controlling interestsProfit/(loss) for the year
£’000
Net assets at 31/12/2016
£’000
Profit/(loss) for the year
£’000
Net assets at 31/12/2016
£’000
Dividends paid in the year
£’000
Spectrum Investments Limited/DBD (131) 4,583 (53) 1,832 – Shore Capital Markets Limited 5,314 32,380 1,079 6,553 1,245 Puma Investment Management Limited 1,159 1,771 317 460 814 Shore Capital Management Limited (3,970) (2,366) (794) (473) – Puma Ranger European Small and Mid-Cap Limited 2 258 – 43 –
549 8,415 2,059
16. Investments continued
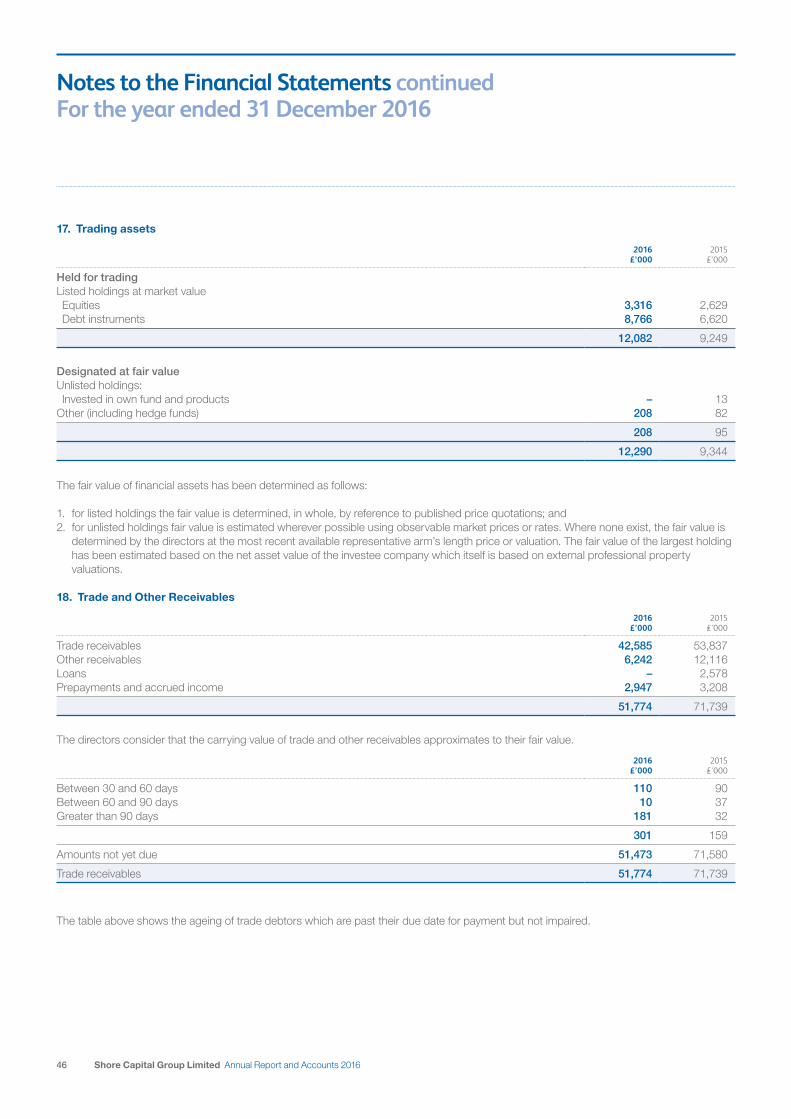
46 Shore Capital Group Limited Annual Report and Accounts 2016
Notes to the Financial Statements continued For the year ended 31 December 2016
17. Trading assets
2016 £’000
2015 £’000
Held for trading Listed holdings at market value Equities 3,316 2,629 Debt instruments 8,766 6,620
12,082 9,249
Designated at fair value Unlisted holdings: Invested in own fund and products – 13 Other (including hedge funds) 208 82
208 95
12,290 9,344
The fair value of financial assets has been determined as follows:
1. for listed holdings the fair value is determined, in whole, by reference to published price quotations; and2. for unlisted holdings fair value is estimated wherever possible using observable market prices or rates. Where none exist, the fair value is
determined by the directors at the most recent available representative arm’s length price or valuation. The fair value of the largest holding has been estimated based on the net asset value of the investee company which itself is based on external professional property valuations.
18. Trade and Other Receivables
2016 £’000
2015 £’000
Trade receivables 42,585 53,837 Other receivables 6,242 12,116 Loans – 2,578 Prepayments and accrued income 2,947 3,208
51,774 71,739
The directors consider that the carrying value of trade and other receivables approximates to their fair value.
2016 £’000
2015 £’000
Between 30 and 60 days 110 90 Between 60 and 90 days 10 37 Greater than 90 days 181 32
301 159
Amounts not yet due 51,473 71,580
Trade receivables 51,774 71,739
The table above shows the ageing of trade debtors which are past their due date for payment but not impaired.
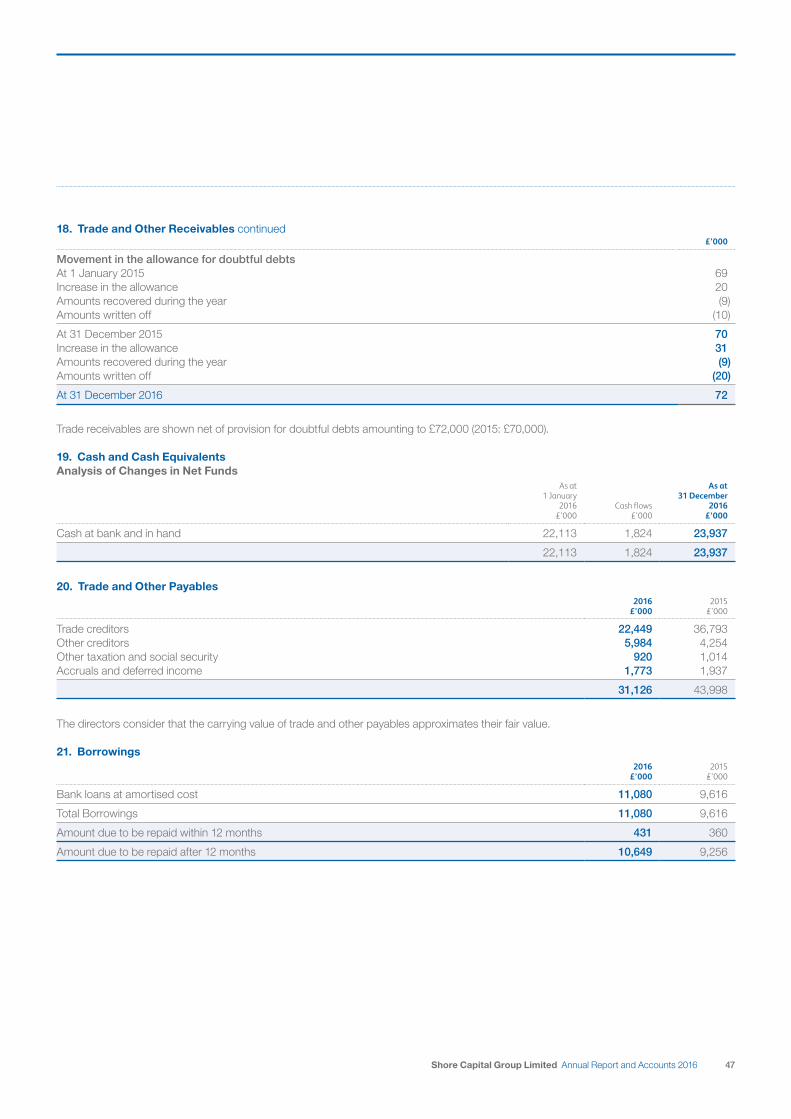
47Shore Capital Group Limited Annual Report and Accounts 2016
£’000
Movement in the allowance for doubtful debtsAt 1 January 2015 69 Increase in the allowance 20 Amounts recovered during the year (9)Amounts written off (10)
At 31 December 2015 70 Increase in the allowance 31 Amounts recovered during the year (9) Amounts written off (20)
At 31 December 2016 72
Trade receivables are shown net of provision for doubtful debts amounting to £72,000 (2015: £70,000).
19. Cash and Cash EquivalentsAnalysis of Changes in Net Funds
As at 1 January
2016 £’000
Cash flows £’000
As at31 December
2016 £’000
Cash at bank and in hand 22,113 1,824 23,937
22,113 1,824 23,937
20. Trade and Other Payables2016
£’0002015
£’000
Trade creditors 22,449 36,793 Other creditors 5,984 4,254 Other taxation and social security 920 1,014 Accruals and deferred income 1,773 1,937
31,126 43,998
The directors consider that the carrying value of trade and other payables approximates their fair value.
21. Borrowings
2016
£’0002015
£’000
Bank loans at amortised cost 11,080 9,616
Total Borrowings 11,080 9,616
Amount due to be repaid within 12 months 431 360
Amount due to be repaid after 12 months 10,649 9,256
18. Trade and Other Receivables continued
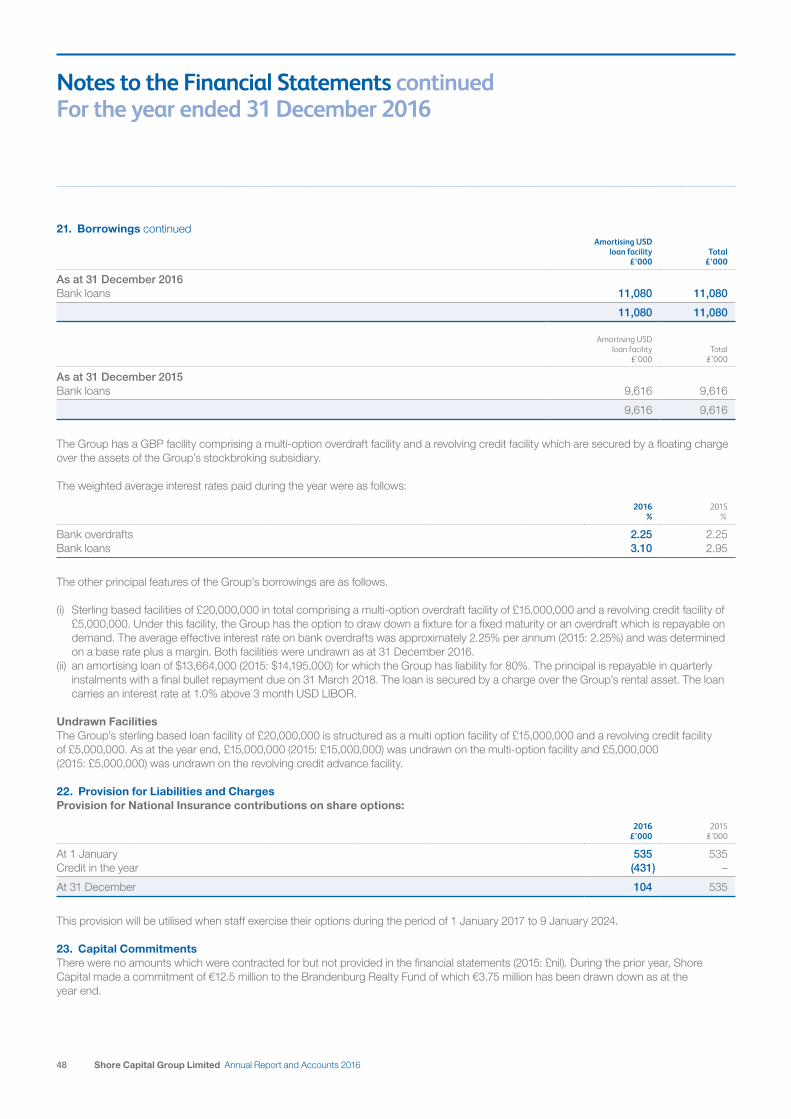
48 Shore Capital Group Limited Annual Report and Accounts 2016
Notes to the Financial Statements continued For the year ended 31 December 2016
Amortising USD loan facility
£’000Total
£’000
As at 31 December 2016 Bank loans 11,080 11,080
11,080 11,080
Amortising USD loan facility
£’000Total
£’000
As at 31 December 2015 Bank loans 9,616 9,616
9,616 9,616
The Group has a GBP facility comprising a multi-option overdraft facility and a revolving credit facility which are secured by a floating charge over the assets of the Group’s stockbroking subsidiary.
The weighted average interest rates paid during the year were as follows:
2016
%2015
%
Bank overdrafts 2.25 2.25 Bank loans 3.10 2.95
The other principal features of the Group’s borrowings are as follows.
(i) Sterling based facilities of £20,000,000 in total comprising a multi-option overdraft facility of £15,000,000 and a revolving credit facility of £5,000,000. Under this facility, the Group has the option to draw down a fixture for a fixed maturity or an overdraft which is repayable on demand. The average effective interest rate on bank overdrafts was approximately 2.25% per annum (2015: 2.25%) and was determined on a base rate plus a margin. Both facilities were undrawn as at 31 December 2016.
(ii) an amortising loan of $13,664,000 (2015: $14,195,000) for which the Group has liability for 80%. The principal is repayable in quarterly instalments with a final bullet repayment due on 31 March 2018. The loan is secured by a charge over the Group’s rental asset. The loan carries an interest rate at 1.0% above 3 month USD LIBOR.
Undrawn FacilitiesThe Group’s sterling based loan facility of £20,000,000 is structured as a multi option facility of £15,000,000 and a revolving credit facility of £5,000,000. As at the year end, £15,000,000 (2015: £15,000,000) was undrawn on the multi-option facility and £5,000,000 (2015: £5,000,000) was undrawn on the revolving credit advance facility.
22. Provision for Liabilities and ChargesProvision for National Insurance contributions on share options:
2016 £’000
2015 £’000
At 1 January 535 535 Credit in the year (431) –
At 31 December 104 535
This provision will be utilised when staff exercise their options during the period of 1 January 2017 to 9 January 2024.
23. Capital CommitmentsThere were no amounts which were contracted for but not provided in the financial statements (2015: £nil). During the prior year, Shore Capital made a commitment of €12.5 million to the Brandenburg Realty Fund of which €3.75 million has been drawn down as at the year end.
21. Borrowings continued
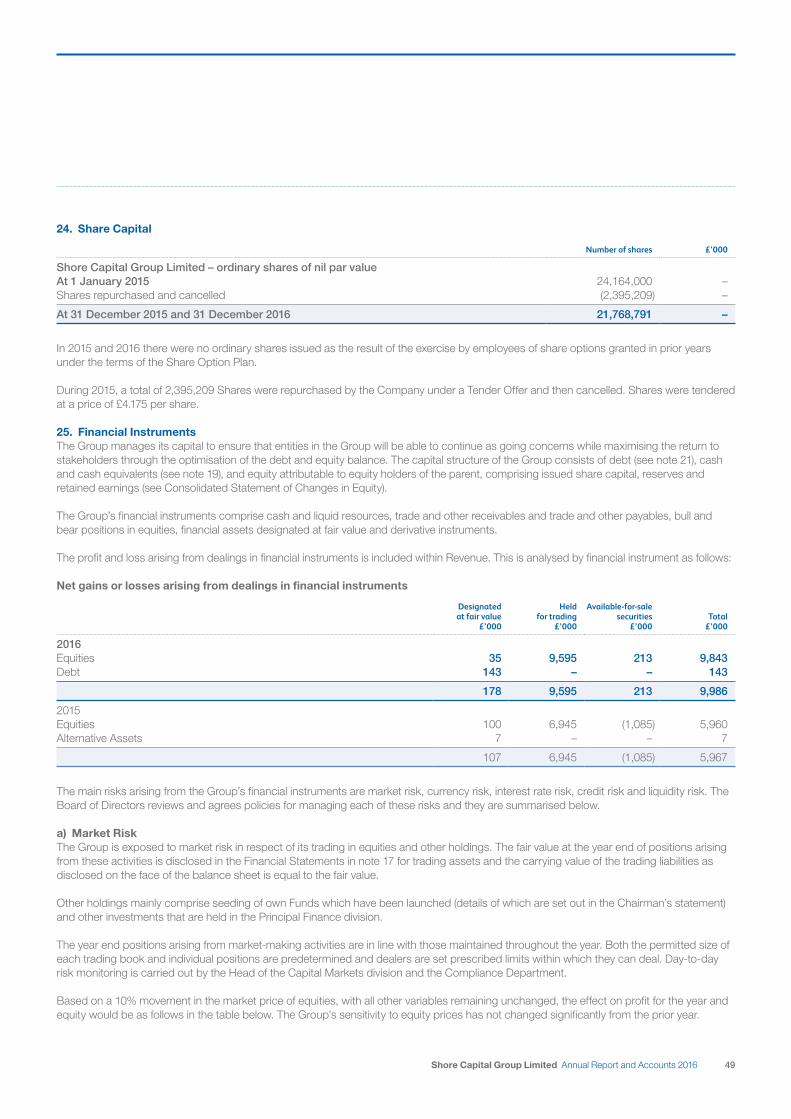
49Shore Capital Group Limited Annual Report and Accounts 2016
24. Share Capital
Number of shares £’000
Shore Capital Group Limited – ordinary shares of nil par valueAt 1 January 2015 24,164,000 – Shares repurchased and cancelled (2,395,209) –
At 31 December 2015 and 31 December 2016 21,768,791 –
In 2015 and 2016 there were no ordinary shares issued as the result of the exercise by employees of share options granted in prior years under the terms of the Share Option Plan.
During 2015, a total of 2,395,209 Shares were repurchased by the Company under a Tender Offer and then cancelled. Shares were tendered at a price of £4.175 per share.
25. Financial InstrumentsThe Group manages its capital to ensure that entities in the Group will be able to continue as going concerns while maximising the return to stakeholders through the optimisation of the debt and equity balance. The capital structure of the Group consists of debt (see note 21), cash and cash equivalents (see note 19), and equity attributable to equity holders of the parent, comprising issued share capital, reserves and retained earnings (see Consolidated Statement of Changes in Equity).
The Group’s financial instruments comprise cash and liquid resources, trade and other receivables and trade and other payables, bull and bear positions in equities, financial assets designated at fair value and derivative instruments.
The profit and loss arising from dealings in financial instruments is included within Revenue. This is analysed by financial instrument as follows:
Net gains or losses arising from dealings in financial instruments
Designated at fair value
£’000
Held for trading
£’000
Available-for-sale securities
£’000Total
£’000
2016 Equities 35 9,595 213 9,843 Debt 143 – – 143
178 9,595 213 9,986
2015 Equities 100 6,945 (1,085) 5,960 Alternative Assets 7 – – 7
107 6,945 (1,085) 5,967
The main risks arising from the Group’s financial instruments are market risk, currency risk, interest rate risk, credit risk and liquidity risk. The Board of Directors reviews and agrees policies for managing each of these risks and they are summarised below.
a) Market RiskThe Group is exposed to market risk in respect of its trading in equities and other holdings. The fair value at the year end of positions arising from these activities is disclosed in the Financial Statements in note 17 for trading assets and the carrying value of the trading liabilities as disclosed on the face of the balance sheet is equal to the fair value.
Other holdings mainly comprise seeding of own Funds which have been launched (details of which are set out in the Chairman’s statement) and other investments that are held in the Principal Finance division.
The year end positions arising from market-making activities are in line with those maintained throughout the year. Both the permitted size of each trading book and individual positions are predetermined and dealers are set prescribed limits within which they can deal. Day-to-day risk monitoring is carried out by the Head of the Capital Markets division and the Compliance Department.
Based on a 10% movement in the market price of equities, with all other variables remaining unchanged, the effect on profit for the year and equity would be as follows in the table below. The Group’s sensitivity to equity prices has not changed significantly from the prior year.
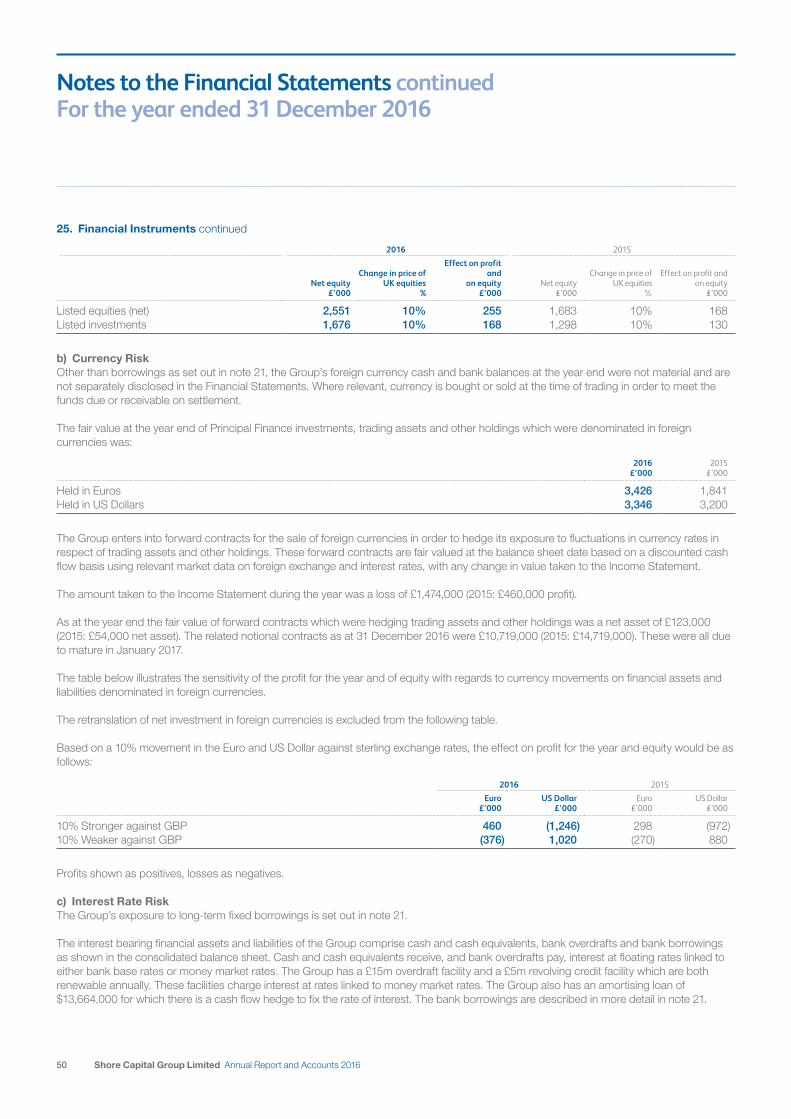
50 Shore Capital Group Limited Annual Report and Accounts 2016
Notes to the Financial Statements continued For the year ended 31 December 2016
2016 2015
Net equity
£’000
Change in price of UK equities
%
Effect on profit and
on equity £’000
Net equity £’000
Change in price of UK equities
%
Effect on profit and on equity
£’000
Listed equities (net) 2,551 10% 255 1,683 10% 168 Listed investments 1,676 10% 168 1,298 10% 130
b) Currency RiskOther than borrowings as set out in note 21, the Group’s foreign currency cash and bank balances at the year end were not material and are not separately disclosed in the Financial Statements. Where relevant, currency is bought or sold at the time of trading in order to meet the funds due or receivable on settlement.
The fair value at the year end of Principal Finance investments, trading assets and other holdings which were denominated in foreign currencies was:
2016
£’0002015
£’000
Held in Euros 3,426 1,841 Held in US Dollars 3,346 3,200
The Group enters into forward contracts for the sale of foreign currencies in order to hedge its exposure to fluctuations in currency rates in respect of trading assets and other holdings. These forward contracts are fair valued at the balance sheet date based on a discounted cash flow basis using relevant market data on foreign exchange and interest rates, with any change in value taken to the Income Statement.
The amount taken to the Income Statement during the year was a loss of £1,474,000 (2015: £460,000 profit).
As at the year end the fair value of forward contracts which were hedging trading assets and other holdings was a net asset of £123,000 (2015: £54,000 net asset). The related notional contracts as at 31 December 2016 were £10,719,000 (2015: £14,719,000). These were all due to mature in January 2017.
The table below illustrates the sensitivity of the profit for the year and of equity with regards to currency movements on financial assets and liabilities denominated in foreign currencies.
The retranslation of net investment in foreign currencies is excluded from the following table.
Based on a 10% movement in the Euro and US Dollar against sterling exchange rates, the effect on profit for the year and equity would be as follows:
2016 2015
Euro
£’000US Dollar
£’000Euro
£’000US Dollar
£’000
10% Stronger against GBP 460 (1,246) 298 (972)10% Weaker against GBP (376) 1,020 (270) 880
Profits shown as positives, losses as negatives.
c) Interest Rate RiskThe Group’s exposure to long-term fixed borrowings is set out in note 21.
The interest bearing financial assets and liabilities of the Group comprise cash and cash equivalents, bank overdrafts and bank borrowings as shown in the consolidated balance sheet. Cash and cash equivalents receive, and bank overdrafts pay, interest at floating rates linked to either bank base rates or money market rates. The Group has a £15m overdraft facility and a £5m revolving credit facility which are both renewable annually. These facilities charge interest at rates linked to money market rates. The Group also has an amortising loan of $13,664,000 for which there is a cash flow hedge to fix the rate of interest. The bank borrowings are described in more detail in note 21.
25. Financial Instruments continued
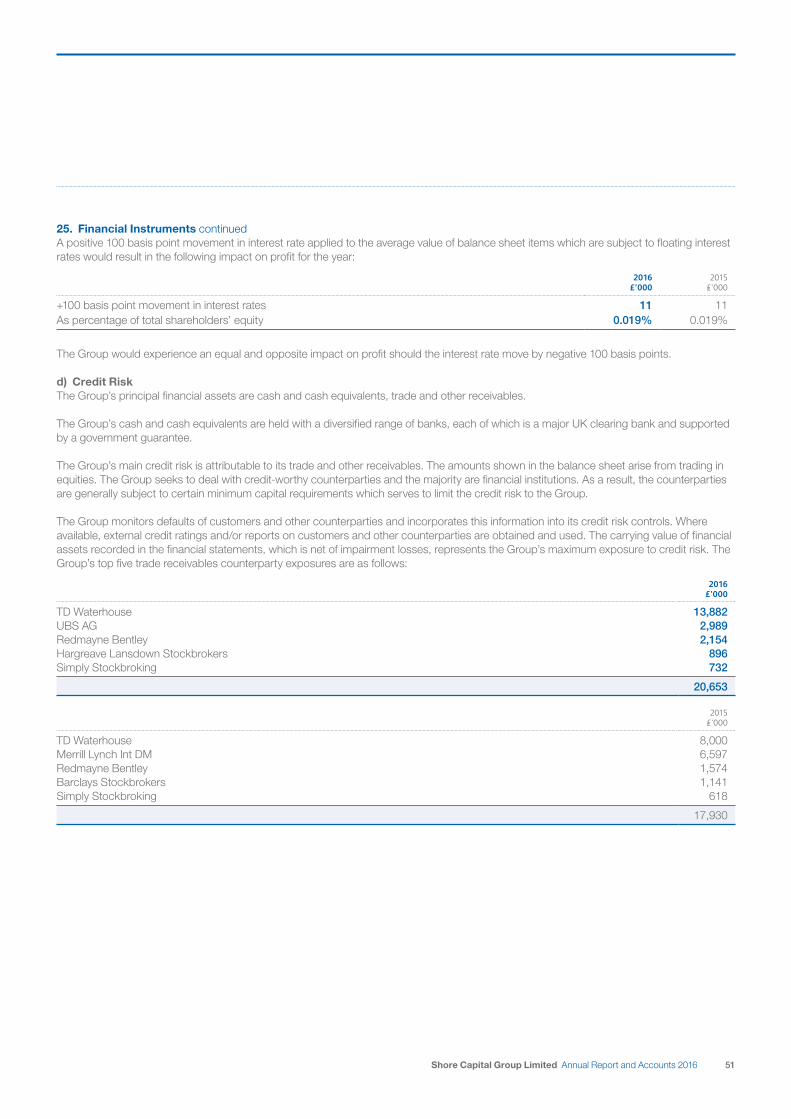
51Shore Capital Group Limited Annual Report and Accounts 2016
A positive 100 basis point movement in interest rate applied to the average value of balance sheet items which are subject to floating interest rates would result in the following impact on profit for the year:
2016
£’0002015
£’000
+100 basis point movement in interest rates 11 11 As percentage of total shareholders’ equity 0.019% 0.019%
The Group would experience an equal and opposite impact on profit should the interest rate move by negative 100 basis points.
d) Credit RiskThe Group’s principal financial assets are cash and cash equivalents, trade and other receivables.
The Group’s cash and cash equivalents are held with a diversified range of banks, each of which is a major UK clearing bank and supported by a government guarantee.
The Group’s main credit risk is attributable to its trade and other receivables. The amounts shown in the balance sheet arise from trading in equities. The Group seeks to deal with credit-worthy counterparties and the majority are financial institutions. As a result, the counterparties are generally subject to certain minimum capital requirements which serves to limit the credit risk to the Group.
The Group monitors defaults of customers and other counterparties and incorporates this information into its credit risk controls. Where available, external credit ratings and/or reports on customers and other counterparties are obtained and used. The carrying value of financial assets recorded in the financial statements, which is net of impairment losses, represents the Group’s maximum exposure to credit risk. The Group’s top five trade receivables counterparty exposures are as follows:
2016
£’000
TD Waterhouse 13,882 UBS AG 2,989 Redmayne Bentley 2,154 Hargreave Lansdown Stockbrokers 896 Simply Stockbroking 732
20,653
2015£’000
TD Waterhouse 8,000 Merrill Lynch Int DM 6,597 Redmayne Bentley 1,574 Barclays Stockbrokers 1,141 Simply Stockbroking 618
17,930
25. Financial Instruments continued
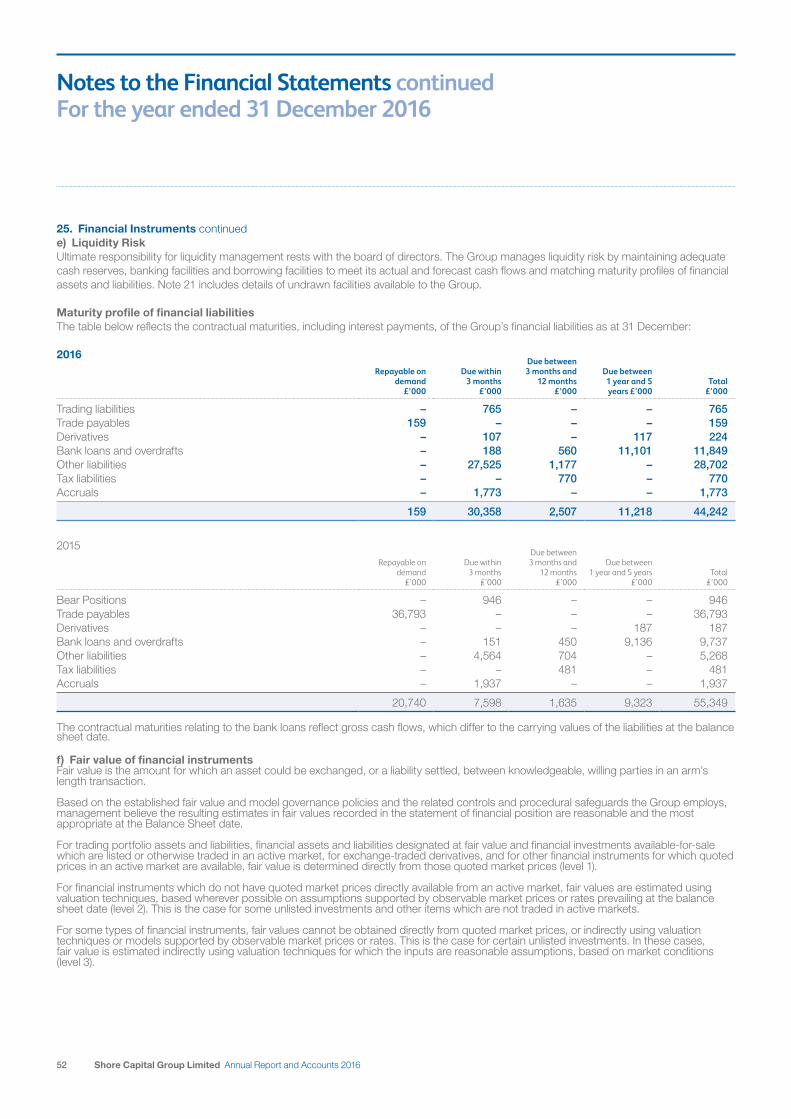
52 Shore Capital Group Limited Annual Report and Accounts 2016
Notes to the Financial Statements continued For the year ended 31 December 2016
e) Liquidity RiskUltimate responsibility for liquidity management rests with the board of directors. The Group manages liquidity risk by maintaining adequate cash reserves, banking facilities and borrowing facilities to meet its actual and forecast cash flows and matching maturity profiles of financial assets and liabilities. Note 21 includes details of undrawn facilities available to the Group.
Maturity profile of financial liabilitiesThe table below reflects the contractual maturities, including interest payments, of the Group’s financial liabilities as at 31 December:
2016Repayable on
demand £’000
Due within 3 months
£’000
Due between 3 months and
12 months £’000
Due between 1 year and 5 years £’000
Total £’000
Trading liabilities – 765 – – 765 Trade payables 159 – – – 159 Derivatives – 107 – 117 224 Bank loans and overdrafts – 188 560 11,101 11,849 Other liabilities – 27,525 1,177 – 28,702 Tax liabilities – – 770 – 770 Accruals – 1,773 – – 1,773
159 30,358 2,507 11,218 44,242
2015Repayable on
demand £’000
Due within 3 months
£’000
Due between 3 months and
12 months £’000
Due between 1 year and 5 years
£’000Total
£’000
Bear Positions – 946 – – 946 Trade payables 36,793 – – – 36,793 Derivatives – – – 187 187 Bank loans and overdrafts – 151 450 9,136 9,737 Other liabilities – 4,564 704 – 5,268 Tax liabilities – – 481 – 481 Accruals – 1,937 – – 1,937
20,740 7,598 1,635 9,323 55,349
The contractual maturities relating to the bank loans reflect gross cash flows, which differ to the carrying values of the liabilities at the balance sheet date.
f) Fair value of financial instrumentsFair value is the amount for which an asset could be exchanged, or a liability settled, between knowledgeable, willing parties in an arm’s length transaction.
Based on the established fair value and model governance policies and the related controls and procedural safeguards the Group employs, management believe the resulting estimates in fair values recorded in the statement of financial position are reasonable and the most appropriate at the Balance Sheet date.
For trading portfolio assets and liabilities, financial assets and liabilities designated at fair value and financial investments available-for-sale which are listed or otherwise traded in an active market, for exchange-traded derivatives, and for other financial instruments for which quoted prices in an active market are available, fair value is determined directly from those quoted market prices (level 1).
For financial instruments which do not have quoted market prices directly available from an active market, fair values are estimated using valuation techniques, based wherever possible on assumptions supported by observable market prices or rates prevailing at the balance sheet date (level 2). This is the case for some unlisted investments and other items which are not traded in active markets.
For some types of financial instruments, fair values cannot be obtained directly from quoted market prices, or indirectly using valuation techniques or models supported by observable market prices or rates. This is the case for certain unlisted investments. In these cases, fair value is estimated indirectly using valuation techniques for which the inputs are reasonable assumptions, based on market conditions (level 3).
25. Financial Instruments continued
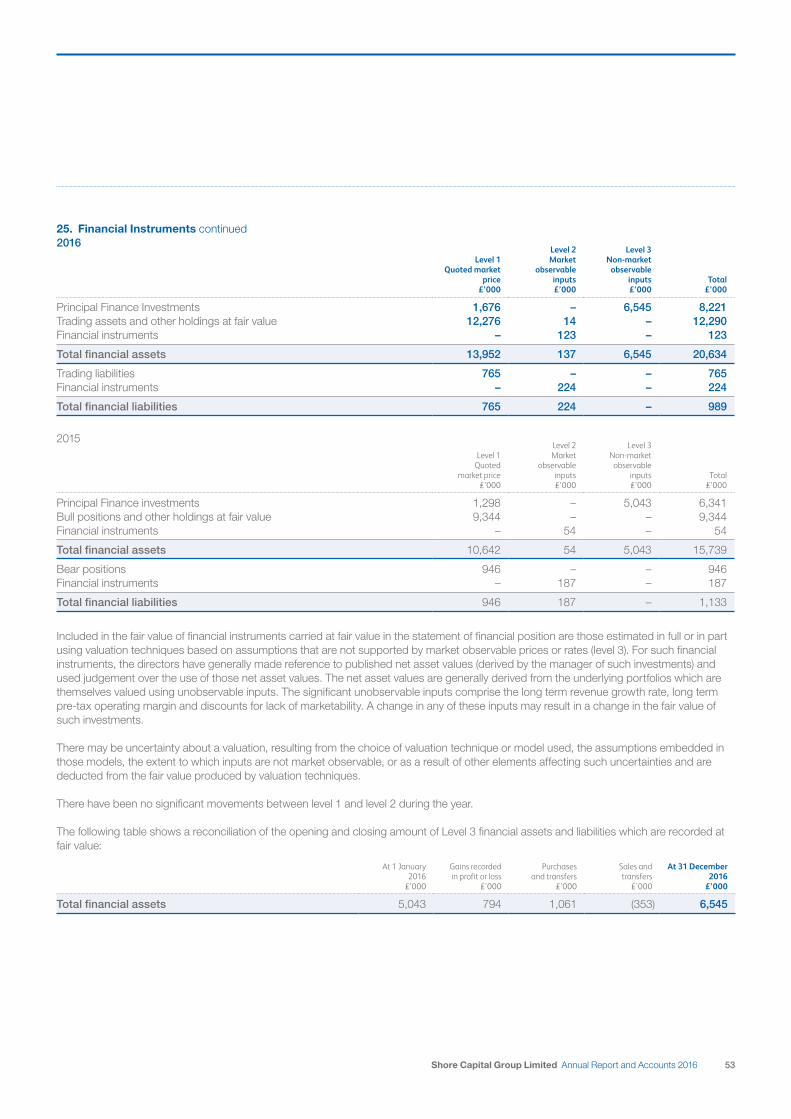
53Shore Capital Group Limited Annual Report and Accounts 2016
2016
Level 1 Quoted market
price £’000
Level 2 Market
observable inputs £’000
Level 3 Non-market
observable inputs £’000
Total £’000
Principal Finance Investments 1,676 – 6,545 8,221 Trading assets and other holdings at fair value 12,276 14 – 12,290 Financial instruments – 123 – 123
Total financial assets 13,952 137 6,545 20,634
Trading liabilities 765 – – 765 Financial instruments – 224 – 224
Total financial liabilities 765 224 – 989
2015
Level 1 Quoted
market price £’000
Level 2 Market
observable inputs £’000
Level 3 Non-market
observable inputs £’000
Total £’000
Principal Finance investments 1,298 – 5,043 6,341 Bull positions and other holdings at fair value 9,344 – – 9,344 Financial instruments – 54 – 54
Total financial assets 10,642 54 5,043 15,739
Bear positions 946 – – 946 Financial instruments – 187 – 187
Total financial liabilities 946 187 – 1,133
Included in the fair value of financial instruments carried at fair value in the statement of financial position are those estimated in full or in part using valuation techniques based on assumptions that are not supported by market observable prices or rates (level 3). For such financial instruments, the directors have generally made reference to published net asset values (derived by the manager of such investments) and used judgement over the use of those net asset values. The net asset values are generally derived from the underlying portfolios which are themselves valued using unobservable inputs. The significant unobservable inputs comprise the long term revenue growth rate, long term pre-tax operating margin and discounts for lack of marketability. A change in any of these inputs may result in a change in the fair value of such investments.
There may be uncertainty about a valuation, resulting from the choice of valuation technique or model used, the assumptions embedded in those models, the extent to which inputs are not market observable, or as a result of other elements affecting such uncertainties and are deducted from the fair value produced by valuation techniques.
There have been no significant movements between level 1 and level 2 during the year.
The following table shows a reconciliation of the opening and closing amount of Level 3 financial assets and liabilities which are recorded at fair value:
At 1 January 2016
£’000
Gains recorded in profit or loss
£’000
Purchases and transfers
£’000
Sales and transfers
£’000
At 31 December 2016
£’000
Total financial assets 5,043 794 1,061 (353) 6,545
25. Financial Instruments continued

54 Shore Capital Group Limited Annual Report and Accounts 2016
26. Subsequent events(i) On 10 March and 17 March 2017, the Group purchased two further investment properties for total consideration of £2.9 million, bringing
the aggregate investment properties held by the Group to £5.7 million.
(ii) On 24 March 2017 Shore Capital International Asset Management Limited (“SCIAML”), a subsidiary of the Group, awarded growth shares to David Kaye, the CEO of the Asset Management division. The award is subject to relevant approvals. As part of the transaction, SCIAML will acquire Mr Kaye’s existing shares in Puma Investment Management Limited (“PIML”) in exchange for 22.20% of the ordinary shares in SCIAML. Following the transaction, SCIAML will own 91.85% of PIML and accordingly Mr Kaye’s holding of ordinary shares in SCIAML will equate to his existing economic interest of 20.39% in PIML.
Subject to meeting specific growth targets for the profitability and value of the SCIAML business within a 10 year period, Mr Kaye’s holding of growth shares together with his holding of ordinary shares in SCIAML will in aggregate represent a maximum entitlement of 43.55% of SCIAML, which will equate to an economic interest of 40.00% in PIML.
Notes to the Financial Statements continued For the year ended 31 December 2016

55Shore Capital Group Limited Annual Report and Accounts 2016

56 Shore Capital Group Limited Annual Report and Accounts 2016

Directors Howard ShoreLynn BruceDr Zvi Marom*James Rosenwald III*
*Non-executive
SecretaryLynn Bruce
Company Number51355
Registered OfficeMartello CourtAdmiral ParkSt Peter PortGuernsey GY1 3HB
RegistrarComputershare Investor Services(Guernsey) Limited3rd FloorNatwest HouseLe TruchotSt Peter PortGuernsey GY1 1WD
Legal AdviserCarey OlsenCarey HouseLes BanquesSt Peter PortGuernsey GY1 4BZ
AuditorDeloitte LLPRegency CourtGlategny EsplanadeSt Peter PortGuernsey GY1 3HW
BankersRoyal Bank of Scotland InternationalRoyal Bank Place1 Glategny EsplanadeSt Peter PortGuernsey GY1 4BQ
Nominated AdviserGrant Thornton UK LLP30 Finsbury SquareLondon EC2P 2YU
BrokerShore Capital Stockbrokers LtdBond Street House14 Clifford StreetLondon W1S 4JU
GuernseyMartello Court Admiral ParkSt Peter PortGuernsey GY1 3HB+44 (0)1481 724 222
LondonBond Street House 14 Clifford StreetLondonW1S 4JUUnited Kingdom +44 (0)20 7408 4090
LiverpoolThe Corn Exchange Fenwick StreetLiverpoolL2 7RBUnited Kingdom+44 (0)151 600 3700
Edinburgh3–5 Melville StreetEdinburghEH3 7PEUnited Kingdom+44 (0)20 7079 1670
BerlinUnter den Linden 32/34Berlin10117Germany+49 30 204 587 100
Officers and Professional Advisers
Offices

www.shorecap.gg
Sho
re Cap
ital Gro
up Lim
ited Annual R
eport and A
ccounts 2016