söhnke m. bartram - nomurawarwick business school . why do foreign institutional investors matter?...
TRANSCRIPT
Warwick Business School
Söhnke M. Bartram Warwick Business School

Warwick Business School
International Stock Price Co-Movement Cash-flow based view of the world
Common fundamentals as proxied by country or industry ○ Roll (1992), Heston and Rouwenhorst (1994), Griffin and Karolyi
(1998), Brooks and Del Negro (2004), Carrieri, Errunza, and Sarkissian (2004), and Bekaert, Hodrick, and Zhang (2008)
Trade linkages ○ Forbes and Chinn (2004)
What effects, if any, might common ownership by institutional investors have on stock price co-movement?

Warwick Business School
Objective We seek to quantify in a systematic way the
importance of institutional ownership for international stock returns Investigate several dimensions of institutional
ownership An explicit channel of ownership linkage Foreign ownership levels and changes
Shed light on various theories of why ownership matters

Warwick Business School
Why Do Foreign Institutional Investors Matter? Traditional channel: market-wide integration
Bekaert and Harvey (1995, 2000), Henry (2000), Bekaert et al. (2008)
Foreign investment flows drive market returns Froot, O’Connell and Seasholes (2001)
Empirical papers point to the potential importance of international trading location Country of trading ○ Froot and Dabora (1999), Chan, Hameed, and Lau (2003)
ADRs ○ Foerster and Karolyi (1996), Errunza, Hogan, and Hung (1999), Lewis (WP)

Warwick Business School
Beyond Traditional Channel of Market Integration Theories suggest that common owners may induce
co-movement of international stocks Coordinated Fund Buys/Sells Drive Returns
Goldstein and Pauzner (2005): strategic risk Kyle and Xiong (2005): wealth effect Broner, Gelos and Reinhardt (2006)
Fund flows Fund outflows causing fire sale (Coval and Stafford 2008)
Others Style or habitat investing (Barberis, Shleifer and Wurgler
2005)

Warwick Business School
Outline
Capturing ownership linkages
Sample and Data
Importance of ownership return
Alternative explanations
Investor Habitat and Wealth Effect
Diversification implications
Conclusions
Warwick Business School
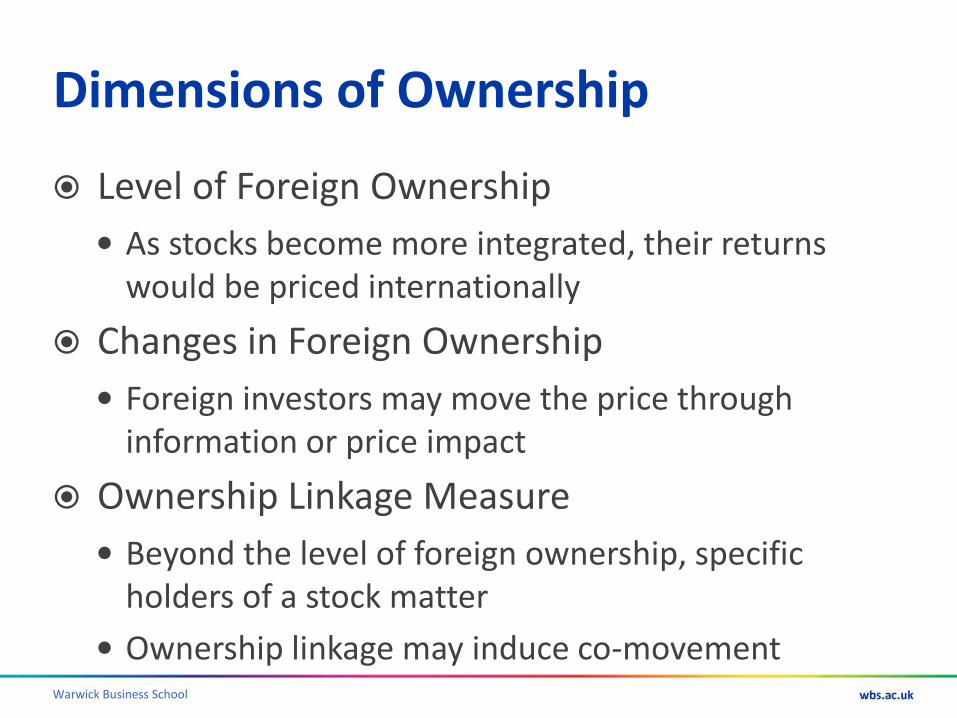
Dimensions of Ownership
Level of Foreign Ownership As stocks become more integrated, their returns
would be priced internationally Changes in Foreign Ownership Foreign investors may move the price through
information or price impact Ownership Linkage Measure Beyond the level of foreign ownership, specific
holders of a stock matter Ownership linkage may induce co-movement

Warwick Business School
Samsung Example We examine ownership linkage by capturing the equity return
to one’s shareholders
Institutional holders’ other
holdings
Institutional holders Stock
Samsung
Capital World Investors
Microsoft
Brazil Fast Food
New York Retirement Fund
Village supermarket

Warwick Business School
Capturing Ownership Linkage
Construction of Ownership Return Compute the value-weighted return for all non-Korean
stocks held by Capital World Investors Do this for all funds holding Samsung ○ Weight them by their proportional holdings in Samsung
Economics/Interpretation of Ownership Return Return that the shareholders earn Return of other stocks that are linked through common
shareholders

Warwick Business School
Factor Models with Ownership Factor Model
Country Factor
○ 𝑅𝐶,𝑖 = ∑ 𝑤𝐶,𝑗 1 − 𝑑𝐶,𝑖,𝑗 𝑅𝑗𝑁𝑗=1
Industry Factor
○ 𝑅𝐼,𝑖 = ∑ 𝑤𝐼,𝑗 1 − 𝑑𝐼,𝑖,𝑗𝑁𝑗=1 𝑅𝑗
Ownership Factor
○ 𝑅𝑂,𝑖 = ∑ ∑ 𝑣𝑂,𝑖,𝑘𝑤𝑂,𝑗,𝑘 1 − 𝑑𝑂,𝑖,𝑗 𝑅𝑗𝑁𝑗=1
𝐾𝑘=1
= + + + +i C C I I O i ,O iR R R R eα β β β

Warwick Business School
Data FactSet/Lionshares institutional ownership data
International stock holdings data from 2000 to 2009 Q1 Survivorship bias-free. Over 7,000 firms in 65 countries Mutual funds or equivalent in other countries Holdings by institutions and by funds Institution level holdings as a base, supplemented by fund level Holding weights on a date as constant until next reporting date
Datastream & CRSP Calculate weekly, monthly, quarterly returns on holdings Use reversion/extreme filter on returns data Require a stock to trade at least 30% of trading days
CRSP mutual fund holdings dataset Get fund flows, NAVs and fund returns
Warwick Business School
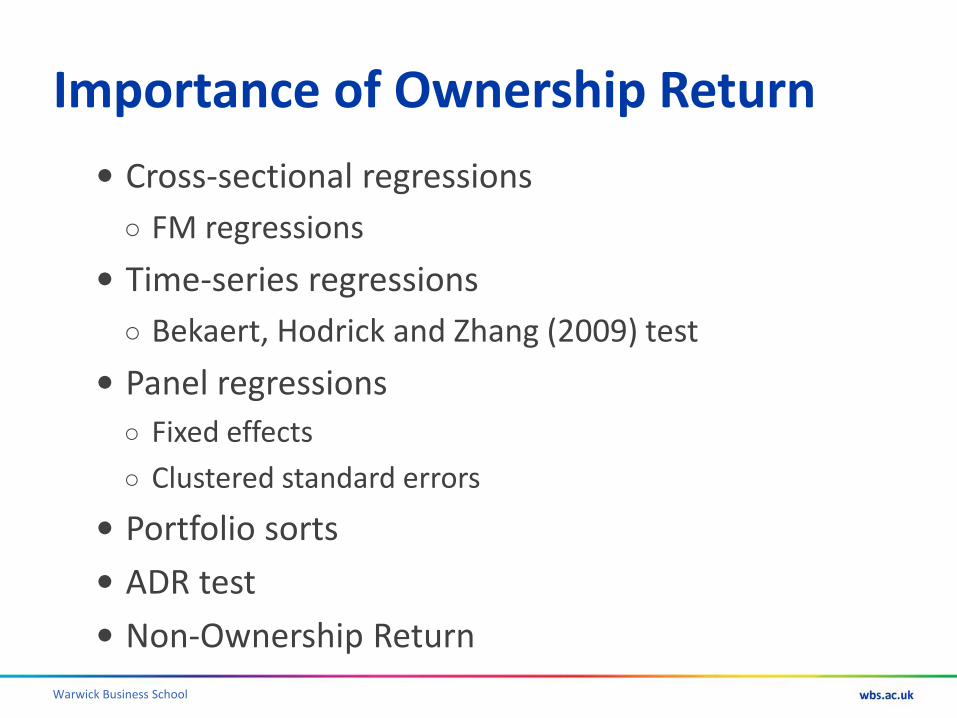
Importance of Ownership Return Cross-sectional regressions ○ FM regressions
Time-series regressions ○ Bekaert, Hodrick and Zhang (2009) test
Panel regressions ○ Fixed effects ○ Clustered standard errors
Portfolio sorts ADR test Non-Ownership Return

Warwick Business School
Cross-sectional Regressions
(1) (2) (1) (2) (1) (2)Ownership Return 0.217 0.090 0.259 0.223 0.710 0.395
(5.40) (2.43) (6.29) (3.54) (7.11) (4.76)Ownership Change 2.150 1.028 0.455
(2.65) (4.45) (6.66)Local Beta*Local Market 0.795 0.792 0.764
(10.1) (11.0) (15.3)World Beta*World Market 0.181 -0.153 0.209
(0.40) (-0.35) (0.42)Industry 0.235 0.270 0.399
(4.98) (8.23) (10.0)Adjusted R2 0.006 0.091 0.006 0.126 0.015 0.137Average Number of Firms per Quar 2,020 1,091 3,627 1,226 1,981 1,524
0-1% 1%-5% >=5%
Foreign OwnershipLow Medium High

Warwick Business School
Time-series Regressions
Regression # MSE Regression # MSE Regression # MSEIncremental Contribution of the Ownership ReturnBase Model (1) 0.038 (2) 0.025 (5) 0.021Base Model with Ownership Return (3) 0.026 (6) 0.023 (7) 0.019Difference 0.012 0.002 0.002p-value <.0001 <.0001 <.0001Incremental Contribution of the Industry ReturnBase Model (1) 0.038 (2) 0.025 (6) 0.023Base Model with Industry Return (4) 0.026 (5) 0.021 (7) 0.019Difference 0.012 0.004 0.004p-value <.0001 <.0001 <.0001Incremental Contribution of the World ReturnBase Model (1) 0.038 (4) 0.026 (3) 0.026Base Model with World Return (2) 0.025 (5) 0.021 (6) 0.023Difference 0.013 0.005 0.003p-value <.0001 <.0001 <.0001
(1) (2) (3) (4) (5) (6) (7)Ownership Return 0.208 0.364 0.315Local Market 0.985 0.874 0.818 0.815 0.850 0.818 0.805World Market 0.171 -0.174 -0.186 -0.482Industry 0.237 0.339 0.339Adjusted R2 0.339 0.349 0.351 0.355 0.362 0.356 0.368Number of Firms 3,126 3,126 3,126 3,126 3,126 3,126 3,126
Warwick Business School
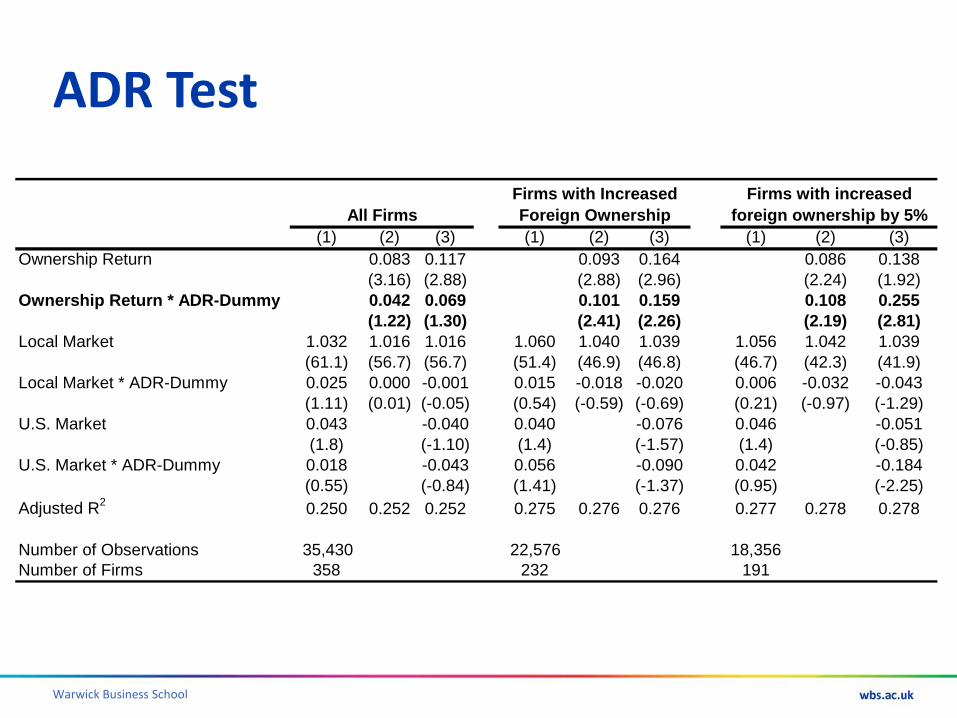
ADR Test
(1) (2) (3) (1) (2) (3) (1) (2) (3)Ownership Return 0.083 0.117 0.093 0.164 0.086 0.138
(3.16) (2.88) (2.88) (2.96) (2.24) (1.92)Ownership Return * ADR-Dummy 0.042 0.069 0.101 0.159 0.108 0.255
(1.22) (1.30) (2.41) (2.26) (2.19) (2.81)Local Market 1.032 1.016 1.016 1.060 1.040 1.039 1.056 1.042 1.039
(61.1) (56.7) (56.7) (51.4) (46.9) (46.8) (46.7) (42.3) (41.9)Local Market * ADR-Dummy 0.025 0.000 -0.001 0.015 -0.018 -0.020 0.006 -0.032 -0.043
(1.11) (0.01) (-0.05) (0.54) (-0.59) (-0.69) (0.21) (-0.97) (-1.29)U.S. Market 0.043 -0.040 0.040 -0.076 0.046 -0.051
(1.8) (-1.10) (1.4) (-1.57) (1.4) (-0.85)U.S. Market * ADR-Dummy 0.018 -0.043 0.056 -0.090 0.042 -0.184
(0.55) (-0.84) (1.41) (-1.37) (0.95) (-2.25)Adjusted R2 0.250 0.252 0.252 0.275 0.276 0.276 0.277 0.278 0.278
Number of Observations 35,430 22,576 18,356 Number of Firms 358 232 191
All FirmsFirms with Increased Foreign Ownership
Firms with increased foreign ownership by 5%

Warwick Business School
Returns of Stocks Without Common Ownership
Institutional holders’ other
holdings
Institutional holders Stock
Samsung
Capital World Investors
Microsoft
Brazil Fast Food
New York Retirement Fund
Village supermarket
Large computer stock in US Similar size food stock in Brazil Similar size retail stock in US
Warwick Business School
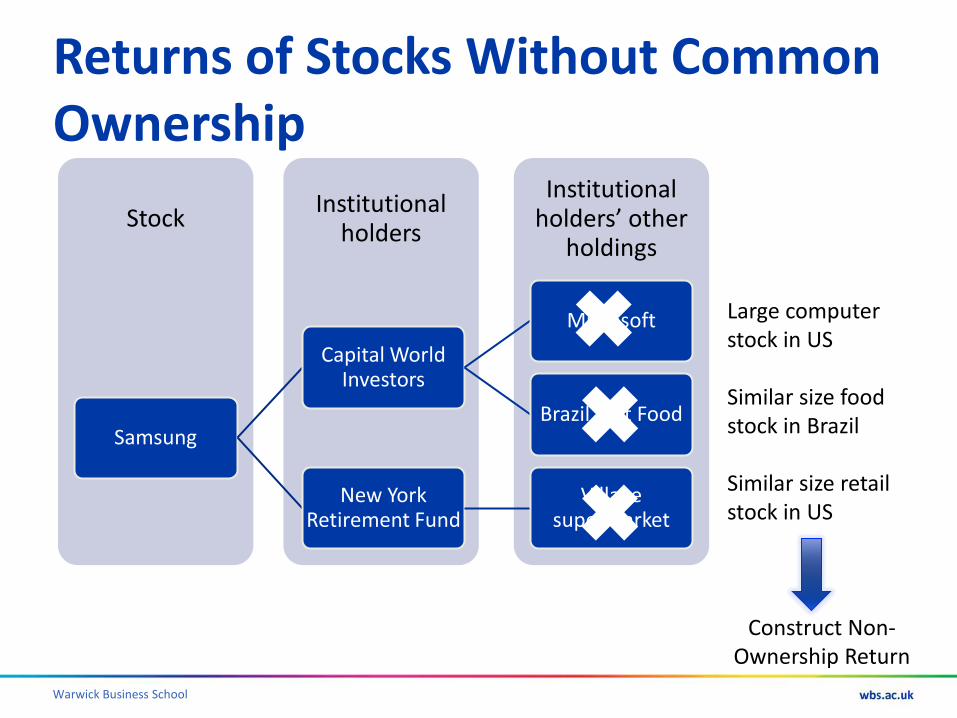
Returns of Stocks Without Common Ownership
Institutional holders’ other
holdings
Institutional holders Stock
Samsung
Capital World Investors
Microsoft
Brazil Fast Food
New York Retirement Fund
Village supermarket
✖ ✖ ✖
Construct Non-Ownership Return
Large computer stock in US Similar size food stock in Brazil Similar size retail stock in US

Warwick Business School
Alternative Explanations Ownership Return is important for international
stock returns Beyond the change in the level of foreign ownership Similar economic significance as traditional drivers of
returns
However, it could possibly capture other effects: Investor recognition? Exchange rate effects? Foreign Sales? Global investment styles? Global vs. Local CAPM?
Warwick Business School
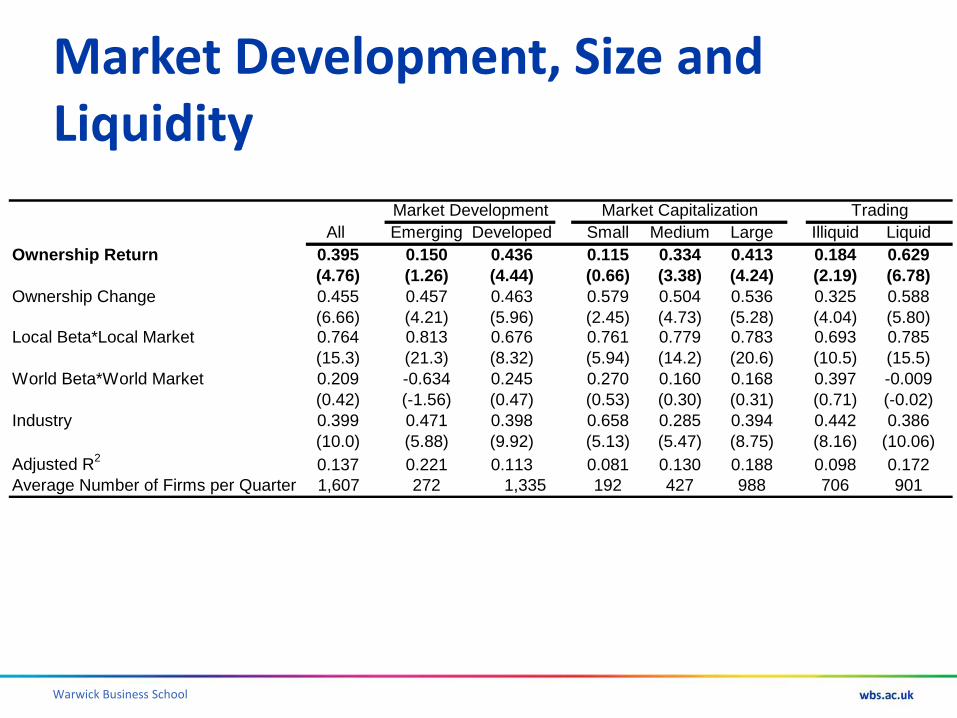
Market Development, Size and Liquidity
All Emerging Developed Small Medium Large Illiquid LiquidOwnership Return 0.395 0.150 0.436 0.115 0.334 0.413 0.184 0.629
(4.76) (1.26) (4.44) (0.66) (3.38) (4.24) (2.19) (6.78)Ownership Change 0.455 0.457 0.463 0.579 0.504 0.536 0.325 0.588
(6.66) (4.21) (5.96) (2.45) (4.73) (5.28) (4.04) (5.80)Local Beta*Local Market 0.764 0.813 0.676 0.761 0.779 0.783 0.693 0.785
(15.3) (21.3) (8.32) (5.94) (14.2) (20.6) (10.5) (15.5)World Beta*World Market 0.209 -0.634 0.245 0.270 0.160 0.168 0.397 -0.009
(0.42) (-1.56) (0.47) (0.53) (0.30) (0.31) (0.71) (-0.02)Industry 0.399 0.471 0.398 0.658 0.285 0.394 0.442 0.386
(10.0) (5.88) (9.92) (5.13) (5.47) (8.75) (8.16) (10.06)Adjusted R2 0.137 0.221 0.113 0.081 0.130 0.188 0.098 0.172Average Number of Firms per Quarter 1,607 272 1,335 192 427 988 706 901
Market Development Market Capitalization Trading

Warwick Business School
Why Does Ownership Matter? Theory suggests that the ownership return
might matter due to Wealth Effects/Portfolio Rebalancing ○ Portfolio appreciation ○ Kyle and Xiong (2001)
Habitat investing ○ Construct habitat variable Similar to ownership return, but based on changes in
holdings of investors Captures net change in investments in and out of other
stocks that investors hold ○ Barberis, Shleifer and Wurgler 2005

Warwick Business School
Investor Habitat (1) (2) (3) (4) (5) (6) (7) (8) (9)
Habitat 0.241 0.291(3.24) (2.72)
Change in Holdings of Foreign Stocks (High Common Holders) 0.236 0.233 0.273(4.49) (4.47) (4.05)
Change in Holdings of Foreign Stocks (Medium Common Holders) 0.086 0.118 0.144(1.00) (1.35) (1.51)
Change in Holdings of Foreign Stocks (Low Common Holders) -0.109 -0.084 -0.215(-1.43) (-1.23) (-2.74)
Returns of Foreign Stocks (High Common Holders) 0.741 0.338(6.75) (6.48)
Returns of Foreign Stocks (Medium Common Holders) -0.410 -0.036(-1.86) (-0.17)
Returns of Foreign Stocks (Low Common Holders) -0.230 -0.319(-2.87) (-3.23)
Returns of Foreign Stocks (No Common Holders) -1.701 -0.550(-8.73) (-2.71)
Local Beta*Local Market 0.005 0.005 0.728(1.75) (1.81) (15.21)
World Beta*World Market -0.004 -0.011 0.165(-0.40) (-0.91) (0.34)
Industry 0.006 0.006 0.410(1.27) (1.28) (9.67)
Adjusted R2 0.003 0.009 0.003 0.002 0.001 0.005 0.010 0.040 0.143Number of Firms 1,991 1,582 1,991 1,991 1,991 1,991 1,582 2,053 1,598
ReturnsChange in Holdings
Warwick Business School
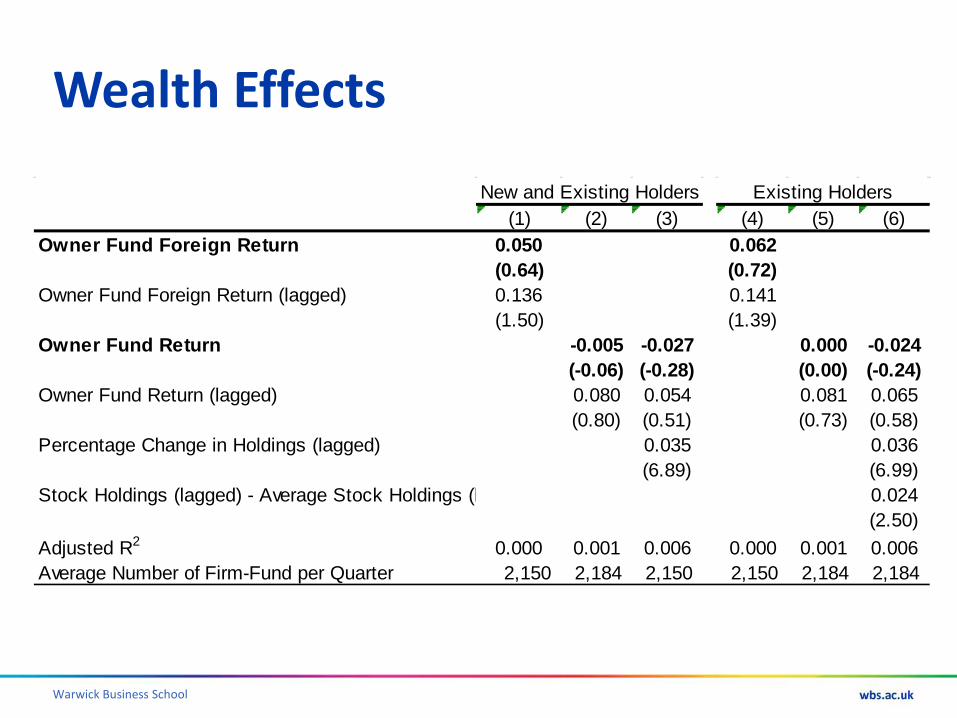
Wealth Effects
(1) (2) (3) (4) (5) (6)Owner Fund Foreign Return 0.050 0.062
(0.64) (0.72)Owner Fund Foreign Return (lagged) 0.136 0.141
(1.50) (1.39)Owner Fund Return -0.005 -0.027 0.000 -0.024
(-0.06) (-0.28) (0.00) (-0.24)Owner Fund Return (lagged) 0.080 0.054 0.081 0.065
(0.80) (0.51) (0.73) (0.58)Percentage Change in Holdings (lagged) 0.035 0.036
(6.89) (6.99)Stock Holdings (lagged) - Average Stock Holdings (l 0.024
(2.50)Adjusted R2 0.000 0.001 0.006 0.000 0.001 0.006Average Number of Firm-Fund per Quarter 2,150 2,184 2,150 2,150 2,184 2,184
New and Existing Holders Existing Holders

Warwick Business School
Implications for Portfolio Diversification
Diversification across countries and industries
A purely cash-flow based view of the world
Role of ownership
Level of foreign ownership
Foreign ownership beta

Warwick Business School
Diversification Implications: Foreign Ownership Level
0%
20%
40%
60%
80%
100%
1 3 5 7 9 11 13 15 17 19 21 23 25 27 29 31 33 35 37 39Number of Stocks
Portf
olio
var
aria
nce
as a
% o
f the
ave
rage
stoc
k va
rianc
FO=0% 0%<FO<1%
1%<FO<5% 5%<FO

Warwick Business School
Diversification Implications
Panel A FO=0% 0%<FO<1% 1%<FO<5% 5%<FOAverage Covariance 0.00058 0.00053 0.00062 0.00077Average Correlation 0.103 0.128 0.162 0.210
Panel B <0.5 (Low) 0.5-0.75 0.75-1 >1 (High) High-Low t-stat
Average Ownership Beta 0.380 0.648 0.867 1.080 0.699Average Fund Beta 0.471 0.635 0.765 0.864 0.394 5.4
Ownership Beta bin

Warwick Business School
Diversification Implications
26
FO Level <0.5 (Low) 0.5-0.75 0.75-1 >1 (High) Average t-stat
0% 0.34 0.45 0.53 0.58 0.48 0.24 4.10%-1% 0.39 0.51 0.57 0.61 0.52 0.22 4.41%-5% 0.45 0.56 0.66 0.75 0.6 0.3 4.45%-15% 0.46 0.58 0.70 0.81 0.64 0.35 6.0>15% 0.47 0.67 0.83 0.98 0.74 0.5 5.4
Average 0.42 0.56 0.66 0.74 0.31 9.9High FO-Low FO 0.12 0.21 0.27 0.34 0.23
t-stat 9.75 6.26 14.2 6.87 11.3
Ownership Beta bins High FO – Low FO
Fund Betas

Warwick Business School
Summary and Conclusion Foreign ownership by institutional investors matters
for international stock returns Similar importance as country and industry fundamentals Not explained by omitted country/industry variations,
wealth effects or other explanations like liquidity, investment style, or fund flows
Ownership linkages Summary measure of investment locale/habitat that links
investor capital around the world Beyond the level of foreign ownership, the specific
ownership composition of a stock matters
Important diversification implications <http://papers.ssrn.com/sol3/papers.cfm?abstract_id=2022129>

Warwick Business School
WBS - we look at things differently
Prof. Dr. Söhnke M. Bartram Department of Finance Warwick Business School Warwick University Coventry CV4 7AL United Kingdom Phone: +44 (24) 7657 4168 Fax: +1 (425) 952 10 70 Email: <[email protected]> Internet: <http://go.warwick.ac.uk/sbartram/> Research: <http://papers.ssrn.com/sol3/cf_dev/AbsByAuth.cfm?per_id=260018>
28