shell strength k. w. washburn introduction washburn.pdf · shell strength k. w. washburn ... eating...
TRANSCRIPT
FACTORS AFFECTING SELECTION PROGRESS FORSHELL STRENGTH
K. W. Washburn
Department of PoultryScienceThe University of Georgia
Athens, GA 30602
INTRODUCTION
The per capita egg consumption has decreased considerably over the last 15
years. A major reason for this decrease is the concern over cholesterol and changing
eating habits of today's family. However, I feel that some of this decline may be due
to consumer dissatisfaction with the shell quality and subsequent rejection of eggs
as a food item they wish to purchase. This negative effect on consumption added
to the approximately 7% loss of eggs from the point of lay to the consumer, provides
an enormous opportunity for dramatic improvement in economic return by improving
the shell quality of commercial layers.
In previous talks on the subject of egg shell strength, it has been stated that the
average egg breakage (including cracks) from point of lay to consumers' use was 7%.
Recent estimates indicate that this value has changed very little. Breeders of
commercial egg layers are all placing selection pressure on improving shell strength.
Thus, the question needs to be asked as to why so many of our eggs are lost because
of weak shells. A number of questions, summarized in Table 1, come to mind in
evaluating the genetic approach to improving shell strength.
136
The first question to be addressed is, "What is the status of the genetic
Variation in shell strength?" A discussion of genetic variation can be divided into 5
categories:
1. Differences between brown and white shell color populations.
2. Differences between genetic groups.
3. Heritability estimates.
4. Long term selection experiments.
5. Specific long term selection experiments which used a commercial-type
population, assessed the extent of diherences in different
environments, and assessed changes in other important traits.
Differences between brown and white shell color populations:
A number of studies have shown differences in shell strength between brown
and white shell color populations. These can be divided into pure breed
comparisons and comparisons between commercial strains. Taylor and Martin
(1928) found that the percent shell of brown eggs (from Barred Plymouth Rocks)
was lower than that of white shelled eggs from White Leghorns. Tyler and Geake
(1958) reported that the white shelled eggs from White Leghorns had thicker shells
than the brown shelled eggs from Rhode Island Reds. Eggs from Brown Leghorns
(white shell) was similar to those from the Rhode Island Red breed. Perek and
Snapir (1970) reported that the mg per cm shell was greater in White Leghorns than
in White Plymouth Rock (brown shell). Rodda (1972 found that a White Leghorn
strain had better shell strength than a Rhode Island Red strain. Shell strength of
commercial white egg strains were in general better than that of brown egg strains
137
(Potts and Washburn, 1974) and eggs from white egg commercial strains in random
sample tests had better shell strength than those from brown egg strains (Hunton,
1980).
Differences in shell strength between genetic groups (non-commercial) have
been shown in a number of studies. Significant differences among dam families in
percent shell ash were reported by Munro (1938). Genetic variation in shell
thickness in a White Leghorn population was observed by Taylor and Lerner (1941).
Significant differences in shell thickness between various breeds and lines were found
by Farnsworth and Nordskog (1955). Significant differences in specific gravity in
three White Leghorn strains were reported by Nagai and Gowe (1969). Difference
between strains in tensile strength were observed by Carter (1970). Significant
difference in percent broken eggs in White Plymouth Rock lines selected for
divergence in body size were reported by Siegel et al. (1978). A desert inhabiting
breed (Sinai) were found to have shells that were less porous and thicker than that
of commercial White Leghorns (Arad and Marder, 1982).
In contrast to these studies using non-commercial genetic groups, there are few
published studies on differences between genetic groups which would be considered
as commercial layers. Significant differences were shown in breaking strength,
thickness and percent cracks in eight commercial strains (Bowman and Challender,
1963). Significant differences in shell strength among three white and three brown
egg strains were reported by Potts and Washburn (1974). In this study shell quality
was assessed by a number of methods and the deterioration in shell strength started
earlier in brown egg strains. Differences were observed between 10 commercial
138
strains and crosses in shell strength measured by percent shell, shell weight, and
relative changes with age (Hamilton, 1979).
Heritability estimates (h2):
A summary of h2 estimates for various genetic groups and methods of
measuring is presented in Table 2. These estimates show a wide range in values.
It appears that the h2 estimates obtained from brown egg populations is higher than
that obtained from white egg populations. Many of these values were obtained on
pure breeds and may not be representative of the amount of genetic variation in
commercial layers. In the study of Potts and Washburn (1985) in which a single
commercial leghorn type parent line Wasused, the h2 ranged from .18 to .31. The
values of .39 and .31 were obtained as a composite value of many h2 estimates. It
is probable that more emphasis should be placed on these estimates. Another study
of importance is the relatively recent one by Grunder (1986) in which the h2of intact
eggs were studied. These h2 estimates were relatively low (.10 to .26).
Several of these studies measured shell strength in the same population at
different ages. The data presented in Table 3 indicate that h2 of shell strength
decreases with age. This may have an impact on the age at which shell strength is
measured for selection studies. The reasons for this decline needs to be studied.
Four conclusions can be obtained from the h2 estimates:
1. The h2 of shell strength should be considered moderate (about .3).
2. The h2 estimates obtained from white shelled eggs tend to be lower than
those obtained from brown shelled populations.
139
3. The h2 of shell strength appears to decrease with age.
4. h2 estimates for current commercial laying strains are needed.
In evaluating genetic variation, the most important consideration is progress
in selection experiments. A summary of selection experiments for shell strength is
presented in Table 4. These studies used a variety of genetic populations and
methods of measuring shell strength. Most of these studies show that genetic
progress can be made in improving shell strength. However, none of these studies
utilized populations comparable to the current commercial lines.
The genetic variation in shell strength can be summarized by the following
points:
1. There is sufficient genetic variation to develop an effective selection
program.
2. Genetic variation differs between populations.
3. The amount of measurable variation decreases with age.
4. Information is needed on heritabilities, selection progress, and correlated
changes in current commercial laying strains.
Basis for genetic variation in shell strength:
There are a number of areas that provide the basis for genetic variation in
shell strength. Two of these will be discussed: 1) Egg characteristics and 2)
Physiological response. Selection for these traits could interfere with selection
progress for shell strength if there were negative correlations between them and shell
strength.
140
Possible changes in egg characteristic in response to selection for shell strength
include 1) shape, 2) shell color, 3) membrane mass, and 4) egg weight.
Some of the older data using pure breeds have shown a degree of correlation
of egg shape and shell strength, the eggs with rounder shape having better shell
strength. However, in commercial strains we have found little correlation between
shape and strength (Table 5). The data in Table 5 is a composite of three brown
egg and three white egg strains in which the shell strength was determined by a
number of methods. Only for breaking strength of brown eggs does the correlation
approach a magnitude of importance.
Some of the older data, mostly using pure breeds, have also shown a
relationship between egg shell tint and strength. However, in commercial brown egg
strains tint does not appear to be an important factor in shell strength (Table 6). In
this study, shell tint of eggs from two commercial brown egg strains was visually
scored on a scale of 1 to 5 and these values correlated with shell strength measured
by deformation, thickness, specific gravity, and breaking strength.
One egg characteristic often overlooked does have an effect on shell strength.
That characteristic is the shell membrane. In the study presented in Table 7, three
commercial white and three commercial brown egg strains were divided into low
deformation (high shell strength) and high deformation (low shell strength) groups.
After determination of shell strength, the weight of the shell membrane of these eggs
were then determined. This study shows that the shell membrane weight was
associated with shell strength both in groups selected for differences in deformation
and between brown and white shell groups which differed in shell strength.
141
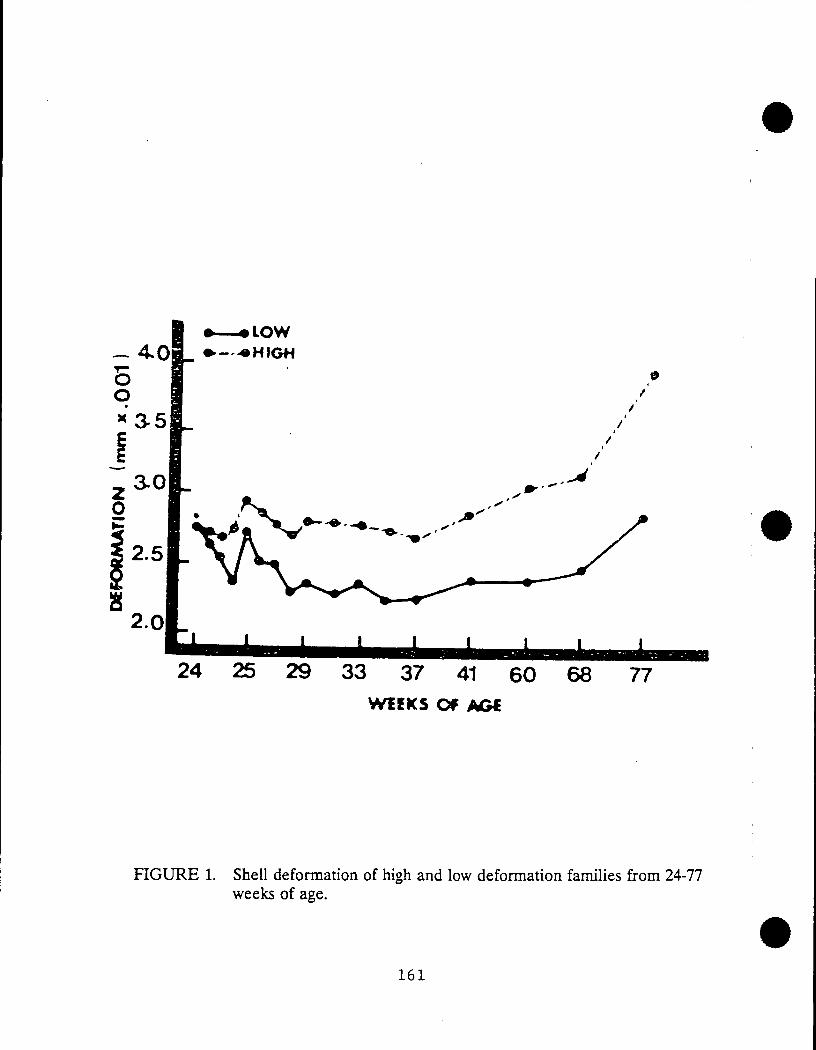
The characteristic of the egg that is most often associated with shell strength_.
is egg weight. As the hen becomes older the size of the egg increases and the shell
strength decreases, however, the amount of shell deposited remains relatively
constant or is only slightly increased, thus there is a relative decrease in the amount
of shell. This relationship, utilizing deformation as the measure of shell strength, is
shown in Figure 1. It is clear that the egg weight increased throughout the 77 week
period and shell strength decreased (higher deformation = lower strength) with age
after 37 weeks. This type of relationship has resulted in an association of increased
egg weight with poorer shell strength.
In the study shown in Table 8, the association of egg weight "andshell strength
was studied in different strains utilizing four different methods to measure shell
strength within specific age periods. In general, correlations between weight and
strength within ages were low:" However, in strain 1 there was a moderatea
correlation regardless of the method used to assess shell strength. Egg weight was
also measured in the deformation studyutilizing a commercial grand-parent leghorn
line to obtain information about the association of shell strength and egg weight.
Phenotypic correlations between deformation and egg weight were near 0 and
genetic correlations of these variables ranged from - 0.29 to -0.57 (Table 9).
These correlations indicate that selection for increased shell strength should
not have a deleterious effect on egg weight. However, none of these studies used
the current commercial layer which is smaller in size and probably lays an egg whose
size is proportionally larger than those on which these data were obtained.
142
P_h_hysioloNealrespo_nscs:
There are a number of possible physiological responses to selection for shell
strength. These include:
1. Length of time egg is in shell gland
2. Rate of shell deposition
3. Uterine environment
4. Changes in acid-base balance
*5. Efficiency in metabolizing calcium
These are all important, but I would like to focus on the efficiency in metabolizing
Ca.
In discussing the efficiency of metabolizable Ca, I will focus on two points:
1. Feeding excess Ca to improve shell strength
2. Effects of selection emphasis on Ca efficiency
The importance of Ca metabolism in shell formation is well documented and
increasing Ca level to a certain level may result in improved shell strength. Thus,
one might hypothesize that differences in response to dietary Ca may explain genetic
differences in shell strength.
In the study shown in Table 10, commercial layers were divided into high and
low deformation groups. Each deformation group was divided into two treatment
groups. The control group received a diet containing 2.9% Ca while the Ca
treatment group received this diet plus free access to oyster shells. After a 3 week
period, shell strength was assessed by deformation, breaking strength, and shell
thickness. There were no consistent trends to suggest that the strength of eggs from
143
low shell strength groups receiving additional Ca was improved any more than that
of the high strength groups.
Some of our current problems with shell strength may be the result of the
selection pressure to produce a layer which provides the opportunity for maximum
economic returns. There is selection pressure to decrease body size to improve
efficiency and increased egg numbers without changing egg size.
In the pullet, the formation of new bone stays active only to the beginning of
lay at which time it appears to shut down. Activity then shifts from the conical bone
to the medullary bone. The hen uses dietary Ca and Ca from the medullary bone
for shell formation. As the body size and bone mass is genetically decreased with
expectations of more eggs and no decrease in egg size it may become more difficult
to maintain sufficient Ca deposition to maintain good shell strength. This may
become especially critical with combinations of aging and hot environmental
temperature. Studies need to be conducted using the modern layer and measuring
shell strength over the production period and in different environmental conditions.
Individual Variation
Considerable variation in shell strength is observed between individuals within
a flock. This may or may not be all genetic variation but it is important from two
aspects: 1) the differences seem to be predetermined at an early age, 2) the
differences remain consistent at least over short periods. These differences observed
when the birds first come into lay continue and are amplified throughout the period
of lay (Figure 2).
144
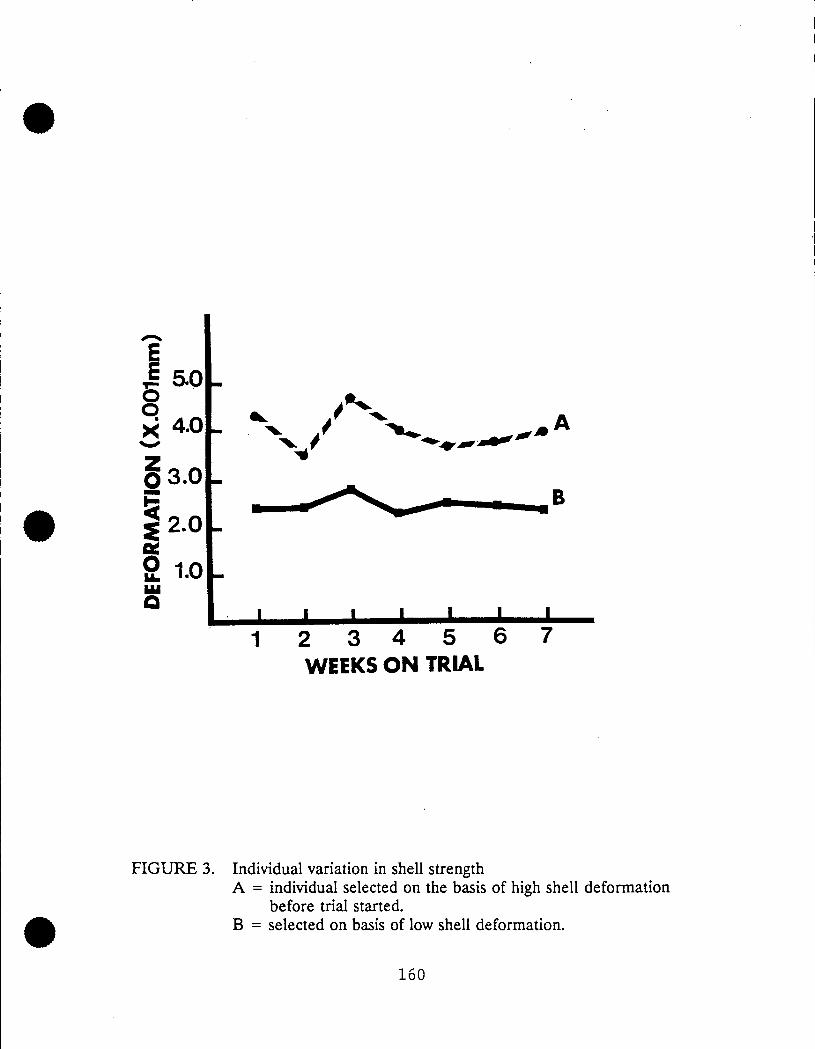
Figure 3 shows the deformation values over a 7 week period of two individuals
differing in basal deformation values. These values were consistent over the 7 week
period. However, it is interesting to note that the fluctuations in the poor shell
strength individual (high deformation) was greater over the period than was that of
the individual with better shell strength. Studies need to be conducted to determine
if factors which result in changes in shell strength have a greater effect on those
individuals with inherently poorer shell strength.
Methods of Measuring Shell Strength
Important aspects of measuring shell quality include: 1) physical method, 2)
age, and 3) the effects of environmental conditions.
Physical method:
The strength of the shell has most often been measured by various lab
estimates of shell strength. Many studies have been done to determine which of
these methods are the best. The results of our studies (Table 11) show a very high
phenotypic correlation between the most used different methods of measuring shell
strength indicating that any of these methods would be acceptable in lab-type
evaluations of shell strength. However, this relationship may not be so clear-cut
when comparisons are made over time. In the study presented in Table 12, 31-37
week deformation was used to classify sire families into low or high deformation
groups. At 40, 60, 68, and 77 weeks of age the breaking strength and percent shell,
in addition to deformation, was obtained. Differences between deformation groups
remained significant throughout the period. Differences in breaking strength were
145
significant for most of the ages. However, percent shell differences were significant
only for the 41 week period.
Lab tests such as these would be of limited value unless they have a reasonable
degree of relationship to the proportion of eggs cracked or broken under commercial
conditions. A number of studies have attempted to determine the association of
laboratory shell strength measures with shell breakage. Two points make it difficult
to assess this:
1. Considering all the points at which shells can receive an insult sufficient to
cause breakage, all eggs do not receive the same insult under commercial
conditions so that the degree of insult a particular egg receives is a matter
of chance.
2. If the degree of the insult is not controlled it may be so great that it
exceeds the degree of variation in shell strength of the samples being
tested.
However, a number of studies have shown there is a good degree of association
between shell strength measured under laboratory conditions and breakage under
commercial conditions (these are summarized in Table 13).
In addition, Grunder et al. (1989) reported that the phenotypic correlation
between a number of shell quality traits and % intact shells ranged from .19 to .47.
Genetic correlations ranged from .23 to 1.04. However, genetic correlations between
shell strength measures at 42 weeks with intact eggs at 68 weeks were low except for
shell weight.
146
Effects of age:
In addition to the physical method used for measuring, the age of the bird at
which determinations are made is important. Since the major problem in shell
strength is with older hens the question arises - should the genetic selection be based
on data obtained on older hens? This has two obvious disadvantages: 1) h2 of shell
strength decreases with age, 2) generation interval is increased if data for selection
is obtained at later ages.
In the study shown in Figure 1, sire families were categorized as high or low
shell deformation families on the basis of values obtained from 31-37 weeks of age.
Deformation values were then obtained through 77 weeks of age. The differences
between the groups were maintained throughout the 77 week period and became
greater from 41 weeks on as the shell strength of the high deformation families
deteriorated at a faster rate than the low deformation families. This indicates that
selection based on determination made at an earlier age of the production cycle
should be effective in improving shell strength at older ages when the shell strength
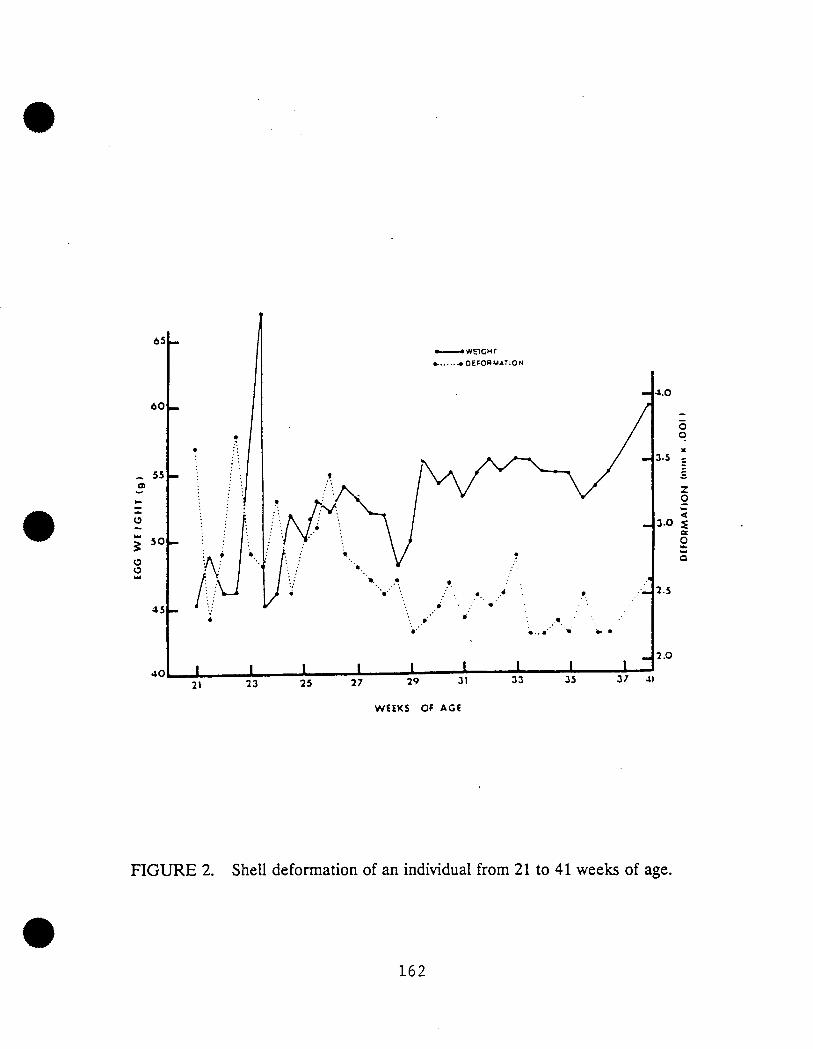
is in general poorer. However, at very early age there appears to be considerable
variation in shell strength of individual birds. Figure 2 shows an example of the shell
deformation of a typical individual from beginning of lay through 44 weeks of age.
The shell deformation values were quite variable during the earlier ages. This
suggests that in this particular population egg strength data obtained before 30 weeks
of age may not be reliable.
147
Environment:
A number of non-genetic environmental factors contribute to the variability in
shell strength. These include such known things as age, season, ambient
temperature, diet and disease. In the assessment of shell strength for use in a
breeding program, these factors Contributing to shell strength must be carefully
separated from the genetic contribution to the variation.
In addition to these known factors that contribute to variation in shell strength,
unknown factors may result in temporarily altered shell strength. The disturbing
thing about these changes in shell strength is that the temporarily altered values may
not be representative of the true shell strength of those individuals (Table 14). Shell
strength values obtained during week 1 (where the shell strength was altered) were
not well correlated with values obtained after the shell strength had returned to
normal (week 2).
To summarize, I would like to focus on what I think the future genetic
approach to solving the shell strength problem should be:
1. Determine the basis of the individual variation in shell strength and its
relationship to genetic variation.
2. Conduct selection experiments using current commercial type layers as base
populations and measure correlated changes.
3. Evaluate various combinations of methods of measuring shell strength, age,
and temperature.
4. Evaluate the inter-relationships of selection pressures for decreased body
weight, increased egg numbers, and maintaining egg weight on the birds
ability to maintain shell strength.
148
i
REFERENCES
Arad, A., and J. Marder, 1982. Differences in egg shell quality among the Sinai
Bedouin fowl, the commercial White Leghorn and their crossbreds. Br. Poult.
Sci. 23:107-112.
Bowman, J. C., and H. I. Challender, 1963. Egg shell strength. A comparison of two
laboratory tests and field results. Br. Poult. Sci. 4:103-116.
Buss, E. G., 1982. Genetic differences in avian egg shell formation. Poultry Sci.
61:2048-2055.
Buss, E. G., R. M. Leach, Jr., and J. T. Stout, 1977. Eggshell quality for chickens in
selected lines, Fl's. and F2's. Poultry Sci. 56:1699-1700.
Carter, T. C., 1970. The hen's egg: some factors affecting deformation in statically
loaded shell. Br. Poult. Sci. 11:15-38.
Engstr6m, G., C. Weyde, and L. E. Liljedahl, 1986. Genetic correlations and
heritabilities for frequency of cracked eggs, egg number and egg weight in
laying hens. Br. Poult. Sci. 27:55-61.
Farnsworth, G. M., Jr., and A. W. Nordskog, 1955. Breeding for egg quality.
3. Genetic differences in shell characteristics and other egg quality factors.
Poultry Sci. 34:16-26.
Gowe, R. S., and R. W. Fairfield, 1986. Long term selection for egg production in
chickens. 3rd World Congress on genetics applied to livestock production.
XII. Biotechnology, selection experiments, parameter estimation, design of
breeding system management of genetic resources. Long term selection for
egg production in chickens, pp. 152-167.
149
Grunder, A.A., R. M. G. Hamilton, R. W. Fairfield, and B, K. Thompson, 1989.
Genetic parameters of egg shell quality traits and percentage of eggs remaining
intact between oviposition and grading. Poultry Sci. 68:46-54.
Hamilton, R. M. G., K. G. Hollands, P. W. Voisey, and A. A. Grunder, 1979.
Relationship between egg shell quality and shell breakage and factors that
affect shell breakage in the field - a review. World's Poultry Sci. J. 35:177-190.
Hunton P., 1982. Genetic factors affecting egg shell quality. World's Poultry Sci.
J. 38:75-84.
Jaff6, W. P., 1966. Egg production, body weight and egg quality characters, their
heritability and the correlations between them. Br. Poult. Sci. 7:91-98.
Johnson, A. S., and E. S. Merritt, 1955. Heritability of albumen weight and specific
gravity of eggs from White Leghorns and Barred Rocks and the correlations
of these traits with egg production. Poultry Sci. 34:578-587.
McNally, E. H., 1965. The relationship of egg shell weight to cracked eggs. Poultry
Sci. 44:1513-1518.
Munro, S. S. 1938. Effects of heredity on interior egg quality and shell composition.
Poultry Sci. 17:17-27.
Nagai, J., and R.S. Gowe, 1969. Genetic control of egg quality. 1. Source of
variation. Br. Poult. Sci. 10:337-350.
Perek, M., and N. Snapir, 1970. Interrelationships between shell quality and egg
production and egg and shell weights in Wfiite Leghorn and White Rock hens.
Br. Poult. Sci. 11:133-145.
150
Pevzner, I. Y., G. W. Friars, H. L Orr, and B. S. Reinhart, 1976. The use of
selections and strain crossing to reduce egg shell breakage. Br. Poult. Sci.
17:185-194.
Potts, P. L, and K. W. Washburn, 1974. Shell evaluation of white and brown egg
strains by deformation, breaking strength, shell thickness and specific gravity.
Poultry Sci. 53:1123-1128.
Potts, P. L, Sr., and K. W. Washburn, 1985. Genetic variation in shell strength and
its relationship to egg size. Poultry Sci. 64:1249-1256.
Quinn, J. P., C. D. Gordon, and A. B. Godfrey, 1945. Breeding for egg shell quality
as indicated by egg weight loss. Poultry Sci. 24:399-403.
Rodda, D. D., 1972. Breeding for late egg shell quality in the domestic hens. Br.
Poult. Sci. 13:45-60.
Siegel, P. B., J. H. van Middelkoop, and P. R. K. Reddy, 1978. Comparisons of
frequencies and egg shell characteristics of broken and intact eggs within
diverse populations of chickens. Br. Poult. Sci. 19:411-416.
Strong, C. F., 1988. Relationship between several measures of shell quality and egg
breakage in commercial processing plants. Poultry Sci. 67:162.
Taylor, L. W., and J. H. Martin, 1928. Factors influencing thickness of egg shell.
Poultry Sci. 8:39-41.
Taylor, L. W., and I. M. Lerner, 1939. Inheritance of eggshell thickness in White
Leghorn Pullets. J. Agri. Res. 58:383-396.
Taylor, L. W., and I. M. Lerner, 1941. Inheritance of shell finish in Single Comb
White Leghorns. J. Hered. 32:33-36.
151
Tyler, C., and F. H. Geake, 1958. Studies on egg shells. IX. The influence of
individuality, breed, and season on certain characteristics of egg shell from
pullets. J. Sci. Food Agric. 9:473-483.
Van Tijen, W. F., 1977. Shell quality in poultry asseen from the breeder's
viewpoint. 3. Heritabilities: Expected versus accomplished response. Poultry
Sci. 56:1121-1126.
Van Tijen, W. F., and A. R. Kuit, 1970. The heritability of characteristics of egg
quality, their mutual correlation and the relationship with productivity. Arch.
Geflu gelk. 34:201-210.
152
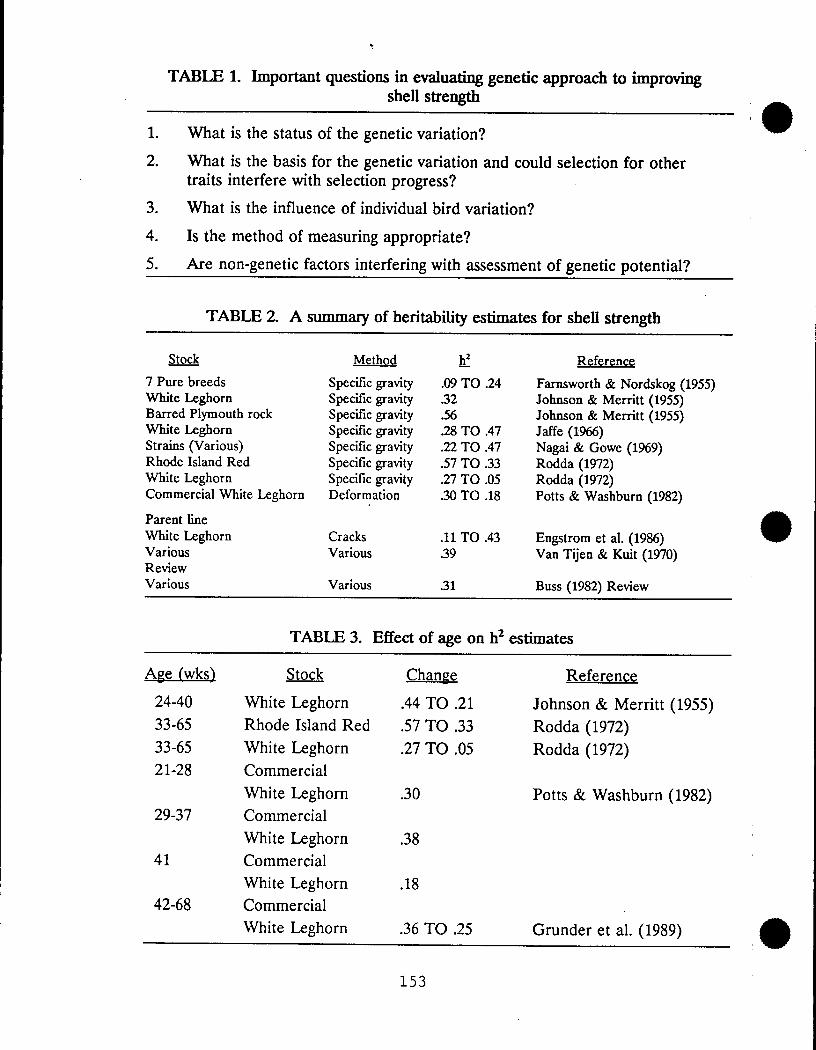
TABLE 1. Important questions in evaluating genetic approach to improvingshell strength
1. What is the status of the genetic variation?
2. What is the basis for the genetic variation and could selection for othertraits interfere with selection progress?
3. What is the influence of individual bird variation?
4. Is the method of measuring appropriate?
5. Are non-genetic factors interfering with assessment of genetic potential?
TABLE 2. A summary of heritability estimates for shell strength
Stock Method h_ Reference
7 Pure breeds Specific gravity .09 TO .24 Farnsworth & Nordskog (1955)White Leghorn Specific gravity .32 Johnson & Merritt (1955)Barred Plymouth rock Specific gravity .56 Johnson & Merritt (1955)White Leghorn Specific gravity .28 TO .47 Jaffe (1966)
Strains (Various) Specific gravity .22 TO .47 Nagai & Gowe (1969)Rhode Island Red Specific gravity .57 TO .33 Rodda (1972)White Leghorn Specific gravity .27 TO .05 Rodda (1972)
Commercial White Leghorn Deformation .30 TO .18 Potts & Washburn (1982)
Parent line
White Leghorn Cracks .11 TO .43 Engstrom et al. (1986)Various Various .39 Van Tijen & Kuit (1970)Review
Various Various .31 Buss (1982) Review
TABLE 3. Effect of age on h2 estimates
Age (wks) Stock Change Reference
24-40 White Leghorn .44 TO .21 Johnson & Merritt (1955)
33-65 Rhode Island Red .57 TO .33 Rodda (1972)
33-65 White Leghorn .27 TO .05 Rodda (1972)21-28 Commercial
White Leghorn .30 Potts & Washburn (1982)29-37 Commercial
White Leghorn .3841 Commercial
White Leghorn .1842-68 Commercial
White Leghorn .36 TO .25 Grunder et al. (1989)
153
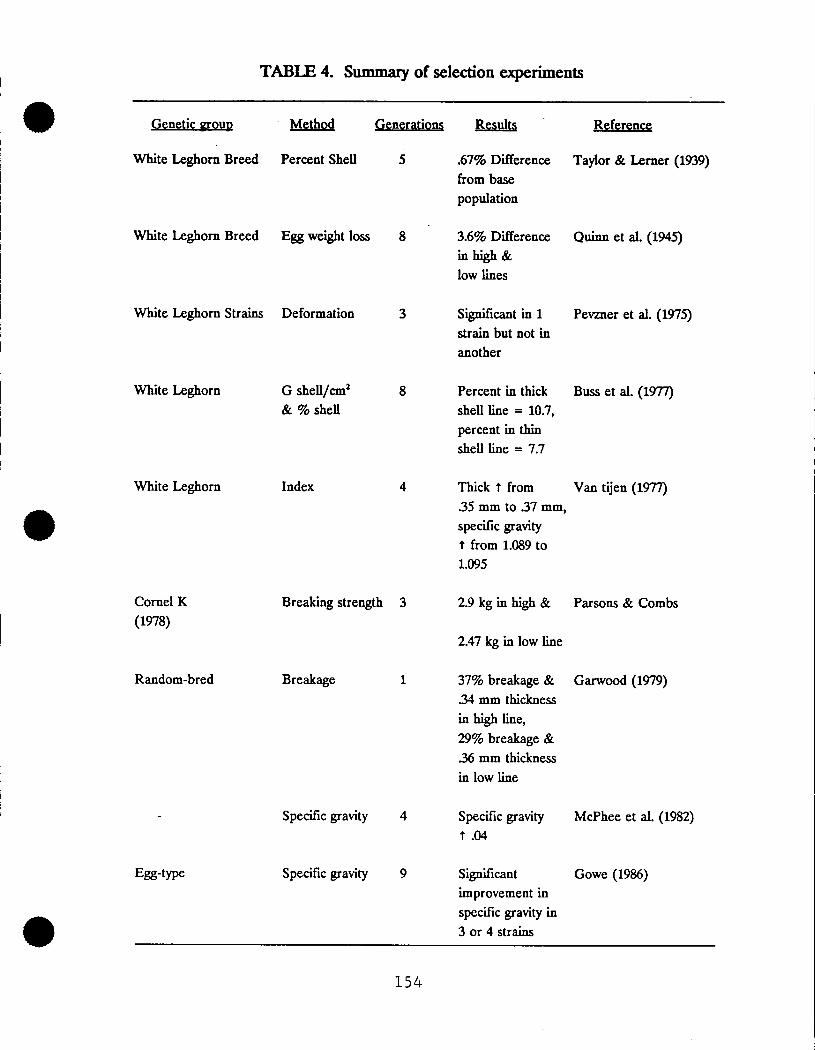
TABLE 4. Summary of selection experiments
Genetic _oup _ Generations Results Reference
White Leghorn Breed Percent Shell 5 .67% Difference Taylor & Lerner (1939)from base
population
White Leghorn Breed Egg weight loss 8 3.6% Difference Qulnn et al. (1945)in lfigh &low lines
White Leghorn Strains Deformation 3 Significant in 1 Pevzner et al. (1975)strain but not in
another
White Leghorn G shell/cm _ 8 Percent in thick Buss et al. (1977)& % shell shell line = 10.7,
percent in thinshell line = 7.7
White Leghorn Index 4 Thick t from Van tijen (lg'F0.35 mm to .37 ram,
specific gravityt from 1.089 to
1.095
CornelK BreakingStrength3 2.9kginhigh& Parsons& Combs
(1978)
2.47 kg in low line
Random-bred Breakage 1 37% breakage & Garwood (1979)234mm thickness
in high line,
29% breakage &.36 mm thickness
in lowline
- Specific gravity 4 Specific gravity McPhee et al. (1982)1".04
Egg-type Specific gravity 9 Significant Gowe (1986)
improvement in
specific gravity in3 or 4 strains
154
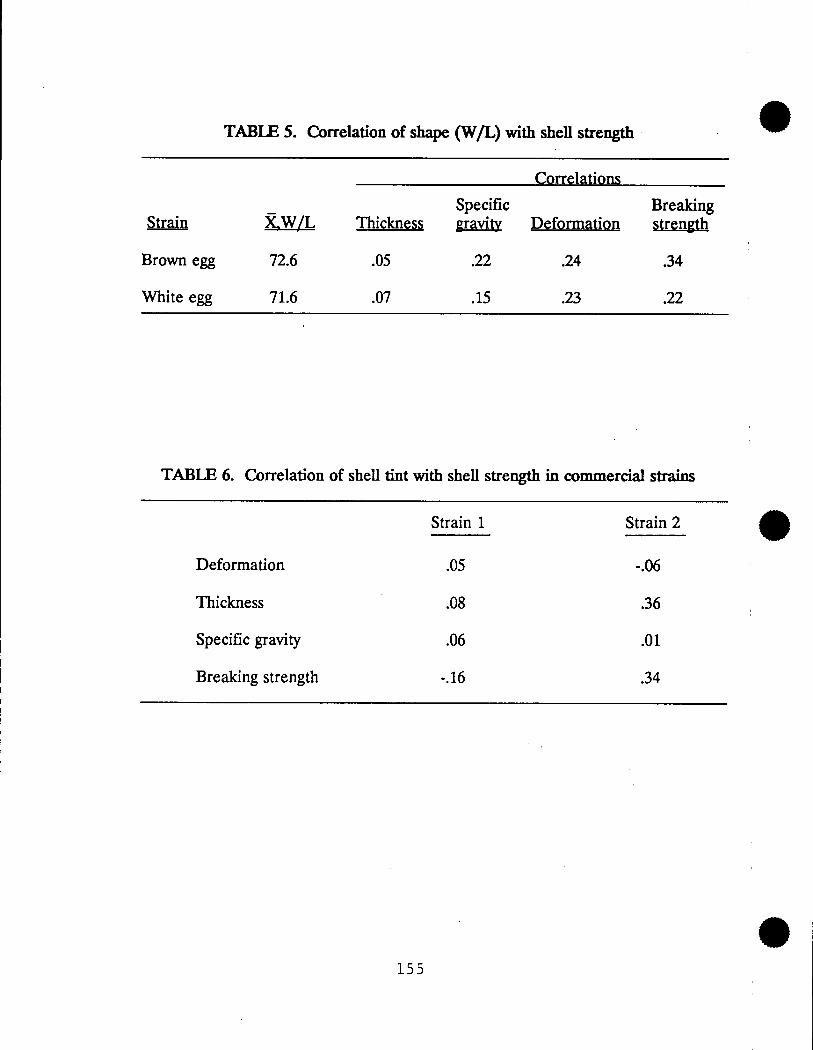
TABLE 5. Correlation of shape (W/L) with shell strength .
C0rr¢l_ti0n_
Specific BreakingStrain _W/L Thickness _ Deformation strength
Brown egg 72.6 .05 .22 .24 .34
White egg 71.6 .07 .15 .23 .22
TABLE 6. Correlation of shell tint with shell strength in commercial strains
Strain 1 Strain 2
Deformation .05 -.06
Thickness .08 .36
Specific gravity .06 .01
Breaking strength -.16 .34
155
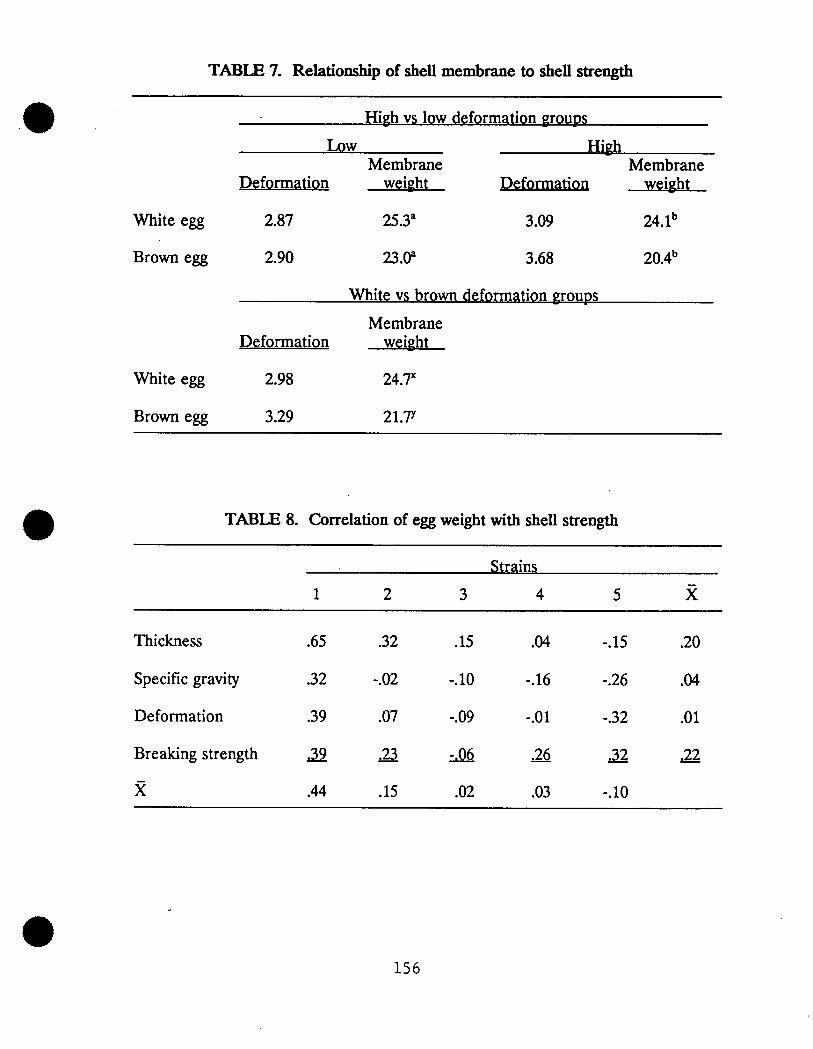
TABLE 7. Relationship of shell membrane to shell strength
High vs low deformation _oups
LOw HighMembrane Membrane
Deformation weight Deformation weight
White egg 2.87 25.3a 3.09 24.1b
Brown egg 2.90 23.(P 3.68 20.4 b
White vs brown deformation groups
Membrane
Deformation weight
White egg 2.98 24.7x
Brown egg 3.29 21.7y
TABLE 8. Correlation of egg weight with shell strength
Straim
1 2 3 4 5
Thickness .65 .32 .15 .04 -.15 .20
Specific gravity .32 -.02 -.10 -.16 -.26 .04
Deformation .39 .07 -.09 -.01 -.32 .01
Breaking strength .39 .23 -.06 .26 .32 .22
.44 .15 .02 .03 -.10
156
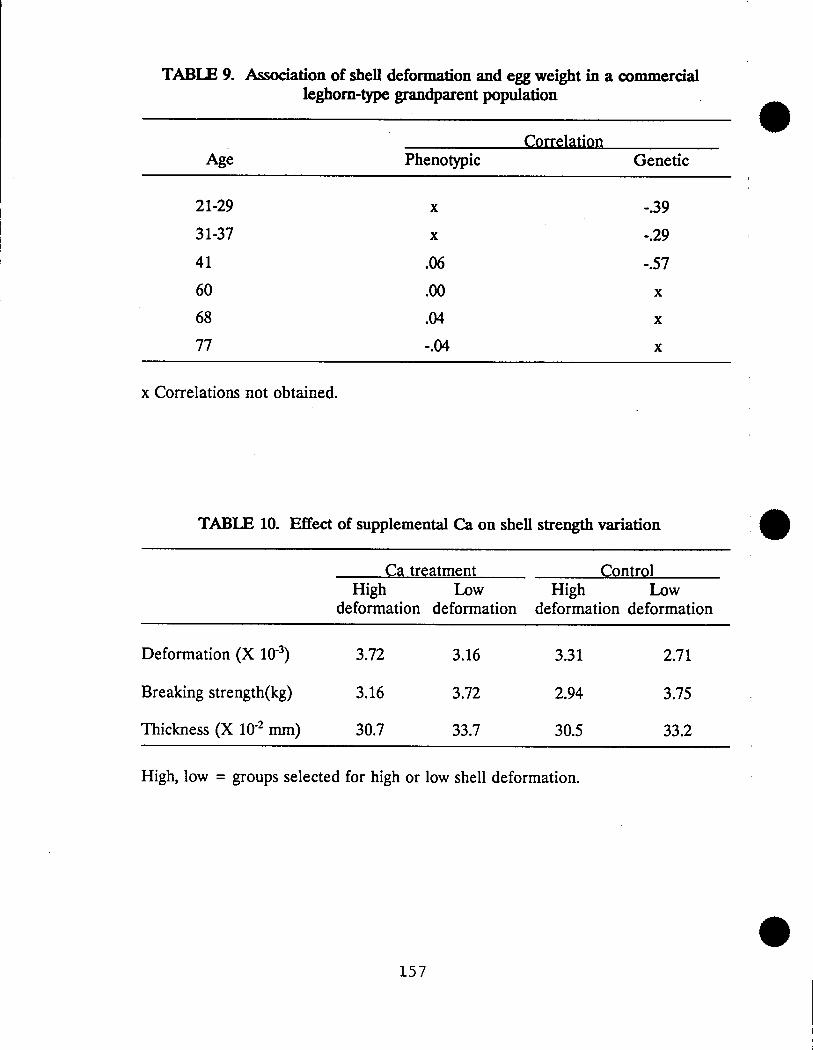
TABLE 9. Association of shell deformation and egg weight in a commercialleghorn-type grandparentpopulation
CorrelationAge Phenotypic Genetic
21-29 x -.39
31-37 x -.29
41 .06 -.57
60 .00 x
68 .04 x
77 -.04 x
x Correlations not obtained.
TABLE 10. Effect of supplemental Ca on shell strength variation
Ca treatment ControlHigh Low High Low
deformation deformation deformation deformation
Deformation (X 10"3) 3.72 3.16 3.31 2.71
Breaking strength(kg) 3.16 3.72 2.94 3.75
Thickness (X 10.2 mm) 30.7 33.7 30.5 33.2
High, low = groups selected for high or low shell deformation.
157
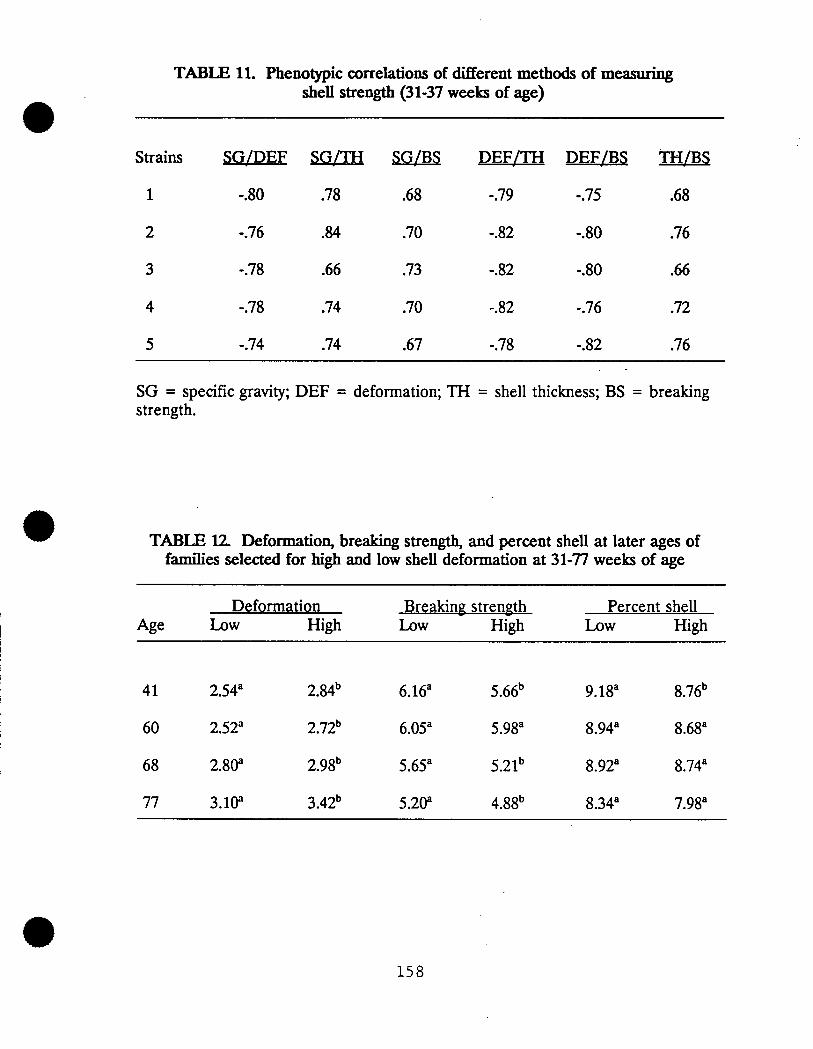
TABLE 11. Phenotypic correlations of different methods of measuringshell strength (31-37 weeks of age)
Strains SG/DEF SG/TH _ DEF/TH DEF/B$ TH/B$
1 -.80 .78 .68 -.79 -.75 .68
2 -.76 .84 .70 -.82 -.80 .76
3 -.78 .66 .73 -.82 -.80 .66
4 -.78 .74 .70 -.82 -.76 .72
5 -.74 .74 .67 -.78 -.82 .76
SG = specific gravity; DEF = deformation; TH = shell thickness; BS = breakingstrength.
TABLE 12. Deformation, breaking strength, and percent shell at later ages offamilies selected for high and low shell deformation at 31-77 weeks of age
Deformation Breaking strength Percent shellAge Low High Low High Low High
41 2.54a 2.84b 6.16a 5.66b 9.18a 8.76b
60 2.52_ 2.72b 6.05_ 5.98_ 8.94_ 8.68a
68 2.80_ 2.98b 5.65_ 5.21b 8.92_ 8.74_
77 3.1& 3.42b 5.21Y 4.88b 8.34_ 7.98a
158
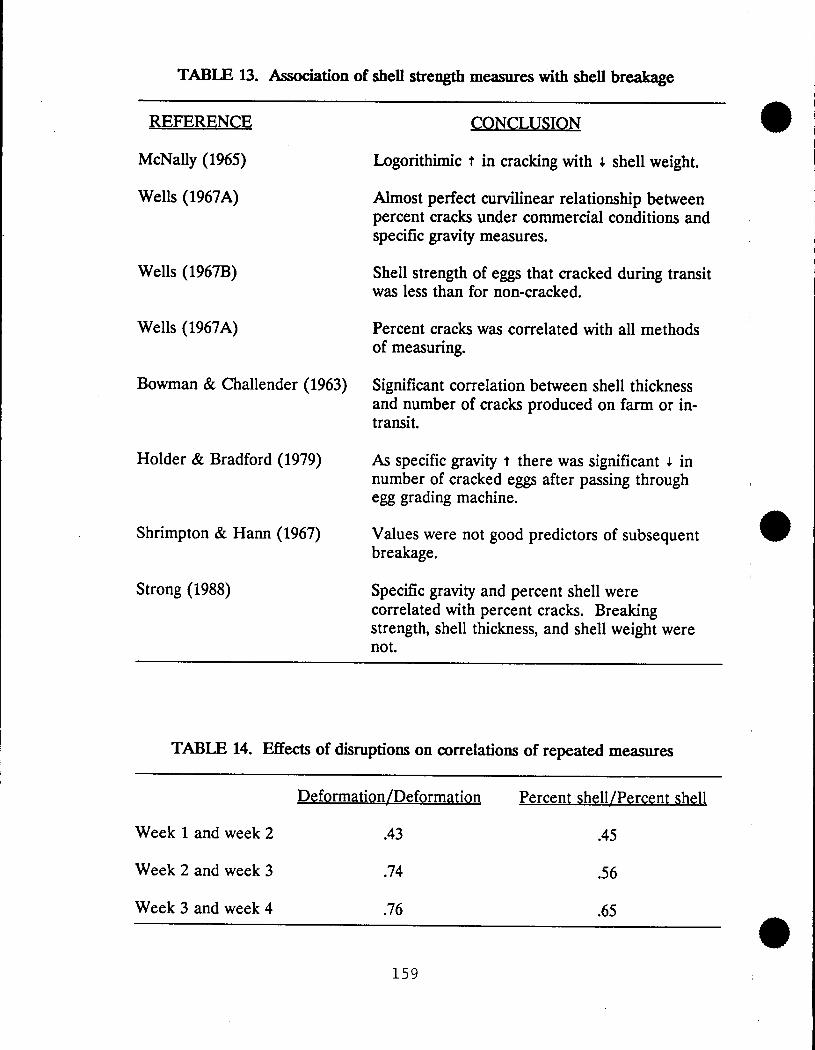
TABLE 13. Association of shell strength measures with shell breakage
REFERENCE CONCLUSION
McNally (1965) Logorithimic t in cracking with # shell weight.
Wells (1967A) Almost perfect curvilinear relationship betweenpercent cracks under commercial conditions andspecific gravity measures.
Wells (1967B) Shell strength of eggs that cracked during transitwas less than for non-cracked.
Wells (1967A) Percent cracks was correlated with all methodsof measuring.
Bowman & Challender (1963) Significant correlation between shell thicknessand number of cracks produced on farm or in-transit.
Holder & Bradford (1979) As specific gravity t there was significant # innumber of cracked eggs after passing throughegg grading machine.
Shrimpton &Hann (1967) Values were not good predictors of subsequentbreakage.
Strong (1988) Specific gravity and percent shell werecorrelated with percent cracks. Breakingstrength, shell thickness, and shell weight werenot.
TABLE 14. Effects of disruptions on correlations of repeated measures
Deformati0n/Deformation Percent shell/Percent shell
Week 1 and week 2 .43 .45
Week 2 and week 3 .74 .56
Week 3 and week 4 .76 .65
159
A
_5,0_
40.-..v i_1_ mclh
_3.0 -
B_2.0 -
1.0_wQ
I 1 t I I I I
1 2 3 4 5 6 7WEEKSON TRIAL
FIGURE 3. Individual variation in shell strengthA = individual selected on the basis of high shell deformation
before trial started.B = selected on basis of low shell deformation.
160
24 25 29 33 37 41 60 6,8 77
WEEKS OF AGE
FIGURE 1. Shell deformation of high and low deformation families from 24-77weeks of age.
161
65mo-,,--,--4 W_IGM T
I- .....4 OFFOA _IATION
,_4.0
so-
" i. ',..........:.........• .......,...,/: .... ...:,_._45 -- .. .._ • \ ."
• I(' O" : ql '.. ""
• 2.0
4o I I L I l L L I l21 23 25 27 29 31 33 35 2,7 41
WEEKS OF AGE
FIGURE 2. Shell deformation of an individual from 21 to 41 weeks of age.
162