shell offshore conducts seismic survey using syqwest strata box 3.5 khz
TRANSCRIPT

MARINE MAMMAL MONITORING AND MITIGATION DURING OPEN WATER SEISMIC EXPLORATION BY SHELL OFFSHORE INC. IN THE CHUKCHI AND BEAUFORT SEAS,
JULY–OCTOBER 2008: 90-DAY REPORT
Prepared by
1101 E. 76th Ave. Suite B, Anchorage, AK 99518
LGL Ltd., environmental research associates P.O. Box 280, 22 Fisher Street, King City, Ont. L7B 1A6, Canada
and
JASCO Research Ltd
Suite 2101, 4464 Markham St., Victoria, BC V8Z 7X8, Canada
for
Shell Offshore, Inc. P.O. Box 576, Houston, TX 77001-0576
and
National Marine Fisheries Service, Office of Protected Resources 1315 East-West Hwy, Silver Spring, MD 20910-3282
and
U.S. Fish and Wildlife Service, Marine Mammal Management 1101 E. Tudor Road, M.S. 341, Anchorage, AK 99503
LGL Report P1049-1
January 2009


MARINE MAMMAL MONITORING AND MITIGATION DURING OPEN WATER SEISMIC EXPLORATION BY SHELL OFFSHORE INC. IN THE CHUKCHI AND BEAUFORT SEAS,
JULY–NOVEMBER 2007: 90-DAY REPORT
Edited by
Darren Irelanda, Robert. Rodriguesa, Dale Funka, William R. Koskib, and David Hannayc
a LGL Alaska Research Associates, Inc.
1101 East 76th Ave., Suite B, Anchorage, AK 99518, U.S.A.
b LGL Limited, environmental research associates P.O. Box 280, 22 Fisher Street, King City, Ont. L7B 1A6, Canada
c JASCO Research Ltd
Suite 2101, 4464 Markham St., Victoria, BC V8Z 7X8, Canada
for
Shell Offshore, Inc.
P.O. Box 576, Houston, TX 77001-0576 and
National Marine Fisheries Service, Office of Protected Resources 1315 East-West Hwy, Silver Spring, MD 20910-3282
and
U.S. Fish and Wildlife Service, Marine Mammal Management 1101 E. Tudor Road, M.S. 341, Anchorage, AK 99503
LGL Report P1049-1
January 2009

Suggested format for citation:
Ireland, D.S., R. Rodrigues, D. Funk, W. Koski, D. Hannay. (eds.) 2009. Marine mammal monitoring and mitigation during open water seismic exploration by Shell Offshore Inc. in the Chukchi and Beaufort Seas, July–October 2008: 90-day report. LGL Rep. P1049-1. Rep. from LGL Alaska Research Associates Inc., LGL Ltd., and JASCO Research Ltd. for Shell Offshore Inc, Nat. Mar. Fish. Serv., and U.S. Fish and Wild. Serv. 277 pp, plus appendices.
Individual chapters can also be cited as follows:
Rodrigues, R., B. Haley, and D.S. Ireland. 2009. Background and introduction. (Chapter 1) In: Ireland, D.S., R. Rodrigues, D. Funk, W. Koski, D. Hannay. (eds.) . . .
Rodrigues, R., B. Haley, and D.S. Ireland. 2009. Seismic surveys described. (Chapter 2) In:
Ireland, D.S., R. Rodrigues, D. Funk, W. Koski, D. Hannay. (eds.) . . . Hannay, D., G. Warner. 2009. Acoustic measurements of airgun arrays and vessels. (Chapter 3)
In: Ireland, D.S., R. Rodrigues, D. Funk, W. Koski, D. Hannay. (eds.). . . Ireland, D.S., R. Rodrigues. 2009. Monitoring and mitigation methods. (Chapter 4) In: Ireland,
D.S., R. Rodrigues, D. Funk, W. Koski, D. Hannay. (eds.). . . Haley, B., C. Reiser, J. Beland, and D Savarese. 2009. Chukchi Sea vessel-based seismic
monitoring. (Chapter 5) In: Ireland, D.S., R. Rodrigues, D. Funk, W. Koski, D. Hannay. (eds.) . . .
Beland, J., C. Reiser, B. Haley, and D. Savarese. 2009. Chukchi Sea vessel-based shallow
hazards and site clearance monitoring. (Chapter 6) In: Ireland, D.S., R. Rodrigues, D. Funk, W. Koski, D. Hannay. (eds.). . .
Reiser, C., B. Haley, J. Beland, and D. Savarese. 2009. Beaufort Sea vessel-based seismic
monitoring. (Chapter 7) In: Ireland, D.S., R. Rodrigues, D. Funk, W. Koski, D. Hannay. (eds.). . .
Beland, J., C. Reiser, B. Haley, and D. Savarese. 2009. Beaufort Sea vessel-based shallow
hazards and site clearance monitoring. (Chapter 8) In: Ireland, D.S., R. Rodrigues, D. Funk, W. Koski, D. Hannay. (eds.). . .
Lyons, C., K. Christie. 2009. Beaufort Sea aerial marine mammal monitoring. (Chapter 9) In:
Ireland, D.S., R. Rodrigues, D. Funk, W. Koski, D. Hannay. (eds.). . .

Table of Contents iii
TABLE OF CONTENTS
TABLE OF CONTENTS ........................................................................................................................ III
LIST OF ACRONYMS AND ABBREVIATIONS .............................................................................. VII
EXECUTIVE SUMMARY ......................................................................................................................IX
BACKGROUND AND INTRODUCTION ........................................................................................................IX SEISMIC SURVEYS DESCRIBED ................................................................................................................IX UNDERWATER SOUND MEASUREMENTS ..................................................................................................X CHUKCHI SEA VESSEL-BASED SEISMIC MONITORING ............................................................................XI CHUKCHI SEA VESSEL-BASED SHALLOW HAZARDS AND SITE CLEARANCE MONITORING ................. XII BEAUFORT SEA VESSEL-BASED SEISMIC MONITORING....................................................................... XIII BEAUFORT SEA VESSEL-BASED SHALLOW HAZARDS AND SITE CLEARANCE MONITORING .............. XIV BEAUFORT SEA AERIAL SURVEYS......................................................................................................... XV
ACKNOWLEDGMENTS ................................................................................................................... XVII
1. BACKGROUND AND INTRODUCTION.......................................................................................1-1
INCIDENTAL HARASSMENT AUTHORIZATION .......................................................................................1-2 MITIGATION AND MONITORING OBJECTIVES ........................................................................................1-3 REPORT ORGANIZATION........................................................................................................................1-4 LITERATURE CITED................................................................................................................................1-5
2. SEISMIC SURVEYS DESCRIBED..................................................................................................2-1
CHUKCHI SEA SEISMIC SURVEYS ..........................................................................................................2-1 Operating Areas, Dates, and Navigation ..........................................................................................2-1 Airgun Description............................................................................................................................2-3
CHUKCHI SEA SHALLOW HAZARDS AND SITE CLEARANCE SURVEYS..................................................2-4 Operating Areas, Dates, and Navigation ..........................................................................................2-4 Geophysical Tools for Site Clearance...............................................................................................2-5
BEAUFORT SEA SEISMIC SURVEY..........................................................................................................2-5 Operating Areas, Dates, and Navigation ..........................................................................................2-5
BEAUFORT SEA SHALLOW HAZARDS AND SITE CLEARANCE SURVEYS ...............................................2-6 Operating Areas, Dates, and Navigation ..........................................................................................2-6 Geophysical Tools for Site Clearance...............................................................................................2-6
MARINE MAMMAL MONITORING AND MITIGATION .............................................................................2-6 Vessel based monitoring....................................................................................................................2-6 Aerial Monitoring..............................................................................................................................2-7
3. UNDERWATER SOUND MEASUREMENTS ...............................................................................3-1
INTRODUCTION ......................................................................................................................................3-1 GOALS OF MEASUREMENT PROGRAMS..................................................................................................3-1 METHODS...............................................................................................................................................3-2
Marine Mammal Hearing..................................................................................................................3-3 Data Analysis Approach....................................................................................................................3-4
PROGRAMS AND RESULTS ...................................................................................................................3-23 Seismic Survey – Kakapo Site .........................................................................................................3-23 Seismic Survey – Como Site ............................................................................................................3-45 Shallow Hazards – Camden Bay.....................................................................................................3-61 Shallow Hazards – Chukchi Sea .....................................................................................................3-70 Support Vessel Measurements – Prudhoe Bay and Barrow............................................................3-78

iv Monitoring in the Chukchi and Beaufort Seas: Shell Offshore Inc, 2008
CONCLUSIONS......................................................................................................................................3-83 Summary of Results .........................................................................................................................3-83
LITERATURE CITED..............................................................................................................................3-89
4. MONITORING, MITIGATION, AND DATA ANALYSIS METHODS .....................................4-1
MONITORING TASKS..............................................................................................................................4-1 SAFETY AND POTENTIAL DISTURBANCE RADII.....................................................................................4-1
Chukchi Sea—Gilavar.......................................................................................................................4-2 Chukchi Sea—Cape Flattery and Alpha Helix..................................................................................4-2 Beaufort Sea—Gilavar ......................................................................................................................4-3 Beaufort Sea—Henry Christoffersen.................................................................................................4-3 Beaufort Sea—Alpha Helix ...............................................................................................................4-4
MITIGATION MEASURES AS IMPLEMENTED...........................................................................................4-5 Standard Mitigation Measures..........................................................................................................4-5 Special Mitigation Measures as Required by NMFS ........................................................................4-6
VISUAL MONITORING METHODS...........................................................................................................4-6 Vessel-Based Monitoring—Chukchi and Beaufort Seas ...................................................................4-6 Aerial Surveys—Beaufort Sea ...........................................................................................................4-8
DATA ANALYSIS ....................................................................................................................................4-8 Vessel-Based Surveys ........................................................................................................................4-8
LITERATURE CITED..............................................................................................................................4-11
5. CHUKCHI SEA VESSEL-BASED SEISMIC MONITORING .....................................................5-1
MONITORING EFFORT AND MARINE MAMMAL ENCOUNTER RESULTS.................................................5-1 Cetaceans ..........................................................................................................................................5-1 Pinniped ............................................................................................................................................5-5 Pacific Walruses and Polar Bears ....................................................................................................5-8
DISTRIBUTION AND BEHAVIOR OF MARINE MAMMALS........................................................................5-9 Cetaceans ..........................................................................................................................................5-9 Seals ................................................................................................................................................5-12 Pacific Walruses..............................................................................................................................5-15
MITIGATION MEASURES IMPLEMENTED..............................................................................................5-15 ≥160 dB Zone Monitoring Results Described .................................................................................5-15
ESTIMATED NUMBER OF MARINE MAMMALS PRESENT AND POTENTIALLY AFFECTED ....................5-16 Disturbance and Safety Criteria .....................................................................................................5-16 Estimates from Direct Observations ...............................................................................................5-17
ESTIMATES EXTRAPOLATED FROM DENSITY ......................................................................................5-18 LITERATURE CITED..............................................................................................................................5-22
6. CHUKCHI SEA VESSEL-BASED SHALLOW HAZARDS AND SITE CLEARANCE MONITORING........................................................................................................................................6-1
MONITORING EFFORT AND MARINE MAMMAL ENCOUNTER RESULTS.................................................6-1 Visual Survey Effort ..........................................................................................................................6-1 Visual Sightings of Marine Mammals and Other Vessels .................................................................6-2 Cetaceans ..........................................................................................................................................6-3 Seals ..................................................................................................................................................6-4
DISTRIBUTION AND BEHAVIOR OF MARINE MAMMALS........................................................................6-5 Cetaceans ..........................................................................................................................................6-5 Seals ..................................................................................................................................................6-6 Pacific Walruses and Polar Bears ....................................................................................................6-7
MITIGATION MEASURES IMPLEMENTED................................................................................................6-8

Table of Contents v
ESTIMATED NUMBER OF MARINE MAMMALS PRESENT AND POTENTIALLY AFFECTED ......................6-8 Disturbance and Safety Criteria .......................................................................................................6-8 Estimates from Direct Observations .................................................................................................6-8 Estimates Extrapolated from Density................................................................................................6-9
LITERATURE CITED..............................................................................................................................6-12
7. BEAUFORT SEA VESSEL-BASED SEISMIC MONITORING ..................................................7-1
MONITORING EFFORT AND MARINE MAMMAL ENCOUNTER RESULTS.................................................7-1 Other Vessels.....................................................................................................................................7-1 Cetaceans ..........................................................................................................................................7-1 Pinnipeds...........................................................................................................................................7-5 Pacific Walruses and Polar Bears ....................................................................................................7-9
DISTRIBUTION AND BEHAVIOR OF MARINE MAMMALS........................................................................7-9 Cetaceans ........................................................................................................................................7-10 Seals ................................................................................................................................................7-12 Pacific Walruses and Polar Bears ..................................................................................................7-13
MITIGATION MEASURES IMPLEMENTED..............................................................................................7-14 ≥160 dB and ≥120 dB Zone Monitoring Results Described............................................................7-14
ESTIMATED NUMBER OF MARINE MAMMALS PRESENT AND POTENTIALLY AFFECTED ....................7-16 Disturbance and Safety Criteria .....................................................................................................7-16 Estimates from Direct Observations ...............................................................................................7-16 Estimates Extrapolated from Density.............................................................................................7-17
LITERATURE CITED..............................................................................................................................7-22
8. BEAUFORT SEA VESSEL-BASED SHALLOW HAZARDS AND SITE CLEARANCE MONITORING........................................................................................................................................8-1
MONITORING EFFORT AND MARINE MAMMAL ENCOUNTER RESULTS.................................................8-1 Visual Survey Effort ..........................................................................................................................8-1 Visual Sightings of Marine Mammals and Other Vessels .................................................................8-2 Cetaceans ..........................................................................................................................................8-3 Seals ..................................................................................................................................................8-4 Pacific Walrus and Polar Bears........................................................................................................8-6
DISTRIBUTION AND BEHAVIOR OF MARINE MAMMALS........................................................................8-6 Cetaceans ..........................................................................................................................................8-6 Seals ..................................................................................................................................................8-7 Pacific Walruses and Polar Bears ....................................................................................................8-9
MITIGATION MEASURES IMPLEMENTED................................................................................................8-9 ESTIMATED NUMBER OF MARINE MAMMALS PRESENT AND POTENTIALLY AFFECTED ....................8-10
Disturbance and Safety Criteria .....................................................................................................8-10 Estimates from Direct Observations ...............................................................................................8-10 Estimates Extrapolated from Density..............................................................................................8-11
LITERATURE CITED..............................................................................................................................8-14
9. BEAUFORT SEA AERIAL MARINE MAMMAL MONITORING PROGRAM ......................9-1
INTRODUCTION ......................................................................................................................................9-1 OBJECTIVES ...........................................................................................................................................9-1 METHODS...............................................................................................................................................9-2
Study Area .........................................................................................................................................9-2 Survey Procedures.............................................................................................................................9-5 Data Recording .................................................................................................................................9-5 Analyses of Aerial Survey Data.........................................................................................................9-5

vi Monitoring in the Chukchi and Beaufort Seas: Shell Offshore Inc, 2008
RESULTS ................................................................................................................................................9-8 All Surveys.........................................................................................................................................9-8 Jul–Aug Surveys in the Camden Bay Area .........................................................................................9-9 Surveys of the Harrison Bay Area ....................................................................................................9-27 Sep Surveys in the Camden Bay Area .............................................................................................9-44
DISCUSSION .........................................................................................................................................9-57 LITERATURE CITED..............................................................................................................................9-58
APPENDIX A: NATIONAL MARINE FISHERIES SERVICE IHAS APPENDIX B: U.S. FISH AND WILDLIFE SERVICE LOAS APPENDIX C: CONFLICT AVOIDANCE AGREEMENT APPENDIX D: DESCRIPTION OF VESSELS AND EQUIPMENT APPENDIX E: UNDERWATER SOUND MEASUREMENT RESULTS APPENDIX F: DETAILS OF MONITORING, MITIGATION, AND ANALYSIS METHODS APPENDIX G: BEAUFORT WIND FORCE DEFINITIONS APPENDIX H: BACKGROUND ON MARINE MAMMALS IN THE CHUKCHI AND BEAUFORT SEAS APPENDIX I: CHUKCHI SEA 3D DEEP SEISMIC SURVEY
Part 1 – Results Part 2 – English Units
APPENDIX J: CHUKCHI SEA SHALLOW HAZARD AND SITE CLEARANCE SURVEY Part 1 – Results Part 2 – English Units
APPENDIX K: BEAUFORT SEA 3D DEEP SEISMIC SURVEY Part 1 – Results Part 2 – English Units
APPENDIX L: BEAUFORT SEA SHALLOW HAZARD AND SITE CLEARANCE SURVEY Part 1 – Results Part 2 – English Units
APPENDIX M: BEAUFORT SEA AERIAL SURVEYS Part 1 – Results Part 2 – English Units
Acronyms and Abbreviations vii
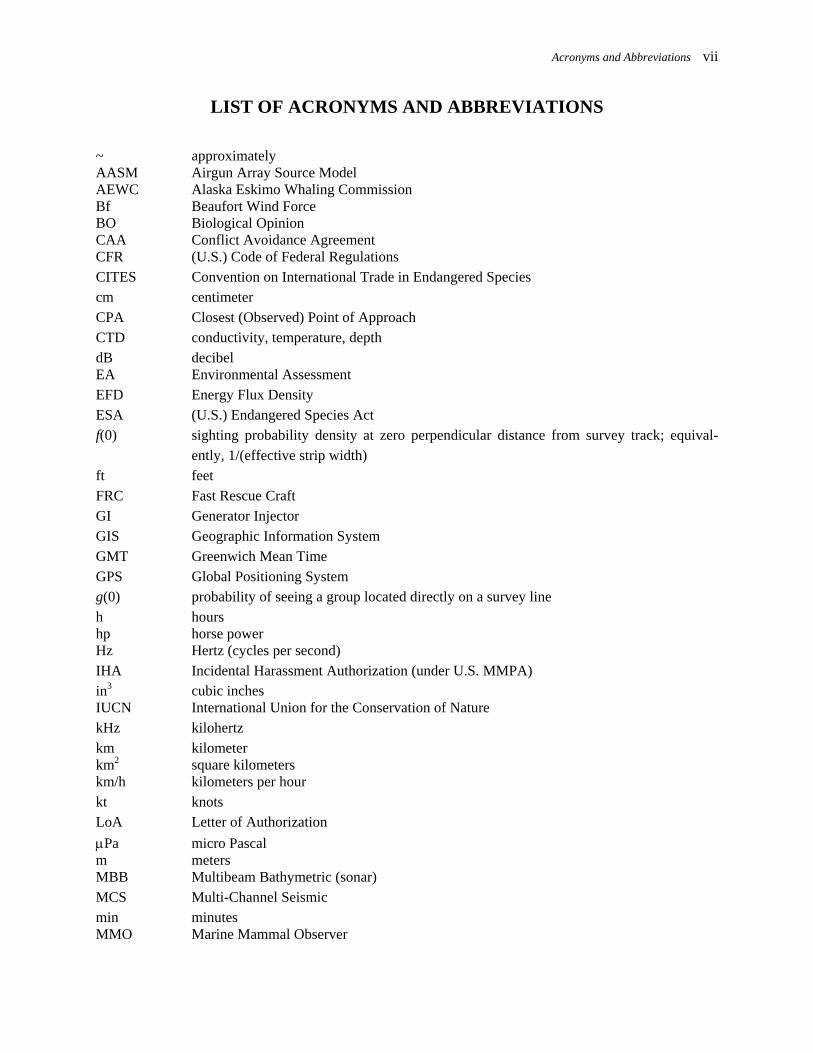
LIST OF ACRONYMS AND ABBREVIATIONS
~ approximately AASM Airgun Array Source Model AEWC Alaska Eskimo Whaling Commission Bf Beaufort Wind Force BO Biological Opinion CAA Conflict Avoidance Agreement CFR (U.S.) Code of Federal Regulations CITES Convention on International Trade in Endangered Species cm centimeter CPA Closest (Observed) Point of Approach CTD conductivity, temperature, depth dB decibel EA Environmental Assessment EFD Energy Flux Density ESA (U.S.) Endangered Species Act f(0) sighting probability density at zero perpendicular distance from survey track; equival-
ently, 1/(effective strip width) ft feet FRC Fast Rescue Craft GI Generator Injector GIS Geographic Information System GMT Greenwich Mean Time GPS Global Positioning System g(0) probability of seeing a group located directly on a survey line h hours hp horse power Hz Hertz (cycles per second) IHA Incidental Harassment Authorization (under U.S. MMPA) in3 cubic inches IUCN International Union for the Conservation of Nature kHz kilohertz km kilometer km2 square kilometers km/h kilometers per hour kt knots LoA Letter of Authorization μPa micro Pascal m meters MBB Multibeam Bathymetric (sonar) MCS Multi-Channel Seismic min minutes MMO Marine Mammal Observer

viii Monitoring in the Chukchi and Beaufort Seas: Shell Offshore Inc, 2008
MMPA (U.S.) Marine Mammal Protection Act MONM Marine Operations Noise Model n sample size n.mi. nautical miles NMFS (U.S.) National Marine Fisheries Service No. number PD Power down of the airgun array to one airgun (in this study, from an output of 3147 in3 to
30 or 155 in3 ) PE Parabolic Equation pk-pk peak-to-peak RAM Range-dependent Acoustic Model re in reference to rms root-mean-square: an average, in the present context over the duration of a sound pulse s seconds SD Shut Down of airguns not associated with mitigation s.d. standard deviation SEL Sound Exposure Level: a measure of energy content, in dB re 1 μPa2 · s SOI Shell Offshore, Inc. SPL Sound Pressure Level; the SPL for a seismic pulse is equivalent to its rms level SZ Shut Down of all airguns because of a marine mammal sighting near or within the safety
radius TTS Temporary Threshold Shift UNEP United Nations Environmental Programme

Executive Summary ix
EXECUTIVE SUMMARY
Background and Introduction Shell Offshore, Inc. (SOI) collected marine seismic data in the Chukchi and Beaufort seas during
the summer of 2008 in support of potential future oil and gas leasing and development. Deep seismic acquisition for SOI was conducted by WesternGeco using the Gilavar, a source vessel that towed an airgun array as well as hydrophone streamers to record reflected seismic data. Site clearance and shallow hazard surveys were conducted in the Beaufort Sea from the Henry Christoffersen (Henry C.) and Alpha Helix. The Alpha Helix also assisted the Cape Flattery with shallow hazards surveys in the Chukchi Sea.
Marine seismic surveys emit sounds into the water at levels that could affect marine mammal behavior and distribution, or perhaps cause temporary or permanent reduction in hearing sensitivity. These effects could constitute “taking” under the provisions of the U.S. Marine Mammal Protection Act (MMPA) and the U.S. Endangered Species Act (ESA). The National Marine Fisheries Service (NMFS) and the U.S. Fish and Wildlife Service (USFWS) share jurisdiction over the marine mammal species that were likely to be encountered during the project. SOI’s seismic surveys and other exploration activities in the Chukchi and Beaufort seas were conducted under the jurisdiction of an Incidental Harassment Authorizations (IHA) issued by NMFS and a Letter of Authorization (LoA) issued by the USFWS. The IHA and LoA included provisions to minimize the possibility that marine mammals might occur close to the seismic source and be exposed to levels of sound high enough to cause hearing damage or other injuries, and to reduce behavioral disturbances that might be considered as “take by harassment” under the MMPA.
A mitigation program was conducted to avoid or minimize potential effects of SOI’s seismic survey on marine mammals, and to ensure that SOI was in compliance with the provisions of the IHA and LoA. This required that marine mammal observers (MMOs) onboard the seismic vessels detect marine mammals within or about to enter the designated safety radii, and in such cases initiate an immediate power down (or shut down if necessary) of the airguns. Mitigation was also required for larger disturbance radii which were monitored by MMOs onboard monitoring vessels or aircraft. SOI also conducted an aerial survey program in the Beaufort Sea in support of its seismic exploration and shallow hazards surveys.
The primary objectives of the monitoring and mitigation program were to: 1. provide real-time sighting data needed to implement the mitigation requirements; 2. estimate the numbers of marine mammals potentially exposed to strong seismic pulses; and 3. determine the reactions (if any) of marine mammals potentially exposed to seismic sound
impulses. This 90-day report describes the methods and results for the monitoring work specifically required to meet the above primary objectives.
Seismic Surveys Described The Gilavar collected seismic data in the Chukchi Sea from 27 Jul through 28 Aug and entered the
Beaufort Sea on 31 Aug to collect seismic data on or near specific SOI lease holdings. Seismic activities were conducted in the Beaufort Sea from 3 Sep through 9 Oct. The Gilavar returned to the Chukchi Sea on 11 Oct and transited through the Chukchi Sea to Dutch Harbor. Five different monitoring vessels assisted the Gilavar during the 2008 open-water period. A minimum of two monitoring vessels assisted the Gilavar at all times during exploratory activities in the Chukchi and Beaufort seas in 2008.
x Monitoring in the Chukchi and Beaufort Seas: Shell Offshore Inc, 2008
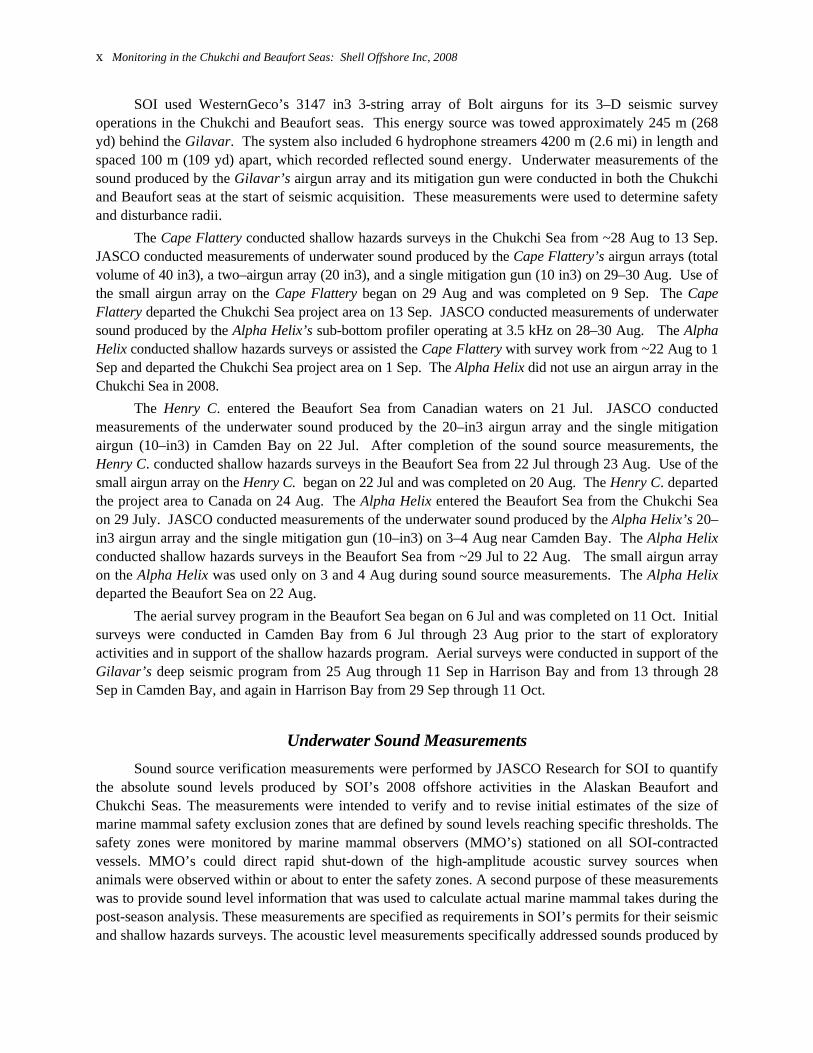
SOI used WesternGeco’s 3147 in3 3-string array of Bolt airguns for its 3–D seismic survey operations in the Chukchi and Beaufort seas. This energy source was towed approximately 245 m (268 yd) behind the Gilavar. The system also included 6 hydrophone streamers 4200 m (2.6 mi) in length and spaced 100 m (109 yd) apart, which recorded reflected sound energy. Underwater measurements of the sound produced by the Gilavar’s airgun array and its mitigation gun were conducted in both the Chukchi and Beaufort seas at the start of seismic acquisition. These measurements were used to determine safety and disturbance radii.
The Cape Flattery conducted shallow hazards surveys in the Chukchi Sea from ~28 Aug to 13 Sep. JASCO conducted measurements of underwater sound produced by the Cape Flattery’s airgun arrays (total volume of 40 in3), a two–airgun array (20 in3), and a single mitigation gun (10 in3) on 29–30 Aug. Use of the small airgun array on the Cape Flattery began on 29 Aug and was completed on 9 Sep. The Cape Flattery departed the Chukchi Sea project area on 13 Sep. JASCO conducted measurements of underwater sound produced by the Alpha Helix’s sub-bottom profiler operating at 3.5 kHz on 28–30 Aug. The Alpha Helix conducted shallow hazards surveys or assisted the Cape Flattery with survey work from ~22 Aug to 1 Sep and departed the Chukchi Sea project area on 1 Sep. The Alpha Helix did not use an airgun array in the Chukchi Sea in 2008.
The Henry C. entered the Beaufort Sea from Canadian waters on 21 Jul. JASCO conducted measurements of the underwater sound produced by the 20–in3 airgun array and the single mitigation airgun (10–in3) in Camden Bay on 22 Jul. After completion of the sound source measurements, the Henry C. conducted shallow hazards surveys in the Beaufort Sea from 22 Jul through 23 Aug. Use of the small airgun array on the Henry C. began on 22 Jul and was completed on 20 Aug. The Henry C. departed the project area to Canada on 24 Aug. The Alpha Helix entered the Beaufort Sea from the Chukchi Sea on 29 July. JASCO conducted measurements of the underwater sound produced by the Alpha Helix’s 20–in3 airgun array and the single mitigation gun (10–in3) on 3–4 Aug near Camden Bay. The Alpha Helix conducted shallow hazards surveys in the Beaufort Sea from ~29 Jul to 22 Aug. The small airgun array on the Alpha Helix was used only on 3 and 4 Aug during sound source measurements. The Alpha Helix departed the Beaufort Sea on 22 Aug.
The aerial survey program in the Beaufort Sea began on 6 Jul and was completed on 11 Oct. Initial surveys were conducted in Camden Bay from 6 Jul through 23 Aug prior to the start of exploratory activities and in support of the shallow hazards program. Aerial surveys were conducted in support of the Gilavar’s deep seismic program from 25 Aug through 11 Sep in Harrison Bay and from 13 through 28 Sep in Camden Bay, and again in Harrison Bay from 29 Sep through 11 Oct.
Underwater Sound Measurements Sound source verification measurements were performed by JASCO Research for SOI to quantify
the absolute sound levels produced by SOI’s 2008 offshore activities in the Alaskan Beaufort and Chukchi Seas. The measurements were intended to verify and to revise initial estimates of the size of marine mammal safety exclusion zones that are defined by sound levels reaching specific thresholds. The safety zones were monitored by marine mammal observers (MMO’s) stationed on all SOI-contracted vessels. MMO’s could direct rapid shut-down of the high-amplitude acoustic survey sources when animals were observed within or about to enter the safety zones. A second purpose of these measurements was to provide sound level information that was used to calculate actual marine mammal takes during the post-season analysis. These measurements are specified as requirements in SOI’s permits for their seismic and shallow hazards surveys. The acoustic level measurements specifically addressed sounds produced by

Executive Summary xi
seismic surveying, shallow hazards surveying and from operations of support vessels used to support these survey programs. All of the measurements were performed using calibrated sound recording equipment deployed on the seabed near each of the operations monitored.
Six JASCO Ocean Bottom Hydrophone (OBH) acoustic recording stations were deployed to measure sounds produced by SOI’s 3-D seismic surveys near the Kakopo prospect in the Chukchi Sea and near the Como prospect in the Beaufort Sea. Measurements of sounds produced by the Western Geco seismic vessel Gilavar and its 3147 in3 airgun array were made at distances from directly beneath the array to distances beyond 100 km (62 mi) in the endfire direction (in-line with the array tow direction) at both sites, and up to 34.9 km (21.6 mi)at Kakapo and 45.0 km (27.0 mi) at Como in the broadside (perpendicular) direction. Longer range broadside measurements could not be made because of ice presence near Kakapo and large depths beyond 50 km (31 mi) offshore at Como. The two-direction measurement approach captured directive characteristics of sound emissions from the airgun array. Distances to root-mean-square (rms) sound level thresholds in the two directions at each site were determined from the measurements and these are presented for several level thresholds between 190 dB re 1 μPa and 120 dB re 1 μPa (rms).
Similar measurement programs were performed to quantify sound level variation with distance from the shallow hazards survey sources. The source types included small airgun systems and sub-bottom profilers. Four separate surveys were monitored, including: the Camden Bay survey performed by survey vessel Henry Christoffersen, two surveys in Camden Bay and in the Chukchi Sea by the Alpha Helix, and one survey in the Chukchi Sea by the Cape Flattery. The acoustic measurements were made using two OBHs at each site deployed on the seabed nominally 100 m (330 ft) and 200 m (660 ft) to the side of a survey track lines. Distances to sound level thresholds between 190 dB re 1 μPa and 120 dB re 1 μPa (rms) were calculated and are presented here.
Vessel sound measurements were performed on all vessels contracted by Shell in 2009. In total twelve different vessels were monitored. The measurements were performed by sailing the vessels along straight-line 20 km (12.4 mi) tracks over a bottom-moored OBH. Sound pressure levels were obtained as a function of distance from each of the vessels. The distances corresponding to sound levels reaching the 120 dB re 1 μPa (rms) were tabulated for all vessels and are presented here. Separate forward and aft direction distances are given where differences were observed.
Chukchi Sea Vessel-Based Seismic Monitoring The Gilavar conducted seismic surveys in the Chukchi Sea from 18 Jul to 31 Aug 2008. Airgun
operations occurred along 2806 km (1744 mi). The full airgun array was ramping up or active along 1955 km (1215 m), and the single mitigation gun operated along 851 km (529 mi) including turns and power downs. MMOs were on watch for a total of 6952 km (4320 mi; 829 hr), of which ~175 km (108 mi; 21 hr) occurred during darkness.
Five vessels within 75 km of the Gilavar at varying times during the 2008 Chukchi Sea survey assisted with marine mammal monitoring. MMOs on three of those monitoring vessels directly assisted the Gilavar MMOs with the implementation of mitigation measures. Monitoring vessel MMOs, contributed 22,928 km (14,247 mi) of effort, 295 km (183 mi; 26 hr) of that was conducted in darkness.
In total, 283 individual marine mammals in 215 groups were observed by Gilavar and monitoring vessel MMOs. Nine marine mammal species were identified, including fin whale, gray whale, harbor porpoise, humpback whale, minke whale, ringed seal, spotted seal, bearded seal, and Pacific walrus.

xii Monitoring in the Chukchi and Beaufort Seas: Shell Offshore Inc, 2008
There was a total of 65 cetacean sightings of 108 individuals Gray whale was the most commonly identified cetacean (20 sightings of 65 individuals) followed by eight sightings of both minke whales and harbor porpoises (nine and 18 individuals, respectively). . No cetaceans were observed from the Gilavar during seismic activities. The sighting rate for cetaceans from the monitoring vessels during seismic operations was one-third the sighting rate during non-seismic periods.
MMOs recorded a total of 150 groups of 174 seals. Ringed seal was the most frequently identified seal species (57 sightings of 62 individuals). The seal sighting rate from the Gilavar during seismic operations was half the rate during non-seismic periods, yet the sighting rate of seals from the monitoring vessels was higher during seismic periods. This suggests that some seals may have avoided the operating array and dispersed into the areas near the monitoring vessels. One Pacific walrus was observed from a monitoring vessel. No polar bears were sighted during the Chukchi Sea seismic survey in 2008.
Mitigation measures were implemented five times during the 2008 Chukchi Sea survey, all for seals near the ≥190 dB safety radius (610 m or 667 yd) around the active full array (3147 in3). A power down to the single mitigation gun (30 in3) was requested in each instance. No complete airgun array shut downs were necessary in the Chukchi Sea in 2008 as a result of marine mammal proximity to relevant safety radii.
Based on direct MMO observations, no cetaceans were exposed to sound levels ≥180 dB rms. Four seals were observed within the ≥190 dB (rms) safety radius, and these four animals may have been exposed to sound levels ≥190 dB (rms). The one Pacific walrus sighting was recorded during a non-seismic period and was probably not exposed to sounds generated by the airgun array.
The number of marine mammals visually detected by MMOs likely underestimated the actual numbers that were present. Estimates of the number of marine mammals likely exposed to various sound levels were calculated based on densities of marine mammals determined from data collected by MMOs during non-seismic periods on the Gilavar and its monitoring vessels. These exposure estimates therefore assume that there was no marine mammal avoidance of the seismic activities. Based on estimates extrapolated form density calculations, 43, 21, 10, and 15 cetaceans may have been exposed to sound levels ≥160, 170, 180 and 190 rms, respectively. Similar calculations indicated that 502, 240, 120, and 58 seals may have been exposed to sound levels ≥160, 170, 180 and 190 rms, respectively. Based on density calculations, one Pacific walrus might have been exposed to sound levels ≥160 rms.
Chukchi Sea Vessel-Based Shallow Hazards and Site Clearance Monitoring The Cape Flattery entered the Chukchi Sea on 28 Aug and conducted site clearance and shallow
hazards seismic surveys on or near SOI lease blocks until it exited the survey area on 13 Sep. Cape Flattery operations were conducted along ~3180 km (~1976 mi) of trackline, ~671 km (~417 mi) of which were during seismic periods. The full airgun array (four 10–in3 airguns) was firing for ~449 km (~279 mi) and the single mitigation gun was firing for the remaining ~222 km (138 mi) of trackline. MMOs on the Cape Flattery were on watch along ~2793 km (~1735 mi) of trackline. The Alpha Helix entered the Chukchi Sea on 22 Aug and conducted surveys without using airguns, until it exited the study area on 1 Sep. However, approximately 29 km (~18 mi) of trackline were considered exposed to seismic survey activity due to the proximity of the Alpha Helix to an active seismic vessel, the Cape Flattery. Within the Chukchi Sea, the Alpha Helix traveled along ~2623 km (~1630 mi) of trackline and MMOs were on watch during a total of ~2075 km (~1289 mi) of trackline
In total, 200 individual marine mammals were recorded in 128 groups during the Chukchi Sea shallow hazards seismic survey from the two vessels. Five marine mammal species were indentified,

Executive Summary xiii
including bowhead whale, gray whale, ringed seal, bearded seal, and Pacific walrus. No polar bears were recorded from the Cape Flattery or Alpha Helix in the Chukchi Sea in 2008 MMOs aboard the Cape Flattery recorded two cetacean sightings, one gray whale and one harbor porpoise. MMOs aboard the Alpha Helix recorded 23 cetaceans in 11 groups, all of which were either bowhead or gray whales. Cetacean sighting rates were greater during non-seismic than seismic periods for both the Cape Flattery and Alpha Helix, but the data during seismic periods were insufficient to make meaningful comparisons of cetacean sighting rates as a function of seismic state.
MMOs aboard the Cape Flattery recorded 12 seals in 12 groups, most of which were ringed seals. MMOs aboard the Alpha Helix recorded 105 seals in 92 groups, most of which were unidentified seals. Eleven Pacific walrus sightings were also recorded from the Alpha Helix in the Chukchi Sea in 2008. Seal sighting rates where greater during non-seismic than seismic periods for both the Cape Flattery and Alpha Helix, but the data during seismic periods were insufficient to make meaningful comparisons of seal sighting rates as a function of seismic state.
No power downs or shut-downs of the airguns were necessary or requested by the Cape Flattery MMOs due to the detection of a marine mammal within the ≥180 and ≥190 dB safety radii. Based on direct observations from the Cape Flattery, no marine mammals were recorded within the ≥180 or ≥190 dB rms safety radii while the airguns were firing and were likely exposed to sound levels ≥180 or ≥190 dB rms. The number of marine mammals visually detected by MMOs likely underestimated the actual numbers that were present. Maximum estimates of the number of marine mammals potentially exposed to various sound levels were calculated based on densities of marine mammals determined from data collected by MMOs during non-seismic periods on the Cape Flattery. These exposure estimates assumed that there was no marine mammal avoidance of the seismic activities. Based on estimates extrapolated from density calculations from the Cape Flattery, one cetacean may have been exposed to sounds at each of the following levels: ≥160, 170, 180, and 190 dB rms. Similar calculations indicated that 9, 5, 2, and 1 seals may have been exposed to sound levels ≥160, 170, 180, and 190 dB rms, respectively from Cape Flattery airgun activity.
Beaufort Sea Vessel-Based Seismic Monitoring The Gilavar conducted seismic surveys in the Beaufort Sea between 31 Aug and 10 Oct on or near
specific SOI lease holdings in Harrison and Camden bays. Gilavar operations were conducted along 8238 km (5119 mi) of trackline, 3720 km (2312 mi) of which occurred during ramp up or while the full airgun array was firing. The single mitigation gun was firing along 2146 km (1333 mi) of trackline. MMOs on the Gilavar were on watch along 6723 km (4177 mi) of trackline, ~1906 km (1184 mi) of which occurred during periods of darkness. The Gilavar was routinely accompanied by three vessels that served as platforms for additional marine mammal monitoring and in support of potential mitigation requirements. Monitoring vessel activity within 75 km (46 mi) of the Gilavar occurred along a total of 28,365 km (17,625 mi) of trackline. Monitoring vessel MMOs were on watch for a total of 18,404 km (11,436 mi), 97% of which occurred during daylight hours.
In total, 1191 individual marine mammals in 978 groups were observed by Gilavar and monitoring-vessel MMOs during the Beaufort Sea seismic survey. Five marine mammal species were identified, including bowhead whale, ringed seal, spotted seal, bearded seal, and Pacific walrus.

xiv Monitoring in the Chukchi and Beaufort Seas: Shell Offshore Inc, 2008
MMOs recorded 67 cetaceans in 38 groups, most of which were bowhead whales or unidentified mysticete whales recorded from monitoring vessels. Cetacean sighting rates were greater during non-seismic than seismic periods from both the Gilavar and the monitoring vessels.
MMOs recorded 1123 seals in 939 groups, most of which were ringed or unidentified seals observed from monitoring vessels. Pinniped sighting rates were greater during seismic than non-seismic periods from both the Gilavar and the monitoring vessels. Only one walrus sighting was recorded from the Gilavar or its monitoring vessels in the Beaufort Sea in 2008. No polar bears were recorded from either vessel type in the Beaufort Sea in 2008.
Gilavar MMOs requested 44 power downs of the airguns due to sightings of marine mammals within or approaching the pertinent ≥180 or ≥190 dB (rms) safety radius of the full airgun array. Over half of the 44 power downs were for ringed seals, and 41 of the 44 were for pinnipeds. Of the 44 power downs, 11 occurred during ramp ups of the airgun array (airgun volume between 30 and 3147 in3), and the other 33 occurred while the airguns were firing at full array volume (3147 in3).
Based on direct observations, only one cetacean, an unidentified mysticete whale, was recorded within the ≥180 dB rms safety radius while the airguns were firing and was likely exposed to sound levels ≥180 dB rms. In total, 34 seal sightings (35 individuals) were recorded within the ≥190 dB safety radius, and these 35 individuals may have been exposed to sound levels ≥190 dB rms.
The number of marine mammals visually detected by MMOs likely underestimated the actual numbers that were present. Maximum estimates of the number of marine mammals likely exposed to various sound levels were calculated based on densities of marine mammals determined from data collected by MMOs during non-seismic periods on the Gilavar and monitoring vessels. These exposure estimates therefore assume that there was no marine mammal avoidance of the seismic activities. Based on estimates extrapolated from density calculations, 119, 69, 41 and 26 cetaceans may have been exposed to sound levels ≥160, 170, 180, and 190 dB rms, respectively. Similar calculations indicated that 2156, 1251, 748, and 475 seals may have been exposed to sound levels ≥160, 170, 180, and 190 dB rms, respectively.
Beaufort Sea Vessel-Based Shallow Hazards and Site Clearance Monitoring The Henry C. entered the Alaskan Beaufort Sea on 21 Jul and conducted site clearance and shallow
hazards seismic surveys on or near SOI lease blocks in the Beaufort Sea until it returned to Canadian waters on 24 Aug. Henry C. operations were conducted along ~4599 km (~2858 mi) of trackline, ~1362 km (~846 mi) of which were during seismic periods. This seismic effort included periods of seismic acquisition and periods during which only the mitigation gun was firing (during turns, power downs, and ramp ups). MMOs on the Henry C. were on watch along ~4183 km (~2599 mi) of trackline.
The Alpha Helix entered the Beaufort Sea from the Chukchi Sea on 29 Jul and conducted surveys until it departed on 22 Aug. Within the Beaufort Sea, the Alpha Helix traveled along ~4016 km (~2495 mi) of trackline. Shallow hazards seismic survey activities were conducted along ~96 km (~60 mi) of that trackline. The full airgun array (two 10–in3 airguns) was firing for roughly one-half (~49 km, ~30 mi) of the seismic effort and the single mitigation airgun was firing for the remaining ~47 km (~29 mi). Approximately 234 km (~152 mi) of additional observer effort were considered exposed to seismic survey activity due to the Alpha Helix’s proximity to an active seismic vessel, the Henry C. Alpha Helix MMOs were on watch during a total of ~3803 km (~2363 mi) of trackline.
In total, 436 individual marine mammals were seen in 325 groups during the Beaufort Sea shallow hazards survey from the two vessels. Seven marine mammal species were identified, including beluga

Executive Summary xv
whale, bowhead whale, gray whale, ringed seal, spotted seal, bearded seal, and polar bear. No Pacific walruses were recorded from the Henry C. or Alpha Helix in the Beaufort Sea in 2008 MMOs aboard the Henry C. recorded 12 cetaceans in nine groups, most of which were bowhead whales. MMOs aboard the Alpha Helix recorded nine cetaceans in eight groups, all of which were either bowhead or gray whales. Cetacean sighting rates were greater during non-seismic than seismic periods from both the Henry C. and Alpha Helix. However, there was only a statistically significant difference in sighting rates between seismic and non-seismic periods for the Henry C. (χ2 = 4.083, df = 1, p = 0.043).
MMOs aboard the Henry C. recorded 190 seals in 149 groups, most of which were ringed seals. MMOs aboard the Alpha Helix recorded 202 seals in 153 groups, most of which were unidentified seals. The seal sighting rate from the Henry C. during seismic periods was ~42% of the rate during non-seismic periods suggesting possible localized avoidance of seismic survey activities by seals. Seal sighting rates from the Alpha Helix were also lower during seismic than non-seismic periods, but the limited amount of seismic data were insufficient to make meaningful comparisons of seal sighting rates as a function of seismic. Six polar bear sightings were also recorded from the Alpha Helix in the Beaufort Sea in 2008.
No power downs or shut-downs of the airguns were necessary or requested by the Henry C. MMOs due to the detection of a marine mammal within the ≥180 and ≥190 dB safety radii. The 23 seal sightings during seismic activity were outside the ≥190 db safety radius. All other sightings occurred during non-seismic periods. One shut down of the airguns was requested by the Alpha Helix MMOs due to a polar bear approaching the ≥190 dB (rms) safety radius of the full airgun array. No power downs or shut downs of Alpha Helix the airguns were necessary or requested for cetaceans or seals. Based on direct observations from the Henry C. and Alpha Helix, no marine mammals were recorded within the ≥180 or ≥190 dB rms safety radii while the airguns were firing and none were likely exposed to sound levels ≥180 or ≥190 dB rms. The number of marine mammals visually detected by MMOs likely underestimated the actual numbers that were present. Maximum estimates of the number of marine mammals potentially exposed to various sound levels were calculated based on densities of marine mammals determined from data collected by MMOs during non-seismic periods on the Henry C. and Alpha Helix. These exposure estimates therefore assume that there was no marine mammal avoidance of the seismic activities. Based on estimates extrapolated from density calculations from the Henry C and Alpha Helix, one cetacean may have been exposed to sounds at each of the following levels for each vessel: ≥160, 170, 180, and 190 dB rms. Similar calculations indicated that 194, 86, 27, and 9 seals may have been exposed to sound levels ≥160, 170, 180, and 190 dB rms, respectively from the combined Henry C. and Alpha Helix shallow hazards seismic activity.
Beaufort Sea Aerial Surveys An aerial marine mammal monitoring program was conducted in the central Alaskan Beaufort Sea
from 6 Jul to 11 Oct 2008 in support of SOI’s seismic exploration activities. Surveys were flown to obtain detailed data on the occurrence, distribution, and movements of marine mammals, particularly bowhead whales. Aerial surveys were also designed to monitor the ≥120 dB re 1 ųPa (rms) radius for cow/calf pairs with the intent of minimizing exposure of these animals to seismic sounds. If four or more cow/calf pairs were sighted within the ≥120 rms radius, the IHA required that seismic operations be shut down until less than four cow/calf pairs were observed on subsequent surveys. An additional goal of the aerial monitoring program was to report any aggregations of 12 or more baleen whales within the ≥160

xvi Monitoring in the Chukchi and Beaufort Seas: Shell Offshore Inc, 2008
dB re 1 ųPa (rms) radius during seismic activities. Sightings that could potentially have required mitigation were radioed directly to the Gilavar. In general, patterns of bowhead whale distribution, activity and headings in the Harrison Bay and Camden Bay survey areas in 2008 were similar to those seen in numerous previous studies, reflecting well–documented differences in seasonal use of the Alaskan Beaufort Sea by bowhead whales. Bowhead whales observed during the fall migration in the Harrison and Camden Bay survey areas tended to be less than 50 km (31 mi) from shore, mostly in waters 20–35 m (66-115 ft) deep and were observed to be traveling or feeding while moving westward. Peak sighting rates occurred in mid-Sep (13–19 Sep) within the Camden Bay area and a few days later (23–25 Sep) in the Harrison Bay area. In contrast, sightings made during Jul–Aug surveys of the Camden Bay area indicated that whales were further offshore (60–65 km; 37–40 mi) in waters approximately 66 m (217 ft) deep and traveling eastward at a moderate pace. Bowhead sighting rates during seismic and non-seismic periods were difficult to compare because survey effort was low, particularly for non-seismic states. With the limited data available, seismic activity did not appear to affect bowhead whale sighting rates in Jul–Aug surveys of the Camden Bay or Harrison Bay areas. Sighting rates for Sep surveys of the Camden Bay area were higher during non-seismic than seismic periods, though this result should be interpreted with caution because effort during non-seismic periods was extremely low, limited to a single day of surveys. Average bowhead distance from the center of the seismic survey area was lower during non-seismic periods than during seismic periods in the Harrison Bay survey area, suggesting a potentially localized deflection away from seismic. Average distance from the center of the seismic survey area during seismic activity was also higher compared to non-seismic periods for Sep surveys of the Camden Bay. Non-seismic observations in Sep surveys of the Camden Bay area, however, may have been biased, as poor weather conditions during the single non-seismic survey forced effort to be concentrated on areas near the seismic prospect. No comparison of bowhead distribution relative to seismic operations could be made for Jul-Aug surveys in the Camden Bay area, as only one sighting was recorded during seismic activities. A different approach to assessing potential deflection of migrating whales due to seismic activities was to compare sighting rate distributions offshore with respect to areas east, west and immediately adjacent to the seismic survey area. When assessed this way, offshore distributions of sighting rates did not differ in areas to the west, east or immediately adjacent to seismic survey activity in either the Camden or Harrison bay survey areas, indicating that if deflection did occur it was apparently localized and not persistent. Overall trends in beluga whale activity, speed, distance from shore, and sighting rates were also consistent with previous studies. Beluga sighting rates were highest in early Jul and late Sep and the majority of migrating belugas appeared to pass north of our survey area, with peak sighting rates near the shelf break along the northern boundary of our survey area. Beluga activities consisted primarily of traveling at slow to moderate speeds or resting. These data are consistent with prior research indicating that belugas spend the majority of their time in the Beaufort Sea along the shelf break or far offshore during spring and fall migrations. No mitigation was required as a result of observations made during aerial surveys. On 18-19 Sep, however, two cow/calf pairs were sighted south of on-going seismic activity. Though not required, SOI decided to move operations farther north to avoid potential impacts. In addition, aerial surveyors radioed the vessel on several occasions to inform them of the location and headings of bowhead whales near the seismic survey area.

Acknowledgments xvii
ACKNOWLEDGMENTS
We thank the captains and crews of the Gilavar, Henry Christoffersen, Cape Flattery, Alpha Helix, Gulf Provider, Theresa Marie, Torsvik, Norseman II, Arctic Seal, Maxime, and Point Barrow for their support during this project. Additionally, we appreciate the help of John Davis and his team at WesternGeco and Todd Kelsey and his team at Geo LLC. We thank the pilots and crew from Bald Mountain Scientific for their help with the aerial survey program. We also thank representatives of the National Marine Fisheries Service, U.S. Fish & Wildlife Service, North Slope Borough Department of Wildlife Management, Alaska Eskimo Whaling Commission and Minerals Management Service for their advice and comments during the “open-water meetings” convened by NMFS in April 2007 and at various other times. Michael Macrander, Ian Voparil, Bob Rosenbladt, Dan Taylor, Vladimir Nechayuk, Jonathan Smith, Susan Childs, Rick Fox, Darrin Lawless, Ben Vandorn, John Maketa, Aaron Merritt, Rebecca Mosquera, Michael Sotak, and Kathleen Hook provided valuable support prior to and during the field season.
We also thank all of the marine mammal observers (MMOs)—biologists and Inupiat—who participated in the project. They were essential to the completion and success of this endeavor:
Billy Adams Brandon Griffin John (Clif) PassmoreHerbert Adams Rebekah Gueco Hugh Patkotak Jr.Jesse Agee Beth Haley Heather PattersonBryan Ahkiviana Kelsey Hall Dolly PattersonTerry Arndt Suzie Hanlan Hazel PebleySara Ashworth Kris Hartin Kristie PlyerClayborne Aveoganna Carolyn Hernandez Renee RamirezLeonard Barger Darren Ireland Craig ReiserJoe Beland Meaghan Jankowski Gerald RexfordBrad Bodfish Forrest Kanayurak Bob RodriguesRonald Brower Bill Koski Dorcus RockErin Burch Jonah Leavitt Leanna RussellTim Burris William Leavitt Sr. Danielle SavareseSarah Case Kathleen Leonard Jenell SchwabKatie Christie Keri Lestyk Melodie SharonShari Coleman Robert Long Helen SimmondsLeslie Curran Courtney Lyons Joseph SolomonKatrina Edwardson Nicole Magyar Maria SolomonClara Ekak Leon Matumeak Sarah StelterElias Elias Sunny Moore Robert SuvluLaura Evans Raymond Nevoganna Herbert TagarookAlicia Ferreras Johnny Ningeok Stephanie ThibideauRoy File Brian O'Donell Tannis ThomasAmelia Fort Charlie Okakok Rex TuzroylukKim Fuchs Andrew Olson Christopher Vincent Patuk Glenn Steve Olson Callie WilderJuan Gracia Robert Pardue Earl (Scotty) Wood


Chapter 1: Background and Introduction 1-1
1. BACKGROUND AND INTRODUCTION1
Shell Offshore, Inc. (SOI) collected marine seismic data in the Chukchi and Beaufort seas during the open–water period of 2008 in support of potential future oil and gas exploration and development. Deep seismic acquisition for SOI was conducted in the Chukchi and Beaufort seas by WesternGeco using the M/V Gilavar, a seismic vessel that towed an airgun array as well as hydrophone streamers to record seismic data. In addition to deep seismic activities, SOI also conducted shallow hazards, ice gouge, and strudel scour survey activities in the Beaufort Sea from the M/V Henry Christoffersen (Henry C.) and the R/V Alpha Helix. After completing shallow hazards surveys in the Beaufort Sea, the Alpha Helix assisted the R/V Cape Flattery with shallow hazards surveys in the Chukchi Sea.
Marine seismic surveys emit sound energy into the water (Greene and Richardson 1988; Tolstoy et al. 2004a,b) and have the potential to affect marine mammals given the reported auditory and behavioral sensitivity of many such species to underwater sounds (Richardson et al. 1995; Gordon et al. 2004). The effects could consist of behavioral or distributional changes, and perhaps (for animals close to the sound source) temporary or permanent reduction in hearing sensitivity. Either behavioral/distributional effects or auditory effects (if they occur) could constitute “taking” under the provisions of the U.S. Marine Mam-mal Protection Act (MMPA) and the U.S. Endangered Species Act (ESA), at least if the effects are considered to be “biologically significant.”
Numerous species of cetaceans and pinnipeds inhabit parts of the Chukchi and Beaufort seas. The National Marine Fisheries Service (NMFS) and the U.S. Fish and Wildlife Service (USFWS) share jurisdiction over the marine mammal species that could be encountered during the project. Three species under NMFS jurisdiction that are listed as “Endangered” under the ESA, including bowhead whale (Balaena mysticetus), humpback whale (Megaptera novaeangliae), and perhaps fin whale (Balaenoptera physalus), do or may occur in portions of the survey area. Additionally, NMFS initiated a status review to determine if listing as endangered or threatened under the ESA is warranted for four other species including ringed seal (Phoca fasciata), spotted seal (P. largha), bearded seal (Erignathus barbatus), and ribbon seal (Histriophoca fasciata; NMFS 2008a,c). The USFWS manages two marine mammal species occurring in the Chukchi and Beaufort seas, the Pacific walrus (Odobenus rosmarus) and polar bear (Ursus maritimus). The polar bear was recently listed as threatened under the ESA (USFWS 2008) and a petition to list Pacific walrus as threatened or endangered was recently submitted to USFWS (CBD 2008).
NMFS issued an Incidental Harassment Authorization (IHA) to SOI in 2007 to authorize non–lethal “takes” of marine mammals incidental to SOI’s planned 3D seismic and shallow hazards survey operations in the Chukchi and Beaufort seas during the 2007 open–water season that was valid through 1 Aug 2008 (Appendix A). Pursuant to Section 101(a)(5)(D) of the MMPA, SOI requested that NMFS issue a similar IHA for the 2008 open–water season (SOI 2007). A notice announcing SOI’s request for an IHA was published in the Federal Register on 25 Jun 2008 and public comments were invited (NMFS 2008b). On 19 Jun 2008 (prior to the publication of the notice) SOI requested an extension of the existing IHA from NMFS which was to expire on 1 Aug. In a letter to SOI on 26 Jun, NMFS amended the IHA by extending the period of validity through 19 Aug 2008. A new IHA allowing 3D seismic activities, and site clearance and shallow hazards surveys in the Chukchi and Beaufort seas was issued to SOI by NMFS on 19 Aug 2008 (Appendix A). The IHA authorized “potential take by harassment” of various cetacean and seal species during the marine geophysical cruises described in this report. This authorization was valid from 20 Aug 2008 through 19 Aug 2009, or until a new IHA might be issued to SOI.
1 By Robert Rodrigues, Beth Haley, and Darren Ireland (LGL).

1-2 Monitoring in the Chukchi and Beaufort Seas: Shell Offshore Inc, 2008
On 20 Nov 2007, SOI requested a Letter of Authorization (LoA) from the USFWS for the incidental “take” of polar bears in relation to SOI’s proposed open–water exploration program in the Beaufort Sea in 2008. On 15 Apr 2008, SOI made a similar request to the USFWS for a LoA to authorize potential “taking” of polar bears and walrus during open–water exploration activities in the Chukchi Sea in 2008. The USFWS issued a LoA to SOI to “take” small numbers of polar bears and Pacific walruses incidental to activities occurring during the 2008 Beaufort and Chukchi sea open–water exploration programs. The LoA was issued on 7 Jul 2008 and was valid to 30 Nov 2008 (Appendix B).
This document serves to meet reporting requirements specified in the IHA and LoA. The primary purposes of this report are to describe project activities in the Chukchi and Beaufort seas, to describe the associated marine mammal monitoring and mitigation programs and their results, and to estimate the numbers of marine mammals potentially exposed to levels of sound generated by the survey activities at or above presumed effect levels.
Incidental Harassment Authorization IHAs issued to seismic operators include provisions to minimize the possibility that marine mam-
mals close to the seismic source might be exposed to levels of sound high enough to cause short or long–term hearing loss or other physiological injury. During this project, sounds were generated by the Gilavar’s airgun array during the seismic activities, and by small airgun arrays on the Cape Flattery, Alpha Helix, and Henry C. The Cape Flattery, Alpha Helix, and Henry C. also operated several types of lower–energy sound sources that included bottom mapping and seafloor imaging sonars, sub–bottom profilers, chirp sonars, and bubble pulsers. Given the nature of the operations and mitigation measures, no serious injuries or deaths of marine mammals were anticipated from the deep seismic and shallow hazards surveys. No such injuries or deaths were attributed to these activities. Nonetheless, the seismic survey operations described in Chapter 2 had the potential to “take” marine mammals by harassment. Behavioral disturbance to marine mammals is considered to be “take by harassment” under the provisions of the MMPA.
Under current NMFS guidelines (e.g., NMFS 2008b), “safety radii” for marine mammals around airgun arrays are customarily defined as the distances within which received pulsed sound levels are ≥180 dB re 1 µPa (rms)2 for cetaceans and ≥190 dB re 1 μPa (rms) for pinnipeds. Those safety radii are based on an assumption that seismic pulses at lower received levels will not injure these mammals or impair their hearing abilities, but that higher received levels might have some such effects. The mitigation measures required by IHAs are, in large part, designed to avoid or minimize the numbers of cetaceans and pinnipeds exposed to sound levels exceeding 180 and 190 dB (rms), respectively.
2 “rms” means “root mean square”, and represents a form of average across the duration of the sound pulse as
received by the animal. Received levels of airgun pulses measured on an “rms” basis (sometimes described as Sound Pressure Level, SPL) are generally 10–12 dB lower than those measured on the “zero–to–peak” basis, and 16–18 dB lower than those measured on a “peak–to–peak” basis (Greene 1997; McCauley et al. 1998, 2000a,b). The latter two measures are the ones commonly used by geophysicists. Unless otherwise noted, all airgun pulse levels quoted in this report are rms levels. Received levels of pulsed sounds can also be described on an energy or “Sound Exposure Level” basis, for which the units are dB re (1 μPa)2 · s. The SEL value for a given airgun pulse, in those units, is typically 10–15 dB less than the rms level for the same pulse (Greene 1997; McCauley et al. 1998, 2000a,b), with considerable variability (Madsen et al. 2006; see also Chapter 3 of this report). SEL (energy) measures may be more relevant to marine mammals than are rms values (Southall et al. 2008), but the current regulatory requirements are based on rms values.

Chapter 1: Background and Introduction 1-3
Disturbance to marine mammals could occur at distances beyond safety (shut down) radii if the mammals were exposed to moderately strong pulsed sounds generated by the airguns or perhaps by sonar (Richardson et al. 1995). NMFS assumes that marine mammals exposed to airgun sounds with received levels ≥160 dB re 1 μPa (rms) are likely to be disturbed. That assumption is based mainly on data concerning behavioral responses of baleen whales, as summarized by Richardson et al. (1995) and Gordon et al. (2004). Dolphins and pinnipeds are generally less responsive than baleen whales (e.g., Stone 2003; Gordon et al. 2004), and 170 dB (rms) may be a more appropriate criterion of potential behavioral disturbance for those groups (LGL Ltd. 2005a,b). In general, disturbance effects are expected to depend on the species of marine mammal, the activity of the animal at the time of exposure, distance from the sound source, the received level of the sound and the associated water depth. Some individuals may exhibit behavioral responses at received levels somewhat below the nominal 160 or 170 dB (rms) criteria, but others may tolerate levels somewhat above 160 or 170 dB without reacting in any substantial manner. For example, migrating bowhead whales in the Alaskan Beaufort Sea have shown avoidance at received levels substantially lower than 160 dB re 1 μPa rms (Miller et al. 1999; Richardson et al. 1999). However, recently acquired acoustic evidence suggests that some whales may not react as much or in the same manner as suggested by those earlier studies (Blackwell et al. 2008). Beluga whales may, at times, also show avoidance at received levels below 160 dB (Miller et al. 2005). In contrast, bowhead whales on the summer feeding grounds tolerate received levels of 160 dB or sometimes more without showing significant avoidance behavior (Richardson et al. 1986; Miller et al. 2005; Lyons et al. 2008).
The IHA issued by NMFS to SOI authorized incidental harassment “takes” of three ESA–listed species including bowhead, humpback, and fin whales, as well as several non–listed species including gray whale (Eschrichtius robustus), Minke whale (Balaenoptera acutorostrata), killer whale (Orcincus orca), beluga whale (Delphinapterus leucas), harbor porpoise (Phocoena phocoena), and ringed, spotted, bearded, and ribbon seals.
NMFS granted the IHA to SOI on the assumptions that • the numbers of whales and seals potentially harassed (as defined by NMFS criteria) during seis-
mic operations would be “small”, • the effects of such harassment on marine mammal populations would be negligible, • no marine mammals would be seriously injured or killed, • there would be no unmitigated adverse effects on the availability of marine mammals for sub-
sistence hunting in Alaska, and • the agreed upon monitoring and mitigation measures would be implemented.
The LoA issued to SOI by USFWS required SOI to observe a 190 dB safety radius for polar bears and a 180 dB safety radius for walruses. The 180 dB safety zone for walruses in 2008 was also applied to SOI’s exploratory activities in 2007, and was more conservative than the 190 dB zone required in 2006.
Mitigation and Monitoring Objectives The objectives of the mitigation and monitoring program were described in detail in SOI’s IHA
application (SOI 2007) and in the IHA issued by NMFS to SOI (Appendix A). Explanatory material about the monitoring and mitigation requirements was published by NMFS in the Federal Register (NMFS 2008b).
The primary objectives of the monitoring program were to • provide real–time sighting data needed to implement the mitigation requirements;

1-4 Monitoring in the Chukchi and Beaufort Seas: Shell Offshore Inc, 2008
• estimate the numbers of marine mammals potentially exposed to strong seismic pulses; and • determine the reactions (if any) of marine mammals potentially exposed to seismic sound
impulses. Specific mitigation and monitoring objectives and requirements identified in the IHA and LoA are described in appendices A and B. Mitigation and monitoring measures that were implemented during the activities in the Chukchi and Beaufort seas are described in detail in Chapter 4.
The purpose of the mitigation program was to avoid or minimize potential effects of SOI’s seismic survey on marine mammals and subsistence hunting. This required that shipboard personnel detect marine mammals within or about to enter the designated safety radii (190 dB for pinnipeds and 180 dB for cetaceans), and in such cases initiate an immediate power down (or shut down if necessary) of the airguns. A power down involves reducing the source level of the operating airguns, in this case by reducing the number of airguns firing. A shut down involves temporarily terminating the operation of all airguns. Additionally, the safety radii were monitored in good visibility conditions for 30 minutes prior to starting the first airgun and during the ramp up procedure to ensure that marine mammals were not near the airguns when operations began (see Appendix A and Chapter 4). The location and timing of survey activities was planned in coordination with representatives of the North Slope communities in order to avoid adverse impacts to subsistence harvest of marine mammals and other resources. In 2008 mitigation at the 160 dB isopleth was also required, as specified in the IHA issued by NMFS, for an aggregation of 12 or more non–migratory mysticete whales. This area was monitored by vessels that accompanied the seismic vessel or by aerial surveys. Power down of the seismic airgun array was required if an aggregation of 12 or more non–migratory mysticete whales was detected ahead of, or perpendicular to, the seismic vessel track and within the 160 dB isopleth. Aerial monitoring of the 120 dB isopleth around the seismic vessel(s) was also required after 1 Sep in the Beaufort Sea. A Power down was required if four bowhead cow/calf pairs were detected within the 120 dB isopleths during aerial surveys.
Report Organization This 90–day report describes the methods and results for the mitigation and monitoring work
specifically required to meet the above objectives as required by the IHA and LoA (Appendices A and B). Various other marine mammal and acoustic monitoring and research programs not specifically related to the above objectives were also implemented by SOI in the Chukchi and Beaufort seas during 2008. Results of those additional efforts will be reported at a later date.
This report includes nine chapters: 1. background and introduction (this chapter); 2. description of SOI’s seismic and site clearance studies; 3. acoustic sound source measurements during the field season; 4. description of the marine mammal monitoring and mitigation requirements and methods,
including safety radii; 5. results of the deep seismic marine mammal monitoring program in the Chukchi Sea; 6. results of the shallow hazards and site clearance marine mammal monitoring for the shallow
hazards survey program in the Chukchi Sea; 7. results of the deep seismic marine mammal monitoring program in the Beaufort Sea; 8. results of the shallow hazards and site clearance marine mammal monitoring program in the
Beaufort Sea; and

Chapter 1: Background and Introduction 1-5
9. results of the aerial monitoring program for deep seismic and shallow hazards survey programs in the Beaufort Sea.
In addition, there are 14 appendices that provide copies of relevant documents and details of procedures that are more–or–less consistent during seismic surveys where marine mammal monitoring and mitigation measures are in place. These procedural details are only summarized in the main body of this report. The appendices include
A. copies of the IHAs issued by NMFS in 2007 and 2008 to SOI for this study; B. copies of the Chukchi and Beaufort sea LoAs issued by USFWS to SOI for this study; C. a copy of the Conflict Avoidance Agreement between SOI, the Alaska Eskimo Whaling
Commission, and the Whaling Captains Associations; D. descriptions of vessels and equipment; E. English unit tables from acoustic results in Chapter 3; F. details of monitoring, mitigation, and analysis methods; G. Beaufort wind force definitions; H. background on marine mammals in the Chukchi and Beaufort seas; I. marine mammal monitoring results during the Chukchi Sea 3D seismic survey; J. marine mammal monitoring results during the Chukchi Sea shallow hazards and site clearance
surveys; K. marine mammal monitoring results during the Beaufort Sea 3D seismic survey; L. marine mammal monitoring results during the Beaufort Sea shallow hazards and site clearance
surveys; M. marine mammal monitoring results during aerial surveys of the Beaufort Sea; N. list of all marine mammal detections.
Literature Cited Blackwell, S.B., C.R. Greene, Jr., T.L. McDonald, M.W. McLennan, C.S. Nations, R.G. Norman, and A. Thode.
2008. Beaufort Sea acoustic monitoring program. Chapter 8 In Funk, D.W., R. Rodrigues, D.S. Ireland, and W.R. Koski (eds.). Joint monitoring program in the Chukchi and Beaufort seas, July–November 2007. LGL Alaska Report P971-2. Report from LGL Alaska Research Associates, Inc., Anchorage, Ak, LGL Ltd., environmental research associates, King City, Ont., JASCO Research, Victoria, B.C., and Greeneridge Sciences, Inc., Goleta, CA, for Shell Offshore, Inc., ConocoPhillips Alaska, Inc., and National Marine Fisheries Service, and U.S. Fish and Wildlife Service.
CBD. 2008. Petition to list the Pacific walrus (Odobenus rosmaurs divergens) as a threatened or endangered species under the Endangered Species Act. Center for Biological Diversity, San Francisco, CA.
Gordon, J., D. Gillespie, J. Potter, A. Frantzis, M.P. Simmonds, R. Swift and D. Thompson. 2004. A review of the effects of seismic surveys on marine mammals. Mar. Technol. Soc. J. 37(4):16–34.
Greene, C.R., Jr. 1997. Physical acoustics measurements. (Chap. 3, 63 p.) In: W.J. Richardson (ed.), 1997. North-star Marine Mammal Marine Monitoring Program, 1996. Marine mammal and acoustical monitoring of a seismic program in the Alaskan Beaufort Sea. Rep. TA2121–2. Rep. from LGL Ltd., King City, Ont., and Greeneridge Sciences Inc., Santa Barbara, CA, for BP Explor. (Alaska) Inc., Anchorage, AK, and U.S. Nat. Mar. Fish. Serv., Anchorage, AK, and Silver Spring, MD. 245 p.

1-6 Monitoring in the Chukchi and Beaufort Seas: Shell Offshore Inc, 2008
Greene, C.R., Jr. and W.J. Richardson. 1988. Characteristics of marine seismic survey sounds in the Beaufort Sea. J. Acoust. Soc. Am. 83(6):2246–2254.
LGL Ltd. 2005a. Request by the University of Alaska Fairbanks for an Incidental Harassment Authorization to allow the incidental take of marine mammals during a marine geophysical survey across the Arctic Ocean, August–September 2005. LGL Rep. TA4122–2. Rep. from LGL Alaska Res. Assoc. Inc., Anchorage, AK, for Univ. Alaska Fairbanks, Fairbanks, AK, and Nat. Mar. Fish. Serv., Silver Spring, MD. 84 p
LGL Ltd. 2005b. Environmental assessment of a marine geophysical survey across the Arctic Ocean, August–September 2005. LGL Rep. TA4122–1. Rep. from LGL Alaska Res. Assoc. Inc., Anchorage, AK, for Univ. Alaska Fairbanks, Fairbanks, AK, and Nat. Sci. Found., Arlington, VA. 98 p.
Lyons, C., W. Koski, and D. Ireland. 2008. Chapter 7 In Funk, D.W., R. Rodrigues, D.S. Ireland, and W.R. Koski (eds.). Joint monitoring program in the Chukchi and Beaufort seas, July–November 2007. LGL Alaska Report P971–2. Report from LGL Alaska Research Associates, Inc., Anchorage, Ak, LGL Ltd., environmental research associates, King City, Ont., JASCO Research, Victoria, B.C., and Greeneridge Sciences, Inc., Goleta, CA, for Shell Offshore, Inc., ConocoPhillips Alaska, Inc., and National Marine Fisheries Service, and U.S. Fish and Wildlife Service.
Madsen, P.T., M. Johnson, P.J.O. Miller, N. Aguilar Soto, J. Lynch and P. Tyack. 2006. Quantitative measures of air–gun pulses recorded on sperm whales (Physeter macrocephalus) using acoustic tags during controlled exposure experiments. J. Acoust. Soc. Am. 120(4):2366–2379.
McCauley, R.D., M.–N. Jenner, C. Jenner, K.A. McCabe and J. Murdoch. 1998. The response of humpback whales (Megaptera novangliae) to offshore seismic survey noise: preliminary results of observations about a work-ing seismic vessel and experimental exposures. APPEA (Austral. Petrol. Product. Explor. Assoc.) Journal 38:692–707.
McCauley, R.D., J. Fewtrell, A.J. Duncan, C. Jenner, M.–N. Jenner, J.D. Penrose, R.I.T. Prince, A. Adhitya, J. Murdoch, and K. McCabe. 2000a. Marine seismic surveys: Analysis of airgun signals; and effects of air gun exposure on humpback whales, sea turtles, fishes and squid. Rep. from Centre for Marine Science and Technology, Curtin Univ., Perth, W.A., for Austral. Petrol. Prod. Assoc., Sydney, N.S.W. 188 p.
McCauley, R.D., J. Fewtrell, A.J. Duncan, C. Jenner, M.–N. Jenner, J.D. Penrose, R.I.T. Prince, A. Adhitya, J. Murdoch and K. McCabe. 2000b. Marine seismic surveys – a study of environmental implications. APPEA J. 40:692–706.
Miller, G.W., R.E. Elliott, W.R. Koski, V.D. Moulton and W.J. Richardson. 1999. Whales. p. 5–1 to 5–109 In: W.J. Richardson (ed.), Marine mammal and acoustical monitoring of Western Geophysical’s open–water seismic program in the Alaskan Beaufort Sea, 1998. LGL Rep. TA2230–3. Rep. from LGL Ltd., King City, Ont., and Greeneridge Sciences Inc., Santa Barbara, CA, for Western Geophysical, Houston, TX and U.S. Nat. Mar. Fish. Serv., Anchorage, AK, and Silver Spring, MD. 390 p.
Miller, G.W., V.D. Moulton, R.A. Davis, M. Holst, P. Millman, A. MacGillivray and D. Hannay. 2005. Monitoring seismic effects on marine mammals–southeastern Beaufort Sea, 2001–2002. p. 511–542 In: S.L. Arms-worthy, P.J. Cranford and K. Lee (eds.), Offshore oil and gas environmental effects monitoring/Approaches and technologies. Battelle Press, Columbus, OH.
NMFS. 2008a. Endangered and threatened wildlife; notice of 90–day finding on a petition to list the ribbon seal as a threatened or endangered species. Fed. Resist. 73(61, 28 March):16617–16619.
NMFS. 2008b. Taking marine mammals incidental to specific activities; seismic surveys in the Beaufort and Chukchi seas. Fed. Regist. 73(123, 25 June):36044–36062.
NMFS. 2008c. Endangered and threatened wildlife; notice of 90–day finding on a petition to list three ice seal species as a threatened or endangered species. Fed. Resist. 73(172, 4 September):51615–51617.
Richardson, W.J., B. Würsig and C.R. Greene Jr. 1986. Reactions of bowhead whales, Balaena mysticetus, to seismic exploration in the Canadian Beaufort Sea. J. Acoust. Soc. Am. 79(4):1117–1128.
Chapter 1: Background and Introduction 1-7
Richardson, W.J., C.R. Greene, Jr., C.I. Malme and D.H. Thomson. 1995. Marine Mammals and Noise. Academic Press, San Diego. 576 p.
Richardson, W.J., G.W. Miller and C.R. Greene Jr. 1999. Displacement of migrating bowhead whales by sounds from seismic surveys in shallow waters of the Beaufort Sea. J. Acoust. Soc. Am. 106(4, Pt. 2):2281.
SOI. 2007. Application for Incidental Harassment Authorization for the Non–Lethal Taking of Whales and Seals in Conjunction with a Proposed Open Water Seismic and Marine Survey Program in the Chukchi and Beaufort Seas, Alaska, During 2008–2009. Prepared by ASRC Energy Services, and LGL Alaska Research Associates, Inc., Anchorage, AK, for Shell Exploration and Production Company and Nat. Mar. Fish. Serv.
Southall, B.L., A.E. Bowles, W.T. Ellison, J.J. Finneran, R.L. Gentry, C.R. Greene, Jr., D. Kastak, D.R. Ketten, J.H. Miller, P.E. Nachtigall, W.J. Richardson, J.A. Thomas, and P.L. Tyack. 2008. Marine mammals noise exposure criteria: initial scientific recommendations. Aquatic Mammals 33(4):411–497 + appendices.
Stone, C.J. 2003. The effects of seismic activity on marine mammals in UK waters 1998–2000. JNCC Rep. 323. Joint Nature Conserv. Commit., Aberdeen, Scotland. 43 p.
Tolstoy, M., J. Diebold, S. Webb, D. Bohnenstiehl and E. Chapp. 2004a. Acoustic calibration measurements. Chap. 3 In: W.J. Richardson (ed.), Marine mammal and acoustic monitoring during Lamont–Doherty Earth Observatory's acoustic calibration study in the northern Gulf of Mexico, 2003. Revised ed. Rep. from LGL Ltd., King City, Ont., for Lamont–Doherty Earth Observ., Palisades, NY, and Nat. Mar. Fish. Serv., Silver Spring, MD. (Advance copy).
Tolstoy, M., J.B. Diebold, S.C. Webb, D.R. Bohenstiehl, E. Chapp, R.C. Holmes and M. Rawson. 2004b. Broad-band calibration of R/V Ewing seismic sources. Geophys. Res. Lett. 31: L14310.
USFWS. 2008. Endangered and threatened wildlife and plants; determination of threatened status for the polar bear (Urus maritimus) throughout its range. Fed. Regist. 73(95, 15 May):28212–28302.


Chapter 2: Seismic Surveys Described 2-1
2. SEISMIC SURVEYS DESCRIBED3
Marine mammal monitoring was conducted from nine vessels operated by SOI in the Chukchi and Beaufort seas in 2008 in support of deep seismic exploration and shallow hazards and site clearance surveys (Table 2.1). The seismic source vessel (Gilavar) was the primary exploration vessel and used a 24-airgun array for seismic acquisition. Shallow hazards vessels also operated smaller arrays comprised of two to four airguns as well as various types of low-energy acoustic sources. Most vessels operated in both the Chukchi and Beaufort seas. The Henry Christoffersen (Henry C.), however, operated only in the Beaufort Sea, and the Cape Flattery and Arctic Seal operated only in the Chukchi Sea. Seismic surveys and marine mammal monitoring are described below for the Chukchi Sea followed by a section describing similar activities in the Beaufort Sea.
Chukchi Sea Seismic Surveys The M/V Gilavar was used as the source vessel during SOI’s 3D seismic exploration activities in
the Chukchi Sea in 2008. Several other vessels including the M/V Gulf Provider, M/V Torsvik, and M/V Theresa Marie were the primary monitoring vessels associated with the Gilavar. Two other vessels, the R/V Norseman II and M/V Arctic Seal, conducted scientific and other activities in the Chukchi Sea not directly associated with the Gilavar’s seismic survey operations. The results of the marine mammal monitoring program were based on observations of marine mammal observers (MMOs) on the Gilavar, and MMOs on the various monitoring vessels for periods during which the monitoring vessels operated within 75 km (47 mi) of the Gilavar. Appendix D contains a description of the vessels used during SOI’s seismic exploration activities in the Chukchi and Beaufort seas in 2008.
All vessels operated in accordance with the provisions of the IHA issued by NMFS (Appendix A) and the LoA issued by the USFWS (Appendix B), as well as a Conflict Avoidance Agreement (CAA) between the seismic industry, the Alaska Eskimo Whaling Commission (AEWC), and the Whaling Captains Associations from Barrow, Nuiqsut, Kaktovik, Wainwright, Pt. Lay, and Pt. Hope (Appendix C). The CAA provided mitigation guidelines, including avoidance, to be followed by SOI while working in or transiting through the vicinity of active subsistence hunts. In particular, it addressed bowhead and beluga whale hunts and interactions with whaling crews, but was not limited to whaling activities. Under the terms of the CAA, communication centers (Com Centers) were established at Barrow, Wainwright, Point Hope, Deadhorse, and Kaktovik. The CAA outlined a communication program and specified locations and times when seismic surveys could be conducted to avoid conflict with the subsistence hunts. Operating Areas, Dates, and Navigation
The geographic region where the deep seismic survey occurred was in or near specific SOI lease holdings in the Chukchi Sea Planning Area designated as Oil and Gas Lease Sale 193 (see Fig. 2.1). Seismic acquisition occurred in the Chukchi Sea well offshore (>97 km or 60 mi) from the Alaska coast in OCS waters averaging greater than 40 meters (m) or 131 ft deep and outside the polynya zone.
3 By Robert Rodrigues, Beth Haley, and Darren Ireland (LGL).

2-2 Monitoring in the Chukchi and Beaufort Seas: Shell Offshore Inc, 2008
Table 2.1. Vessels operated by SOI in the Chukchi and Beaufort seas in support of seismic exploration activities during 2008.
Vessel Activity Chukchi Sea Beaufort SeaGilavar Seismic source vessel X XHenry Christoffersen Shallow hazards and site clearance surveys XAlpha Helix Shallow hazards and site clearance surveys X XCape Flattery Shallow hazards and site clearance surveys XGulf Provider Monitoring vessel X XTorsvik Monitoring vessel X XTheresa Marie Monitoring vessel X XNorseman II Support/Monitoring vessel X XArctic Seal Support/Monitoring vessel X XMaxime Support vessel X X
The Gilavar left Dutch Harbor on 12 Jul and entered the Chukchi Sea project area (the area north
of Point Hope, 68.34ºN latitude) on 18 Jul. SOI’s seismic contractor deployed the seismic acquisition equipment and measurements of the underwater sound produced by the airgun array were conducted by JASCO on 27–28 Jul during ~8 hr of seismic shooting at a location off Pt. Lay (see Chapter 3 for a complete description of the sound source measurements and analysis). JASCO calculated preliminary disturbance and safety radii within 5 days of completion of the measurements. These radii were the basis for implementation of mitigation by MMOs during seismic survey activities.
The Gilavar collected seismic data in the Chukchi Sea from 27 Jul–28 Aug and entered the Beaufort Sea on 31 Aug to collect seismic data on specific SOI lease holdings. The Gilavar returned to the Chukchi Sea on 10 Oct and transited through the project area. No seismic survey activities were conducted in the fall in the Chukchi Sea and the Gilavar departed the project area on 14 Oct arriving in Dutch Harbor on 17 Oct. SOI completed ~1457 km (905 mi) of seismic data acquisition in the Chukchi Sea in 2008.
On each seismic line the airguns were firing for a period of time during ramp up, and during “lead in” periods before the beginning of seismic data acquisition at the start of each seismic line. The airguns were also firing during “lead out” periods after completion of each seismic line, before the full array was powered down to a single gun for transit to the next survey line. The Gilavar’s airguns were operated along 2806 km (1744 mi) of trackline in the Chukchi Sea in 2008. Periods of full array firing plus periods of lead in, lead out, and ramp up occurred along 1955 km (1215 mi) of trackline. The single mitigation gun operated along 851 km (529 mi) of trackline.
Throughout the survey the Gilavar’s position, speed, and water depth were logged digitally every ~60 s. In addition, the position of the Gilavar, water depth, and information on the airgun array were logged for every airgun shot while the Gilavar was on a seismic line and collecting geophysical data. The geophysics crew kept an electronic log of events, as did the marine mammal observers (MMOs) while on duty. The MMOs also recorded the number and volume of airguns that were firing when the Gilavar was offline (e.g., prior to shooting at full volume) or was online but not recording data (e.g., during airgun or computer problems).

Chapter 2: Seismic Surveys Described 2-3
FIGURE 2.1. Location of SOI’s deep seismic and shallow hazards surveys in the MMS Chukchi Sea Lease Sale 193 in 2008.
Airgun Description
The seismic source used by SOI and WesternGeco consisted of a pair of 3147 in3 three-string arrays of Bolt airguns towed approximately 276 m behind the Gilavar for its 3–D seismic survey operations. These were the same arrays used during the 2006 and 2007 seismic surveys. The arrays were fired alternately on consecutive shots. Each array was comprised of three identically-tuned Bolt airgun sub-arrays, each with eight airguns and a total volume of 1049 in3, operated at an air pressure of 2000 psi. Individual airguns in the sub-arrays ranged in volume from 30 to 235 in3 and included two 235-in3 and two 125-in3 airguns in two-gun clusters. A 30 in3 airgun was used as a mitigation source during power downs when marine mammals were observed within or about to enter the applicable full array safety radius and during turns. Each string was 15 m (16 yd) in length, and was 8 m (8.7 yd) from the adjacent string(s). The airgun arrays were towed at a depth of 6 or 6.5 m (19.7 or 21.3 ft). The system also included four to six hydrophone streamers with hydrophones distributed over a length of 4200 m (4593 yd) and spaced 100 m apart, that recorded reflected sound energy. Air compressors aboard the Gilavar were the source of high pressure air used to operate the airgun arrays. Seismic pulses were emitted at intervals of 25 m (27 yd; ~12 sec) while the Gilavar traveled at a speed of 4 to 5 knots (7.4–9.3 km/h, 4.6–5.8 mi/h). In general, the Gilavar towed this system along a predetermined survey track, although adjustments were occasionally made during the field season to avoid obstacles or during repairs to the equipment. Characteristics of the airgun arrays are detailed in Appendix D.

2-4 Monitoring in the Chukchi and Beaufort Seas: Shell Offshore Inc, 2008
Chukchi Sea Shallow Hazards and Site Clearance Surveys In addition to deep seismic surveys, SOI also conducted site clearance and shallow hazards surveys of
potential exploratory drilling locations within SOI’s lease areas in the Chukchi Sea as required by MMS regulations. Before drilling can begin, a site clearance survey and analysis is necessary to identify and/or evaluate potentially hazardous or otherwise sensitive conditions and sites at or below the seafloor that could affect the safety or appropriateness of operations. Examples of such conditions include subsurface faults, fault scarps, shallow gas, steep-walled canyons and slopes, buried channels, current scour, migrating sedimentary bedforms, ice gouging, permafrost, gas hydrates, unstable sediment conditions, pipelines, anchors, ordnance, shipwrecks, or other geophysical or man-made features.
Offshore site clearance surveys use various geophysical methods and tools to acquire graphic records of seafloor and sub-seafloor geologic conditions. The data acquired and the types of investigations outlined below are performed routinely prior to exploratory drilling and construction of production facilities in marine areas, and for submarine pipelines, port facilities, and other offshore projects. High-resolution geophysical data such as two-dimensional, high-resolution multi-channel seismic, medium penetration seismic, subbottom profiler, side scan sonar, multibeam bathymetry, magnetometer, and possibly piston core sediment sampling are typical types of data acquired. These data are interpreted to define geologic, geotechnical and archeological conditions at the site and to assess the potential engineering significance of these conditions. The following section provides a brief description of the operations and instrumentation used during SOI’s 2008 site clearance program in the Chukchi Sea insofar as they may impact marine mammals. Operating Areas, Dates, and Navigation
SOI used the R/V Cape Flattery and the R/V Alpha Helix to conduct shallow hazards and site clearance surveys in the Chukchi Sea in 2008. The Cape Flattery left Dutch Harbor on 24 Aug and entered the project area on 28 Aug. JASCO conducted measurements of underwater sound produced by the Cape Flattery’s four–airgun array (total volume of 40 in3), a two–airgun array (20 in3), and a single mitigation gun (10 in3) on 29–30 Aug (Chapter 3). JASCO also conducted measurements of underwater sound produced by high resolution geophysical tools including a sub-bottom profiler and a bubble pulser, as well as measurements of underwater sound produced by the vessel itself (see Chapter 3). The Cape Flattery conducted shallow hazards surveys from ~28 Aug to 13 Sep. Use of the small airgun array on the Cape Flattery began on 29 Aug and was completed on 9 Sep. The Cape Flattery departed the Chukchi Sea project area on 13 Sep and arrived in Dutch Harbor on 24 Sep.
The Alpha Helix departed Dutch Harbor on 16 Jul and passed through the Chukchi Sea project area on 28–29 Jul enroute to the Beaufort Sea. The Alpha Helix returned from the Beaufort Sea and entered the Chukchi Sea on 22 Aug. JASCO conducted measurements of underwater sound produced by the Alpha Helix’s sub-bottom profiler operating at 3.5 kHz and of sound produced by the vessel itself on 28–30 Aug (see Chapter 3). The Alpha Helix did not use an airgun array in the Chukchi Sea in 2008. The Alpha Helix conducted shallow hazards surveys or assisted the Cape Flattery with survey work from ~22 Aug to 1 Sep and departed the Chukchi Sea project area on 1 Sep arriving in Dutch Harbor on 7 Sep.
Throughout the Cape Flattery and Alpha Helix surveys, position, speed, and water depth were logged digitally every ~60 s. In addition, the position of the two vessels, water depth, and information on the output of the airgun array were logged during all site clearance activities. The geophysics crew kept an electronic log of events, as did the marine mammal observers (MMOs) while they were on duty.

Chapter 2: Seismic Surveys Described 2-5
Geophysical Tools for Site Clearance Geophysical equipment on the Cape Flattery included a small airgun array comprised of four 10–
in3 airguns (40–in3 array). The Cape Flattery also had low–energy acoustic sources including a 3.5 kHz sub–bottom profiler and a 400 Hz bubble pulser. The Alpha Helix did not operate an airgun while in the Chukchi Sea and the only acoustic source (other than high-frequency sonars) was a 3.5 kHz sub–bottom profiler. Characteristics of this equipment are described in more detail in Appendix D.
Beaufort Sea Seismic Survey
Operating Areas, Dates, and Navigation The Gilavar entered the Beaufort Sea from the Chukchi Sea on 31 Aug to collect further seismic
exploration data on and near SOI lease holdings (Fig. 2.2). JASCO measured the underwater sound produced by the Gilivar’s airgun array and mitigation gun during ~8 hr of seismic shooting on 5–6 Sep in Harrison Bay (see Chapter 3). The Gilavar collected seismic survey data in the Beaufort Sea from 3 Sep–9 Oct. Seismic acquisition began in Harrison Bay where the Gilavar remained during the blackout period for the Cross Island whaling season. After the whaling season the Gilavar moved into Camden Bay for several weeks before returning to Harrison Bay to complete seismic data acquisition for 2008. The Gilavar reentered the Chukchi Sea on 11 Oct and transited to Dutch Harbor. SOI completed ~2441 km (1517 mi) of seismic data acquisition in the Beaufort Sea in 2008. The Gilavar’s airguns were operated along 5866 km (3645 mi) of trackline in the Beaufort Sea in 2008. Periods of full array firing plus periods of lead in, lead out, and ramp up occurred along 3720 km (2312 mi) of trackline. The single mitigation gun operated along 2146 km (1333 mi) of trackline.
FIGURE 2.2. Location of SOI’s deep seismic and shallow hazards surveys in the Beaufort Sea in 2008.

2-6 Monitoring in the Chukchi and Beaufort Seas: Shell Offshore Inc, 2008
Beaufort Sea Shallow Hazards and Site Clearance Surveys
Operating Areas, Dates, and Navigation In addition to shallow hazards and site clearance surveys in the Chukchi Sea, SOI also conducted
similar surveys in the Beaufort Sea in 2008. The site clearance occurred on and near SOI lease blocks in western Camden Bay. Two vessels were used to conduct Beaufort Sea shallow hazards surveys, including the Henry C. and Alpha Helix. Low–energy geophysical survey sources which were employed to measure bathymetry, topography, geohazards, and other seabed characteristics. The strongest sound sources resulted from use of small 20–in3 airgun arrays on the Henry C. and Alpha Helix.
The Henry C. entered the Beaufort Sea from Canadian waters on 21 Jul. JASCO conducted measurements of the underwater sound produced from the 20–in3 airgun array, the single mitigation airgun (10–in3), sub-bottom profilers, and from the vessel itself in Camden Bay on 22 Jul. After completion of the sound source measurements, the Henry C. conducted shallow hazards surveys in the Beaufort Sea from 22 Jul through 23 Aug. Use of the small airgun array on the Henry C. began on 2 Jul and was completed on 20 Aug. The Henry C. departed the project area to Canada on 24 Aug.
The Alpha Helix entered the Beaufort Sea from the Chukchi Sea on 29 July. JASCO conducted measurements of the underwater sound produced from the Alpha Helix’s 20–in3 airgun array, the single mitigation gun (10–in3), a sub-bottom profiler, and from the vessel itself on 3–4 Aug near Camden Bay (Chapter 3). The Alpha Helix conducted shallow hazards surveys in the Beaufort Sea from ~29 Jul to 22 Aug. The small airgun array on the Alpha Helix was used only on 3 and 4 Aug during sound source measurements. The Alpha Helix departed the Beaufort Sea on 22 Aug.
Throughout the Henry C. and Alpha Helix surveys, position, speed, and water depth were logged digitally every ~60 s. In addition, the position of the two vessels, water depth, and information on the output of the airgun array were logged during all site clearance activities. The geophysics crew kept an electronic log of events, as did the marine mammal observers (MMOs) while they were on duty. Geophysical Tools for Site Clearance
Geophysical equipment on the Henry C. and Alpha Helix included small airgun arrays comprised of two 10–in3 airguns which were used during site clearance operations to locate potential hazards, such as gas deposits, at relatively shallow locations. Other lower–energy acoustic sources on the Henry C. were operated for shallow-penetration sub–bottom surveys and to map the seafloor. These included a Datasonics SPR–1200 Bubble Pulser (400 Hz) medium penetration sub-bottom profiler and a Strata Box (3.5 kHz) single-frequency sub-bottom profiler. The only acoustic source on the Alpha Helix (other than high-frequency sonars) was a 3.5 kHz sub–bottom profiler. Characteristics of this equipment are described in more detail in Appendix D.
Marine Mammal Monitoring and Mitigation
Vessel based monitoring Vessel–based marine mammal monitoring and mitigation was conducted from the Gilavar and its
associated monitoring vessels, and from the Henry C., Alpha Helix, and Cape Flattery throughout the seismic operations in the Chukchi and Beaufort seas. Chapter 4 provides a detailed description of the methods and equipment used for monitoring and mitigation during the deep seismic and shallow hazards surveys, as well as the data analysis methodology. Results of the vessel–based monitoring program are presented in Chapters 5–8.

Chapter 2: Seismic Surveys Described 2-7
Aerial Monitoring SOI conducted aerial surveys in support of the Gilavar’s 3D seismic activities and shallow hazards
surveys from the Henry C. and Alpha Helix in the Beaufort Sea. A series of north–south transect lines was established to monitor the areas where SOI planned to conduct seismic exploration and shallow hazard and site clearance surveys. The aerial surveys were conducted using a Twin Otter fixed-wing aircraft flown at 1000 ft above ground level at airspeed of approximately 120 knots. The aerial survey equipment, methods and the monitoring results are presented in Chapter 9.
The aerial survey program in the Beaufort Sea began on 6 Jul and was completed on 11 Oct (Chapter 9). Initial surveys were conducted in Camden Bay from 6 Jul through 23 Aug prior to the start of exploratory activities and in support of the shallow hazards program. Aerial surveys were conducted in support of the Gilavar’s deep seismic program from 25 Aug through 11 Sep in Harrison Bay and from 13 through 28 Sep in Camden Bay, and again in Harrison Bay from 29 Sep through 11 Oct.


Chapter 3: Underwater Sound Measurements 3-1
3. UNDERWATER SOUND MEASUREMENTS4
Introduction This chapter presents the results of field measurements of the sound levels generated by several of
SOI’s 2008 offshore activities. Specifically the measurements addressed sounds produced by seismic surveying and shallow hazards surveying, and from operations of support vessels used to support the survey programs. The measurements were conducted at several locations in the Alaskan Beaufort and Chukchi seas in late July through September 2008. All of the measurements were performed by JASCO Research, working under contract to SOI, using calibrated sound recording equipment that was deployed on the seabed near each of the operations monitored. A total of nine separate field measurement studies were carried out to measure sounds produced by two 3-D seismic surveys (one each in the Chukchi and Beaufort Seas), two shallow hazards surveys in the Chukchi and one in the Beaufort, and vessel sounds from twelve different vessels used for surveying and research programs. The vessel measurements were made near their respective work locations. Field reports that presented basic sound level as a function of distance from each sound source measured were prepared and submitted within 5 days of the respective measurements. Those results were also used to define the marine mammal safety radii implemented by marine mammal observers for the seismic survey operations.
The present Chapter summarizes the sound level measurement results from the above-mentioned programs and discusses more detailed analyses performed after the field reports were prepared. In some cases the sound level versus distance values are not the same as presented in field reports. All differences are due to the fits of smooth transmission loss curves to field data; in some cases the fitting functions were revised post-field to better represent the observed trends. Additional post-field analysis included more detailed examination of the received seismic pulse characteristics, including a spectral analyses. Specifically we considered the pulse durations that strongly influence root-mean-square (rms) sound levels, plotted 1/3-octave band received levels versus distance, and we computed M-Weighted cumulative SEL levels from the data of both 3-D seismic programs monitored. These additional analyses provide useful information for characterizing the seismic sources and ocean environments in terms of sound production and sound propagation support. For example, the 1/3-octave band frequency analysis showed that seismic survey pulse sounds received at distances beyond 10 km (6.2 mi) in the shallow (approximately 20 m, or 66 ft) water depths at the Como site in the Beaufort Sea were composed of primarily high-frequency energy above 200 Hz that is less important for seismic survey imaging. If methods for reducing those high frequency broadcast levels could be developed then reductions of the seismic sound footprint may be possible with no or marginal impact on the quality of seismic data.
Goals of measurement Programs The goals of the sound level measurement programs were first to verify and refine the sizes of
marine mammal exclusion safety zones that are defined by rms sound levels near the seismic and shallow hazards survey airgun sources. The verification measurements were a requirement of SOI’s IHA. The safety zones for marine mammals were defined based on the distance from the airgun array that sound levels reach 190 decibels (dB) and 180 dB referenced to 1 microPascal (μPa) rms broadband for pinnipeds, and 180 dB re 1 μPa rms for cetaceans. Level B harassment zones for bowhead cow-calf pairs were similarly dependent on the 160 dB and 120 dB re 1 μPa rms thresholds. The distances to these thresholds can be dependent on direction relative to the airgun array tow direction, so the measurements
4 David Hannay and Graham Warner

3-2 Monitoring in the Chukchi & Beaufort Seas: Shell Offshore, 2008
had to determine the range dependence of sound levels separately in the broadside (perpendicular to the airgun array) and endfire (in-line with the array) directions. A final goal of the sound level measurement programs was to quantify sound levels as a function of distance from all of the vessels working to support SOI activities.
While the exclusion zone sizes were defined solely upon the distances to rms thresholds as discussed above, recent literature has suggested that sound exposure level (SEL) may be a more relevant acoustic metric upon which to define these zones, (Southall et al., 2007). We have included an additional goal, that is beyond the scope of the permitting requirements, to compute M-weighted cumulative SEL for all seismic pulses received from single seismic survey lines at fixed locations to the sides of the lines. This is to give information relevant for decisions about implementing SEL-based safety criteria.
Methods Calibrated Ocean Bottom Hydrohpone (OBH) recording systems were deployed from support
vessels in advance of the arrivals of the sources measured. The OBHs incorporated Reson reference hydrohpones that were calibrated using a G.R.A.S. Pistonphone calibrator. Two hydrophone models with different sensitivities were normally used: TC4043 (nominal sensitivity -201 dB re V/µPa), and TC4032 (nominal sensitivity -166 dB re V/µPa). The calibration sensitivities of the individual hydrophones calculated by the Pistonphone were used for all analysis rather than nominal values stated here. The use of hydrophones with different sensitivities allowed accurate capture of the wide range of sound pressure variation experienced as the sources moved from, in some cases, more than 100 km (62 mi) to less than 500 m (0.31 mi) from the measurement locations. Digital recordings were obtained with calibrated Sound Devices model 722 24-bit audio hard-drive recorders set to a sampling rate of 48 kHz.
Figure 1. An OBH system being deployed.

Chapter 3: Underwater Sound Measurements 3-3
Marine Mammal Hearing Marine mammal hearing sensitivity varies with frequency. Audiograms represent the threshold of
hearing as a function of frequency. Audiograms for marine mammals are characterized by relatively lower sensitivity (higher threshold values) at very low and very high frequencies. The specific frequencies of highest sensitivity and the frequencies at which sensitivity falls off are dependent on species. Audiograms have been measured for several species of pinnipeds, and for a limited number of odontocetes. No direct measurements of audiograms for mysticetes have been made to date.
The potential for seismic survey noise to impact marine species is highly dependent on how well the species can hear the sounds produced (Ireland et al. 2007a). Noises are less likely to disturb animals if they are at frequencies that the animal cannot hear well. An exception to this is when the noise pressure is so high that it can cause physical injury, whether temporary or permanent. For non-injurious sound levels, frequency weighting curves based on audiograms may be applied to adjust the importance of sound levels at particular frequencies in a manner reflective of the receiver’s sensitivity to those frequencies (Nedwell et al. 1998).
A NMFS-sponsored Noise Criteria Committee has proposed standard frequency weighting curves — referred to as M-weighting filters — for use with marine mammal species (Gentry et al. 2004). M-weighting filters are band-pass filter networks that are designed to reduce the importance of inaudible or less-audible frequencies for five broad classes of marine mammals:
1. Low frequency cetaceans (LFC), 2. Mid-frequency cetaceans (MFC), 3. High-frequency cetaceans (HFC), 4. Pinnipeds in water (PINN), and 5. Pinnipeds in air. The amount of discount applied by M-weighting filters for less-audible frequencies is not as great
as would be indicated by the corresponding audiograms for these groups of species. The rationale for applying a smaller discount than would be suggested by the audiogram is in part due to a characteristic of human hearing that perceived equal loudness curves increasingly have less rapid roll-off outside the most sensitive hearing frequency range as sound levels increase. This is the reason that C-weighting curves for humans, used for assessing very loud sounds such as blasts, are flatter than A-weighting curves used for quiet to mid-level sounds. Additionally, out-of-band frequencies, though less audible, can still cause physical injury (either temporary or permanent) if pressure levels are very high. The M-weighting filters therefore are designed for use for primarily high sound level impacts such as temporary or permanent hearing threshold shifts. The use of M-weighting should therefore be considered conservative (in the sense of overestimating the potential for impact) when applied to lower level impacts such as onset of behavioral change impacts. Figure 2 shows the decibel frequency response of the four standard underwater M-weighting filters.

3-4 Monitoring in the Chukchi & Beaufort Seas: Shell Offshore, 2008
Figure 2. M-weighting curves for four species groups.
These filters have unity gain (0 dB) through the pass band and high and low frequency roll off at approximately –12 dB per octave. The amplitude response of the M-weighting filters is defined in the frequency domain by the following function:
( )⎥⎥⎦
⎤
⎢⎢⎣
⎡⎟⎟⎠
⎞⎜⎜⎝
⎛+⎟⎟
⎠
⎞⎜⎜⎝
⎛+−= 2
2
2
2
10 11log20hi
lo
ff
ff
fG Equation (1)
The roll off and pass band of these filters are controlled by the two parameters flo and fhi; the parameter values that are used for the four different standard M-weighing curves are given in
Table 1.
Table 1. Low frequency and high frequency cutoff parameters for standard marine mammal M-weighting curves.
M-weighting filter flo (Hz) fhi (Hz) Low frequency cetaceans (LFC) 7 22000 Mid-frequency cetaceans (MFC) 150 160000 High-frequency cetaceans (HFC) 200 180000
Pinnipeds underwater (PINN) 75 75000
Data Analysis Approach Per-shot Seismic Pulse Levels
The recorded acoustic data from the airgun array and impulsive shallow hazards survey sources were analyzed in a consistent way to compute peak (zero-to-peak) pressure, rms pressure and SEL acoustic levels versus distance from the sources. The data processing steps were as follows:
1. Apply hydrophone sensitivity, analogue circuits frequency response, and digital conversion gain to digital recording units to convert to micropascals (µPa).

Chapter 3: Underwater Sound Measurements 3-5
2. Determine start times of impulsive pressure signals in digital recordings. 3. Determine the maximum sound pressure level for each pulse in dB re 1 µPa. 4. Compute cumulative square pressure functions through the duration of each pulse. 5. Determine the interval over which the cumulative square pressure for each received pulse
increases from 5% to 95% of the total. 6. For each pulse, compute the standard 90% rms level by dividing the cumulative square
pressure over the 5% to 95% interval by the number of samples in this period, and taking the square root.
Peak and 90% rms sound pressure levels (SPL) and SEL for each impulsive source shot were computed for each OBH system and these three metrics were plotted against the corresponding source-receiver ranges. The endfire measurement plots for seismic measurements include more data than the broadside plots because the latter show data points only corresponding to the times that the seismic vessel was at closest point of approach (CPA), which is when the OBH was directly to the side of the airgun array. Only a few points near each CPA are plotted to capture the directivity maximum at broadside of the source; the sound levels increase and then decrease rapidly as the line of OBH’s enters and exits the source’s broadside directivity lobe.
The empirical functions used to fit to measured received level versus range had the form: RL = SL – n logR – αR, or Equation (2) RL = SL – n logR, Equation (3)
where RL is the received level in decibels, SL is the source level5 at 1 m reference distance in dB, R is the source-receiver range in m, n is the geometric spreading loss coefficient, and α is the absorptive loss coefficient. The form of the equation where absorptive losses were significant was that of equation 2. If no significant absorptive losses were present, an equation of the form 3 was fit to the data. The computed best-fit (least squares regression) functions are shown in the figures. The best-fit function is plotted as the solid line. For the purpose of obtaining conservative estimates of ranges to various sound level thresholds, we applied offsets to the best-fit functions so they would exceed 90% of the measured data points. Cumulative SEL Levels
Southall et al. (2007) have recently proposed new criteria for assessing auditory injury, defined as onset of permanent threshold shift (PTS), and behavioral disturbance to marine mammals caused by underwater sound. Southall et al proposed that peak (zero-to-peak) pressure and SEL metrics be evaluated against defined thresholds that are based on auditory sensitivity studies performed mainly on captive marine mammals. For the airgun array sources monitored in this program, the limiting criterion is the M-weighted SEL metric. It considers the total energy received from multiple pulses and also accounts for frequency-dependent hearing sensitivity of different species groups. The auditory injury criterion SEL threshold is 198 dB re. 1 µPa2-s (M-weighted) for cetaceans and 186 dB re. 1 µPa2-s (M-weighted) for pinnipeds.
The SEL metric proposed by Southall et al. involves summing the single pulse SEL’s for multiple pulses. They acknowledge that this approach is very conservative because it does not make any allowance 5 This value actually corresponds to the extrapolated level at the reference distance of 1 m from the source. There
are other similar approaches to obtain the source level, such as back-propagating the closest distance measurement by 20 log (R), which is referred to as spherical spreading back-propagation. We caution that both of these approaches have limited accuracy. To get the best estimates of source levels, narrow frequency bands should be back-propagated with computer acoustic propagation models. That has not been performed for this report.

3-6 Monitoring in the Chukchi & Beaufort Seas: Shell Offshore, 2008
for the recovery of hearing between pulse exposures. Their proposed cumulative SEL metric (unweighted) is defined as follows:
⎪⎪⎭
⎪⎪⎬
⎫
⎪⎪⎩
⎪⎪⎨
⎧
=∑∫=
21
0
2
10
)(log10SEL
ref
N
n
T
n
p
dttp,
where N is the number of exposures, T is the length of the single pulse time integration window and pref = 1 µPa in water. In the present study the cumulative SEL levels (both flat-weighted and M-weighted levels were considered) were computed for the sum of all shots in a single seismic line. We computed these levels from the broadside OBH data for OBHs less than 10 km (62 mi) from the survey lines. It is important to note that if these levels were to be used for assessing impact then it would assume the exposed animals remained stationary throughout the exposure (while the airguns operated along the entire survey line). This is a highly conservative assumption, at least for locations close to the survey line, because the animals likely would move away from the survey line as the seismic vessel approached. They therefore would experience a lower SEL. M-Weighting
M-weighting filters (see Marine Mammal Hearing section above) were applied to the Kakapo seismic survey airgun data applying the filters directly to the measured data using a Fourier approach. The M-weight filters were applied to the Como seismic survey data in 1/3-octave bands. The M-weighting filters applicable to marine mammal species commonly encountered in the Alaskan Beaufort and Chukchi Seas are as follows:
1. LFC: Bowhead whales (Balaena mysticetus) and other mysticetes. 2. MFC: Beluga whales (Delphinapterus leucas), Killer Whales (Orcinus orca) and other
mid-frequency odontocetes. 3. HFC: Harbour porpoise (Phocoena phocoena) and other high-frequency odontocetes. 4. PINN: Spotted seals (Phoca largha), ringed seals (Phoca hispida), ribbon seals (Phoca
fasciata), bearded seals (Erignathus barbatus), and Pacific walruses (Odobenus rosmarus). Vessel Sound Levels
The acoustic data recorded during the track line traversal for each vessel were analyzed to compute 1-second average SPLs as a function of horizontal range from the OBH system. An empirical transmission loss curve of the form Equation (3) was fit to the data by least-square regression of the coefficients A and B to obtain estimates of distances at which broadband vessel noise levels reached thresholds between 140 dB re 1 µPa and 100 dB re 1 µPa. The fits to the various datasets were performed only on the first few kilometers of data to limit the interference of ambient noise levels at lower SPLs. Measurement Programs
Nine separate underwater acoustic measurement programs were carried out. Initial results of these programs were published in field reports within 5 days of each measurement to provide timely verification data that were used to adjust the size of marine mammal exclusion zones around seismic and shallow hazards surveys. Table 2 lists the field studies and presents the specific acoustic sources measured during each program.

Chapter 3: Underwater Sound Measurements 3-7
Table 2. Measurement Programs conducted in summer/fall 2008. Study Sources Measurement Date(s)
Seismic Survey – Kakapo Site 3147 in3 airgun array, mitigation gun,
vessels (Norseman II, Gilivar, Gulf Provider, Torsvik, Theresa Marie)
27 – 28 July, 2008
Seismic Survey – Como Site 3147 in3 airgun array and mitigation gun 5 – 6 September, 2008
Shallow Hazards – Henry Christofferson in Camden Bay
2×20 in3 airgun array, 1×20 in3 airgun, bubble pulser, ODEC strata box, Henry
Christofferson 22 July, 2008
Shallow Hazards – Alpha Helix in Camden Bay
2×20 in3 airgun array, 1×20 in3 airgun, Geopulse profiler, Alpha Helix 3 – 4 August, 2008
Shallow Hazards – Alpha Helix in the Chukchi Sea 3.5 kHz profiler, Alpha Helix 28 – 30 August, 2008
Shallow Hazards – Cape Flattery 4×20 in3 airgun array, 2×20 in3 airgun array, 1×20 in3 airgun, 3.5 kHz profiler,
bubble pulser, Cape Flattery 29 – 30 August, 2008
Support Vessel Measurements – Prudhoe Bay Norseman II, Arctic Seal, Point Barrow 15 – 16 August, 2008
Support Vessel Measurements – Annika Marie in Prudhoe Bay Annika Marie 21 July, 2008
Support Vessel Measurements – Maxime at Barrow Maxime 22 August, 2008
The primary survey vessel used for the seismic surveys was the MV Gilavar. The Gilavar towed
two 3147 in3 airgun arrays, deployed at 6 m (20 ft) depth. The two airgun arrays were operated in flip-flop mode where they are fired alternately. The airgun configuration of the arrays is shown in Figure 3. During the turns between survey lines, only a single 30 in3 airgun, referred to as the mitigation gun, was used.

3-8 Monitoring in the Chukchi & Beaufort Seas: Shell Offshore, 2008
Figure 3. Plan view layout of the WesternGeco 3147 in3 airgun array.
Seismic Survey – Kakapo Site: A sound source verification program was performed to quantify underwater sound levels produced by airgun array operations and support vessels for Shell’s 2008 Chukchi Sea seismic survey at the Kakapo site. The acoustic measurements were carried out 27-28 July 2008 at a location off Point Lay, Alaska. Approximately 8 hours of seismic shooting was recorded on six autonomous Ocean Bottom Hydrophone (OBH) recorders deployed at various distances up to 37 km (23 mi) from the first seismic survey line of the 2008 seismic survey program at the Kakapo site. Measurements of both the full airgun array and mitigation airgun were made in the forward-endfire and broadside directions from the array. Additional vessel-only measurements were obtained of the Gilavar itself and the support vessels MV Gulf Provider, Theresa Marie, and Torsvik.
The sound level measurements were made using 6 autonomous OBH recording systems that were deployed on the seabed from the 114-foot research vessel RV Norseman II in advance of the arrival of the Gilivar on its first survey line. The four OBHs, labeled A, B, C and D, were deployed perpendicularly to the 55 km (34 mi) test survey line, starting 2.9 km (1.8 mi) from the end of the survey line, at respectively 0.5 km, 2 km, 8 km, and 100 km (0.3, 1.2, 5, and 62 mi) inshore of the survey line. The remaining two OBHs (E and F) were placed on the survey line but respectively 4.1 km (2.5 mi) and 50 km (31 mi) in the offshore direction. Figure 4 shows a diagram of the OBH deployment positions and survey line. After completing OBH deployments, the Norseman II departed the deployment area to avoid noise-contamination of the recordings while the Gilavar performed airgun array shooting along the survey line at a nominal speed of 3.8 knots. Digital acoustic recordings of 8 hours of shooting data were obtained from each OBH as the Gilavar followed the survey line with the airgun array operating. The Norseman II then returned to the survey area after the seismic line was completed and recovered the OBHs. OBH-E was not recovered, so its data are not included in this report.

Chapter 3: Underwater Sound Measurements 3-9
55,000 m 2000 m
50,000 m
Shooting Mitigation gun
A: 500 m south of point X
B: 2000 m south of point X
C: 8000 m south of point X
D: 34,900 m south of point X
F: 50,000 m past Point X
Shooting with full airgun array
Design: • 6 OBH buoys (filled circles) • Point X is 2.9 km east of the end of
survey line and 5 km east of last full array shot point.
• Forward endfire direction 0 to 100 km
• Broadside direction 0 to 34.9 km • Aft endfire direction 0 to 5 km
X: 2900 m before end of line
End of line
E: 4100 m west of point X, and 2000 m west of the start of the mitigation gun shooting (dashed)
Sail direction
Figure 4. Survey vessel track lines relative to OBH positions for acoustic measurements. Note: OBH-D was planned to be deployed at 100 km (62 mi) distance from the survey line, but could be placed only at 34.9 km (21.7 mi) due to the presence of ice. OBH E was not retrieved.
Gilavar fired its airgun array at full power for the entirety of the survey line (see Figure 2). Full array shooting continued 4.1 km (2.5 mi) past point X. Shooting then switched from the full array to a single mitigation gun as it made its turn to the next line. This provided mitigation gun measurements for ranges 8 to 40 km (5 to 25 mi).
Table 3. MV Gilivar SSV coordinates, Kakapo Prospect, Alaska. Latitude Longitude UTM (N) UTM (E) DEPTH (m)
OBH A 70.0440 N 165.7082 W 7770931 473024 43
OBH B 70.0370 N 145.6749 W 7770143 474284 41
OBH C 70.0088 N 165.5422 W 7766941 479313 41
OBH D 69.8792 N 164.9451 W 7752397 502107 37
OBH E 69.9932 N 165.8152 W 7765322 468873 43
OBH F 69.6643 N 166.4000 W 7729061 445701 41
Point X 70.0464 N 165.7192 W 7771207 472612 42
Start 70.4258 N 165.0134 W 7813353 469921 43
Stop 70.2066 N 165.4251 W 7788969 483949 44
Seismic Survey – Como Site: This SSV program was performed to quantify sound levels
produced by airgun array operations for Shell’s 2008 Alaskan Beaufort Sea seismic airgun survey at Como prospect. Shell contracted WesternGeco International Ltd. and the seismic survey vessel M/V

3-10 Monitoring in the Chukchi & Beaufort Seas: Shell Offshore, 2008
Gilavar to perform the geophysical survey program at Como prospect. The SSV test was carried out by JASCO Research Ltd., working on board the guard vessel M/S Torsvik, on 5-6 September 2008 in Harrison Bay, Alaska. Approximately 8 hours of seismic shooting was recorded on six autonomous Ocean Bottom Hydrophone (OBH) recorders deployed at various distances up to 100 km (62 mi) from the seismic vessel. Measurements of both the full 3147 in3 airgun array and a single 30 in3 mitigation airgun were obtained in the forward-endfire and broadside directions from the array.
Sound level measurements were performed using six calibrated OBH recording systems deployed at the locations shown in Figure 5 in order to simultaneously measure broadside and endfire sound levels from M/V Gilavar’s airgun arrays. The OBH systems were deployed from the guard vessel M/S Torsvik prior to conducting the SSV test. Four of the OBH systems (A, B, C and D) were deployed perpendicular to the survey line in order to measure broadside sound levels from the airgun arrays. The remaining two OBHs (E and F) were deployed off the end of the survey line in order to measure sound levels in the forward endfire direction from the airgun arrays. The survey vessel transited directly over point “X” in Figure 5, which was located 500 meters (0.31 mi) from OBH A at the CPA. Table 4 lists the coordinates and water depths at each of the OBH deployment locations, as well as the start and end point of Gilavar’s SSV track.
After Torsvik completed the OBH deployments, Gilavar commenced surveying along the pre-determined track line at a nominal speed of 4.5 knots. Gilavar’s airguns were fired approximately every 10 seconds. Digital acoustic recordings of approximately 8 hours of shooting data were recorded by each OBH as the Gilavar traversed the survey line with the airgun arrays operating. Gilavar fired its airgun array at full capacity for the entirety of the survey line. At the end of the survey line, Gilavar switched to a single mitigation gun, firing every 20 seconds, as it turned to the north. After Gilavar completed transiting the survey line, the airguns were shut off and Torsvik returned to the survey area to recover the OBHs. All OBHs were successfully retrieved aboard Torsvik in the evening on 6 September 2008.
Figure 5. Survey vessel track lines relative to OBH positions for acoustic measurements.
Water sound velocity profiles were also collected at each OBH location before and after the SSV tests. At each station, a SBE 19 Conductivity-Temperature-Depth (CTD) profiler was used to measure the

Chapter 3: Underwater Sound Measurements 3-11
temperature and salinity of the water column versus depth. Temperature and salinity data were converted to speed of sound in water using standard oceanographic formulae. A total of 12 sound speed profiles were collected during the SSV study at Como prospect.
Table 4. MV Gilivar SSV survey line and OBH deployment locations, and water depths for the Como prospect.
Location Latitude Longitude Water Depth CPA (m) OBH A 70° 58.714’W 151° 26.528’W 19.4 m 637 OBH B 70° 59.366’N 151° 25.265’W 19.7 m 2071 OBH C 71° 02.034’N 151° 19.815’W 21.2 m 8029 OBH D 71º 18.220’N 150º 46.510’W 24.0 m 40078 OBH E 71º 00.520’N 151º 36.779’W 20.3 m 85 OBH F 71º 14.492’N 152º 43.938’W 42.0 m 44870
Gilivar Track Start 70º 43.460’N 150º 19.070’ W 19.2 m – Gilivar Track End 70º 59.921’ N 151º 33.968’ W 20.1 m –
Shallow Hazards – Henry Christofferson in Camden Bay: This SSV program was performed to
quantify sound levels produced by airgun operations, sub-bottom profilers, and vessel noise for Shell’s Shallow Hazards 2008 survey program from the survey vessel Henry Christofferson (Henry-C) near Sivulliq prospect, Camden Bay Alaska on 22 July 2008. JASCO Research Ltd. carried out acoustic measurements on several survey sources as a function of distance from less than 100 m (330 ft) to 15 km (9.3 mi) distance. The sources included:
• 2 x 10 in3 airgun array, • 1 x 10 in3 airgun, • Datasonics SPR-1200 sub-bottom profiler, Bubble Pulser (400 Hz). • ODEC Single frequency sub-bottom profiler, Strata Box (3.5 kHz), • Survey Vessel Henry-C (vessel sounds only at two sailing speeds)
Shell contracted GEO LLC to perform the Shallow Hazards survey, which provided bathymetric data and information about shallow sub-sea structures that could be hazards to future drilling programs. The primary acoustic source for this survey was a small airgun array, consisting of two 10 in3 guns at a separation of 50 cm (20 in). Figure 6 below shows the two gun array configuration. The second configuration consists of a single 10 in3 airgun which was used for mitigation during turns between survey lines. All sources measured were towed by the survey vessel Henry-C, captained by Jack Power.

3-12 Monitoring in the Chukchi & Beaufort Seas: Shell Offshore, 2008
Figure 6. GEO LLC two gun array.
The medium penetration sub-bottom profiler used was a Datasonics model SPR-1200 Bubble Pulser (400Hz). The single frequency sub-bottom profiler used by the survey was an ODEC Strata Box (3.5 kHz). See Figure 7 below for photos of the Bubble Pulser and Strata Box used for this program.
Figure 7. Image of the Dual Frequency Bubble Pulser (Left – the sled can be seen just below the water surface) and the Single Frequency Strata Box (Right) used for this survey.
Underwater acoustic measurements of sound levels emitted from all sources were made using two autonomous OBH recorders. The sound level measurements were carried out on 22 July 2008, just prior to the start of the production surveying. The OBH systems were deployed from the Henry-C at two fixed recording sites inside the Sivulliq prospect survey area. The Sivulliq 8SV01500N production line was extended for these measurements by 10 km (6.2 mi) in S-E direction and by 3 km (1.9 mi) in N-W direction to obtain the required maximum distances of 15 km from the OBH deployment locations (Figure 8).

Chapter 3: Underwater Sound Measurements 3-13
Figure 8. Sound source verification test sail line (showing 10 km and 3 km, or 6.2 mi and 1.9 mi, extensions) and OBH locations S02 and S03.
The OBH systems were deployed at 90 m (300 ft) and 940 m (3100 ft) perpendicular to the airgun survey line of the Henry-C on 21 July 2008 at 20:55:53 (OBH S02) and 21:25:19 (OBH S03). The coordinates, water depths and length of recordings noted at the actual deployment sites, designated “S02” and “S03” respectively are provided in Table 5.
Table 5. Deployment locations, water depth, and total deployment period (deployment to recovery) of the OBH recorders for the sound level measurements.
OBH Latitude Longitude Water Depth Total Deployment Period (Hours)
S02 70° 24’ 27.5981” N 146° 02’ 28.8311” W 33 m (108 ft) 17.3 S03 70° 24’ 05.3888” N 146° 03’ 24.6975” W 33 m (108 ft) 17.1
The survey line started at 3 km (1.9 mi) NW of the OBH deployment locations and continued 15.4
km (9.6 mi) SE past the OBHs to the south end of the Sivulliq prospect. The same survey line was used for all sources measured with the only differences being the length of the line and the direction transited (north – south). The airgun measurements were performed over the entire length of the survey line (18.4 km, or 11.4 mi), whereas the sub-bottom profiler measurements were conducted over 7.5 km, or 4.7 mi, (Strata box) and 8 km, or 5 mi, (Bubble Pulser) sections of the line (between marks 2 and 4).
The airgun array, single airgun, and the Strata Box were towed at a depth of 1.5 meters (4.9 ft), whereas the Bubble Pulser was towed at a depth of 0.5 meters (1.6 ft). The nominal speed of the survey vessel was different for different sources and varied between 1.3 and 3.5 kts (see Table 6). The time

3-14 Monitoring in the Chukchi & Beaufort Seas: Shell Offshore, 2008
intervals between shots were unique for each source: a) single airgun and 2×10 in3 array = 2 to 5 seconds, b) Bubble Pulser = 1 second, and c) Strata Box = 0.2 seconds.
The GEO LLC survey, starting with the single airgun, commenced following 00:00 hours, 22 July 2008. Table 6 shows the recording times for each source measured. After completion of the sound measurements, the OBH systems were retrieved aboard the Henry-C. The acoustic data were downloaded for analysis by 20:00 on 22 July 2008.
Table 6. Summary log of GEO LLC sound source activities from GEO Navigation Logs. Source
# Source Type Start Date Start Time End Time SSV Line Vessel
Speed (kts)
1 Single Airgun 22-JUL-08 0:48 3:47 1 3.5
2 Airgun Array 22-JUL-08 4:08 6:23 1 3.5
3 Bubble Pulser 22-JUL-08 7:59 9:20 2 2.7
4 Strata Box 22-JUL-08 10:01 11:32 2 1.3
Shallow Hazards – Alpha Helix in Camden Bay: This SSV program was performed to quantify
sound levels produced by airgun operation, a sub-bottom profiler, and vessel noise for Shell’s Shallow Hazards 2008 survey program from the survey vessel Alpha Helix at the Sivulliq prospect, Camden Bay Alaska on 3-4 August 2008. Underwater sound measurements were made as a function of distance from four sound sources, including 3 survey sources and the survey vessel itself, at distances between 200 m (660 ft) and 15 km (9.3 mi). The sources measured were:
• 2 x 10 in3 airgun array, • 1 x 10 in3 airgun, • Geopulse Profiler (3.5 kHz) • Survey Vessel Alpha Helix (vessel at survey speed)
Shell contracted Fugro Geo Services Inc. to perform this Shallow Hazards survey, which provided bathymetric data and information about shallow sub-sea structures that could be hazards to future drilling programs. The primary acoustic source for this survey was a small airgun array, consisting of two 10 in3 guns at a separation of 50 cm (20 in). The second configuration used a single 10 in3 airgun which was used as a mitigation source to avoid marine mammal approaches during the otherwise-silent periods during turns between survey lines. The single frequency sub-bottom profiler used by the survey was a Geopulse (3.5 kHz). The airgun array was towed at 16.5 m (50 ft) behind the vessel at 1.5 m (4.9 ft) depth. The pole-mounted sub-bottom profiler was deployed from the starboard side of the vessel. Figure 9 shows photos of the acoustic sources used for this program.

Chapter 3: Underwater Sound Measurements 3-15
Figure 9. Fugro Geo Services Inc. acoustic sources: the two airgun array (left) and the Geopulse sub-bottom profiler (right).
The OBH system was deployed from the Alpha Helix on at a fixed recording site at 22.3 m (73 ft) water depth inside the Sivulliq prospect survey area. The survey line was oriented in the East-West direction to follow the bathymetric contours. The airgun measurements were performed on two 20 km (12 mi) lines (Figure 2), whereas the sub-bottom profiler measurements were performed on two 13-km (8 mi) lines. The OBH was 200 m (660 ft) off the first line (A to C) and 800 m (0.5 mi) off the second survey line (D to F).
Figure 10. SSV test sail lines and the OBH location for the Alpha Helix measurements.
The OBH system was deployed on 3 August 2008 at 08:26 and the underwater acoustic measurements were made through until 4 August 2008. The coordinates, water depths, and length of recordings noted at the actual deployment site provided in Table 7. A map showing the study area, survey lines and OBH locations is given in Figure 11.

3-16 Monitoring in the Chukchi & Beaufort Seas: Shell Offshore, 2008
Table 7. Deployment locations, water depth, and total deployment period (deployment to recovery) of the OBH recorders for the sound level measurements.
OBH Latitude Longitude Water depth Total Deployment Period (Hours)
S03 70° 16’ 0.3081” N 145° 56’ 59.684” W 22.3 m (73.2 ft) 25.5
Figure 11. Map of the study area. Location of OBH and the two survey lines.
The 2x10 in3 airgun array and single 10 in3 airgun were towed at a depth of 1.5 meters (20 ft), whereas the Geopulse profiler was submerged at 3 meters (9.8 ft) depth. The nominal speed of the survey vessel was 4.5 kts for all the sources (see Table 3). The time intervals between shots were different for the different sources: a) single airgun and 2x10 array at 4 seconds, b) Geopulse profiler at 0.125 seconds. Table 8 shows the recording times for each source measured. After completion of the sound measurements, the OBH systems were retrieved onto the Alpha Helix and the acoustic data downloaded for analysis.

Chapter 3: Underwater Sound Measurements 3-17
Table 8. Summary log of Fugro Geo Services Inc. sound source activities from Fugro Geo Services Inc. Navigation Logs.
Source #
Source Type Start Date Start Time End Time SSV Line Vessel
Speed (kts)
1 Geopulse Profiler 3-AUG-08 09:39 11:10 1 4.6
1 Geopulse Profiler 3-AUG-08 12:01 13:28 2 4.6
2 Airgun Array 3-AUG-08 16:50 19:12 1 4.5
2 Airgun Array 3-AUG-08 21:24 23:46 2 4.5
3 Single Airgun 4-AUG-08 01:48 04:04 1 4.6
3 Single Airgun 4-AUG-08 06:16 08:38 2 4.6
Shallow Hazards – Alpha Helix in the Chukchi Sea: This measurement program quantified
sound levels produced by SOI’s 2008 Shallow Hazards survey program in the Chukchi Sea. The program measured the sub-bottom profiling acoustic source that was operated by Fugro Geo Services Inc. from the vessel Alpha Helix at the Crackerjack C prospect on 28-30 August 2008, as well as the noise from the vessel itself running at survey speed.
SOI contracted Fugro Geo Services Inc. to conduct from the Alpha Helix a small program of Shallow Hazards survey activities in the Chukchi Sea that provided bathymetric data and information about shallow sub-sea structures that could be hazards to future drilling programs. The only source (aside from high-frequency sonars) that was used for the survey was a single frequency (3.5 kHz) sub-bottom profiler. This sub-bottom profiler was the same as was used in the Alpha Helix in Camden Bay Shallow Hazards program (ref. Figure 9 - right). Underwater acoustic measurements were carried out during the evening of August 29th and overnight into August 30th 2008.
The acoustic measurement program was performed as the Alpha Helix began a bathymetry survey grid at the Crackerjack C prospect. Two OBH systems were deployed from the Alpha Helix at two fixed recording sites at 45 m (150 ft) water depth inside the Crackerjack C prospect survey area. The measurements were performed as the vessel sailed a single 13 km (8.1 mi) survey line, slightly off the East-West direction (bearing 261°) to follow bathymetric contours. The OBHs were aligned along a southward perpendicular to the survey line at respectively 200 m and 1000 m (660 ft and 0.62 mi) distance off the line. Figure 12 (not drawn to exact scale) provides a diagram of the layout for the SSV. Note that the SSV measurement passes for the non-airgun sources were limited to the segment between “A” and “B”, for a run length of 13 km, or 8.1 mi, (5 km, or 3.1 mi, on one side of CPA and 8 km, or 5 mi, on the other). The full line length to “C” (20 kilometres, or 12 mi) was not used for the Alpha Helix runs. A map showing the study area, survey line and OBH locations is given in Figure 13. OBH locations and SSV line segments are listed in Table 9 below.

3-18 Monitoring in the Chukchi & Beaufort Seas: Shell Offshore, 2008
Figure 12. SSV test sail lines and the OBH locations. The point marked by an X is the nominal CPA between the sources and the OBHs.
Figure 13. Map of the study area, showing the location of the two OBHs and the survey line (inset). Depths are in fathoms. Table 9. OBH locations and SSV line segment points for the Crackerjack C site.
Latitude Longitude OBH 1 71° 12.2865’ N 166° 17.1773’ W OBH 2 71° 11.8624’ N 166° 16.9541’ W
Line endpoint A 71° 12.8410’ N 166° 09.0059’ W Line endpoint B 71° 11.6630’ N 166° 30.3855’ W Line endpoint C 71° 11.0116’ N 166° 41.8794’ W
X (CPA) 71° 12.3926’ N 166° 17.2343’ W
The Alpha Helix made two passes, one with the profiler operating and the other with the source
inactive so that the noise from the vessel itself could be recorded for analysis. Table 10 shows the start

Chapter 3: Underwater Sound Measurements 3-19
and end times for the two SSV line runs. After completion of the sound measurements, the OBH systems were retrieved onto the Alpha Helix and the acoustic data were downloaded for analysis.
Table 10. Summary of SSV line run start and end times for the Alpha Helix at the Crackerjack C site. Source Run Start date/time End date/time
Vessel alone at survey speed 29-AUG-08 10:52:45 30-AUG-08 12:28:30 3.5 kHz sub-bottom profiler 30-AUG-2008 13:48:50 30-AUG-08 15:22:25
Shallow Hazards – Cape Flattery: This measurement program provided measurements for a
Shallow Hazards survey performed by ASRC Energy Services (AES) in the Chukchi Sea in late August 2008. AES performed the survey under contract to Shell Offshore Incorporated at Shell’s lease area prospects in the Chukchi Sea. The survey sources included three airgun configurations, a bubble pulser and a sub-bottom profiler. The survey vessel Cape Flattery operated under contract to AES. The SSV measurements were made from the Shell contracted vessel Alpha Helix at the Crackerjack C prospect, Chukchi Sea, Alaska on 29-30 August 2008. Underwater sound measurements were performed at multiple ranges between 200 m (660 ft) and 15 km (9.3 mi) from each survey sound source. The sources measured were:
• 4 x 10 in3 airgun array, • 2 x 10 in3 airgun array, • 1 x 10 in3 airgun, • 3.5 kHz sub bottom profiler • 400 Hz bubble pulser • Cape Flattery running at survey speed
The primary acoustic source for these surveys was a small airgun array consisting of four 10 in3 sleeve guns suspended from floats in a rectangular arrangement at a separation of 61 cm (2 ft) horizontally and 46 cm (1.5 ft) vertically. Figure 9 shows a photo of a typical two-airgun towed module that is similar, aside from the number of airguns, to the acoustic source on the Cape Flattery that was measured in this study. The airgun array could be operated in various configurations, the smallest being a single 10 in3 airgun. The single gun was only used as a mitigation source to prevent marine mammal approaches during turns between survey lines, when the airgun array would otherwise be silent. Other sources aboard the Cape Flattery that were used in the course of Shallow Hazards surveys were a 3.5 kHz sub-bottom profiler (ORE model 140 with Datasonics transducer) and a 400 Hz bubble pulser (Datasonics BP530 controller and transducer plate).
The OBH systems used to make the underwater acoustic measurements were the same ones used in the Shallow Hazards – Alpha Helix in the Chukchi Sea program. See Figure 12 for the SSV test sail lines and OBH locations, Figure 13 shows a map of the study area, and Table 9 lists the OBH location and SSV line coordinates.
The measurements were performed as the vessel Cape Flattery towing the airguns sailed a single 20 km (12 mi) survey line, slightly off the East-West direction (bearing 261°) to follow the bathymetric contours. The OBHs were aligned along a southward perpendicular to the survey line at respectively 200 m (660 ft) and 1000 m (0.62 mi) distance off the line. Note that the measurement passes for the non-airgun sources were limited to the segment between “A” and “B”, for a run length of 13 km, or 8.1 mi, (5
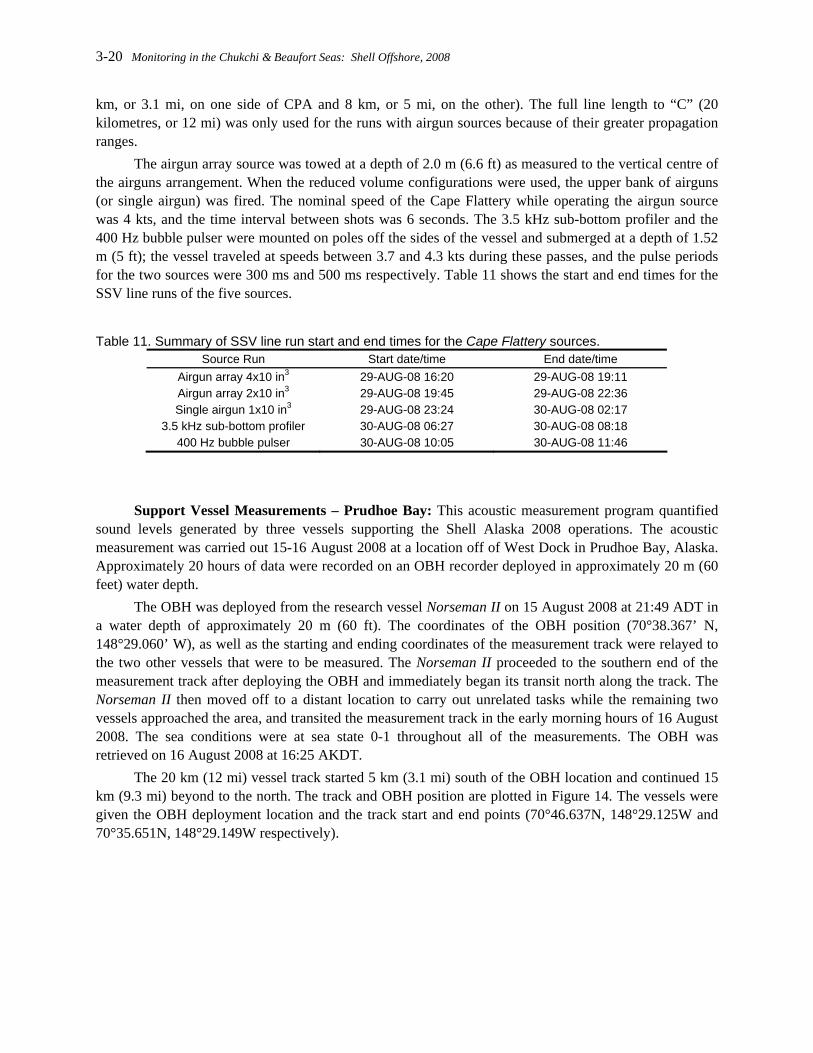
3-20 Monitoring in the Chukchi & Beaufort Seas: Shell Offshore, 2008
km, or 3.1 mi, on one side of CPA and 8 km, or 5 mi, on the other). The full line length to “C” (20 kilometres, or 12 mi) was only used for the runs with airgun sources because of their greater propagation ranges.
The airgun array source was towed at a depth of 2.0 m (6.6 ft) as measured to the vertical centre of the airguns arrangement. When the reduced volume configurations were used, the upper bank of airguns (or single airgun) was fired. The nominal speed of the Cape Flattery while operating the airgun source was 4 kts, and the time interval between shots was 6 seconds. The 3.5 kHz sub-bottom profiler and the 400 Hz bubble pulser were mounted on poles off the sides of the vessel and submerged at a depth of 1.52 m (5 ft); the vessel traveled at speeds between 3.7 and 4.3 kts during these passes, and the pulse periods for the two sources were 300 ms and 500 ms respectively. Table 11 shows the start and end times for the SSV line runs of the five sources.
Table 11. Summary of SSV line run start and end times for the Cape Flattery sources. Source Run Start date/time End date/time
Airgun array 4x10 in3 29-AUG-08 16:20 29-AUG-08 19:11 Airgun array 2x10 in3 29-AUG-08 19:45 29-AUG-08 22:36 Single airgun 1x10 in3 29-AUG-08 23:24 30-AUG-08 02:17
3.5 kHz sub-bottom profiler 30-AUG-08 06:27 30-AUG-08 08:18 400 Hz bubble pulser 30-AUG-08 10:05 30-AUG-08 11:46
Support Vessel Measurements – Prudhoe Bay: This acoustic measurement program quantified
sound levels generated by three vessels supporting the Shell Alaska 2008 operations. The acoustic measurement was carried out 15-16 August 2008 at a location off of West Dock in Prudhoe Bay, Alaska. Approximately 20 hours of data were recorded on an OBH recorder deployed in approximately 20 m (60 feet) water depth.
The OBH was deployed from the research vessel Norseman II on 15 August 2008 at 21:49 ADT in a water depth of approximately 20 m (60 ft). The coordinates of the OBH position (70°38.367’ N, 148°29.060’ W), as well as the starting and ending coordinates of the measurement track were relayed to the two other vessels that were to be measured. The Norseman II proceeded to the southern end of the measurement track after deploying the OBH and immediately began its transit north along the track. The Norseman II then moved off to a distant location to carry out unrelated tasks while the remaining two vessels approached the area, and transited the measurement track in the early morning hours of 16 August 2008. The sea conditions were at sea state 0-1 throughout all of the measurements. The OBH was retrieved on 16 August 2008 at 16:25 AKDT.
The 20 km (12 mi) vessel track started 5 km (3.1 mi) south of the OBH location and continued 15 km (9.3 mi) beyond to the north. The track and OBH position are plotted in Figure 14. The vessels were given the OBH deployment location and the track start and end points (70°46.637N, 148°29.125W and 70°35.651N, 148°29.149W respectively).

Chapter 3: Underwater Sound Measurements 3-21
Figure 14. Map of OBH location and track given to the vessels for the measurement operation.
Support Vessel Measurements – Annika Marie in Prudhoe Bay: This measurement program
quantified vessel sound levels produced by the research vessel R/V Annika Marie. The R/V Annika Marie conducted bathymetric surveys and underwater pipeline inspections off West Dock for SOI in 2008. The acoustic monitoring program was carried out 21 July 2008 at a location off of West Dock in Prudhoe Bay, Alaska. Approximately 2 hours of data were recorded on an autonomous OBH recorder deployed in approximately 10 m (34 feet) water depth.
One calibrated Ocean Bottom Hydrophone (OBH) recording system was deployed from the Annika Marie at 70°31.929’ N, 149°4.999’ W in a water depth of approximately 10 m (33 ft). This location was chosen to approximate the normal operating conditions of the vessel.
The OBH system was deployed on the sea bottom with a 30 m (98 ft) sinking line attached to a Danforth anchor. Because of the shallow water depth, and to facilitate efficient deployment and retrieval, the OBH system was deployed with a surface buoy attached to the anchor. The separation between anchor and OBH isolated the recorder from noise produced by the float and surface line.
Personnel on board the R/V Annika Marie recorded a continuous GPS position track for this analysis using a 10 seconds sampling period. The position of the OBH along with the track of the vessel during the measurement is plotted in Figure 15.

3-22 Monitoring in the Chukchi & Beaufort Seas: Shell Offshore, 2008
Figure 15. Map of the OBH location and track of the Annika Marie during the measurement operation.
Support Vessel Measurements – Maxime at Barrow: This SSV program quantified sound levels
produced by the shallow water support vessel Maxime. Shell used this vessel to support its seismic operations in the Chukchi and Beaufort Seas in 2008. For this study, approximately 1.5 hours of data were recorded on an autonomous OBH recorder deployed offshore Point Barrow. The measurements were performed on 22 August 2008 by JASCO Research Ltd.
The OBH was deployed from the Maxime at location 71º 18.767’ N, 156 º 47.975’ W in water depth 23.2 m (76 feet). This location was chosen as representative of the normal operating conditions of the vessel. The Maxime also operated in shallower water closer to shore, where sound levels are expected to decay more rapidly with distance. The OBH system was deployed with a surface buoy to facilitate efficient deployment and retrieval of the recorder and its anchor. A continuous GPS position log was recorded by the vessel for this analysis. The position of the OBH and the track of the Maxime are shown in Figure 16.

Chapter 3: Underwater Sound Measurements 3-23
Figure 16. Map of the OBH location (yellow cross) and track of the Maxime (red line) during the measurement.
The Maxime sailed in a straight line directly over the OBH position, as shown in Figure 16. The maximum range of the Maxime from the OBH recorder was 15 km, or 9.3 mi, (8.1 nm). Nominal vessel transit speed during the SSV measurement was 8 kts. Vessel sound levels were computed in 1-second time windows stepped in 0.5-second increments.
Programs and Results
Seismic Survey – Kakapo Site Airgun Array Measurements Full 3147 in3 Airgun Array
Ranges from the airgun array to the OBH recording positions were computed for the times corresponding to each shot using the navigation logs supplied by the Gilavar upon completion of the survey. For endfire plots at ranges 42 km (26 mi) and greater, measurements from the more sensitive TC4032 hydrophones are shown. At shorter ranges, measurements are from the less-sensitive TC4043 hydrophones. For broadside measurements, the more sensitive TC4032 hydrophones are used at ranges of 8 km (5 mi) and greater.
The endfire measurement plots shown in Figure 18 were obtained on OBHs A and F. The broadside measurements shown in the plot of Figure 19 were obtained on OBHs A, B, C, and D. The broadside measurement plot shows data points extracted from the overall datasets at the time corresponding to the approach and passing by Gilavar past point X (ref. Figure 4). Only a few points were plotted from each OBH to capture the directivity maximum at broadside of the airgun.

3-24 Monitoring in the Chukchi & Beaufort Seas: Shell Offshore, 2008
Figure 17 - Peak, rms, and SEL for airgun pulses received from array forward endfire on OBHs A and F. Multiply by 0.62 to convert km to miles.
Figure 18 - Peak, rms, and SEL for airgun pulses received from array forward endfire at ranges greater than 1 km (0.62 mi) on OBHs A and F. Solid line is best fit of the empirical functions to rms values. Dashed line represents a shift of the best-fit line by +1.8 dB to exceed 90% of the rms data values. . Multiply by 0.62 to convert km to miles.
The piecewise continuous empirical function (of the form Equation 2) was fit to the endfire measurements. The transition range was set to 10km (6.2 mi). At shorter ranges, the empirical fit was RL = 241.6 – 20.0 LOG R – 0.00044 R. Beyond 10km (6.2 mi), the empirical fit was RL = 157.2 – 35.3 LOG (R / 10000) – 0.0000064 (R – 10000). This fit exceeded 90% of the rms data values when it was shifted by +1.8dB. Distances to threshold sound levels were determined using the 90th percentile shifted function. These distances are given in Table 12.

Chapter 3: Underwater Sound Measurements 3-25
Figure 19 - Peak, rms, and SEL for airgun pulses received from array broadside. Solid line is best fit of the empirical function to rms values. Dashed line is the best-fit line shifted by 1.1 dB to exceed 90% of data values. Multiply by 0.62 to convert km to miles. Mitigation Gun The peak, rms, and SEL were also calculated for the mitigation airgun used at the end of the seismic line. Shot SPLs were computed from OBH systems and were plotted against the corresponding source-receiver
ranges in
Figure 20. The mitigation airgun sound levels are omnidirectional (the same in all directions). Short range, less than 7 km (4.3 mi), measurements are presently unavailable for the mitigation gun due to the inability to retrieve OBH-E.

3-26 Monitoring in the Chukchi & Beaufort Seas: Shell Offshore, 2008
Figure 20 - Peak, rms, and SEL versus distance from the mitigation airgun. Solid line is best fit of the empirical function to rms values. Dashed line is the best-fit line shifted by 1.8 dB to exceed 90% of data
values. Multiply by 0.62 to convert km to miles.
Ranges to Threshold Levels Ranges from the airgun array to specified sound pressure level (SPL) thresholds between 190 and
120 dB re 1 μPa rms were determined from the acoustic data recorded on OBH systems in the broadside and endfire directions and also for the mitigation airgun. More airgun shot measurements were obtained in the forward endfire direction than in the broadside direction due to the configuration of the deployment geometry. The mitigation airgun shots were recorded for the last 40 minutes Gilavar remained on the survey line.
Table 12. Forward-endfire sound level threshold distances for the full 3147 in3 airgun array. rms SPL (dB re 1 µPa) Best fit range (m) 90th percentile range (m)
190 370 450 180 1100 1400 170 3200 3800 160 7900 9100 120 110000 120000
Broadside direction measurements at the four broadside ranges: 500 m, 2 km, 8 km and 35 km (0.31, 1.2, 5, and 22 mi) were made simultaneously as the seismic vessel passed point X (ref. Figure 4). The levels at these ranges changed rapidly as the airgun array passed the CPA (point X) relative to the OBHs due to strong array directivity that has been discussed previously. The variation at each range represents sampling over the peak of the directivity function lobe. Only five data points near the maximum value at each of the four ranges were considered for the purpose of determining broadside sound level threshold ranges. A fit of an empirical level versus range function was used to interpolate between the sampled broadside ranges. The empirical fit was used to estimate the threshold ranges presented in Table 13.
Table 13. Broadside sound level threshold distances for the full 3147 in3 airgun array. rms SPL (dB re 1 µPa) Best fit range (m) 90th percentile range (m)
190 540 610 180 1700 2000 170 5100 5700 160 12000 13000 120 75000* 77000*
*Extrapolated from maximum measurement range of 34.9 km. The nominal ranges important to sound level thresholds for the mitigation airgun measurements are
presented in Table 14.

Chapter 3: Underwater Sound Measurements 3-27
Table 14. Sound level threshold distances for the 30 in3 mitigation airgun. rms SPL (dB re 1 µPa) Best fit range (m) 90th percentile range (m)
190 140* 160* 180 320* 370* 170 710* 820* 160 1600* 1900* 120 40000 47000
*Extrapolated from minimum measurement range of 8 km (5 mi).
Cumulative M-Weighted SEL The cumulative SEL metric was calculated for one full seismic survey line at OBHs A, B, and C.
SEL values were taken from the broadside test tracks (ref. Figure 4) because the higher levels caused by the strong directional lobe of the array at the CPA provide the most conservative estimate of cumulative SEL. Various types of M-weighting were also applied to the SEL values before summing to provide M-weighted cumulative SEL. The plots below show the flat and M-weighted cumulative SEL curves as they evolve with the progression of the survey line, as well as flat-weighted per shot SEL values for comparison. Each plot is specific to an OBH; in aggregate they provide an indication of the cumulative SEL at different fixed distances from a seismic survey line. Figure 24 is a map showing the relative locations of the receivers to the shot points.
Figure 21. Flat and M-weighted cumulative SEL with flat-weighted per shot SEL from OBH A, 500 m (0.31 mi) off the survey line.

3-28 Monitoring in the Chukchi & Beaufort Seas: Shell Offshore, 2008
Figure 22. Flat and M-weighted cumulative SEL with flat-weighted per shot SEL from OBH B, 2 km (1.2 mi) off the survey line.
Figure 23. Flat and M-weighted cumulative SEL with flat-weighted per shot SEL from OBH C, 8 km (5 mi) off the survey line.

Chapter 3: Underwater Sound Measurements 3-29
Figure 24. Map of the seismic survey line with shot points and OBH locations used in the calculation of cumulative SEL.
The received per-shot SEL levels change over the length of the test track due to the changing source-receiver range and also because of airgun array directivity. The directivity was maximum at array broadside which was sampled by the line of OBHs as the seismic vessel passed the CPA.
The variability in per-shot SEL (most noticeable in Figure 22) is due to very low frequency ambient acoustic noise rather than airgun energy which caused the flat-weighted cumulative SEL to initially be at a higher level than the LFC M-weighted level. Note that this effect is greatly reduced around the CPA because the higher levels dominate the cumulative SEL. Figure 25 illustrates this low frequency noise in the recordings (around 6 Hz).

3-30 Monitoring in the Chukchi & Beaufort Seas: Shell Offshore, 2008
Figure 25. Low frequency noise contaminating the airgun pulses from OBH B at 40 km (25 mi) range (rms level for these seismic pulses was approximately 145 dB re 1 µPa).
Table 15 provides the maximum cumulative SEL for each receiver, and Figure 26 shows these maxima as a function of distance off the survey line.
Table 15. Maximum cumulative SEL for each OBH off the seismic survey line. Cumulative SEL (dB re 1 µPa2s) Distance off
seismic survey line Flat-weighted Low Frequency
Cetaceans Mid-Frequency
Cetaceans
High Frequency Cetaceans
Pinnipeds underwater
500 m 196.3 195.8 186.1 184.0 190.0 2 km 190.8 190.3 182.7 180.8 185.9 8 km 185.6 185.5 180.5 178.6 183.4
Figure 26. Cumulative SEL as a function of perpendicular distance off the survey line. Multiply by 0.62 to convert km to miles.

Chapter 3: Underwater Sound Measurements 3-31
An equation of the form Equation (3) was fit to each weighting of cumulative SEL and the distances to the proposed limiting criterion for injury of cumulative SEL by Southall et al. (2007) are all listed in Table 16.
Table 16. Best fit (least squares) equation to cumulative SEL vs. range for different m-weighting and distances to injury criterion proposed by Southall et al. (2007).
Weighting Best fit equation Injury Criteria (dB re 1 µPa2s)
Distance to Injury Criteria (m)
Flat RL = 193.6 – 8.9 LOG R - - LFC RL = 193.1 – 8.6 LOG R 198 270 MFC RL = 184.5 – 4.7 LOG R 198 1 HFC RL = 182.5 – 4.5 LOG R 198 1 PINN RL = 188.1 – 5.5 LOG R 186 2400
Airgun Shot Spectra and Spectrograms Airgun pulses detected at various ranges were analyzed to show their spectral components and are
presented in Figure 27 to Figure 33 below. Pulses at the same range measured from the forward-endfire direction as the broadside pulses are also plotted to see directivity effects. Spectrograms for the same pulses are presented in Figure 34 to Figure 40. These plots show the evolution of frequency with time for each pulse.
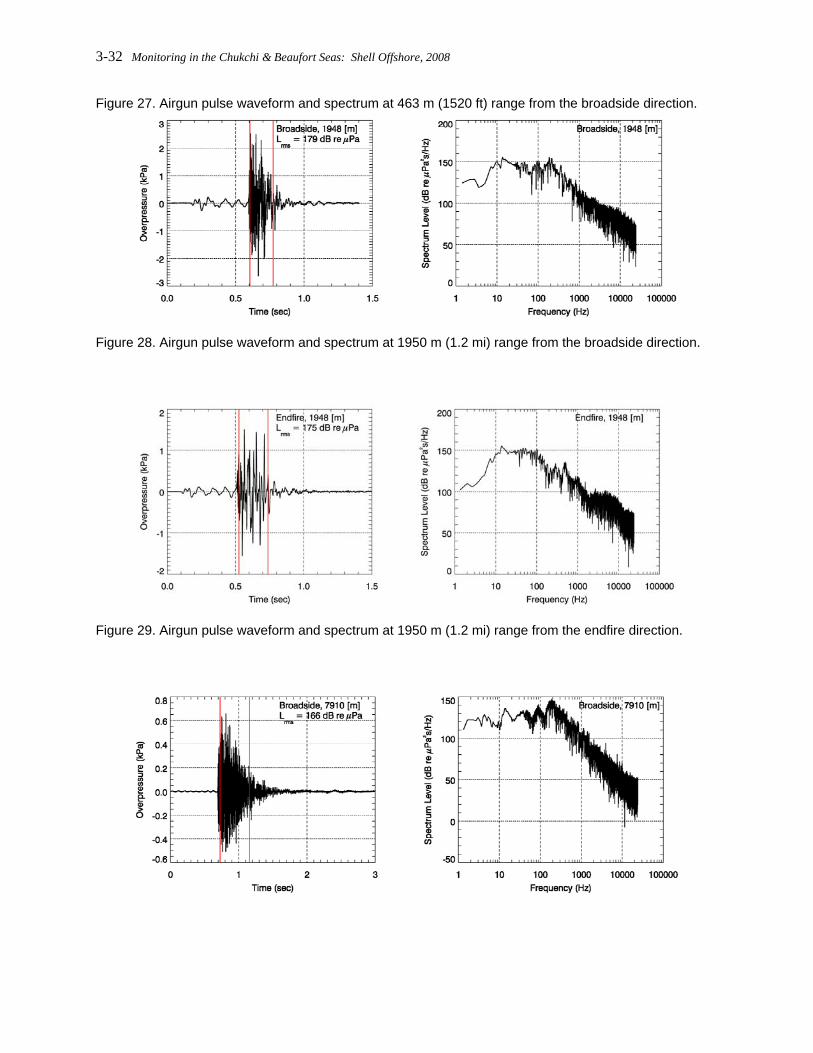
3-32 Monitoring in the Chukchi & Beaufort Seas: Shell Offshore, 2008
Figure 27. Airgun pulse waveform and spectrum at 463 m (1520 ft) range from the broadside direction.
Figure 28. Airgun pulse waveform and spectrum at 1950 m (1.2 mi) range from the broadside direction.
Figure 29. Airgun pulse waveform and spectrum at 1950 m (1.2 mi) range from the endfire direction.

Chapter 3: Underwater Sound Measurements 3-33
Figure 30. Airgun pulse waveform and spectrum at 7910 m (4.9 mi) range from the broadside direction.
Figure 31. Airgun pulse waveform and spectrum at 7910 m (4.9 mi) range from the endfire direction.
Figure 32. Airgun pulse waveform and spectrum at 35 km (22 mi) range from the broadside direction.
Figure 33. Airgun pulse waveform and spectrum at 35 km (22 mi) range from the endfire direction.

3-34 Monitoring in the Chukchi & Beaufort Seas: Shell Offshore, 2008
Figure 34. Spectrogram of an airgun pulse recorded on OBH A at 463 m (1520 ft) range corresponding to the broadside direction.
Figure 35. Spectrogram of an airgun pulse recorded on OBH B at 2 km (1.2 mi) range corresponding to the broadside direction.

Chapter 3: Underwater Sound Measurements 3-35
Figure 36. Spectrogram of an airgun pulse recorded on OBH A at 2 km (1.2 mi) range corresponding to the endfire direction.
Figure 37. Spectrogram of an airgun pulse recorded on OBH C at 8 km (5 mi) range corresponding to the broadside direction.

3-36 Monitoring in the Chukchi & Beaufort Seas: Shell Offshore, 2008
Figure 38. Spectrogram of an airgun pulse recorded on OBH A at 8 km (5 mi) range corresponding to the endfire direction.
Figure 39. Spectrogram of an airgun pulse recorded on OBH D at 35 km (22 mi) range corresponding to the broadside direction.

Chapter 3: Underwater Sound Measurements 3-37
Figure 40. Spectrogram of an airgun pulse recorded on OBH A at 35 km (22 mi) range corresponding to the endfire direction. 1/3 Octave Band Levels
Figure 41 shows a contour plot of 1/3 octave band pressure levels, versus range and frequency as measured on OBH A during the seismic survey test line (ref. Figure 4). This contour plot shows the spectral distribution of sound energy for an OBH recorder, and also shows which frequencies dominated sound propagation at the test site. Since OBH A was about 500 m (0.31 mi) off the seismic survey line, data at close range in the plot corresponds to broadside levels but data after approximately 1 km (0.62 mi) corresponds to endfire levels. The frequency at the center of the lobe is around 100 Hz.
Figure 41. 1/3-octave band pressure levels as a function of range and frequency on OBH A. Multiply by 0.62 to convert km to miles.

3-38 Monitoring in the Chukchi & Beaufort Seas: Shell Offshore, 2008
Seismic Pulse Duration Data from OBH A were analyzed to see how rms pulse duration varied with range over the entire
test survey track line (ref. Figure 4). This data set includes both broadside (at close ranges) and endfire data. The increase in rms level and decrease in pulse length at distances of less than 600 m (1970 ft) are due to the strong directivity characteristics of the airgun array and lesser influence of the sound propagation. Figure 42 shows how strongly coupled the pulse length is to range. Outliers on the plots most likely correspond to false detections of the automatic seismic pulse detector and do not represent energy from airguns.
Figure 42. 90% pulse duration and rms level as a function of range, for pulses received on OBH A during the full seismic survey test line. Multiply by 0.62 to convert km to miles. Vessel Measurements Norseman II
Measurements of vessel sound levels versus range from the vessel RV Norseman II (Figure 43) were obtained as it sailed back along the survey line to recover OBH F after the SSV test airgun array shooting was completed. Norseman II, owned by Norseman Maritime Charter, is a 114 ft support vessel. Nominal vessel speed during the sail-back was 10.4 kts. Vessel noise levels were computed in 2-second time windows stepped in 1-second increments. Figure 44 presents these vessel sound levels as a function of distance from the recorder positions.

Chapter 3: Underwater Sound Measurements 3-39
Figure 43. RV Norseman II support vessel.
Figure 44. Sound pressure levels (rms) for support vessel RV Norseman II at 10.4 kts. Solid line is best fit of the rms values. Dashed line is the best-fit line shifted by 3.2 dB to exceed 90% of data values. Multiply by 0.62 to convert km to miles.
The nominal ranges to the decibel thresholds 140, 130 and 120 dB re 1 μPa (rms) for the Norseman II were computed from the fit line shown in Figure 44. These ranges are listed in Table 17.
Table 17. Sound level threshold distances for the support vessel RV Norseman II at 10.4 kts. rms SPL (dB re 1 µPa) Best fit range (m) 90th percentile range (m)
140 32 58 130 190 340 120 1100 2000

3-40 Monitoring in the Chukchi & Beaufort Seas: Shell Offshore, 2008
Gilivar Additional analysis of vessel-only sound levels were made of the 273 ft seismic survey vessel MV
Gilavar (Figure 45) cruising at a nominal speed of 3.8 kts. These sound levels were taken between airgun shots on OBH A. Figure 46 presents these vessel sound levels as a function of distance from the recorder positions.
Figure 45. MV Gilavar seismic research vessel.
Figure 46. Vessel sound pressure levels (rms) for the MV Gilavar at 3.8 kts. Dashed line is the best-fit line shifted by 1.2 dB to exceed 90% of data values. Multiply by 0.62 to convert km to miles.
The nominal ranges to the decibel thresholds 140, 130 and 120 dB re 1 μPa (rms) for the Gilavar were computed from the line fit to data shown in Figure 46. These ranges are listed in Table 18.
Table 18. Sound level threshold distances for the MV Gilavar at 3.8 kts. rms SPL (dB re 1 µPa) Best fit range (m) 90th percentile range (m)
140 220* 270* 130 1400 1700 120 8800 11000
*Extrapolated from minimum measurement range of 500 m (0.31 mi).

Chapter 3: Underwater Sound Measurements 3-41
Gulf Provider Vessel-only sound level measurements were made of the seismic survey support vessel Gulf
Provider. The vessel had a nominal speed of 12.6 kts. Vessel noise levels were computed in 2-second time windows stepped in 1-second increments. These sound levels were taken on OBH A. Figure 47 presents these vessel sound levels as a function of distance from the recorder positions. Measured levels past 5 km (3.1 mi) were comparable to the background noise, and therefore removed.
Figure 47. Vessel sound pressure levels (rms) for the Gulf Provider at 12.6 kts. The higher levels are representative of the aft direction from the vessel. Multiply by 0.62 to convert km to miles.
Figure 48. Aft sound pressure levels (rms) for the Gulf Provider at 12.6 kts. Solid line is best fit of the empirical function to rms values. Dashed line represents a shift of the best-fit line by +0.9 dB to exceed 90% of the rms data values. Multiply by 0.62 to convert km to miles.

3-42 Monitoring in the Chukchi & Beaufort Seas: Shell Offshore, 2008
Figure 49. Forward sound pressure levels (rms) for the Gulf Provider at 12.6 kts. Solid line is best fit of the empirical function to rms values. Dashed line represents a shift of the best-fit line by +0.8 dB to exceed 90% of the rms data values. Multiply by 0.62 to convert km to miles.
The nominal ranges to the decibel thresholds 140, 130 and 120 dB re 1 μPa (rms) for the Gulf Provider were computed from the line fit to aft and forward data shown in Figure 48 and Figure 49 respectively. These ranges are listed in Table 19 and Table 20.
Table 19. Aft sound level threshold distances for the Gulf Provider at 12.6 kts. rms SPL (dB re 1 µPa) Best fit range (m) 90th percentile range (m)
140 76* 95* 130 900 1100 120 10000 13000
*Extrapolated from minimum measurement range of 350 m (1150 ft).
Table 20. Forward sound level threshold distances for the Gulf Provider at 12.6 kts. rms SPL (dB re 1 µPa) Best fit range (m) 90th percentile range (m)
140 35* 41* 130 270* 310* 120 2100 2400
*Extrapolated from minimum measurement range of 350 m (1150 ft).
Torsvik Vessel-only sound level measurements were made of the seismic survey support vessel Torsvik.
The vessel had a nominal speed of 12.0 kts. Vessel noise levels were computed in 2-second time windows stepped in 1-second increments. These sound levels were taken on OBH A. Figure 50 presents these vessel sound levels as a function of distance from the recorder positions. Measured levels past 5 km (3.1 mi) were comparable to the background noise, and therefore removed.

Chapter 3: Underwater Sound Measurements 3-43
Figure 50. Vessel sound pressure levels (rms) for the Torsvik at 12.0 kts. Higher levels are in the aft direction. Multiply by 0.62 to convert km to miles.
Figure 51. Aft vessel sound pressure levels (rms) for the Torsvik at 12.0 kts. Solid line is best fit of the empirical function to rms values. Dashed line represents a shift of the best-fit line by +0.5 dB to exceed 90% of the rms data values. Multiply by 0.62 to convert km to miles.

3-44 Monitoring in the Chukchi & Beaufort Seas: Shell Offshore, 2008
Figure 52. Forward vessel sound pressure levels (rms) for the Torsvik at 12.0 kts. Solid line is best fit of the empirical function to rms values. Dashed line represents a shift of the best-fit line by +1.3 dB to exceed 90% of the rms data values. Multiply by 0.62 to convert km to miles.
The nominal ranges to the decibel thresholds 140, 130 and 120 dB re 1 μPa (rms) for the Torsvik were computed from the line fit to aft and forward data shown in Figure 51 and Figure 52 respectively. These ranges are listed in Tables 9 and 10.
Table 21. Aft sound level threshold distances for the Torsvik at 12.0 kts. rms SPL (dB re 1 µPa) Best fit range (m) 90th percentile range (m)
140 72* 80* 130 450 500 120 2800 3100
*Extrapolated from minimum measurement range of 630 m (2060 ft).
Table 22. Forward sound level threshold distances for the Torsvik at 12.0 kts. rms SPL (dB re 1 µPa) Best fit range (m) 90th percentile range (m)
140 16* 22* 130 150 200 120 1300 1800
*Extrapolated from minimum measurement range of 630 m (2050 ft).

Chapter 3: Underwater Sound Measurements 3-45
Theresa Marie Vessel-only sound level measurements were made of the seismic survey support vessel Theresa
Marie. The vessel had a nominal speed of 10.5 kts. Vessel noise levels were computed in 2-second time windows stepped in 1-second increments. These sound levels were taken on OBH A. Figure 53 presents these vessel sound levels as a function of distance from the recorder positions.
Figure 53. Vessel sound pressure levels (rms) for the Theresa Marie at 10.5 kts. Solid line is best fit of the empirical function to rms values. Dashed line represents a shift of the best-fit line by +1.5 dB to exceed 90% of the rms data values. Multiply by 0.62 to convert km to miles.
The nominal ranges to the decibel thresholds 140, 130 and 120 dB re 1 μPa (rms) for the Theresa Marie were computed from the line fit to data shown in Figure 53. These ranges are listed in Table 23.
Table 23. Sound level threshold distances for the Theresa Marie at 10.5 kts. rms SPL (dB re 1 µPa) Best fit range (m) 90th percentile range (m)
140 16* 24* 130 250 370 120 3900 5800
*Extrapolated from minimum measurement range of 100 m (330 ft).
Seismic Survey – Como Site Sound Speed Profile Measurements
Sound speed profiles were measured at each OBH deployment site using a SBE-19 CTD profiler. Two profiles were measured at each station on 5 September and 6 September during deployment and retrieval, respectively. Measurements of temperature and salinity as a function of depth from the SBE-19 were converted to speed of sound in water using the standard oceanographic formulas of Chen and Millero (1997). Table 24 lists the times and locations of the twelve CTD casts taken during the current study. Plots of all twelve sound speed profiles (two for each OBH station) are presented in Figure 54. Note that the pressure sensor on the SBE-19 profiler limited the maximum measurement depth to 150 meters (490 ft).

3-46 Monitoring in the Chukchi & Beaufort Seas: Shell Offshore, 2008
The CTD data obtained during the SSV measurements showed that the sound velocity profiles at the SSV test sites were either uniform (no change in sound velocity) or downward refracting (decreasing sound velocity with depth). At the shallow OBH locations A, B, C, and E (19-21 m, or 62-69 ft depth) the sound speed profile was approximately uniform, indicating that the water layers were well mixed due to wind and wave action. At OBH F (41 m, or 130 ft depth) the sound speed profile exhibited an overall downward refracting shape with sharp depth variations. The strong transitions were caused by rapid temperature changes with depth. At OBH D (240 m, or 790 ft depth) the overall shape of the sound speed profile was downward refracting; the sound speed near the sea surface was ~20 m/s greater than at 150 m (490 ft) depth at this location. Downward refracting sound speed profiles tend to increase acoustic propagation loss with range due to increased bottom interactions that lead to more acoustic energy loss upon reflections from the seabed.
Table 24 - Times, locations, and water depths of the twelve temperature and salinity profile casts obtained during the present study.
Station Time (AKDT) Latitude Longitude Max Depth (m) OBH A 5/Sep/08 11:16 70º 58.7’N 151º 25.5’W 19 OBH A 6/Sep/08 12:28 70º 58.7’N 151º 25.5’W 19 OBH B 5/Sep/08 12:38 70º 59.4’N 151º 25.3’W 19 OBH B 6/Sep/08 12:54 70º 59.4’N 151º 25.3’W 19 OBH C 5/Sep/08 13:32 71º 02.0’N 151º 19.8’W 21 OBH C 6/Sep/08 13:51 71º 02.0’N 151º 19.8’W 21 OBH D 5/Sep/08 16:12 71º 18.2’N 151º 26.5’W 87* OBH D 6/Sep/08 17:45 71º 18.2’N 151º 26.5’W 150* OBH E 5/Sep/08 10:29 71º 00.5’N 151º 36.8’W 19 OBH E 6/Sep/08 11:25 71º 00.5’N 151º 36.8’W 19 OBH F 5/Sep/08 07:03 71º 14.5’N 152º 43.9’W 41 OBH F 6/Sep/08 08:08 71º 14.5’N 152º 43.9’W 41
*Depths are different here because of a lack of rope on 5-Sep. Also, the maximum operating depth of the CTD profiler was 150 m (490 ft).

Chapter 3: Underwater Sound Measurements 3-47
Figure 54 – Water sound speed profiles measured at each of the OBH deployment sites during the SSV study at the Como site. Note that sound speed was computed from in situ temperature and salinity measurements. Blues lines are data from 5-Sep and red lines are data from 6-Sep. Divide by 0.305 to convert m to feet.

3-48 Monitoring in the Chukchi & Beaufort Seas: Shell Offshore, 2008
Airgun Array Measurements Full 3147 in3 Airgun Array
Ranges from the 3147 in3 airgun array to the OBH recording positions were computed for the times corresponding to each shot using the P190S navigation logs supplied by the Gilavar upon completion of the SSV track line.
A plot of the forward-endfire SPL data for Gilavar’s 3147 in3 airgun array is shown in Figure 55. The forward-endfire data were obtained on OBHs A, E, and F. A plot of the broadside SPL data for Gilavar’s 3147 in3 airgun array is shown in Figure 56. The broadside data were obtained on OBHs A, B, and C. The broadside measurement plot shows data points extracted from the overall datasets at the time corresponding to the approach and passing by Gilavar past point X, the CPA (ref. Figure 5).
No shots from Gilavar’s arrays could be detected on OBH D, due to masking by other airgun signals from a different seismic survey which was operating in the Beaufort at the time of the SSV tests. The source of the interfering airgun signals could not be identified at the time of reporting, since several other seismic surveys were being conducted in the Beaufort; however, the shot interval, and start and stop times of the masking airgun signals did not match those of the survey at the Como site. Due to the presence of this interfering signal, the 120 dB level of the 3147 in3 could not be directly measured at OBH D as planned. However, the level of the interfering airgun pulses was approximately 120 dB; therefore, sound levels from Gilavar’s 3147 in3 array must have been less than 120 dB at OBH D.
Figure 55. Peak, rms, and SEL for airgun pulses received from array forward endfire on OBHs A, E, and F. Solid line is best fit of the empirical function to rms values. Dashed line represents a shift of the best-fit line by +3.5 dB to exceed 90% of the rms data values. Multiply by 0.62 to convert km to miles.

Chapter 3: Underwater Sound Measurements 3-49
Figure 56. Peak, rms, and SEL for airgun pulses received from array broadside on OBHs A, B and C at 640, 2100 and 8000 m (0.4, 1.3, and 5 mi). Solid line is best fit of the empirical function to rms values. Dashed line is the best-fit line shifted by +1.2 dB to exceed 90% of data values. Multiply by 0.62 to convert km to miles. Mitigation Gun
The peak, rms, and SEL were also calculated for the mitigation airgun which was used at the end of the seismic line. Shot SPLs computed from OBH systems E and F were plotted against the corresponding source-receiver ranges in Figure 57. Sound emissions from the mitigation airgun are the same in all directions and so therefore only a single plot of SPL versus range is presented for this source.
Figure 57. Peak, rms, and SEL versus distance from the mitigation airgun. Solid line is best fit of the empirical function to rms values. Dashed line is the best-fit line shifted by 1.6 dB to exceed 90% of data values. Multiply by 0.62 to convert km to miles.

3-50 Monitoring in the Chukchi & Beaufort Seas: Shell Offshore, 2008
Ranges to Threshold Levels The nominal ranges to the rms SPL thresholds of 190, 180, 170, 160, 150, 140, 130, and 120 dB re
1 µPa were estimated from the curve fits to the airgun data presented in the above two sections. Thresholds ranges for the forward-endfire direction from the full 3147 in3 airgun array are presented in Table 25. Thresholds ranges for the broadside direction from the full 3147 in3 airgun array are presented in Table 26. Thresholds ranges for the 30 in3 mitigation airgun are presented in Table 27.
Table 25. Forward-endfire sound level threshold distances for the full 3147 in3 airgun array. rms SPL (dB re 1 µPa) Best fit range (m) 90th percentile range (m)
190 24 (†) 51 (†) 180 210 440 170 1500 2800 160 6700 9600 150 16000 20000 140 27000 32000 130 40000 45000 120 54000 58000
(†) Distances to the 190 dB re µPa level were extrapolated from data at longer ranges.
Table 26. Broadside sound level threshold distances for the full 3147 in3 airgun array. rms SPL (dB re 1 µPa) Best fit range (m) 90th percentile range (m)
190 770 920 180 2,500 2,900 170 5,500 5,900 160 9,000 9,500 150 – (†) – (†) 140 – (†) – (†) 130 – (†) – (†) 120 ≤ 45,000 (‡) ≤ 45,000 (‡)
(†) Due to the presence of interfering airgun signals on OBH D (45 km, or 28 mi, range at CPA), broadside threshold ranges between 150 dB and 130 dB re 1 µPa could not be accurately estimated.
(‡) The level of the interfering airgun signals on OBH D was approximately 120 dB re µPa. Therefore the 120 dB re 1 µPa threshold range for was constrained to less than 45 km, or 28 mi, from the array.

Chapter 3: Underwater Sound Measurements 3-51
Table 27. Broadside sound level threshold distances for the 30 in3 mitigation airgun. rms SPL (dB re 1 µPa) Best fit range (m) 90th percentile range (m)
190 10 (†) 13 (†) 180 46 59 170 210 270 160 910 1,100 150 3,100 3,700 140 7,800 8,800 130 15,000 16,000 120 23,000 24,000
(†) Distances to the 190 dB re 1 µPa level were extrapolated from data at longer ranges.
Cumulative SEL The cumulative SEL metric was calculated for one seismic survey line at OBHs A, B, and C. SEL
values were taken from the broadside test tracks (ref. Figure 5) because the higher levels caused by the strong directional lobe of the array at the CPA provide the most conservative estimate of cumulative SEL. Various types of M-weighting were also applied to the SEL values before summing to provide M-weighted cumulative SEL. The plots below show the flat and M-weighted cumulative SEL curves as they evolve with the progression of the survey line, as well as flat-weighted per shot SEL values for comparison. Each plot is specific to an OBH; in aggregate they provide an indication of the cumulative SEL at different distances from a seismic survey line. Figure 61 is a map showing the relative locations of the receivers to the shot points.

3-52 Monitoring in the Chukchi & Beaufort Seas: Shell Offshore, 2008
Figure 58. Flat and M-weighted cumulative SEL with flat-weighted per shot SEL from OBH A, 640 m (0.4 mi) off the survey line.
Figure 59. Flat and M-weighted cumulative SEL with flat-weighted per shot SEL from OBH B, 2 km (1.2 mi) off the survey line.
Figure 60. Flat and M-weighted cumulative SEL with flat-weighted per shot SEL from OBH C, 8 km (5 mi) off the survey line.

Chapter 3: Underwater Sound Measurements 3-53
Figure 61. Map of the seismic survey line with the first, last, and CPA shot points and OBH locations used in the calculation of cumulative SEL.
The received per-shot SEL levels change over the length of the test track due to the changing source-receiver range and also because of airgun array directivity. The directivity was maximum at array broadside which was sampled by the line of OBHs as the seismic vessel passed the CPA. Table 28 provides the maximum cumulative SEL for each receiver, and Figure 62 shows these maxima as a function of distance off the survey line.
Table 28. Maximum cumulative SEL for each OBH off the seismic survey line. Cumulative SEL (dB re 1 µPa2s) Distance off
seismic survey line Flat-weighted Low Frequency
Cetaceans Mid-Frequency
Cetaceans
High Frequency Cetaceans
Pinnipeds underwater
640 m 189.5 189.5 185.5 183.7 188.0 2 km 186.7 186.6 182.9 181.2 185.4 8 km 174.2 174.2 171.6 170.3 173.4

3-54 Monitoring in the Chukchi & Beaufort Seas: Shell Offshore, 2008
Figure 62. Cumulative SEL as a function of perpendicular distance off the survey line. Multiply by 0.62 to convert km to miles. Airgun Array Directivity Effects
Due to the prominent directivity of the 3147 in3 airgun array, the broadside threshold distances were observed to be significantly higher than the endfire threshold distances at the 190 dB and 180 dB levels (ref. Table 25 and Table 26). This result is due to stronger directivity observed during this SSV measurement. Figure 63 shows the SPL increase inside the broadside lobe of the array, measured during the passage of Gilavar past OBH A and OBH B. The rms SPL values at the broadside maximum were approximately 12-18 dB greater than levels outside the main lobe of the array. This result is also partially due to a shortening of the pulse duration in the broadside direction that affects the rms level computation (ref. Figure 64), however it is primarily caused by directivity. Interestingly the broadside levels were higher, and endfire levels lower, than measurements obtained at deeper water sites for the same array during SSV measurements in 2007 and 2008. We attribute the difference observed here to the shallower water conditions at the Como prospect area than at previous measurement sites. We performed an initial analysis that is more detailed than included in past field SSV reports to examine the reasons for the pronounced directivity measured. It appears that the spectral energy received at least between 600 m (0.37 mi) and 3 km (1.9 mi) is concentrated and enhanced around 200 Hz with lower frequencies somewhat suppressed. Array directivity is known to be much stronger at these higher frequencies, and that has produced a strong difference between the broadside and endfire directions. Measured endfire levels were lower than expected considering the endfire direction is a secondary preferred directive direction. It is possible that the array may have been oriented slightly off the tow direction which would cause the endfire lobe to lie slightly off the survey tow line and away from OBH-E. The lower endfire levels may also have been caused by an unknown bathymetric feature. It is noted that the endfire levels in either case would be lower than broadside. Since the safety radii were based on the broadside measurements, they were still conservative.

Chapter 3: Underwater Sound Measurements 3-55
Figure 63 - Peak, rms and SEL levels on OBH A and OBH B SPLs from the 3147 in3 airgun array showing rapid increases to much higher broadside levels. Received levels are indicated as either inside the broadside lobe of the array (+/- 40º) or outside the broadside lobe of the array. Multiply by 0.62 to convert km to miles.
The rapid increase in sound levels as the OBH receivers passed through the array’s broadside directivity lobe was primarily responsible for the larger broadside distances to thresholds at Como prospect. Figure 64 shows examples of two airgun pulse waveforms and power spectra measured in the broadside lobe (top) and outside the broadside lobe (bottom), at similar distance from the array (685 m, or 2250 ft, directly broadside, 735 m, or 2410 ft, 22 degrees off broadside). If directivity were not present we would expect the two signals to have similar amplitude and spectra. The power spectra of these pulses (right) show that the most of the increase in the broadside levels occurred in a narrow frequency range between 150 Hz and 250 Hz. The spectral levels at all higher frequencies remain higher in the broadside measurement. The increase at these frequencies was due to the coherent addition of the airgun signals as the three array substrings aligned at array broadside. The directivity of the array at mid-range frequencies was more pronounced at this SSV test site due to the rapid attenuation of low frequencies, less than 100 Hz, in the shallow environment near Como prospect (~20 m, or ~66 ft, water depth).

3-56 Monitoring in the Chukchi & Beaufort Seas: Shell Offshore, 2008
Figure 64 - Pressure waveforms and spectra for the 3147 in3 airgun array measured at OBH A directly on the broadside axis of the array (top) and 22º off the broadside axis of the array (bottom). Left hand plots are time domain pressure signatures and right hand plots are frequency domain power spectra. The red lines delimit the 90% energy period of the airgun pulses. Airgun Shot Spectra and Spectrograms
Airgun pulses detected at various ranges were analyzed to show their spectral components and are presented in Figure 65 to Figure 69 below. Pulses at the same range measured from the forward-endfire direction as the broadside pulses are also plotted to see the directivity differences. Spectrograms for the same pulses are presented in Figure 70 to Figure 74. This shows the evolution of frequency with time for each pulse.
Figure 65. Airgun pulse waveform and spectrum at 640 m (0.4 mi) range from the broadside direction.

Chapter 3: Underwater Sound Measurements 3-57
Figure 66. Airgun pulse waveform and spectrum at 2.1 km (1.3 mi) range from the broadside direction.
Figure 67. Airgun pulse waveform and spectrum at 2.1 km (1.3 mi) range from the endfire direction.
Figure 68. Airgun pulse waveform and spectrum at 8 km (5 mi) range from the broadside direction.

3-58 Monitoring in the Chukchi & Beaufort Seas: Shell Offshore, 2008
Figure 69. Airgun pulse waveform and spectrum at 8 km (5 mi) range from the endfire direction.
Figure 70. Spectrogram of an airgun pulse recorded on OBH A at 640 m (0.4 mi) range corresponding to the broadside direction.
Figure 71. Spectrogram of an airgun pulse recorded on OBH B at 2.1 km (1.3 mi) range corresponding to the broadside direction.

Chapter 3: Underwater Sound Measurements 3-59
Figure 72. Spectrogram of an airgun pulse recorded on OBH E at 2.1 km (1.3 mi) range corresponding to the endfire direction.
Figure 73. Spectrogram of an airgun pulse recorded on OBH C at 8 km (5 mi) range corresponding to the broadside direction.

3-60 Monitoring in the Chukchi & Beaufort Seas: Shell Offshore, 2008
Figure 74. Spectrogram of an airgun pulse recorded on OBH E at 8 km (5 mi) range corresponding to the endfire direction. 1/3 Octave Band Levels
Figure 75 shows a contour plot of 1/3 octave band pressure levels, versus range and frequency as measured on OBH A (ref. Figure 5). This contour plot shows the spectral distribution of sound energy for an OBH recorder, and also shows which frequencies dominated sound propagation at the test site. Note that frequencies between 200 and 400 Hz show the strongest propagation with range.
Figure 75. 1/3-octave band pressure levels as a function of range and frequency as recorded on OBH A. Multiply by 0.62 to convert km to miles.

Chapter 3: Underwater Sound Measurements 3-61
RMS Length Data from OBHs A and B were analyzed to see how rms pulse duration varied with range over the
entire test survey track line (ref. Figure 5). This data set includes both broadside (at close ranges) and endfire data. The strong increase in rms level and decrease in pulse length at distances of less than 1 km (0.62 mi) is due to the strong directivity characteristics of the airgun array.
Figure 76. 90% pulse duration and rms level as a function of range as measured on OBH A for the full seismic survey test line. Multiply by 0.62 to convert km to miles.
Figure 77. 90% pulse duration and rms level as a function of range as measured on OBH B for the full seismic survey test line. Multiply by 0.62 to convert km to miles. Shallow Hazards – Camden Bay Alpha Helix Airgun Measurements
Figure 78 and Figure 79 respectively present the measurements for the 2 x 10 in3 airgun array and single 10 in3 airgun. Neither the 2 x 10 in3 airgun array nor the 10 in3 airgun are characterized by a strong directional component; both sources have similar sound emission levels in the endfire and the broadside directions. For the 1 x 10 in3 airgun array the absorptive loss coefficient was set to zero to obtain the best fit.

3-62 Monitoring in the Chukchi & Beaufort Seas: Shell Offshore, 2008
Figure 78. Peak, rms and per-shot SEL levels versus range from the 2 x 10 in3 airgun array. Solid line is least squares best fit to rms values. Dashed line represents best fit line increased by 2.8 dB to exceed 90% of all rms values (90th-percentile fit). Multiply by 0.62 to convert km to miles.
Figure 79. Peak, rms and per-shot SEL levels versus range from the 1 x 10 in3 airgun array. Solid line is least squares best fit to rms values. Dashed line represents best fit line increased by 3.5 dB to exceed 90% of all rms values. Multiply by 0.62 to convert km to miles.
The nominal ranges to the decibel thresholds 190, 180, 170, 160 and 120 dB re 1 µPa (rms) were
computed using the best and 90th percentile equation fits presented in Figure 78 for the 2 x 10 in3 gun array and in Figure 79 for the single airgun. These ranges are listed in Table 29 and Table 30, respectively.

Chapter 3: Underwater Sound Measurements 3-63
Table 29. Sound threshold level distances for 190, 180, 170, 160 and 120 dB re 1 µPa (rms) from 2 x 10 in3 airgun array.
rms SPL (dB re 1 µPa) Best fit range (m) 90th percentile range (m) 190 34* 45* 180 91* 120* 170 240 320 160 630 830 120 15000 18000
*Extrapolated from minimum measurement range of 190 m (620 ft).
Table 30. Sound threshold level distances for 190, 180, 170, 160 and 120 dB re 1 µPa (rms) from single 10 in3 airgun.
rms SPL (dB re 1 µPa) Best fit range (m) 90th percentile range (m) 190 40* 53* 180 90* 120* 170 200 260 160 440 590 120 11000 14000
*Extrapolated from minimum measurement range of 190 m (620 ft).
3.5 kHz Geopulse Profiler Figure 80 presents the measurements for the Geopulse sub-bottom profiler. The Geopulse profiler
operating frequency was 3.5 kHz and produced much lower pressure levels than the airgun systems. A 1 kHz high pass filter was applied to the sub-bottom profiler pressure data prior to metrics calculations to isolate the profiler signal from low frequency vessel sounds. For these analyses, data measured in all directions and depths were combined.
Figure 80. Peak, rms and per-pulse SEL levels versus range from the Geopulse sub-bottom profiler. Solid line is least squares best fit to rms values. Dashed line represents best fit line increased by 2.3 dB to exceed 90% of all rms values. Multiply by 0.62 to convert km to miles.

3-64 Monitoring in the Chukchi & Beaufort Seas: Shell Offshore, 2008
The nominal ranges to the decibel thresholds 160, 150, 140, 130 and 120 dB re 1 µPa (rms) were computed using the best and 90th percentile equation fits presented in Figure 80. These ranges are listed in the Table 31.
Table 31. Sound threshold level distances for 160, 150, 140, 130 and 120 dB re 1 µPa (rms) from the Geopulse sub-bottom profiler.
rms SPL (dB re 1 µPa) Best fit range (m) 90th percentile range (m) 190 11* 14* 180 25* 30* 170 54* 65* 160 120* 140* 120 260 310
*Extrapolated from minimum measurement range of 190 m (620 ft).
Alpha Helix Figure 81 presents sound measurements for the RV Alpha Helix sailing at 4.5 kts. During this pass,
the 2 x 10 in3 airgun array was also operating. The sound signal from the ship alone was extracted from the measured sounds in the last second before each airgun shot. This approach analyzed times at which the airgun shot reverberation had decayed to below vessel sound level.
Figure 81. Sound pressure level (rms) versus range from the RV Alpha Helix sailing at 4.5kts. Measurements taken between 2 x 10 in3 airgun array shots. Solid line is least squares best fit. Dashed line represents best fit line increased by 1.8 dB to exceed 90% of all values. Multiply by 0.62 to convert km to miles.
The nominal ranges to the decibel thresholds 150, 140, 130 and 120 dB re 1 µPa (rms) for the RV Alpha Helix were computed using the best and 90th percentile equation fits presented in Figure 81. These ranges are listed in Table 32.

Chapter 3: Underwater Sound Measurements 3-65
Table 32. Sound threshold level distances for 120-150 dB re 1 µPa (rms) for the RV Alpha Helix sailing at 4.5 kts during operation of the 2 x 10 in3 airgun array.
rms SPL (dB re 1 µPa) Best fit range (m) 90th percentile range (m) 150 1* 1* 140 7* 11* 130 74* 110 120 730 1100
*Extrapolated from minimum measurement range of 90 m (295 ft).
Henry C Airgun Measurements
Figure 82 and Figure 83 present the measurements for the 2 x 10 in3 airgun array and single 10 in3 airgun, respectively. Neither the 2 x 10 in3 airgun array nor the 10 in3 airgun are characterized by a strong directional component; both sources have similar sound emission levels in the endfire and the broadside directions.
Figure 82. Peak, rms and per-shot SEL levels versus range from the 2 x 10 in3 airgun array. Solid line is least squares best fit to rms values. Dashed line represents best fit line increased by 2.3 dB to exceed 90% of all rms values (90th-percentile fit). Multiply by 0.62 to convert km to miles.

3-66 Monitoring in the Chukchi & Beaufort Seas: Shell Offshore, 2008
Figure 83. Peak, rms and per-shot SEL levels versus range from the 1 x 10 in3 airgun array. Solid line is least squares best fit to rms values. Dashed line represents best fit line increased by 1.6 dB to exceed 90% of all rms values. Multiply by 0.62 to convert km to miles.
The nominal ranges to the decibel thresholds 190, 180, 170, 160 and 120 dB re 1 µPa (rms) were computed using the best and 90th percentile equation fits presented in Figure 82 for the 2 x 10 in3 gun array and in Figure 83 for the single 10 in3 airgun. These ranges are listed in Table 33 and Table 34, respectively.
Table 33. Sound threshold level distances for 190, 180, 170, 160 and 120 dB re 1 µPa (rms) from 2 x 10 in3 airgun array.
rms SPL (dB re 1 µPa) Best fit range (m) 90th percentile range (m) 190 7* 10* 180 27* 37* 170 100 140 160 370 490 120 15000 16000
*Extrapolated from minimum measurement range of 90 m (295 ft).
Table 34. Sound threshold level distances for 190, 180, 170, 160 and 120 dB re 1 µPa (rms) from single 10 in3 airgun.
rms SPL (dB re 1 µPa) Best fit range (m) 90th percentile range (m) 190 4* 4* 180 14* 18* 170 57* 72* 160 230 280 120 14000 16000
*Extrapolated from minimum measurement range of 90 m (295 ft).

Chapter 3: Underwater Sound Measurements 3-67
Sub-bottom Profilers Figure 84 presents the measurements for the Datasonics SPR-1200 Bubble Pulser sub-bottom
profiler. Figure 85 presents the results from the ODEC Strata Box sub-bottom profiler. The Strata Box profiler operating frequency was 3.5 kHz, so in order to isolate the profiler signal from other noise sources (e.g. noise from ship), a 1 kHz high pass filter was applied to the waveform prior to metrics calculations. For these analyses, data measured in all directions and depths were combined.
Figure 84. Peak, rms and per-pulse SEL levels versus range from the Bubble Pulser sub-bottom profiler. Solid line is least squares best fit to rms values. Dashed line represents best fit line increased by 2.7 dB to exceed 90% of all rms values. Multiply by 0.62 to convert km to miles.
Figure 85. Peak, rms and per-pulse SEL levels versus range from the ODEC Strata Box sub-bottom profiler. Solid line is least squares best fit to rms values. Dashed line represents best fit line increased by 2.0 dB to exceed 90% of all rms values. Multiply by 0.62 to convert km to miles.

3-68 Monitoring in the Chukchi & Beaufort Seas: Shell Offshore, 2008
The nominal ranges to the decibel thresholds 160, 150, 140, 130 and 120 dB re 1 µPa (rms) were computed using the best and 90th percentile equation fits presented in Figure 84 and Figure 85 for the sub-bottom profilers. These ranges are listed in Table 35 and Table 36. The 90% rms sound pressure levels of these profilers did not reach 180 dB re 1 µPa (rms). The source levels for the Bubble Pulser and Strata Box profilers, based on extrapolation to 1 m from the minimum measurement range of 94 m (308 ft), are respectively estimated to be only 177 and 167 dB re 1 µPa (rms).
Table 35. Sound threshold level distances for 160, 150, 140, 130 and 120 dB re 1 µPa (rms) from Datasonics SPR-1200 Bubble Pulser sub-bottom profiler.
rms SPL (dB re 1 µPa) Best fit range (m) 90th percentile range (m) 160 6* 9* 150 23* 34* 140 86* 120 130 310 430 120 1000 1400
*Extrapolated from minimum measurement range of 90 m (295 ft).
Table 36. Sound threshold level distances for 160, 150, 140, 130 and 120 dB re 1 µPa (rms) from the ODEC Strata Box sub-bottom profiler.
rms SPL (dB re 1 µPa) Best fit range (m) 90th percentile range (m) 160 2* 3* 150 9* 12* 140 40* 53* 130 170 230 120 740 980
*Extrapolated from minimum measurement range of 90 m (295 ft).

Chapter 3: Underwater Sound Measurements 3-69
Henry C Figure 86 and Figure 87 present sound measurements for the Henry-C sailing at 3.5 kts and 10 kts
respectively. During the 3.5 kts pass, the 2 x 10 in3 airgun array was also operating. The sound signal from the ship alone was extracted in between the gun shots.
Figure 86. Sound pressure level (rms) versus range from the MV Henry Christofferson sailing at 3.5kts while operating the 2 x 10 in3 airgun array. Solid line is least squares best fit. Dashed line represents best fit line increased by 1.2 dB to exceed 90% of all values. Multiply by 0.62 to convert km to miles.
Figure 87. Sound pressure level (rms) versus range from the MV Henry Christofferson sailing at full speed (10 kts). Solid line is least squares best fit. Dashed line represents best fit line increased by 2.6 dB to exceed 90% of all values. Multiply by 0.62 to convert km to miles.

3-70 Monitoring in the Chukchi & Beaufort Seas: Shell Offshore, 2008
The nominal ranges to the decibel thresholds 150, 140, 130 and 120 dB re 1 µPa (rms) for the Henry-C were computed using the best and 90th percentile equation fits presented in Figure 86 and Figure 87. These ranges are listed in
Table 37 and Table 38.
Table 37. Sound threshold level distances for 120-150 dB re 1 µPa (rms) for the MV Henry Christofferson sailing at 3.5 kts during operation of the 2 x 10 in3 airgun array.
rms SPL (dB re 1 µPa) Best fit range (m) 90th percentile range (m) 150 - - 140 13* 18* 130 170 240 120 2300 3100
*Extrapolated from minimum measurement range of 90 m (295 ft).
Table 38. Sound threshold level distances for 120-150 dB re µPa (rms) for the MV Henry Christofferson sailing at full speed (10 kts).
rms SPL (dB re 1 µPa) Best fit range (m) 90th percentile range (m) 150 6* 11* 140 46* 77* 130 330 550 120 2400 4000
*Extrapolated from minimum measurement range of 90 m (295 ft).
Shallow Hazards – Chukchi Sea Alpha Helix 3.5 kHz Geopulse Profiler
Figure 88 presents the peak, 90% rms and per-pulse SEL levels versus range for the 3.5 kHz sub-bottom profiler as well as the best-fit and 90th percentile trend lines and the equations thereof. This source exhibits a fairly complex sound level decay with distance, with a local increase around 300 m (980 ft) range which may be due to interference effects due to the pure tonal sound and reflections from the seabed. Nonetheless a satisfactory trend line can be fitted to the distribution, and the 90th percentile line does account for the greater variability.

Chapter 3: Underwater Sound Measurements 3-71
Figure 88. Peak, rms and per-shot SEL levels versus range from the sub-bottom profiler (3.5 kHz). The solid line is the least squares best fit to the rms values. The dashed line represents the best fit line increased by 2.1 dB to exceed 90% of all rms values. Multiply by 0.62 to convert km to miles.
The nominal ranges to the decibel thresholds 160, 150, 140, 130 and 120 dB re 1 µPa (rms) were computed using the best and 90th percentile equation fits presented in Figure 88. These ranges are listed in Table 39.
Table 39. Sound threshold level distances for 160, 150, 140, 130 and 120 dB re 1 µPa (rms) for the sub-bottom profiler (3.5 kHz).
rms SPL (dB re 1 µPa) Best fit range (m) 90th percentile range (m) 160 5* 6* 150 15* 19* 140 47* 60* 130 150* 190* 120 480 610
*Extrapolated from minimum measurement range of 200 m (660 ft).
Alpha Helix Figure 6 presents the rms levels versus range for the Alpha Helix vessel noise alone, as well as the
best-fit and 90th percentile trend lines and the equations thereof.
The distances to the sound level thresholds of 140, 130, 120, 110 and 100 dB re 1 μPa (rms) are listed in Table 40. Note that for the vessel sound level the thresholds scale in this table has been shifted to a
lower range compared to the louder impulsive source. The distances to 100 dB re 1 μPa (rms) are extrapolated and should be considered as purely indicative.

3-72 Monitoring in the Chukchi & Beaufort Seas: Shell Offshore, 2008
Figure 89. Sound pressure level (rms) versus range from the Alpha Helix sailing at 4.5 kts. The solid line is the least squares best fit to the rms values. The dashed line is the best fit increased by 2.0 dB to exceed 90% of all the rms values. Multiply by 0.62 to convert km to miles.
Table 40. Sound threshold level distances for 100-140 dB re 1 µPa (rms) for the Alpha Helix sailing at 4.5 kts.
rms SPL (dB re 1 µPa) Best fit range (m) 90th percentile range (m) 140 7* 9* 130 46* 67* 120 320 470 110 2300 3300 100 16000‡ 24000‡
*Extrapolated from minimum measurement range of 200 m (660 ft). ‡Extrapolated from maximum measurement range of 8000 m (5 mi).
Cape Flattery Airgun Measurements
Figure 90 to Figure 92 present the peak, 90% rms and per-pulse SEL levels versus range for each airgun array configuration as well as the best-fit and 90th percentile trend lines and the equations thereof. Unlike larger arrays with numerous airguns that are characterized by strong directional components, these sources have similar sound emission levels in all azimuthal directions.

Chapter 3: Underwater Sound Measurements 3-73
Figure 90. Peak, rms and per-shot SEL levels versus range from the 4 x 10 in3 airgun array. The solid line is the least squares best fit to the rms values. The dashed line represents the best fit line increased by 1.2 dB to exceed 90% of all the rms values (90th-percentile fit). Multiply by 0.62 to convert km to miles.
Figure 91. Peak, rms and per-shot SEL levels versus range from the 2 x 10 in3 airgun array. The solid line is the least squares best fit to the rms values. The dashed line represents the best fit line increased by 1.0 dB to exceed 90% of all the rms values (90th-percentile fit). Multiply by 0.62 to convert km to miles.

3-74 Monitoring in the Chukchi & Beaufort Seas: Shell Offshore, 2008
Figure 92. Peak, rms and per-shot SEL levels versus range from the single 10 in3 airgun. The solid line is the least squares best fit to the rms values. The dashed line represents the best fit line increased by 1.2 dB to exceed 90% of all the rms values (90th-percentile fit). Multiply by 0.62 to convert km to miles.
The nominal ranges to the sound level thresholds of 190, 180, 170, 160 and 120 dB re 1 μPa (rms) were computed using the best and 90th percentile equation fits shown in the previous figures. These distances are listed in Table 41 through Table 43. It should be noted that the ranges at both extremes of these threshold levels fall outside the span of distances that were actually sampled during the measurements. The values obtained from the regression curves are therefore extrapolates and thus affected by greater numerical uncertainty. The counterintuitive results for the 120 dB re 1 μPa threshold distances seen in Table 41 and Table 42, where the two-airgun configuration is estimated to have a slightly larger radius than the four-airgun source, should probably be regarded as an indication of this uncertainty rather than as an actual physical phenomenon.
Table 41. Sound threshold level distances to 190, 180, 170, 160 and 120 dB re 1 μPa (rms) for the 4 x 10 in3 airgun array.
rms SPL (dB re 1 µPa) Best fit range (m) 90th percentile range (m) 190 45* 50* 180 140* 160* 170 430 490 160 1200 1400 120 23000‡ 24000‡
*Extrapolated from minimum measurement range of 194 m (640 ft). ‡Extrapolated from maximum measurement range of 15000 m (9.3 mi).

Chapter 3: Underwater Sound Measurements 3-75
Table 42. Sound threshold level distances to 190, 180, 170, 160 and 120 dB re 1 μPa (rms) for the 2 x 10 in3 airgun array.
rms SPL (dB re 1 µPa) Best fit range (m) 90th percentile range (m) 190 14* 17* 180 50* 62* 170 200* 230 160 730 830 120 24000‡ 25000‡
*Extrapolated from minimum measurement range of 208 m (680 ft). ‡Extrapolated from maximum measurement range of 15000 m (9.3 mi).
Table 43. Sound threshold level distances to 190, 180, 170, 160 and 120 dB re 1 μPa (rms) for a single 10 in3 airgun.
rms SPL (dB re 1 µPa) Best fit range (m) 90th percentile range (m) 190 7* 8* 180 28* 32* 170 100* 120* 160 380 440 120 15000 16000‡
*Extrapolated from minimum measurement range of 199 m (653 ft). ‡Extrapolated from maximum measurement range of 15000 m (9.3 mi).
3.5 kHz Sub-bottom Profiler Figure 93 presents the peak, 90% rms and per-pulse SEL levels versus range for the 3.5 kHz sub-
bottom profiler as well as the best-fit and 90th percentile trend lines and the equations thereof. This source exhibits a fairly complex sound level decay with distance, with local increases around 500 m and 1 km (660 and 3280 ft) ranges, which may be due to interference effects due to the pure tonal sound. Nonetheless a satisfactory trend line can be fitted to the distribution, and the 90th percentile line does account for the greater variability.
Figure 93: Peak, rms and per-shot SEL levels versus range from the sub-bottom profiler (3.5 kHz). The solid line is the least squares best fit to the rms values. The dashed line represents the best fit line increased by 4.2 dB to exceed 90% of all rms values. Multiply by 0.62 to convert km to miles.

3-76 Monitoring in the Chukchi & Beaufort Seas: Shell Offshore, 2008
The distances to the sound level thresholds of 160, 150, 140, 130 and 120 dB re 1 μPa (rms) are listed in Table 44.
Table 44: Sound threshold level distances for 160, 150, 140, 130 and 120 dB re 1 μPa (rms) for the sub-bottom profiler (3.5 kHz).
rms SPL (dB re 1 µPa) Best fit range (m) 90th percentile range (m) 160 11* 18* 150 33* 52* 140 98* 150 130 280 430 120 750 1100
*Extrapolated from minimum measurement range of 197 m (650 ft).
Bubble Pulser Figure 94 presents the peak, 90% rms and per-pulse SEL levels versus range for the 400 Hz bubble
pulser sub-bottom profiler as well as the best-fit and 90th percentile trend lines and the equations thereof. This source shows a relatively large amount of interpulse variation, which was in fact confirmed by the survey technicians on the Cape Flattery. Nonetheless a satisfactory trend line can be fitted to the distribution, and the 90th percentile line does account for the greater variability.
Figure 94: Peak, rms and per-shot SEL levels versus range from the bubble pulser (400 Hz). The solid line is the least squares best fit to the rms values. The dashed line represents the best fit line increased by 4.2 dB to exceed 90% of all rms values. Multiply by 0.62 to convert km to miles.
The distances to the sound level thresholds of 160, 150, 140, 130 and 120 dB re 1 μPa (rms) are listed in Table 45.

Chapter 3: Underwater Sound Measurements 3-77
Table 45: Sound threshold level distances for 160, 150, 140, 130 and 120 dB re 1 μPa (rms) from bubble pulser (400 Hz) sub-bottom profiler.
rms SPL (dB re 1 µPa) Best fit range (m) 90th percentile range (m) 160 1* 3* 150 7* 16* 140 48* 99* 130 260 460 120 900 1300
*Extrapolated from minimum measurement range of 151 m (495 ft).
Cape Flattery Figure 95 presents the rms levels versus range for the Cape Flattery vessel noise alone, isolated as
previously described from the noise trace of the vessel sailing at 4 kts while operating the 2-airgun array, as well as the best-fit and 90th percentile trend lines and the equations thereof.
The distances to the sound level thresholds of 140, 130, 120, 110 and 100 dB re 1 μPa (rms) are listed in Table 46. Note that for the vessel sound level the thresholds scale in this table has been shifted to a lower range compared to the louder impulsive sources. The distances to 100 dB re μPa (rms) are extrapolated and should be considered as purely indicative.
Figure 95: Sound pressure level (rms) versus range from the Cape Flattery (vessel noise alone) sailing at 4.0 kts while towing the airgun array. The solid line is the least squares best fit to the rms values. The dashed line is the best fit increased by 1.7 dB to exceed 90% of all the rms values. Multiply by 0.62 to convert km to miles.

3-78 Monitoring in the Chukchi & Beaufort Seas: Shell Offshore, 2008
Table 46: Sound threshold level distances for 100-140 dB re 1 μPa (rms) for the Cape Flattery (vessel noise alone) sailing at 4.0 kts while towing the airgun array.
rms SPL (dB re 1 µPa) Best fit range (m) 90th percentile range (m) 140 6* 9* 130 40* 56* 120 260 360 110 1700 2300 100 11000‡ 15000‡
*Extrapolated from minimum measurement range of 208 m (680 ft). ‡Extrapolated from maximum measurement range of 8000 m (5 mi).
Support Vessel Measurements – Prudhoe Bay and Barrow Norseman II
The Norseman II transited along the measurement track (ref. Figure 14) between 22:15 and 23:20 AKDT on 15 August 2008, beginning at 5 km (3.1 mi) range south of the OBH and ending at 15 km (9.3 mi) range to the north of the OBH position. The CPA to the OBH position was 105 m (344 ft). The sound levels dropped to the broadband (1 Hz to 24 kHz) background noise level range of approximately 87 to 92 dB re 1 μPa at approximately 10 km (6.2 mi) distance.
Figure 96. Best-fit equation fit (solid line) and 90th percentile fit (dashed line) of sound pressure level versus distance measurements for the Norseman II transiting at approximately 9.5 kts, measured 15 August 2008. Multiply by 0.62 to convert km to miles.
The distances to the sound level thresholds of 140, 130, 120, 110, and 100 dB re 1 μPa (rms) are listed below in Table 47.

Chapter 3: Underwater Sound Measurements 3-79
Table 47. Sound threshold level distances for 100-140 dB re 1 µPa for the Norseman II sailing at 17.6 km/h (9.5 kts).
rms SPL (dB re 1 µPa) Best fit range (m) 90th percentile range (m) 140 98 130 130 270 340 120 720 930 110 1900 2500 100 5200 6800
Arctic Seal
The Arctic Seal transited along the measurement track (ref. Figure 14) between 06:45 and 07:50ADT on 16 August 2008, beginning at 15 km (9.3 mi) range north of the OBH and ending at 5 km (3.1 mi) range south of the OBH position. The CPA to the OBH position was 35m (115 ft). The sound levels dropped to the broadband (1 Hz to 24 kHz) background noise level range of approximately 87 to 92 dB re 1 μPa at approximately 10 km (6.2 mi) distance.
Figure 97. Best-fit equation fit (solid line) and 90th percentile fit (dashed line) of sound pressure level versus distance measurements for the Arctic Seal transiting at approximately 10 kts measured 16 August 2008. Multiply by 0.62 to convert km to miles.
The distances to the sound level thresholds of 140, 130, 120, 110, and 100 dB re 1 μPa (rms) are listed below in Table 48.
Table 48. Sound threshold level distances for 100-140 dB re 1 µPa for the Arctic Seal sailing at 18.5 km/h (10 kts).
rms SPL (dB re 1 µPa) Best fit range (m) 90th percentile range (m) 140 84 110 130 240 320 120 660 890 110 1900 2500 100 5200 7000

3-80 Monitoring in the Chukchi & Beaufort Seas: Shell Offshore, 2008
Point Barrow
The Point Barrow transited along the measurement track (ref. Figure 14) between 04:00 and 05:58 AKDT on 16 August 2008, beginning at 15 km (9.3 mi) range north of the OBH and ending at 5 km (3.1 mi) range south of the OBH position. The CPA to the OBH position was 82 m (270 ft). The sound levels dropped to the broadband (1 Hz to 24 kHz) background noise level range of approximately 87 to 92 dB re 1 μPa at approximately 11 km (6.8 mi) distance.
Figure 98. Best-fit equation fit (solid line) and 90th percentile fit (dashed line) of sound pressure level versus distance measurements for the Point Barrow transiting at approximately 6 kts measured 16 August 2008. Multiply by 0.62 to convert km to miles.
The distances to the sound level thresholds of 140, 130, 120, 110, and 100 dB re 1 μPa (rms) are listed below in Table 49.
Table 49. Sound threshold level distances for 100-140 dB re 1 µPa for the Point Barrow sailing at 11.5 km/h (6.2 kts).
rms SPL (dB re 1 µPa) Best fit range (m) 90th percentile range (m) 140 29 88 130 110 330 120 410 1200 110 1500 4700 100 5700 17000
Annika Marie
The vessel GPS track log and OBH deployment location were used to compute the range from the vessel to the OBH throughout the measurement period. Vessel sound levels were computed in 1 second time windows stepped in 1 second increments. The sound pressure data were high-pass filtered at 10 Hz to remove some low frequency noise that may have been conducted from the surface tether. Figure 99 presents these filtered vessel sound levels as a function of distance from the recorder position to through the full sail track.

Chapter 3: Underwater Sound Measurements 3-81
Figure 99. Sound pressure level as a function of distance from Annika Marie sailing at 5 kts. Multiply by 0.62 to convert km to miles.
The vessel sound levels dropped to the broadband (10 Hz to 20 kHz) background noise level range of approximately 97 to 110 dB re 1 μPa at approximately 5 km (3.1 mi) distance. The lowest levels of background noise were near 97 dB re 1 μPa, and the lowest measured broadband noise levels continued to decrease to that level until the distance from the vessel reached almost 10 km (6.2 mi).
Fits of empirical SPL curves of the form Equation (3) were made to the data to obtain estimates of distances at which broadband vessel noise levels reached thresholds between 140 dB re 1 μPa and 100 dB re 1 μPa. The fits were made only to the first 3 km range data due to the interference of comparable ambient noise levels at greater distances Figure 100). The fit lines have been used to estimate the nominal distances at which sound levels reach certain thresholds between 140 and 100 dB re 1 μPa. These distances are presented in Table 50.
Figure 100. Best-fit equation fit (solid line) and 90th percentile fit (dashed line) to first 3 km (1.9 mi) of
sound pressure level versus distance measurements. Multiply by 0.62 to convert km to miles.

3-82 Monitoring in the Chukchi & Beaufort Seas: Shell Offshore, 2008
Table 50. Sound threshold level distances for 100-140 dB re 1 µPa for the Annika Marie sailing at 5 kts. rms SPL (dB re 1 µPa) Best fit range (m) 90th percentile range (m)
140 27 49 130 81 140 120 230 420 110 690 1200 100 2000 3600
Maxime
The maximum range of the Maxime from the OBH recorder was 15 km, or 9.3 mi, (8.1 nm). Nominal vessel transit speed during the SSV measurement was 8 kts. Vessel sound levels were computed in 1-second time windows stepped in 0.5-second increments. Figure 101 presents the vessel sound levels as a function of horizontal distance from the recorder position. Beyond 400 m (1310 ft) range, the vessel SPLs’ followed a different trend, producing inaccurate ranges to the higher levels. For this reason, only data recorded when the vessel was within 400 m (1310 ft) of the OBH are presented in Figure 101. Background noise levels at the measurement site were approximately 105 dB re 1 μPa (broadband). The background noise was primarily from other vessels and barges in the vicinity of Point Barrow at the time of the SSV test. The nominal ranges to the decibel thresholds 140, 130, 120, 110 and 100 dB re 1 μPa for the Maxime were computed from the 90% fit line shown in Figure 101. These ranges are listed in Table 51.
Figure 101 – Sound pressure levels versus distance from support vessel Maxime, sailing at 8 kts. Multiply by 0.62 to convert km to miles.

Chapter 3: Underwater Sound Measurements 3-83
Table 51. Sound level threshold horizontal distances for the support vessel Maxime sailing at 8 kts. rms SPL (dB re 1 µPa) Best fit range (m) 90th percentile range (m)
140 8* 11* 130 35 45 120 150 190 110 610 780 100 2500 3300
*Extrapolated from minimum horizontal measurement distance of 20 m (66 ft).
Conclusions The underwater sound measurement program for SOI’s 2008 Seismic and Shallow Hazards
Surveys provided high quality recordings of sounds from airgun arrays, mitigation guns, sub-bottom profilers, and vessels. Sound pressure data were analyzed to determine the distances to sound level thresholds that are required for the setting of exclusion or monitoring zones for marine mammals.
A further analysis of the airgun array data was performed to compute M-weighted cumulative SEL for the seismic shooting lines at the Kakapo and Como sites. This metric was recently proposed as an alternative to the rms metric that has been applied in the past for marine mammal take estimates (Southall et al., 2007). M-weighted cumulative SEL was computed at the OBH positions 500 m, 2 km, and 8 km (0.31, 1.2, and 5 mi) for the Kakapo site and 640 m, 2 km, and 8 km (0.4, 1.2, and 5 mi) for the Como site off the survey lines. The levels corresponding to those distances are shown in Table 53 for the Kakapo site and Table 57 for the Como site.
Additional analyses of airgun shot data is presented in this report as spectra, spectrograms, and 1/3 octave band levels as a function of range. The rms pulse durations were also computed and are presented for all endfire direction shots from both seismic surveys discussed.
Summary of Results Seismic Survey – Kakapo Site
The sound level measurement study for the Kakapo seismic survey program in the Chukchi Sea quantified sound levels produced by the main 3147 in3 airgun array source out to 100 km (62 mi) maximum range in the endfire direction and 37.5 km (23.3 mi) in the broadside direction, and from the single 30 in3 mitigation airgun to 37 km (23 mi) range. The full array pressure data were analyzed to determine the distances in the forward endfire and broadside directions to sound level thresholds: 190, 180, 170, 160 and 120 dB re 1 μPa (rms). The threshold distances were also determined for the mitigation airgun. These distances are given in Table 52.
Measurements of sound levels produced by the seismic vessel MV Gilavar and support vessels Norseman II, Gulf Provider, Torsvik, and Theresa Marie were made immediately prior to the airgun array measurements. Ranges to vessel noise levels of 120 dB re 1 μPa (rms) are presented for these vessels in Table 61.
Airgun shot spectra and spectrograms (Figure 27 to Figure 40) show most of the pulse energy occurs between 10 Hz and 1000 Hz. Modal dispersion starts to become apparent at about 8 km (5 mi) range (Figure 37 and Figure 38) with at least three modes supported by the environment. At 35 km (22 mi) range (Figure 39 and Figure 40), modal dispersion is very strong with 3-4 modes supported. The

3-84 Monitoring in the Chukchi & Beaufort Seas: Shell Offshore, 2008
length of the pulse also is much larger at this range which can be seen in the waveform plots (Figure 32 and Figure 33) and the spectrograms (Figure 39 and Figure 40).
Table 52. Sound level threshold distances for the 3147 in3 airgun array and mitigation gun from seismic vessel Gilivar at the Kakapo site.
rms SPL (dB re 1 µPa) 190 180 170 160 120 Best Fit 370 1100 3200 7900 110000 3147 in3 Airgun Array Endfire Range (m)
90th Percentile 450 1400 3800 9100 120000 Best Fit 540 1700 5100 12000 75000*
3147 in3 Airgun Array Broadside Range (m) 90th Percentile 610 2000 5700 13000 77000*
Best Fit 140** 320** 710** 1600** 40000 Mitigation Gun Range (m)
90th Percentile 160** 370** 820** 1900** 47000
*Extrapolated from maximum measurement range of 34.9 km (21.7 mi). **Extrapolated from minimum measurement range of 8 km (5 mi).
Table 53. Measured M-Weighted cumulative SEL off the seismic survey line at the Kakapo site. Cumulative SEL (dB re 1 µPa2s) Distance off
seismic survey line Flat-weighted Low Frequency
Cetaceans Mid-Frequency
Cetaceans
High Frequency Cetaceans
Pinnipeds underwater
500 m 196.3 195.8 186.1 184.0 190.0 2 km 190.8 190.3 182.7 180.8 185.9 8 km 185.6 185.5 180.5 178.6 183.4
Table 54. Best fit (least squares) equation to cumulative SEL vs. range for different M-weighting and distances to auditory injury criterion
Weighting Best fit equation Injury Criteria (dB re 1 µPa2s)
Distance to Injury Criteria (m)
Flat RL = 193.6 – 8.9 LOG R - - LFC RL = 193.1 – 8.6 LOG R 198 270 MFC RL = 184.5 – 4.7 LOG R 198 1 HFC RL = 182.5 – 4.5 LOG R 198 1 PINN RL = 188.1 – 5.5 LOG R 186 2400
The auditory injury criteria for pinnipeds (186 dB re 1 µPa2s) would be reached by a fixed receiver
at approximately 2400 m (1.5 mi) off the seismic survey line. This distance is calculated from the linear fit of cumulative M-Weighted SEL versus range and that is why it is larger than would be indicated if only the 2 km (1.2 mi) measurement of 185.9 dB re 1 µPa2s was considered. Based on best fit extrapolations to shorter ranges from the minimum 500 m (0.3 mi) range OBH, the auditory injury criterion of 198 dB re 1 µPa2s M-weighted for low-, mid- and high-frequency cetaceans are respectively 270 m, 1 m, and 1 m (886, 3.3, and 3.3 ft). Cumulative SEL presented here were not used to set exclusion zones or for take estimates. Seismic Survey – Como Site
Six OBH recorder systems were deployed at ranges of up to 100 km (62 mi) from the survey vessel MV Gilavar and its 3147 in3 airgun array to measure underwater sound levels as a function of distance in the broadside and endfire directions relative to the array. The distances corresponding to rms sound

Chapter 3: Underwater Sound Measurements 3-85
pressure levels reaching thresholds between 190 dB re 1 µPa and 120 dB re 1 µPa in both directions were determined. Threshold distances were also determined for the single 30 in3 mitigation airgun that is used by Gilavar between survey lines to keep animals from approaching close to the array while it would otherwise be quiet. Table 55 lists the distances from the seismic sources at which the rms sound levels reached several threshold values.
CTD casts were taken at each of the six OBH sites to determine water sound speed profiles just prior to the acoustic measurements. The temperature and salinity data from these casts showed that sound speed profiles were approximately uniform over depth at the shallow sites (A, B, C, E) and downward refracting at the deeper-water sites (D, F). The downward refracting profile was expected to increase bottom loss with range from the seismic airguns, due to increased absorption of sound at the seabed. The deep site E received pulses from distant seismic programs more strongly than from SOI’s Como prospect survey. It is likely those pulses traveled through deep water in the sound channel that exists during summer at approximately 125 m (410 ft) depth through much of the Beaufort Sea off the shelf. This sound channel was apparent in the CDT cast results at the site of OBH-E.
Airgun shot spectra and spectrograms (Figure 65 to Figure 74) show most of the pulse energy occurs between 100 Hz and 1000 Hz, with broadside spectral levels higher than endfire levels at corresponding ranges. Spectrograms at 2.1 km (1.3 mi) and 8 km (5 mi) range (Figure 71 to Figure 74) show energy below 100 Hz being stripped off with range and low frequency energy (under 30 Hz) travelling through the sub-bottom and arriving 1-2 seconds before waterborne energy. Note that modal dispersion (different frequencies propagating at different speeds) does not occur at this site.
Cumulative SEL measurement results at three distances from the Como site seismic survey test line did not lie on a linear trend as did the measurements at the Kakapo site; however, ranges to auditory injury criterion can be estimated by interpolating and extrapolating the levels at 640 m (0.4 mi) and 2 km (1.2 mi). The distances to auditory injury criteria for pinnipeds would be approximately 1.5 km (0.93 mi). For low, mid, and high frequency cetaceans the auditory injury distances would be 23, 3, and 1 m (75, 3.3, and 3.3 ft) respectively. M-weighted cumulative SEL presented in this report are presented only for informational purposes. These levels were not used to set exclusion zones or for take estimates.

3-86 Monitoring in the Chukchi & Beaufort Seas: Shell Offshore, 2008
Table 55. Sound level threshold distances for the 3147 in3 airgun array and mitigation gun from seismic vessel Gilivar at the Como site.
rms SPL (dB re 1 µPa) 190 180 170 160 150 140 130 120 Best Fit 24* 210 1500 6700 16000 27000 40000 54000 3147 in3 Airgun Array Endfire
Range (m) 90th Percentile 51* 440 2800 9600 20000 32000 45000 58000
Best Fit 770 2500 5500 9000 – (†) – (†) – (†) ≤ 45,000 (‡) 3147 in3 Airgun Array
Broadside Range (m) 90th Percentile 920 2900 5900 9500 – (†) – (†) – (†) ≤ 45,000
(‡)
Best Fit 10 (††) 46 210 910 3100 7800 15000 23000
Mitigation Gun Range (m) 90th
Percentile 13
(††) 59 270 1100 3700 8800 16000 24000
*Distances to the 190 dB re 1 µPa level were extrapolated from data at longer ranges. (†) Due to the presence of interfering airgun signals on OBH D (45 km, or 28 mi, range at CPA),
broadside threshold ranges between 150 dB and 130 dB re 1 µPa could not be accurately estimated. (‡) The level of the interfering airgun signals on OBH D was approximately 120 dB re 1 µPa.
Therefore the 120 dB re 1 µPa threshold range for was constrained to less than 45 km, or 28 mi, from the array.
(††) Distances to the 190 dB re 1 µPa level were extrapolated from data at longer ranges.
Table 56. Maximum cumulative SEL for each OBH off the seismic survey line at the Como site. Cumulative SEL (dB re 1 µPa2s) Distance off
seismic survey line Flat-weighted Low Frequency
Cetaceans Mid-Frequency
Cetaceans
High Frequency Cetaceans
Pinnipeds underwater
640 m 189.5 189.5 185.5 183.7 188.0 2 km 186.7 186.6 182.9 181.2 185.4 8 km 174.2 174.2 171.6 170.3 173.4
Shallow Hazards – Camden Bay Separate acoustic measurement programs were performed for SOI’s 2008 Shallow Hazards
Surveys in Camden Bay performed from the survey vessels Alpha Helix and Henry C. Acoustic data from the OBH recorders were analyzed for seven shallow hazards source types in order to determine distances to rms sound pressure level thresholds from 190 to 120 dB re 1 µPa. The tables of distance thresholds for the three survey sources are copied below for easier reference. Table 61 provides the ranges to the 120 dB re 1 µPa threshold level for the vessel self-noise from Alpha Helix and Henry C.

Chapter 3: Underwater Sound Measurements 3-87
Table 57. Sound level threshold distances for the airgun arrays and Geopulse sub-bottom profiler on the Alpha Helix in Camden Bay.
Rms SPL (dB re 1 µPa) 190 180 170 160 120 Best Fit 34* 91* 240 630 15000 2 x 10 in3 Airgun Array Range (m)
90th Percentile 45* 120* 320 830 18000 Best Fit 40* 90* 200 440 11000
1 x 10 in3 Airgun Range (m) 90th Percentile 53* 120* 260 590 14000
Best Fit 11* 25* 54* 120* 260 Geopulse sub-bottom profiler Range (m)
90th Percentile 14* 30* 65* 140* 310
*Extrapolated from minimum measurement range of 190 m (623 ft).
Table 58. Sound level threshold distances for the airgun arrays, bubble pulser, and ODEC Strata box from the Henry C in Camden Bay.
rms SPL (dB re 1 µPa) 190 180 170 160 120 Best Fit 7* 27* 100 370 15000 2 x 10 in3 Airgun Array Range (m)
90th Percentile 10* 37* 140 490 16000 Best Fit 4* 14* 57* 230 14000
1 x 10 in3 Airgun Range (m) 90th Percentile 4* 18* 72* 280 16000
Best Fit 6* 23* 86* 310 1000 Datasonics SPR-1200 Bubble Pulser Range (m) 90th Percentile 9* 34* 120 430 1400
Best Fit 2* 9* 40* 170 740 ODEC Strata Box
90th Percentile 3* 12* 53* 230 980
*Extrapolated from minimum measurement range of 90 m (295 ft).
Shallow Hazards – Chukchi Sea An acoustic measurement program in the Chukchi Sea was performed to quantify underwater
sound levels produced by SOI’s 2008 Shallow Hazards Survey near Burger wellsite from the survey vessels Alpha Helix and Cape Flattery. Acoustic data from the OBH recorders were analyzed for six shallow hazards sources to determine distances to rms sound pressure level thresholds from 190 to 120 dB re 1 µPa. The tables of distance thresholds for the three survey sources are copied below for easier reference. Table 61 provides the ranges to the 120 dB re 1 µPa threshold level for vessel self-noise produced by the Alpha Helix and Cape Flattery.
Table 59. Sound threshold level distances for the Geopulse sub-bottom profiler (3.5 kHz) on the Alpha Helix in the Chukchi Sea.
rms SPL (dB re 1 µPa) 190 180 170 160 120 Best Fit 5* 15* 47* 150* 480
90th Percentile 6* 19* 60* 190* 610
*Extrapolated from minimum measurement range of 200 m (660 ft).

3-88 Monitoring in the Chukchi & Beaufort Seas: Shell Offshore, 2008
Table 60. Sound level threshold distances for the airgun array configurations and sub-bottom profilers on the Cape Flattery in the Chukchi Sea.
rms SPL (dB re 1 µPa) 190 180 170 160 120 Best Fit 45* 140* 430 1200 23000‡ 4 x 10 in3 Airgun Array Range (m)
90th Percentile 50* 160* 490 1400 24000‡ Best Fit 14* 50* 200* 730 24000‡
2 x 10 in3 Airgun Array Range (m) 90th Percentile 17* 62* 230 830 25000‡
Best Fit 7* 28* 100* 380 15000 1 x 10 in3 Airgun Range (m)
90th Percentile 8* 32* 120* 440 16000‡ Best Fit 11 (†) 33 (†) 98 (†) 280 750
Sub-bottom Profiler Range (m) 90th Percentile 18 (†) 52 (†) 150 430 1100
Best Fit 1** 7** 48** 260 900 Bubble Pulser
90th Percentile 3** 16** 99** 460 1300
*Extrapolated beyond the minimum measurement range of 190 m (623 ft). ‡Extrapolated from maximum measurement range of 15000 m (9.3 mi). (†)Extrapolated from minimum measurement range of 197 m (646 ft). **Extrapolated from minimum measurement range of 151 m (495 ft).
Support Vessel Measurements Several vessel noise measurements were made on support vessels used in SOI’s seismic and
Shallow Hazards surveys. Ranges to the 120 dB re 1 µPa threshold level for all vessels monitored are compiled in the table below, along with the measurement site and vessel characteristics useful for interpreting the results.
Table 61. Vessel characteristics and sound level measurements. Range to 120 dB re 1 µPa
(m) Vessel Name Vessel Type
Vessel Speed (kts)
Power (hp)
Measurement Location
Measurement Depth (m)
Best Fit 90th Percentile
Cape Flattery
Converted torpedo test
craft 4 1250 Chukchi Sea 45 260 360
Alpha Helix
Research vessel 4.5 825 Chukchi Sea 45 320 470
Alpha Helix
Research vessel 4.5 825 Camden Bay 22 730 1100
Henry C River tug 3.5 4500 Camden Bay 33 2300 3100
Henry C River tug 10 4500 Camden Bay 33 2400 4000
Gulf Provider
Seismic support vessel
12.6 2250 Kakapo Site 43 10000 (aft) /
2100 (forward)
13000 (aft) / 2400
(forward)

Chapter 3: Underwater Sound Measurements 3-89
Torsvik Support Vessel 12 880 Kakapo Site 43
2800 (aft) / 1300
(forward)
3100 (aft) / 1800
(forward)
Theresa Marie
Support Vessel 10.5 - Kakapo Site 43 3900 5800
MV Gilivar Seismic vessel 3.8 3218 Kakapo Site 43 8800 11000
Norseman II
Converted fishing vessel 10.4 850 Kakapo Site 41 1100 2000
Norseman II
Converted fishing vessel 9.5 850 Prudhoe Bay 20 720 930
Arctic Seal Supply vessel 10 1700 Prudhoe Bay 20 660 890
Point Barrow Arctic tug 6 2110 Prudhoe Bay 20 410 1200
Annika Marie
Research vessel 5 436 Prudhoe Bay 10 230 420
Maxime Shallow draft
landing vessel
8 900 Barrow 23 150 190
Literature Cited Austin, M. 2008. Underwater Sound Level Measurements of the Norseman II, Arctic Seal and Point Barrow during
Shell 2008 Operations in Prudhoe Bay, Alaska. JASCO Research Ltd., Victoria, BC. Version 1. 18 August 2008. 9pp.
C. T. Chen and F. J. Millero, 1977, Speed of sound in seawater at high pressures. J. Acoust. Soc. Am., 62 (5), 1129-1135.
Gentry, R., A. Bowles, W. Ellison, J. Finneran, C. Greene, D. Kastak, D. Ketten, J. Miller, P. Nachtigall, W.J. Richardson, B. Southall, J. Thomas and P. Tyack. 2004. Noise exposure criteria. Presentation to U.S. Mar. Mamm. Commis. Advis. Commit.
Ireland, D., D. Hannay, R. Rodrigues, H. Patterson, B. Haley, A. Hunter, M. Jankowski, and D. W. Funk. 2007a. Marine mammal monitoring and mitigation during open water seismic exploration by GX Technology in the Chukchi Sea, October—November 2006: 90-day report. LGL Draft Rep. P891-1. Rep. from LGL Alaska Research Associates Inc., Anchorage, AK, LGL Ltd., King City, Ont., and JASCO Research, Ltd., Victoria, B.C., Can. for GX Technology, Houston, TX, and Nat. Mar. Fish. Serv., Silver Spring, MD. 118 p.
Ketten, D. R. “Estimates of blast injury and acoustic trauma zones for marine mammals from underwater explosions.” In Sensory Systems of Aquatic Mammals, eds. R. Kastelein, J. Thomas, and P. Nachtigall, 391-407. Woerden, The Netherlands: De Spil Publishers, 1995.
Laurinolli, M. and R. Racca. 2008. Underwater Sound Level Measurements: Acoustic Sources on M/V Cape Flattery for ASRC Energy Services’ 2008 Shallow Hazards Survey, Chukchi Sea, Alaska. JASCO Research Ltd., Victoria, BC. Version 2. 3 September 2008. 13pp.

3-90 Monitoring in the Chukchi & Beaufort Seas: Shell Offshore, 2008
Laurinolli, M. and R. Racca. 2008. Underwater Sound Level Measurements: Acoustic Sources on R/V Alpha Helix for Shell’s 2008 Shallow Hazards Survey, Chukchi Sea, Alaska. JASCO Research Ltd., Victoria, BC. Version 3. 3 September 2008. 9pp.
MacDonnell, J., C. O’Neill, R. Bohan, and D. Hannay. 2008. Underwater Sound Level Measurements of Airgun Sources and Support Vessels from the Shell 2008 MV Gilivar Survey at Chukchi Sea site A. JASCO Research Ltd., Victoria, BC. Version 3. 30 October 2008. 22pp.
MacGillivray, A. and C. O’Neill. 2008. Underwater Sound Level Measurements of Support Vessels from the Shell 2008 Seismic Program in the Chukchi Sea. JASCO Research Ltd., Victoria, BC. Version 2. 27 August 2008. 5pp.
MacGillivray, A., C. O’Neill, and R. Bohan. 2008. Underwater Sound Level Measurements of Airgun Sources from the Shell 2008 M/V Gilivar Survey at Beaufort Sea Como Prospect. JASCO Research Ltd., Victoria, BC. Version 1. 11 September 2008. 14pp.
Mouy, X. and D. Hannay. 2008. Underwater Sound Level Measurements: Small Airgun Array, Sub-bottom Profiler and Survey Vessel Alpha Helix from Shell’s 2008 Shallow Hazards Survey, Camden Bay, Alaska. JASCO Research Ltd., Victoria, BC. Version 3. 31 October 2008. 13pp.
Mouy, X., G. Warner, C. MacDonnell, and D. Hannay. 2008. Underwater Sound Level Measurements of Research Vessel Annika Marie during Shell 2008 Operations in Prudhoe Bay, Alaska. JASCO Research Ltd., Victoria, BC. Version 2. 25 July 2008. 6pp.
Nedwell J. R., Turnpenny A. W. H. 1998. The use of a generic frequency weighting scale in estimating environmental effect. Proceedings of the Workshop on Seismics and Marine Mammals. 23-25th June 1998, London, UK.
Southall, B.L., A.E. Bowles, W.T. Ellison, J.J. Finneran, R.L. Gentry, C.R. Greene Jr., D. Kastak, D.R. Ketten, J.H. Miller, P.E. Nachtigall, W.J. Richardson, J.A. Thomas, and P.L. Tyack. 2007. Marine Mammal Noise Exposure Criteria: Initial Scientific Recommendations. Aquatic Mammals, 33 (4) 2007.
Zykov, M. and H. Sneddon. 2008. Underwater Sound Level Measurements: Small Airgun Array, Sub-bottom Profiler and Survey Vessel Henry Christofferson from Shell’s 2008 Shallow Hazards Survey, Camden Bay, Alaska. JASCO Research Ltd., Victoria, BC. Version 2. 25 July 2008. 14pp.

Chapter 4: Monitoring & Mitigation Methods 4-1
4. MONITORING, MITIGATION, AND DATA ANALYSIS METHODS 6
This chapter describes the marine mammal monitoring and mitigation measures implemented for SOI’s deep seismic and shallow hazards surveys in the Chukchi and Beaufort seas during the 2008 open-water season. The required measures were detailed in the IHA and LoA (Appendices A and B) issued to SOI by NMFS and USFWS, respectively. It also describes the methods used to categorize and analyze the monitoring data collected by observers and reported in the following chapters.
Monitoring Tasks The main purposes of the vessel-based monitoring program were to ensure that the provisions of
the IHA and LoA issued to SOI were satisfied, effects on marine mammals were minimized, and residual effects on animals were documented. Tasks specific to monitoring are listed below (also see Appendices A and B):
• use of dedicated Marine Mammal Observers (MMOs) aboard the seismic source vessel, to visually monitor the occurrence and behavior of marine mammals near the airguns when the airguns are operating and during a sample of the times when they are not;
• use of MMOs aboard support vessels to visually monitor the occurrence and behavior of marine mammals and to conduct visual surveys of areas where airgun sounds could reach received sound levels ≥160 dB re 1 μPa (rms);
• record (insofar as possible) the effects of the airgun operations and the resulting sounds on marine mammals;
• use the visual monitoring data as a basis for implementing the required mitigation measures; • estimate the number of marine mammals potentially exposed to airgun sounds at specified
levels.
Safety and Potential Disturbance Radii Under current NMFS guidelines (e.g., NMFS 2000), “safety radii” for marine mammals around
airgun arrays are customarily defined as the distances within which received pulsed sound levels are ≥180 dB re 1 µPa (rms) for cetaceans and ≥190 dB re 1 μPa (rms) for pinnipeds. The ≥180 dB and ≥190 dB guidelines were also employed by the USFWS for the species under its jurisdiction (walrus and polar bear, respectively) in the LoA issued to SOI. These safety criteria are based on a conservative assumption that seismic pulses at lower received levels will not harm these animals or impair their hearing abilities, but that higher received levels might have some such effects. Marine mammals exposed to ≥160 dB (rms) are assumed by NMFS to be potentially subject to behavioral disturbance. However, for certain groups (dolphins, pinnipeds), available data indicate that disturbance is unlikely to occur unless received levels are higher, perhaps ≥170 dB rms for an average animal.
For the current seismic project there has also been the suggestion that received sound levels as low as 120 dB (rms) may have the potential to elicit a behavioral response from bowhead whales during the fall migration in the Beaufort Sea. In 2008, there was a requirement to implement special mitigation measures if four or more bowhead cow/calf pairs were present with an area where sound levels may exceed 120 dB rms during the fall in the Beaufort Sea or if large groups (≥12 individuals) of bowhead or gray whales occurred within an area where sound levels were ≥160 dB rms (Appendix A). Monitoring of
6 By Darren Ireland and Robert Rodrigues (LGL).

4-2 Monitoring in the Chukchi and Beaufort Seas: Shell Offshore Inc, 2008
the ≥160 and ≥120 dB rms zones at specified times and locations is discussed below in the section on Special Mitigation Measures.
The following sections provide summaries of the measured safety radii and how they were implemented by MMOs during 2008 survey operations described in this report. In some cases, the measurement results on which MMOs based mitigation decisions during survey operations that were provided in field reports written by JASCO Research Ltd. (JASCO) were later refined during post-season analysis of the acoustic data. Chukchi Sea—Gilavar
SOI’s IHA and LoA applications described the anticipated underwater sound field around the planned 3147 in3 airgun array with guns at a depth of 6 m (20 ft) based on 2007 sound source measurements by JASCO in the Chukchi Sea (Hannay 2008). Field measurements of the received airgun sounds as a function of distance and aspect were acquired again in 2008 prior to the beginning of seismic data acquisition (MacDonnell et al. 2008). During the 2008 field measurements and until those results were available, the measured 2007 safety radii distances were used for mitigation purposes. The 2008 measured radii were similar to, but in most cases greater than the 2007 measured radii (Table 4.1). The preliminary empirical measurements of the 180 and 190 dB rms radii, as presented by MacDonnell et al. (2008), were adopted as safety radii for the Chukchi Sea survey (Table 4.1).
More extensive analysis of the field measurements was completed after the field season, as described in Chapter 3 of this report. Those analyses resulted in some refinements of the various radii (Tables 4.1-5). The refined values were not available for use by the MMOs in the field. However, the refined estimates were used during processing of the monitoring data presented in Chapter 5 and to estimate the numbers of marine mammals exposed to various sound levels.
Airguns operating underwater do not produce strong sounds in air. Accordingly, no shut downs or power downs were required or implemented for marine mammals hauled out on ice. Chukchi Sea—Cape Flattery and Alpha Helix
Three different airgun combinations were used as sound sources from the Cape Flattery during shallow hazards and site clearance surveys in the Chukchi Sea in 2008. NMFS specified a ≥180 dB distance of 250 m and a ≥190 dB distance of 75 m to be used during field measurements and until results of field measurements were available for use by MMOs. The three sources, one 10–in3 airgun, two 10–in3 airguns, and four 10–in3 airguns, were measured by JASCO and preliminary results presented in Laurinolli and Racca (2008; Table 4.2). A post–season refinement to the sound measurement analysis was not required so distances used by MMOs during the season were the same as those used in data analysis. The NMFS prescribed >180 dB and >190 dB distances were both found to be precautionary as the measured distances of those sound levels from the four 10–in3 airgun array were both less than those stipulated by NMFS (Table 4.2). The Alpha Helix did not use airguns to collect data in the Chukchi Sea in 2008.

Chapter 4: Monitoring & Mitigation Methods 4-3
TABLE 4.1. Comparison of measurements of the ≥190, 180, 170, 160 and 120 dB (rms) distances (in km) for sound pulses from the 24-airgun, 3147–in3 array and 30–in3 mitigation airgun deployed from M/V Gilavar in the Chukchi Sea, Alaska, 2008.
Received Level (dB rms )
Radii from 2007 Measurements a
Preliminary Radii b Final Radii c
Preliminary Radii b Final Radii c
≥190 0.550 0.640 0.610 0.01 0.010≥180 2.470 1.974 2.000 0.01 0.010≥170 4.500 5.672 5.700 0.823 0.820≥160 8.100 13.337 13.000 1.852 1.900≥120 66.000 114.491 120.000 46.865 47.000
a Hannay (2008)b MacDonnell et al. (2008)c Chapter 3
Mitigation AirgunFull Airgun Array
TABLE 4.2. Comparison of predictions and measurements of the ≥190, 180, 170, 160 and 120 dB (rms) distances (in km) for sound pulses from the sound sources deployed from M/V Cape Flattery in the Chukchi Sea, Alaska 2008.
2-airgun array 1-airgunReceived Level
dB (rms )Radii Specified
by NMFSPreliminary and
Final Radii Preliminary and
Final Radii Preliminary and
Final Radii ≥190 0.075 0.050 0.017 0.008≥180 0.25 0.160 0.062 0.32≥170 - 0.490 0.230 0.12≥160 - 1.400 0.830 0.44≥120 - 24.000 25.000 16.000
4-airgun array
Beaufort Sea—Gilavar Seismic surveys in Harrison Bay and Camden Bay were performed by the Gilavar in 2008.
Measurements of the 3147–in3 airgun array and 30–in3 mitigation airgun were made in Harrison Bay (Chapter 3; Table 4.3). During the 2008 measurements in Harrison Bay (where the Gilavar surveyed first in 2008) and until those results were available (MacGillivray et al. 2008), MMOs used the 2007 measurement results. A separate sound source measurement of the Gilavar’s airgun array was not performed when it surveyed in Camden Bay in 2008. The results from the 2007 measurements at that location were used by MMOs for mitigation purposes in 2008. The Harrison Bay sound source measurements in 2008 were similar to the Camden Bay measurements in 2007, but had very strong directivity broadside to the vessel (see Chapter 3 for further details regarding the Harrison Bay measurements). A post–season refinement to the sound measurement analysis was not required so distances used by MMOs during the season were the same as those used in data analysis. Beaufort Sea—Henry Christoffersen
Sound levels produced by the two 10–in3 airguns and single 10–in3 mitigation airgun deployed from the Henry Christoffersen (Henry C.) were measured by JASCO during the 2008 season and reported in Mikhail and Sneddon (2008). The result of measurements of this same equipment in 2007 were used during the 2008 measurements and until those results were available (Table 4.4). Measured distances to specific sound levels were similar too but slightly shorter than the 2007 measurements. A post–season

4-4 Monitoring in the Chukchi and Beaufort Seas: Shell Offshore Inc, 2008
refinement to the sound measurement analysis was not required so distances used by MMOs during the season were the same as those used in data analysis. Beaufort Sea—Alpha Helix The Alpha Helix assisted the Henry C. with shallow hazards and site clearance surveys in the Beaufort Sea in 2008 and carried similar survey equipment. The sound levels produced by two 10–in3 airguns and a single 10–in3 mitigation airgun deployed by the Alpha Helix were measured in Camden Bay by JASCO (Mouy and Hannay 2008a). Measurement results of the same airgun configurations from the Henry C. in 2008 (Table 4.4) were used for mitigation purposes during the Alpha Helix measurements. The Alpha Helix did not use the airguns for survey work after the measurements were completed, but the refinements to the measurements (Mouy and Hannay 2008b) were used during data analysis (Table 4.5). TABLE 4.3. Comparison of measurements of the ≥190, 180, 170, 160 and 120 dB (rms) distances (in km) for sound pulses from the 24-airgun, 3147–in3 array and 30–in3 mitigation airgun deployed from M/V Gilavar in the Beaufort Sea, Alaska, 2008.
Full Airgun Array Full Airgun Array Mitigation Gun Full Airgun Array Mitigation Gun
Received Level (dB rms )
Radii from 2007 Measurements a
Preliminary and Final Radii b
Preliminary and Final Radii b
Preliminary and Final Radii a
Preliminary and Final Radii a
≥190 0.860 0.820 0.013 0.860 0.062≥180 2.250 2.900 0.069 2.250 0.177≥170 5.990 5.900 0.270 5.990 0.499≥160 13.410 9.600 1.100 13.410 1.370≥120 75.000 58.000 24.000 75.000 26.657
a Measurements taken in Camden Bay, 2007 (Hannay 2008)b Chapter 3
Harrison Bay Camden Bay
TABLE 4.4. Comparison of measurements of the ≥190, 180, 170, 160 and 120 dB (rms) distances (in km) for sound pulses from the 2-airgun, 20–in3 array and the 10–in3 mitigation airgun deployed from M/V Henry C. in Camden Bay, Alaskan Beaufort Sea, 2008.
1-airgunReceived Level
(dB rms )Radii from 2007 Measurements
Preliminary and Final Radii
Preliminary and Final Radii
≥190 0.012 0.010 0.004≥180 0.051 0.037 0.018≥170 - 0.140 0.072≥160 1.000 0.490 0.280≥120 25.200 16.300 15.800
2-airgun array

Chapter 4: Monitoring & Mitigation Methods 4-5
TABLE 4.5. Comparison of measurements of the ≥190, 180, 170, 160 and 120 dB (rms) distances (in km) for sound pulses from the 2-airgun, 20–in3 array and the 10–in3 mitigation airgun deployed from M/V Alpha Helix in Camden Bay, Alaskan Beaufort Sea, 2008.
Received Level (dB rms )
Preliminary Radii a Final Radii b
Preliminary Radii a Final Radii b
≥190 0.034 0.045 0.055 0.053≥180 0.100 0.120 0.123 0.120≥170 0.290 0.320 0.277 0.260≥160 0.823 0.830 0.622 0.590≥120 18.867 18.000 17.54 14.000
a Mouy and Hannay (2008a)b Mouy and Hannay (2008b)
1-airgun2-airgun array
Mitigation Measures as Implemented
Through pre-season meetings with coastal communities and stakeholders the location and timing of survey activities, especially in relation to subsistence uses of marine mammals, was perhaps the most significant mitigation measure implemented in 2008. During survey operations in the Chukchi and Beaufort seas, the primary mitigation measures that were implemented included ramp up, power down, and shut down of the airguns. These measures are standard procedures during seismic cruises and are described in detail in Appendix F. Mitigation also included those measures specifically identified in the IHA and LoA (Appendices A and B) as indicated below. Standard Mitigation Measures
Standard mitigation measures implemented during the study included the following: 1. Safety radii implemented for the seismic activities were from 2007 measurements while the
2007 IHA permit was in effect (through 18 August) and then were from the preliminary results of the 2008 field measurements of sound sources reported by JASCO (MacDonnell et al. 2008, Laurinolli and Racca 2008, MacGillivray et al. 2008, Mikhail and Sneddon 2008, Mouy and Hannay 2008a,b; Chapter 3; Tables 4.1–5).
2. Power-down or shut-down procedures were implemented when a marine mammal was sighted within or approaching the applicable safety radius while the airguns were operating.
3. A change in vessel course and/or speed alteration was identified as a potential mitigation measure if a marine mammal was detected outside the safety radius and, based on its position and motion relative to the ship track, was judged likely to enter the safety radius. In practice, this measure was not implemented because the Gilavar was unable to maneuver quickly while towing the airguns and streamers. The Henry C., Alpha Helix, and Cape Flattery had greater maneuverability while towing survey equipment, but did not encounter a marine mammal in such a way as to make a course or speed alteration necessary. Monitoring and support vessels also used course alterations to avoid disturbing marine mammals whenever possible.
4. A ramp-up procedure was implemented whenever operation of the airguns was initiated if >10 min had elapsed since shut down or power down of the full array airguns.
5. In order for seismic operations to start up, the entirety of the largest applicable safety radius to be monitored by MMOs on the vessel must have been visible for at least 30 min.

4-6 Monitoring in the Chukchi and Beaufort Seas: Shell Offshore Inc, 2008
The specific procedures applied during power downs, shut downs, and ramp ups are described in Appendix F. Briefly, a power down involved reducing the number of operating airguns from the full array to a single “mitigation” airgun, when a marine mammal was observed approaching or was first detected already within the full array safety radius. Power down also occurred when the survey vessels were between seismic survey lines to reduce the amount of sound energy introduced into the water. A shut down involved suspending operation of all airguns. A shut down was implemented if a marine mammal was sighted within or approaching the mitigation gun safety radius either after the full array had been powered down or upon initial observation. A ramp up involved a gradual increase in the number of airguns operating (from no airguns firing) usually accomplished by an additional airgun being added to the operating array once each 1–5 minutes. In this report, when a ramp up was initiated while the mitigation airgun had been firing it is referred to as a power up. A ramp up, also called a “cold-start” could not be initiated during times when the full safety radii was not visible to MMOs for 30 minutes because the mitigation gun had not been firing. A power up could be initiated during times when the full safety radius was not visible because the mitigation gun had been firing. Special Mitigation Measures as Required by NMFS
In addition to the standard safety radii based on the ≥190 and ≥180 dB (rms) distances for pinnipeds and cetaceans, respectively, NMFS (in the IHA) required SOI to monitor the ≥160 dB radius for aggregations of 12 or more non-migratory bowhead or gray whales during all seismic activities. Also, SOI was required to monitor the ≥120 dB radius in the Beaufort Sea with aerial surveys biweekly through 31 Aug. and daily after 1 Sept. during periods when seismic surveys were occurring, weather permitting.
Depending on the results of the monitoring of the ≥160 dB or ≥120 dB zones, special mitigation measures were to be implemented:
1. Power down or shut down procedures were to be implemented if groups of 12 or more bowhead or gray whales were within the ≥160 dB (rms) radius while the airguns were in operation.
2. Power down or shut down procedures were to be implemented if four or more bowhead cow/calf pairs were observed during aerial surveys within the ≥120 dB (rms) radius in the Beaufort Sea.
To survey the ≥160 dB zone for aggregations of whales, monitoring vessel(s) followed a zig-zag pattern through the area of seismic survey lines expected to be traveled in the next 24–48 hours. MMOs onboard the monitoring vessel(s) searched the area and reported all cetacean sightings to MMOs on the Gilavar.
The ≥120 dB radius was estimated to extend as much as ~75 km from the Gilavar. Monitoring of the ≥120 dB zone was required in the Beaufort Sea due to concerns that seismic noise might disturb bowhead whales during migration, particularly cow/calf pairs. In the Beaufort Sea, aerial surveys began on 6 Jul and continued daily, weather permitting, through 11 Oct.
Visual Monitoring Methods
Vessel-Based Monitoring—Chukchi and Beaufort Seas Visual monitoring methods were designed to meet the requirements specified in the IHA and LoA
(see above and Appendices A and B). The primary purposes of MMOs aboard the seismic, shallow hazards, and monitoring vessels were as follows: (1) Conduct monitoring and implement mitigation measures to avoid or minimize exposure of cetaceans and walruses to airgun sounds with received levels ≥180 dB re μPa (rms), or of other pinnipeds and polar bears to ≥190 dB. (2) Conduct monitoring and implement mitigation measures to avoid or minimize exposure of groups of 12 or more bowhead or gray whales to airgun sounds with received levels ≥160 dB. (3) Document numbers of marine mammals present, any reactions of marine mammals to seismic activities, and whether there was any possible effect

Chapter 4: Monitoring & Mitigation Methods 4-7
on accessibility of marine mammals to subsistence hunters in Alaska. Results of vessel-based monitoring effort are presented in Chapters 5–8.
The visual monitoring methods that were implemented during SOI’s seismic exploration were very similar to those used during various previous seismic cruises conducted under IHAs since 2003. The standard visual observation methods are described below and in Appendix F.
In summary, during the seismic and shallow-hazards surveys in the Chukchi and Beaufort Seas, at least one MMO onboard the seismic source vessel maintained a visual watch for marine mammals during all daylight hours while airguns were in use. Observers focused their search effort forward and to the sides of the vessel but also searched aft of the vessel occasionally. Watches were conducted with the unaided eye, Fujinon 7×50 reticle binoculars, Zeiss 20×60 image stabilized binoculars (Alpha Helix), or Fujinon 25×150 “Big-Eye” binoculars (Gilavar, Henry C. and Cape Flattery). MMOs instructed seismic operators to power down or shut down the airguns if marine mammals were sighted within or about to enter applicable safety radii.
MMOs onboard the monitoring vessels conducted watches similar to those of MMOs onboard the source vessels. Three vessels, Gulf Provider, Torsvik, Theresa Marie, were used as the primary monitoring vessels for the Gilavar. Other project vessels occasionally operated near the Gilavar and provided monitoring assistance when possible (Fig. 4.1). MMOs onboard the monitoring boats notified MMOs onboard the Gilavar if groups of bowheads or gray whales (or bowhead cow/calf pairs) were sighted within the ≥160 dB radius, allowing the Gilavar to implement the appropriate mitigation. Because the size of the ≥180 dB safety radii around the Gilavar (2.0 km or 1.2 mi) in the Chukchi Sea and 2.3–2.9 km (1.4–1.8 mi) in the Beaufort Sea) were near the limit within which MMOs can reliably detect marine mammals, SOI voluntarily implemented a protocol that used monitoring vessels to help monitor the ≥180 dB safety zone. Thus, during most seismic operations from the Gilavar at least one monitoring vessel traveled approximately 1 km (0.6 mi) ahead of and 1 km to either side of the Gilavar’s trackline. MMOs on-watch aboard the monitoring vessels called the Gilavar MMOs if they observed marine mammals within the Gilavar’s applicable safety radii. MMOs aboard the Gilavar then initiated any necessary mitigation measures.
18-Jul 30-Jul 11-Aug 23-Aug 4-Sep 16-Sep 28-Sep 10-Oct
Arctic Seal
Norseman II
Theresa Marie
Torsvik
Gulf Provider
Gilavar Seismic
Gilavar Non-seismic
FIGURE 4.1. Dates during which various vessels data were included in the monitoring vessel category in this report because they were operating within 75 km (47 mi) of the Gilavar. The Gulf Provider, Torsvik, and Theresa Marie served as the primary monitoring vessels that assisted the Gilavar with implementation of mitigation measures during the 2008 season.

4-8 Monitoring in the Chukchi and Beaufort Seas: Shell Offshore Inc, 2008
Aerial Surveys—Beaufort Sea An aerial survey program was conducted in support of the seismic program in the Beaufort Sea
during 2008. The objectives of the aerial survey were • to survey the relevant areas of operations for bowhead cow/calf pairs and report sightings to the
seismic source vessel MMOs to meet requirements in the IHA; • to collect and report data on the distribution, numbers, direction and speed of travel, and
behavior of marine mammals near the seismic operations with special emphasis on migrating bowhead whales;
• to support regulatory reporting related to the estimation of impacts of seismic operations on marine mammals; and
• to monitor the distance offshore of bowhead whale occurrences to assess their accessibility to Inupiat hunters.
Aerial surveys in Jul and Aug occurred over shallow hazards and site clearance activities and were designed to obtain detailed data (weather permitting) on the occurrence, distribution, and movements of marine mammals, particularly bowhead whales and other cetaceans, in the region surrounding the then current activities as well as in areas of expected future 3D deep seismic activities. Surveys in late Aug to mid-Oct were designed to obtain detailed data centered around the 3D deep seismic surveys conducted by the Gilavar, and to monitor the ≥120 dB radius for bowhead whales prior to and during seismic activities. Further details on the aerial survey program and data analysis methods are presented in Chapter 9.
Data Analysis
Vessel-Based Surveys Categorization of Data
Observer effort and marine mammal sightings were divided into several analysis categories related to environmental conditions and vessel activity. The categories were similar to those used during various other recent seismic studies conducted under IHAs in this region (e.g., Funk et al. 2008, Ireland et al. 2007a,b, Patterson et al. 2007). These categories are defined briefly below, with a more detailed description provided in Appendix F.
Data were categorized by the geographic region and time period in which they were collected (Figure 4.2) for reporting in Chapters 5–8. Only sightings and effort from vessel activities north of Point Hope (68.34 °N) were included in the Chukchi Sea section. Nearly all vessel activity occurred from early Jul through the second week of Sep in the Chukchi Sea, so the data were not categorized into separate seasons. The Beaufort Sea region included data from vessels operating east of Pt. Barrow (156.45 °W) to the Canadian border (141 °W). Vessel activity occurred from early Jul though mid-Oct, so data collected in Jul and Aug were categorized together and separated from data collected in Sep and Oct.
Data were also categorized by the duties of the vessel on which the data were collected. All data collected by MMOs aboard seismic source vessels were categorized as “source vessel” data. All data collected by MMOs aboard other project vessels when they were operating within 75 km (47 mi) of the Gilavar were categorized as “monitoring vessel” data. The distance of 75 km (47 mi) was chosen as the cutoff for this category because it was similar to the various ≥120 dB distances recently measured from large airgun arrays in the Chukchi and Beaufort seas (Jankowski et al. 2008, Reiser et al. 2008). Monitoring vessel data was compared to source vessel data in Chapters 5 and 7 to consider the potential impact of seismic vessel activities at greater distances than could be directly observed from the source vessel.
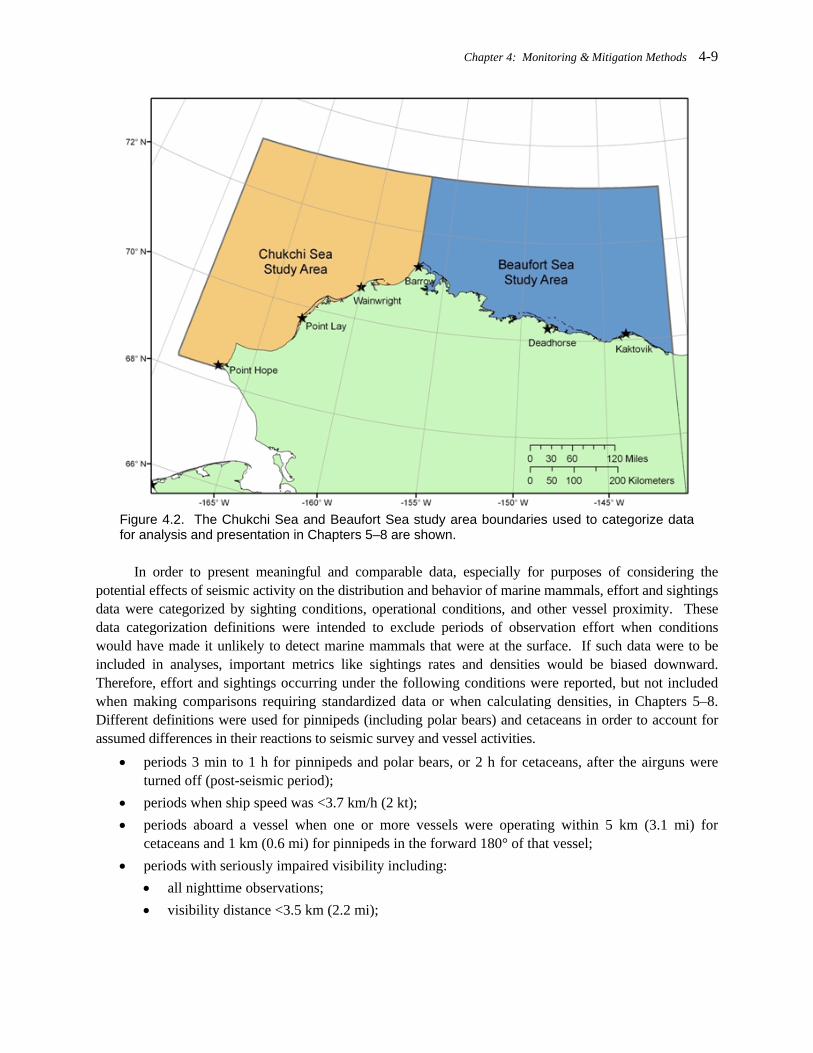
Chapter 4: Monitoring & Mitigation Methods 4-9
Figure 4.2. The Chukchi Sea and Beaufort Sea study area boundaries used to categorize data for analysis and presentation in Chapters 5–8 are shown.
In order to present meaningful and comparable data, especially for purposes of considering the
potential effects of seismic activity on the distribution and behavior of marine mammals, effort and sightings data were categorized by sighting conditions, operational conditions, and other vessel proximity. These data categorization definitions were intended to exclude periods of observation effort when conditions would have made it unlikely to detect marine mammals that were at the surface. If such data were to be included in analyses, important metrics like sightings rates and densities would be biased downward. Therefore, effort and sightings occurring under the following conditions were reported, but not included when making comparisons requiring standardized data or when calculating densities, in Chapters 5–8. Different definitions were used for pinnipeds (including polar bears) and cetaceans in order to account for assumed differences in their reactions to seismic survey and vessel activities.
• periods 3 min to 1 h for pinnipeds and polar bears, or 2 h for cetaceans, after the airguns were turned off (post-seismic period);
• periods when ship speed was <3.7 km/h (2 kt); • periods aboard a vessel when one or more vessels were operating within 5 km (3.1 mi) for
cetaceans and 1 km (0.6 mi) for pinnipeds in the forward 180° of that vessel; • periods with seriously impaired visibility including:
• all nighttime observations; • visibility distance <3.5 km (2.2 mi);

4-10 Monitoring in the Chukchi and Beaufort Seas: Shell Offshore Inc, 2008
• Beaufort wind force (Bf) >5 (Bf >2 for Minke whales, belugas, and porpoises; See Appendix G for Beaufort wind force definitions);
• >60º of severe glare in the forward 180° of the vessel. Data were categorized as “seismic”, “non-seismic”, or “post-seismic” to allow comparison of
sightings during these different operational states. Seismic data included those collected from the source vessels while the airguns were operating. Data from monitoring vessels were considered “seismic” if the vessel was within 15 km (9.3 mi; for cetaceans) or 5 km (3.1 mi; for pinnipeds and polar bears) of a source vessel while the airguns were firing. “Post-seismic” periods were from 3 min to 1 h (pinnipeds and polar bears) or 3 min to 2 h (cetaceans) after cessation of seismic activity and were not used in comparisons or density calculations as noted above. The post seismic period for monitoring vessel data was defined using the same time periods but only if the monitoring vessel was within 5 km (3.1 mi; for pinnipeds and polar bears) or 15 km (9.3 km; for cetaceans) of the active seismic array. The 3 minutes after airguns stopped was included in the seismic category because any marine mammals sighted within that time would have likely been present in very nearly the same location when seismic survey activity had been occurring given the relatively slow vessel speed during operations (~7.4 km/h, or 4 kt, average). The 1 and 2 h long post-seismic periods correspond to the time required for a source vessel to transit to an area in which the received sound level would not have been likely to have much (if any) effect on the distributions of marine mammals, or for animals to return to the area where operations had been occurring. “Non-seismic” data from source vessels included all data before the airguns were activated and after the respective post-seismic periods were complete. From monitoring vessels, non-seismic data included the same periods described for source vessels if they were within 5 km (3.1 mi; for pinnipeds and polar bears) or 15 km (9.3 mi; for cetaceans) or any time they were beyond those distances from an active seismic source.
This categorization system was designed primarily to distinguish potential differences in behavior and distribution of marine mammals with and without seismic surveys. The rate of recovery toward “normal” during the post-seismic period is uncertain. Marine mammal responses to seismic sound likely diminish with time after the cessation of seismic activity. The end of the post-seismic period was defined as a time long enough after cessation of airgun activity to ensure that any carry-over effects of exposure to sounds from the airguns would have waned to zero or near-zero. The reasoning behind these categories was explained in MacLean and Koski (2005) and Smultea et al. (2004) and is discussed in Appendix F.
Various factors including high sea conditions, poor visibility, and MMO experience can make marine mammal identification difficult, and both cetaceans and pinnipeds could not always be identified to species. At times, less experienced observers may have incorrectly identified certain species. Ringed and spotted seals can be especially difficult to differentiate at even moderate distances during sightings that are typically very brief. When post-season data analysis revealed a pattern of species identifications that were not consistent with known distributions, the questioned sightings were included in tables and analysis as unknown seals and the number and species of those sightings are included in the text. Line Transect Estimation of Densities
Marine mammal sightings during the seismic and non-seismic periods were used to calculate separate sighting rates (#/km) and densities (#/km2) of marine mammals near the source and monitoring vessels during those periods. Density calculations were based on line-transect principles (Buckland et al. 2001). Most correction factors for animals not detected at greater distances from the vessels, f (0), were calculated from data collected during the 2008 season. Correction factors for animals near the vessel but underwater and therefore unavailable for detection by observers, g(0) were taken from related studies, as summarized by Koski et al. (1998) and Barlow (1999). This was necessary because of the inability to

Chapter 4: Monitoring & Mitigation Methods 4-11
assess trackline sighting probability, g(0), during a project of this type. Further details on the line transect methodology used during the survey are provided in Appendix F.
Densities estimated from non-seismic observations have been used (below) to estimate the numbers of animals that presumably would have been present in the absence of seismic activities. Densities during non-seismic periods have been used to estimate the numbers of animals present near the seismic operation and exposed to various sound levels. The difference between the two estimates could be taken as an estimate of the number of animals that moved in response to the operating seismic vessel, or that changed their behavior sufficiently to affect their detectability by visual observers. However, the limited duration of airgun operations from the Cape Flattery resulted in too few data being categorized as seismic to allow reliable estimates of marine mammals present during seismic activity. Thus, a comparison of seismic and non-seismic densities observed from the Cape Flattery was not a valid method for estimating changes in distribution or behavior resulting from the seismic activity. Estimating Numbers Potentially Affected
For purposes of the IHA, NMFS assumes that any marine mammal that might have been exposed to airgun pulses with received sound levels ≥160 dB re 1 µPa (rms) may have been appreciably disturbed and therefore “taken”. When calculating the number of mammals potentially affected, we used the appropriate measured ≥160 dB radii (Tables 4.1–5).
In addition to the number of animals actually observed within the ≥160 dB rms zone during seismic activities, two calculations were made to estimate the numbers of marine mammals that may have been potentially exposed to sound levels ≥160, ≥170, ≥180, and ≥190 dB re 1 µPa (rms):
1. Estimates of the number of individual mammals exposed (one or more times), and 2. Estimates of the average numbers of potential exposures per individual. The first calculation involved multiplying the area assumed to be ensonified to the specified level
by the estimated marine mammal densities based on MMO observations during non-seismic periods. . The second calculated the average number of times a given area of water within the seismic survey area was ensonified to the specified level. Thus, animals that remained in areas of water ensonified on more than one occasion, due to overlapping or adjacent tracklines, may have been exposed on multiple occasions.
During 3D deep seismic surveys from the Gilavar, many of the survey lines were in close proximity to one another relative to the ≥160 dB distance, leading to much overlap of the areas ensonified to ≥160 dB during transits along the various survey lines. This led to a relatively high estimate of the number of exposures per individual. The shallow hazards surveys had much less overlap of ensonified areas due to the smaller sound sources causing the estimated exposures per individual to be quite low.
This approach was originally developed to estimate numbers of seals potentially affected by seismic surveys in the Alaskan Beaufort Sea conducted under IHAs (Harris et al. 2001). The method has recently been used in estimating numbers of seals and cetaceans potentially affected by other seismic surveys conducted under IHAs (e.g., Funk et al. 2008, Ireland et al. 2007a,b, Patterson et al. 2007).
Literature Cited Barlow, J. 1999. Trackline detection probability for long-diving whales. p. 209-221 In: G.W. Garner, S.C. Am-
strup, J.L. Laake, B.F.J. Manly, L.L. McDonald and D.G. Robertson (eds.), Marine mammal survey and assessment methods. A.A. Balkema, Rotterdam. 287 p.

4-12 Monitoring in the Chukchi and Beaufort Seas: Shell Offshore Inc, 2008
Funk, D., D. Hannay, D. Ireland, R. Rodrigues, W. Koski. (eds.). 2008. Marine mammal monitoring and mitigation during open water seismic exploration by Shell offshore Inc. in the Chukchi and Beaufort Seas, July–November 2007: 90-day report. LGL Rep. P969-1. Rep. from LGL Alaska Research Associates Inc., LGL Ltd., and JASCO Research Ltd. for Shell Offshore Inc., Nat. Mar. Fish. Serv., and U.S. Fish and Wild. Serv. 218 pp plus appendices.
Harris, R.E., G.W. Miller and W.J. Richardson. 2001. Seal responses to airgun sounds during summer seismic surveys in the Alaskan Beaufort Sea. Mar. Mamm. Sci. 17(4):795-812.
Hannay 2008. Sound Source Verification Measurements. Chapter 3 In Funk D., D. Hannay, D. Ireland, R. Rodrigues, W. Koski. (eds) 2008. Marine mammal monitoring and mitigation during open water seismic exploration by Shell Offshore Inc. in the Chukchi and Beaufort Seas, July–November 2007: 90-day report. LGL Rep. P969-1. Rep from LGL Alaska Research Associates Inc., LGL Ltd., and JASCO Research Ltd. for Shell Offshore Inc, Nat. Mar. Fish. Serv., and U.S. Fish and Wild. Serv. 2118 pp plush appendices.
Ireland, D., R. Rodrigues, D. Hannay, M. Jankowski, A. Hunter, H. Patterson, B. Haley, and D. W. Funk. 2007a. Marine mammal monitoring and mitigation during open water seismic exploration by ConocoPhillips Alaska Inc. in the Chukchi Sea, July–October 2006: 90–day report. LGL Draft Rep. P903–1. Rep. from LGL Alaska Research Associates Inc., Anchorage, AK, LGL Ltd., King City, Ont., and JASCO Research Ltd., Victoria, BC, for ConocoPhillips Alaska, Inc., Anchorage, AK, and Nat. Mar. Fish. Serv., Silver Spring, MD. 116 p.
Ireland, D., D. Hannay, R. Rodrigues,H. Patterson, B. Haley, A. Hunter, M. Jankowski, and D. W. Funk. 2007b. Marine mammal monitoring and mitigation during open water seismic exploration by GX Technology, Inc. in the Chukchi Sea, October—November 2006: 90–day report. LGL Draft Rep. P891–1. Rep. from LGL Alaska Research Associates Inc., Anchorage, AK, LGL Ltd., King City, Ont., and JASCO Research, Ltd., Victoria, B.S., Can. for GX Technology, Inc., Houston, TX, and Nat. Mar. Fish. Serv., Silver Spring, MD. 119 p.
Jankowski, M., H. Patterson, and D. Savarese. 2008. Beaufort Sea vessel-based monitoring program. (Chapter 5) In: Ireland, D.S., D.W. Funk, R. Rodrigues, and W.R. Koski (eds.). 2008 Joint Monitoring Program in the Chukchi and Beaufort seas, July–November 2007. LGL Alaska Report P971-1. Report from LGL Alaska Research Associates, Inc., LGL Ltd., JASCO Research, Ltd., and Greeneridge Sciences, Inc., for Shell Offshore, Inc. ConocoPhillips Alaska, Inc., and National Marine Fisheries Service, U.S. Fish and Wildlife Service. 445 p. plus Appendices.
Koski, W.R., D.H. Thomson and W.J. Richardson. 1998. Descriptions of marine mammal populations. p. 1-182 plus Appendices In: Point Mugu Sea Range Marine Mammal Technical Report. Rep. from LGL Ltd., King City, Ont., for Naval Air Warfare Center, Weapons Div., Point Mugu, CA, and Southwest Div. Naval Facilities Engin. Command, San Diego, CA. 322 p.
Laurinolli, M. and R. Racca. 2008. Underwater sound level measurements: acoustic sources on M/V Cape Flattery for ASRC Energy Servies’ 2008 shallow hazards survey, Chukchi Sea, Alaska.
MacDonnell, J., C. O’Neill, R. Bohan, D. Hannay. 2008. Underwater sound level measurements of airgun sources and support vessels from the Shell 2008 MV Gilavar survey at Chukchi Sea site A, 120-h Report. Version 2. JASCO Research Ltd. Victoria, BC.
MacGillivray, A., C. O’Neil, R. Bohan. 2008. Underwater sound level measurements of airgun sources from the Shell 2008 MV Gilavar survey at Beaufort Sea Como Prospect, 120-hr Report. Version 1.0. JASCO Research Ltd. Victoria, BC.
MacLean, S.A. and W.R. Koski. 2005. Marine mammal monitoring during Lamont-Doherty Earth Observatory’s seismic program in the Gulf of Alaska, August–September 2004. LGL Rep. TA2822-28. Rep. from LGL Ltd., King City, Ont., for Lamont-Doherty Earth Observatory of Columbia Univ., Palisades, NY, and Nat. Mar. Fish. Serv., Silver Spring, MD. 102 p.
Mikhail, Z. and H. Sneddon. 2008. Underwater sound level measurements: small airgun array, sub-bottom profiler and survey vessel Henry Christofferson from Shell’s 2008 shallow hazards survey, Camden Bay, Alaska. Version 2.0. JASCO Research Ltd. Victoria, BC.

Chapter 4: Monitoring & Mitigation Methods 4-13
Mouy, X. and D. Hannay. 2008a. Underwater sound level measuerements: small airgun array sub-bottom profiler and survey vessel Alpha Helix from Shell’s 2008 shallow hazards survey, Camden Bay, Alaska. Version 2.0. JASCO Research Ltd. Victoria, BC.
Mouy, X. and D. Hannay. 2008a. Underwater sound level measuerements: small airgun array sub-bottom profiler and survey vessel Alpha Helix from Shell’s 2008 shallow hazards survey, Camden Bay, Alaska. Version 3.0. JASCO Research Ltd. Victoria, BC.
NMFS. 2000. Small takes of marine mammals incidental to specified activities; marine seismic-reflection data col-lection in southern California/Notice of receipt of application. Fed. Regist. 65(60, 28 Mar.):16374-16379.
Patterson, H., S.B. Blackwell, B. Haley, A. Hunter, M. Jankowski, R. Rodrigues, D. Ireland and D. W. Funk. 2007. Marine mammal monitoring and mitigation during open water seismic exploration by Shell Offshore Inc. in the Chukchi and Beaufort Seas, July–September 2006: 90–day report. LGL Draft Rep. P891–1. Rep. from LGL Alaska Research Associates Inc., Anchorage, AK, LGL Ltd., King City, Ont., and Greeneridge Sciences Inc., Goleta, CA, for Shell Offshore Inc, Houston, TX, and Nat. Mar. Fish. Serv., Silver Spring, MD. 199 p.
Reiser, C., B. Haley, D. Savarese, and D.S. Ireland. 2008. Chukchi Sea vessel-based monitoring program. (Chapter 3) In: Ireland, D.S., D.W. Funk, R. Rodrigues, and W.R. Koski (eds.). 2008 Joint Monitoring Program in the Chukchi and Beaufort seas, July–November 2007. LGL Alaska Report P971-1. Report from LGL Alaska Research Associates, Inc., LGL Ltd., JASCO Research, Ltd., and Greeneridge Sciences, Inc., for Shell Offshore, Inc. ConocoPhillips Alaska, Inc., and National Marine Fisheries Service, U.S. Fish and Wildlife Service. 445 p. plus Appendices.
Smultea, M.A., M. Holst, W.R. Koski and S. Stoltz. 2004. Marine mammal monitoring during Lamont-Doherty Earth Observatory’s seismic program in the Southeast Caribbean Sea and adjacent Atlantic Ocean, April–June 2004. LGL Rep. TA2822-26. Rep. from LGL Ltd., King City, Ont., for Lamont-Doherty Earth Observatory of Columbia Univ., Palisades, NY, and Nat. Mar. Fish. Serv., Silver Spring, MD. 106 p.


Chapter 5: Chukchi Sea Seismic Survey Monitoring 5-1
5. CHUKCHI SEA VESSEL-BASED SEISMIC MONITORING7
Monitoring Effort and Marine Mammal Encounter Results This section summarizes the visual observer effort from the Gilavar and its monitoring vessels
during 2008 Chukchi Sea seismic operations. The survey period began when the Gilavar and its monitoring vessels entered the Chukchi Sea study area on 18 Jul 2008 (AKDT) and ended when the Gilavar entered the Beaufort Sea on 31 August 2008.
In 2008, the Gilavar traveled along a total of 8286 km (~5149 mi) of trackline in the Chukchi Sea. Airgun operations occurred along 2806 km (1744 mi) of that trackline. The full airgun array was ramping up or active along 1955 km (1215 mi) of trackline. The single mitigation gun operated along 851 km (529 mi), including turns and power downs. The airguns did not operate along the remaining 5480 km (3405 mi) of trackline in the Chukchi Sea.
MMOs were on watch for a total of 6952 km (4320 mi; 829 hr), exclusively from the Gilavar’s bridge (eye height 12.3 m or 13.5 yd). Of the visual observation effort, ~175 km (108 mi; 21 hr) occurred during darkness either because of nighttime power ups or because of a marine mammal power down during daylight. The IHA required MMOs on the source vessel to watch at night after daytime monitoring resulted in a power down due to marine mammal presence. Survey effort by MMOs on monitoring vessels was included in analyses when the vessels were within 75 km of the Gilavar resulting in 22,928 km (14,247 mi; 1980 hr) of MMO effort from monitoring vessels; of that effort 295 km (183 mi; 26 hr) was conducted in darkness.
During the 2008 Chukchi Sea survey, MMOs observed a total of 81 groups of 109 marine mammals from the Gilavar and 230 groups of 296 marine mammals from the monitoring vessels. Detailed marine mammal sighting information is available in Appendix Tables I.1. and N. Only the MMO effort and sightings data that meet the analysis criteria described in Chapter 4 are presented in the following sections, except for “Mitigation Measures Implemented” and “Estimated Number of Marine Mammals Present and Potentially Affected” where all sightings are considered. Other Vessels
The Gilavar and its monitoring vessels typically worked within 5 km (3 mi) of each other and often as close as a few hundred meters. Vessels’ proximity to each other was variable over time and may have influenced the number and behavior of marine mammals sighted from different vessels. Vessels other than those involved in the survey seldom passed through the project area. Each ship that was not participating in the project transited well away from survey activities (>15 km) and MMOs observed no instances of harassment or disturbance to marine mammals due to their presence. Cetaceans Cetacean Effort
During the 2008 Chukchi Sea survey, cetacean monitoring effort from the Gilavar totaled 1685 km (1047 mi). Most of that effort occurred during non-seismic periods (Fig. 5.1). MMOs aboard the monitoring vessels surveyed for cetaceans over a distance of 13,401 km (8327 mi; Fig. 5.1; Appendix Table I.2). As with the Gilavar, most survey effort on the monitoring vessels occurred during non-seismic periods.
7 By Beth Haley, Craig Reiser, Joseph Beland, and Danielle Savarese

5-2 Monitoring in the Chukchi and Beaufort Seas: Shell Offshore Inc, 2008
On the Gilavar, cetacean effort with two MMOs on watch was >3.5 times greater than with only one MMO. The reverse was true for cetacean effort from monitoring vessels (Fig. 5.2). This was due primarily to both bunk and bridge space restrictions on the monitoring vessels. Three MMOs monitored for cetaceans for 0.1 km (100 yd) and 12 km (~7 mi) from the Gilavar and monitoring vessels, respectively. These small amounts were added to the “2–MMO” category.
310
2785
1374
10616
0
2000
4000
6000
8000
10000
12000
Gilavar Monitoring Vessels
MM
O E
ffort
(km
)
SeismicNon-seismic
FIGURE 5.1. Cetacean MMO effort (km) in the Chukchi Sea study area (18 Jul – 31 Aug 2008) from the Gilavar and its monitoring vessels.
363
10515
1321
2886
0
2000
4000
6000
8000
10000
12000
Gilavar Monitoring Vessels
MM
O E
ffort
(km
)
1 MMO2 MMO
FIGURE 5.2. Cetacean MMO effort (km) by number of observers in the Chukchi Sea study area (18 Jul – 31 Aug 2008) from the Gilavar and its monitoring vessels.

Chapter 5: Chukchi Sea Seismic Survey Monitoring 5-3
Cetacean Sightings MMOs observed 108 cetaceans in 65 groups from the Gilavar and its monitoring vessels (Table
5.1). The most commonly identified cetacean species was gray whale although many cetaceans could not be identified to species (Table 5.1). Two sightings of endangered species were recorded from monitoring vessels, one each for fin and humpback whales. No bowhead whales were observed. Cetacean Sightings by Seismic State
Only four of the 65 cetacean sightings from the Gilavar and its monitoring vessels were recorded during seismic periods (Fig. 5.3). Each of these observations was made from a monitoring vessel (Fig. 5.3). Appendix Table I.3 summarizes cetacean sightings by seismic state and species. Cetacean Sighting rates
There was no significant difference between seismic and non-seismic sighting rates from the Gilavar (X2 = 3.16, df = 1, p = 0.076). Cetacean sighting rates from the monitoring vessels were significantly higher during non-seismic periods (X2 = 5.19, df = 1, p = 0.022; Fig. 5.4). The cetacean sighting rate during non-seismic periods from the Gilavar was more than twice the rate recorded from the monitoring vessels.
The cetacean sighting rate from the Gilavar was greater with two MMOs on watch than with a single MMO (Fig. 5.5). Most of the observation effort on the Gilavar was conducted by two MMOs (Fig. 5.2) and the small amount of effort with one MMO made meaningful comparisons of cetacean sighting rates as a function of number of MMOs on watch difficult. On the monitoring vessels, the sighting rates were lower when two MMOs were on watch (Fig. 5.5). Most of the MMO effort on monitoring vessels was conducted with one MMO on watch (Fig. 5.2).
TABLE 5.1. Number of sightings (number of individuals) of cetaceans during the Chukchi Sea survey (18 Jul – 31 Aug 2008) from the Gilavar and its monitoring vessels.
Species
Cetaceans
Fin Whale 0 1 (3) 1 (3) Gray Whale 3 (5) 17 (38) 20 (43) Harbor Porpoise 2 (7) 6 (11) 8 (18) Humpback Whale 0 1 (1) 1 (1) Minke Whale 3 (4) 5 (5) 8 (9) Unidentified Mysticete Whale 6 (6) 16 (21) 22 (27) Unidentified Whale 0 5 (7) 5 (7)
Total Cetaceans 14 (22) 51 (86) 65 (108)
Gilavar Monitoring Vessels Total

5-4 Monitoring in the Chukchi and Beaufort Seas: Shell Offshore Inc, 2008
04
14
47
0
5
10
15
20
25
30
35
40
45
50
Gilavar Monitoring Vessels
Num
ber
of S
ight
ings
SeismicNon-seismic
FIGURE 5.3. Number of cetacean sightings in the Chukchi Sea survey area (18 Jul – 31 Aug 2008) from the Gilavar and its monitoring vessels.
0.0
1.4
10.2
4.4
0.0
2.0
4.0
6.0
8.0
10.0
12.0
Gilavar Monitoring Vessels
Sig
htin
gs p
er 1
000
km o
f MM
O E
ffort
SeismicNon-seismic
FIGURE 5.4. Cetacean sighting rates by seismic state from the Gilavar and its monitoring vessels during the Chukchi Sea survey (18 Jul – 31 Aug 2008).

Chapter 5: Chukchi Sea Seismic Survey Monitoring 5-5
5.5
3.6
9.1
1.8
0.0
1.0
2.0
3.0
4.0
5.0
6.0
7.0
8.0
9.0
10.0
Gilavar Monitoring Vessels
Sig
htin
gs p
er 1
000
km o
f MM
O E
ffort
1 MMO2 MMO
FIGURE 5.5. Cetacean sighting rates by number of MMOs on watch from the Gilavar and its monitoring vessels during the Chukchi Sea survey (18 Jul – 31 Aug 2008).
Pinniped Pinniped Effort
During the 2008 Chukchi Sea survey, pinniped monitoring effort from the Gilavar totaled 4178 km (2596 mi), most (~63%) of which occurred during non-seismic periods (Fig. 5.6). Pinniped effort from monitoring vessels totaled 15,656 km (9728 mi; Fig. 5.6; Appendix Table I.4). Approximately 88% of the pinniped effort from monitoring vessels occurred during non-seismic periods.
For both the Gilavar and its monitoring vessels, the ratio of pinniped effort between a single and two or more MMOs was similar to that of cetacean effort (Figs. 5.2 and 5.7). Pinniped effort from the Gilavar with two MMOs on watch was >3.5 times the effort with one MMO. The reverse was true for monitoring vessels (Fig. 5.7). Three MMOs monitored for pinnipeds for 6 km (~4 yd) and 12 km (~7 mi) from the Gilavar and monitoring vessels, respectively. These small amounts were added to the “2–MMO” category. Seal Sightings
There were 174 seals sighted in 150 groups by MMOs on the Gilavar and its monitoring vessels (Table 5.2). Ringed seal was the most frequently identified seal species. Nearly half of the seals sighted could not be identified to species (Table 5.2). Seal Sightings by Seismic State
Of the 150 seal sightings recorded from the Gilavar and its monitoring vessels, 125 were recorded during non-seismic periods compared to 25 sightings during seismic periods (Fig. 5.8). Four of the seal sightings recorded during seismic operations were within the Gilavar’s ≥190 dB safety radius resulting in four power downs of the airgun array. A fifth seal was observed outside but near the ≥190 dB safety radius while the full array was active, resulting in a fifth power down of the airgun array (see Mitigation Measures Implemented for more information). Seal sightings by seismic state and species are summarized in Appendix Table I.5.

5-6 Monitoring in the Chukchi and Beaufort Seas: Shell Offshore Inc, 2008
1550 18832628
13773
0
2000
4000
6000
8000
10000
12000
14000
16000
Gilavar Monitoring Vessels
MM
O E
ffort
(km
)SeismicNon-seismic
FIGURE 5.6. Pinniped MMO effort (km) in the Chukchi Sea study area (18 Jul - 31 Aug 2008) from the Gilavar and its monitoring vessels.
927
12408
3251 3248
0
2000
4000
6000
8000
10000
12000
14000
Gilavar Monitoring Vessels
MM
O E
ffort
(km
)
1 MMO2 MMO
FIGURE 5.7. Pinniped MMO effort (km) by number of observers in the Chukchi Sea study area (18 Jul - 31 Aug 2008) from the Gilavar and its monitoring vessels.

Chapter 5: Chukchi Sea Seismic Survey Monitoring 5-7
TABLE 5.2. Number of sightings (number of individuals) of seals in the Chukchi Sea survey (18 Jul - 31 Aug 2008) from the Gilavar and its monitoring vessels.
Species
Seals
Bearded Seal 3 (3) 4 (4) 7 (7) Ringed Seal 14 (17) 43 (45) 57 (62) Spotted Seal 3 (3) 12 (16) 15 (19) Unidentified Pinniped 2 (2) 1 (15) 3 (17) Unidentified Seal 13 (13) 55 (56) 68 (69)
Total Seals 35 (38) 115 (136) 150 (174)
Gilavar Monitoring Vessels Total
817
27
98
0
20
40
60
80
100
120
Gilavar Monitoring Vessels
Num
ber
of S
ight
ings Seismic
Non-seismic
FIGURE 5.8. Number of seal sightings by seismic state during the Chukchi Sea survey (18 Jul – 31 Aug 2008) from the Gilavar and its monitoring vessels.
Seal Sighting Rates
The seal sighting rate from the Gilavar during non-seismic periods was approximately twice the rate during seismic periods (Fig. 5.9). A lower sighting rate during seismic operations was expected due to potential localized seal avoidance of seismic survey activities. Conversely, the seal sighting rate from monitoring vessels was greater during seismic than non-seismic periods (Fig. 5.9). Underwater sound levels near monitoring vessels were likely reduced compared to the levels near the Gilavar. Localized movement of seals away from the Gilavar and the operating airguns could have increased the seal density in areas where monitoring vessels were operating, producing this result.
Seal sighting rates from the Gilavar were higher with one MMO than with two (Fig. 5.10). Seal sighting rates from monitoring vessels were nearly identical with one and two MMOs on watch (Fig.10). Most of the MMO effort on monitoring vessels was conducted with one MMO on watch (Fig. 5.7).

5-8 Monitoring in the Chukchi and Beaufort Seas: Shell Offshore Inc, 2008
5.2
9.0
10.3
7.2
0.0
2.0
4.0
6.0
8.0
10.0
12.0
Gilavar Monitoring Vessels
Sig
htin
gs p
er 1
000
km o
f MM
O E
ffort
SeismicNon-seismic
FIGURE 5.9. Seal sighting rates by seismic state from the Gilavar and its monitoring vessels during the Chukchi Sea survey (18 Jul - 31 Aug 2008).
9.7
7.38.0
7.4
0.0
2.0
4.0
6.0
8.0
10.0
12.0
Gilavar Monitoring Vessels
Sigh
tings
per
100
0 km
of M
MO
Effo
rt
1 MMO2 MMO
FIGURE 5.10. Seal sighting rates by number of MMOs from the Gilavar and its monitoring vessels during the Chukchi Sea survey (18 Jul - 31 Aug 2008).
Pacific Walruses and Polar Bears
A single Pacific walrus was observed during vessel-based activities in the Chukchi Sea. The walrus was sighted in the water from a monitoring vessel during a non-seismic period. The single Pacific walrus sighting resulted in a non-seismic sighting rate of less than 0.06 walrus per 1000 km. MMOs did not observe any polar bears during the Chukchi Sea survey.

Chapter 5: Chukchi Sea Seismic Survey Monitoring 5-9
Distribution and Behavior of Marine Mammals Marine mammal behavior and reaction were difficult to observe, especially from the seismic
vessel, because individuals and/or groups typically spent most of their time below the water surface and could not be observed for extended periods. The data collected during visual observations provided limited information about behavioral responses of marine mammals to the seismic survey. The relevant data collected from the Gilavar and its monitoring vessels included estimated closest observed points of approach (CPA) to the vessel, movement relative to the vessel, and behavior and reaction of animals at the time of the initial sightings. We present both seismic and non-seismic data for the Gilavar and monitoring vessels. The monitoring vessels were typically positioned forward of the Gilavar; therefore, the monitoring vessels’ sightings were forward of the source vessel during both seismic and non-seismic periods. Cetaceans Cetacean Distribution and Closest Observed Point of Approach
Fourteen and 51 cetaceans were observed from the Gilavar and its monitoring vessels respectively (Tables 5.1 and 5.3). No cetaceans were observed from the Gilavar during seismic operations. Fewer cetaceans were sighted from monitoring vessels during seismic operations than during non-seismic periods (Fig. 5.3). The cetacean CPA from monitoring vessels was greater during non-seismic than seismic periods (Table 5.3). Cetacean observations during seismic activity included three sightings of harbor porpoise(s) and one of a gray whale. The four cetaceans observed from the monitoring vessels during seismic operations were not within the ≥180 dB sound level radius of the Gilavar’s operating airgun array. Therefore, no power downs were implemented for cetaceans. Cetacean Movement
Most movement of cetaceans during non-seismic periods was recorded as either neutral or unknown relative to vessel (Table 5.4). MMOs observed only four cetaceans during seismic periods, all from the monitoring vessels. The low number of cetacean sightings during seismic periods were not sufficient to make meaningful comparisons of cetacean movements during seismic and non-seismic periods. Initial Cetacean Behavior
The number of cetacean sightings was insufficient to make meaningful comparisons of differences in observed behaviors between seismic and non-seismic periods. Nearly one-half of all initial cetacean behaviors recorded (23 of 51) was “blow” (Table 5.5). This is typical because a blow is a highly visible sighting cue. The other most frequently recorded initial behaviors were “surface active” (n = 14) and “swim” (n = 12; Table 5.5). The “surface active” category describes percussive surface behavior of individuals within a group.

5-10 Monitoring in the Chukchi and Beaufort Seas: Shell Offshore Inc, 2008
TABLE 5.3. Comparison of cetacean CPA distances by seismic period from the Gilavar and its monitoring vessels during the Chukchi Sea survey (18 Jul - 31 Aug 2008). The overall mean includes both seismic and non-seismic CPA distances in the calculation.
Vessel and Seismic Status Mean CPAa (m) s.d. Range (m) n
Gilavar Seismic -- -- -- --Gilavar Non-seismic 2312 1260 594-4616 14
Gilavar Overall Mean 2312 1260 594-4616 14
Monitoring Vessels Seismic 125 119 50-300 4Monitoring Vessels Non-seismic 1209 1361 20-5000 47
Monitoring Vessels Overall Mean 1124 1338 20-5000 51
a CPA = Closest Point of Approach . For Gilavar this value is the marine mammal's closest point of approach to the airgun array, formonitoring vessels this value is the marine mammal's closest point of approach to the MMO/vessel.
TABLE 5.4. Comparison of cetacean movement relative to vessels by seismic state from the Gilavar and monitoring vessels during the Chukchi Sea survey (18 Jul - 31 Aug 2008).
Vessel and Seismic StatusSwim
TowardsSwim Away Neutral None Unknown Totals
Gilavar Seismic -- -- -- -- -- -- -- -- --Gilavar Non-seismic 1 3 7 2 1 14
Gilavar Total 1 3 7 2 1 14
Monitoring Vessels Seismic 1 0 3 0 0 4Monitoring Vessels Non-seismic 3 10 20 0 14 47
Monitoring Vessels Total 4 10 23 0 14 51
Movement Relative to Vessel
Cetacean Reaction Behavior Eight of the 65 cetaceans displayed activity that may have been a reaction to the vessel (Table 5.6).
Of the eight reactions, five were “increase in speed”, two were “splash”, and one was “change in direction”. The remaining 57 cetaceans sighted (3 during seismic and 54 during non-seismic) from both the Gilavar and its monitoring vessels exhibited no overt (or discernable) reaction to the vessel (Table 5.6).

Chapter 5: Chukchi Sea Seismic Survey Monitoring 5-11
TABLE 5.5. Comparison of cetacean behaviors by seismic period from the Gilavar and its monitoring vessels during the Chukchi Sea survey period (18 Jul – 31 Aug 2008).
Vessel and Seismic Status Blow Breach FeedFront Dive Fluke Mill Swim
Surface Active Thrash Travel Splash
Un-known Totals
Gilavar Seismic 0 0 0 0 0 0 0 0 0 0 0 0 0Gilavar Non-seismic 8 0 0 1 0 2 3 0 0 0 0 0 14
Gilavar Total 8 0 0 1 0 2 3 0 0 0 0 0 14
Monitoring Vessels Seismic 0 0 0 0 0 0 2 2 0 0 0 0 4Monitoring Vessels Non-seismic 15 1 1 0 1 0 10 12 1 2 1 1 45
Monitoring Vessels Total 15 1 1 2 1 0 12 14 1 2 1 1 51
Initial Behavior
TABLE 5.6. Reaction of cetaceans by seismic period from MMO sightings aboard the Gilavar and its monitoring vessels during the Chukchi Sea survey (18 Jul – 31 Aug 2008).
Vessel and Seismic Status SplashIncrease in speed
Change in
directionLook at Vessel None Totals
Gilavar Seismic 0 0 0 0 0 0Gilavar Non-seismic 0 0 0 0 14 14
Gilavar Total 0 0 0 0 14 14
Monitoring Vessels Seismic 0 1 0 0 3 4Monitoring Vessels Non-seismic 2 4 1 0 40 47
Monitoring Vessels Total 2 5 1 0 43 51
Reaction

5-12 Monitoring in the Chukchi and Beaufort Seas: Shell Offshore Inc, 2008 Seals Seal Distribution and Closest Observed Point of Approach
Thirty-five and 115 seal groups were observed from the Gilavar and monitoring vessels, respectively (Table 5.2). Many more seal sightings were recorded during non-seismic periods compared to seismic periods (125 and 25 sightings, respectively; Fig 5.8 and Table 5.7). CPA values for seals observed from both the Gilavar and its monitoring vessels were greater during non-seismic than seismic periods (Table 5.7). There was no statistical difference between the seal CPA distance during seismic and non-seismic periods from either the Gilavar or monitoring vessels (wilcoxon test: W = 72, p = 0.163 for the Gilavar and W = 605, p = 0.072 for the monitoring vessels). Seals were observed closer to the monitoring vessels than to the Gilavar (Table 5.7). Seal Movement
Most of the seal seal movements recorded during the Chukchi Sea survey were either neutral or unknown relative to the vessels (Table 5.8). Seals observed from the Gilavar appeared to be “swimming away” from the active sound source, where as seals observed from the monitoring vessels “swam towards” the vessels during seismic periods. Data regarding seal movement relative to the Gilavar and its monitoring vessels during non-seismic periods suggested no specific direction in seal movement.
TABLE 5.7. Comparison of seal CPA distances by seismic period from MMO sightings aboard the Gilavar and its monitoring vessels during the Chukchi Sea survey (18 Jul – 31 Aug 2008). The overall mean includes both seismic and non-seismic CPA distances in the calculation.
Vessel and Seismic Status Mean CPAa (m) s.d. Range (m) n
Gilavar Seismic 539 216 316-847 8Gilavar Non-seismic 784 457 300-2129 27
Gilavar Overall Mean 728 424 300-2129 35
Monitoring Vessels Seismic 85 122 10-441 17Monitoring Vessels Non-seismic 142 239 5-1845 98
Monitoring Vessels Overall Mean 134 226 5-1845 115
a CPA = Closest Point of Approach . For Gilavar this value is the marine mammal's closest point of approach to the airgun array, formonitoring vessels this value is the marine mammal's closest point of approach to the MMO/vessel.

Chapter 5: Chukchi Sea Seismic Survey Monitoring 5-13
TABLE 5.8. Comparison of seal movement relative to vessels by seismic state from the Gilavar and monitoring vessels during the Chukchi Sea survey (18 Jul - 31 Aug 2008).
Vessel and Seismic StatusSwim
TowardsSwim Away Neutral None Unknown Totals
Gilavar Seismic 0 4 0 0 4 8Gilavar Non-seismic 3 8 10 1 5 27
Gilavar Total 3 12 10 1 9 35
Monitoring Vessels Seismic 3 0 6 0 8 17Monitoring Vessels Non-seismic 12 17 37 1 31 98
Monitoring Vessels Total 15 17 43 1 39 115
Movement Relative to Vessel
Initial Seal Behavior Initial seal behaviors did not appear to differ between seismic and non-seismic periods. Half of the
recorded initial behaviors of seals sighted (75 of 150) was “look at vessel”. Observations from the monitoring vessels indicated that animals spent more time active at the surface during non-seismic periods (Table 5.9). Reaction Behavior
The most common reaction recorded for seals was “none” on the Gilavar and the monitoring vessels (Table 5.10). The Gilavar MMOs reported that 18 of 35 seals showed no reaction; monitoring vessels’ MMOs reported that 46 of the 115 seals exhibited no reaction. “Look at vessel” was the second most frequently recorded seal reaction observed from the Gilavar followed by splash, increase in speed and change in direction (Table 5.10).

5-14 Monitoring in the Chukchi and Beaufort Seas: Shell Offshore Inc, 2008
TABLE 5.9. Comparison of seal initial behavior by seismic period from MMO sightings aboard the Gilavar and its monitoring vessels during the Chukchi Sea survey (18 Jul – 31 Aug 2008).
Vessel and Seismic Status DiveFront Dive
Look at Vessel Raft Sink Swim
Surface Active
Surface Travel Thrash Splash Totals
Gilavar Seismic 0 0 6 0 0 2 0 0 0 0 8Gilavar Non-seismic 0 1 13 0 1 11 0 0 0 1 27
Gilavar Total 0 1 19 0 1 13 0 0 0 1 35
Monitoring Vessels Seismic 0 0 11 0 0 1 5 0 0 0 17Monitoring Vessels Non-seismic 7 3 45 1 2 12 22 1 5 0 98
Monitoring Vessels Total 7 3 56 1 2 13 27 1 5 0 115
Initial Behavior
TABLE 5.10. Reaction of seals by seismic period aboard the Gilavar and its monitoring vessels during the Chukchi Sea survey (18 Jul - 31 Aug 2008).
Vessel and Seismic Status SplashIncrease in speed
Change in
directionLook at Vessel None Totals
Gilavar Seismic 0 0 0 3 5 8Gilavar Non-seismic 6 1 0 7 13 27
Gilavar Total 6 1 0 10 18 35
Monitoring Vessels Seismic 1 0 0 11 5 17Monitoring Vessels Non-seismic 17 15 1 24 41 98
Monitoring Vessels Total 18 15 1 35 46 115
Reaction

Chapter 5: Chukchi Sea Seismic Survey Monitoring 5-15
Pacific Walruses The single Pacific walrus observed from a monitoring vessel was sighted during a non-seismic
period approximately 364 m (398 yd) from the vessel off the port bow. The animal was initially seen looking at the vessel but its movement could not be determined. Gilavar MMOs did not observe any Pacific walruses during the Chukchi Sea survey.
Mitigation Measures Implemented During the early part of the survey SOI operated under their 2007 IHA, therefore the 2007 Chukchi
Sea safety radii were applied until 18 Aug 2008. Once the 2008 IHA was issued an SSV was completed, the results reported (Table 4.1), and the updated radii implemented. The ≥190 dB (rms) safety radii for seals in 2007 were 550 m (601 yd) from the full operating array and 10 m (11 yd) from the mitigation airgun. Safety radii for cetaceans were 2.47 km (1.5 mi) for the ≥180 dB (rms) zone and 24 m (26 yd) for the single mitigation gun. In 2007 the ≥160 dB (rms) disturbance radius for the full array was 8.1 km or 5 mi. The 2008 SSV results increased the ≥190 dB safety radius for the full array to 610 m (667 yd); the safety radius around the mitigation gun remained 10 m (11 yd). The ≥160 dB (rms) disturbance radius also increased due to the 2008 SSV results, to 13 km or 8 mi. The ≥180 dB safety radius around the full array decreased to 2 km (1.2 mi) while the safety radius around the mitigation airgun decreased to 10 m (11 yd).
Five power downs of the airgun array were requested by Gilavar MMOs due to seals sighted within or approaching the ≥190 dB (rms) safety radius of the active array during the Chukchi Sea survey (Table 5.11). There were no power downs of the airguns for cetaceans or Pacific walruses during the survey. No complete shutdowns were required as a result of a marine mammal within or near safety radii of the mitigation airgun.
The first power down was implemented 28 Jul when a spotted seal was observed near the 550 m (601 yd) safety radius. MMOs estimated the animal to be 619 m from the active array, so it was unlikely that the animal was exposed to a sound level ≥190 dB (rms), even when applying the updated safety radius based on the sound measurements in 2008. The post-18 Aug power downs were due to sightings of seals within the revised 610 m (667 yd; ≥190 dB) safety radius. Each of the power downs occurred when the array was operating at full volume (3147 in3). None of the seals that caused the power downs were seen within the 10 m (11 yd) safety radius of the mitigation gun, so no shut downs were requested. This section includes all MMO sightings data, not only those that meet the analysis criteria described in Chapter 4. ≥160 dB Zone Monitoring Results Described
MMOs aboard monitoring vessels actively assisted with monitoring the >180 dB safety radius and the larger ≥160 dB (rms) disturbance radius. The Gilavar occasionally had as many as three vessels assisting with monitoring of the safety and disturbance radii. The IHA issued by NMFS to SOI required that the full array be powered down if a group of 12 or more non-migratory mysticete whales were observed within the ≥160 dB radius. Similarly, the LoA issued by USFWS required a power down of the array if a group of 12 or more Pacific walruses was detected within the ≥160 dB area. No aggregates of 12 or more non-migratory mysticete whales or Pacific walruses were observed by the MMOs during the Chukchi Sea survey.

5-16 Monitoring in the Chukchi and Beaufort Seas: Shell Offshore Inc, 2008
Estimated Number of Marine Mammals Present and Potentially Affected It was difficult to obtain meaningful estimates of “take by harassment” for several reasons: (1) The
relationship between numbers of marine mammals that are observed and the number actually present is uncertain. (2) The most appropriate criteria for “take by harassment” are uncertain and presumed to vary among different species, individuals within species, and situations. (3) The distance to which a received sound level reaches a specific criterion such as 190 dB, 180 dB, 170 dB, or 160 dB re 1 µPa (rms) is variable. The received sound level depends on water depth, sound-source depth, water-mass and bottom conditions, and—for directional sources—aspect (Chapter 3; see also Greene 1997, Greene et al. 1998; Burgess and Greene 1999; Caldwell and Dragoset 2000; Tolstoy et al. 2004a,b). (4) The sounds received by marine mammals vary depending on their depth in the water, and will be considerably reduced for animals near the surface (Greene and Richardson 1988; Tolstoy et al. 2004a,b) and even further reduced for animals that are on ice.
Two methods were used to estimate the number of marine mammals exposed to seismic sound levels strong enough that they might have caused a disturbance or other potential impacts. The procedures included (A) minimum estimates based on the direct observations of marine mammals by MMOs, and (B) estimates based on pinniped and cetacean densities obtained during this study. The actual number of individuals exposed to, and potentially impacted by, strong seismic survey sounds likely was between the minimum and maximum estimates provided in the following sections. Further details about the methods and limitations of these estimates are provided below in the respective sections. This section includes all MMO sightings data, not only those that meet the analysis criteria described in Chapter 4. Disturbance and Safety Criteria
Table 4.1 summarizes estimated received sound levels at various distances from the Gilavar’s 24-airgun array. USFWS required the received sound levels of ≥180 dB and ≥190 dB re 1 μPa (rms) as mitigation criteria for Pacific walruses and polar bears, respectively, in 2008. The application of the ≥180 dB (rms) criterion for Pacific walruses for the second consecutive year was a more conservative approach to walrus mitigation than the use of the ≥190 dB (rms) exclusion area required in 2006.
TABLE 5.11. Power downs for marine mammals sighted in or near the Gilavar's ≥190-dB safety radius (610 m; 667 yd) for seals during the Chukchi Sea seismic survey (18 Jul – 31 Aug 2008).
Sighting ID SpeciesGroup Size Date
Water Depth (m)
Reaction to Vessela
Distance to airguns at
first detection
(m)CPAb to
airguns (m)
GIL200889 Spotted seal 1 28-Jul 39.5 LO 619 619GIL2008145 Unidentified seal 1 21-Aug 41.5 LO 318 318GIL2008148 Ringed seal 1 23-Aug 41.7 CD 583 583GIL2008149 Unidentified seal 1 26-Aug 40.2 LO 316 316GIL2008151 Spotted seal 1 27-Aug 42.2 NO 360 360
b CPA=Closest Point of Approach
a Observed reaction of animal to vessel: CD=Change Direction, LO=Look at Vessel, NO=None

Chapter 5: Chukchi Sea Seismic Survey Monitoring 5-17
Estimates from Direct Observations All sightings data were included in the following exposure estimates based on direct observations
regardless of whether they met the data-analysis criteria discussed in Chapter 4. The number of animals actually sighted by observers within the various sound level distances during seismic activity provided a minimum estimate of the number potentially affected by seismic sounds. Some animals probably moved away before coming within visual range of MMOs, and it was unlikely that MMOs were able to detect all of the marine mammals near the vessel trackline. During daylight, animals are missed if they are below the surface when the ship is nearby. Some other mammals, even if they surface near the vessel, are missed because of limited visibility (e.g. fog), glare, or other factors limiting sightability. Visibility and high sea conditions are often significant limiting factors. Also, sound levels were estimated to be ≥160 dB re 1 μPa (rms) out to 13 km (8 mi). This distance was generally well beyond those at which MMOs can detect even the more conspicuous animals under favorable sighting conditions during daytime and this was the rationale behind the use of monitoring vessels for the ≥160 dB disturbance zone. Furthermore, marine mammals could not be seen effectively during periods of darkness, which occurred for increasing numbers of hours per day after 18 Aug. Nighttime observations were not required except prior to and during nighttime power ups and if a power down had been implemented during daytime.
Animals may also have avoided the area near the seismic vessel while the airguns were firing (see Richardson et al. 1995, 1999; Stone 2003; Gordon et al. 2004; Smultea et al. 2004). Within the assumed ≥160–170 dB radii around the source (i.e., ~4.5–13.0 km; ~2.8-8.0 mi), and perhaps farther away in the case of the more sensitive species and individuals, the distribution and behavior of pinnipeds and cetaceans may have been altered as a result of the seismic survey. Changes in distribution and behavior could result from reactions to the airguns, or to the Gilavar and monitoring vessels themselves. The extent to which the distribution and behavior of pinnipeds might be affected by the airguns is uncertain, given variable previous results (Harris et al. 2001; Moulton and Lawson 2002; Miller et al. 2005). It was not possible to determine if cetaceans beyond the distance at which they were detectable by MMOs exhibited avoidance behavior.
Cetaceans Potentially Exposed to Sounds ≥180 dB re 1 μPa (rms) No cetaceans were observed from the Gilavar while the airguns were active during the Chukchi
Sea survey. MMOs aboard the monitoring vessels reported four groups of seven individual cetaceans during seismic operations. Each cetacean group was sighted while the mitigation gun was firing, and none were recorded within the ≥180 dB safety radius of the Gilavar’s active mitigation gun. It was unlikely that any cetaceans were exposed to received levels ≥180 dB rms (Table 5.10).
Seals Potentially Exposed to Sounds ≥190 dB re 1 μPa (rms) Ten seals (ten individuals) were recorded from the Gilavar while airguns were firing during the
Chukchi Sea survey. Eight seals were sighted while the full airgun array was operating and two were observed while the mitigation airgun was firing. MMOs initiated power downs because of the proximity of seals to the array five times (Table 5. 11). Four seals were observed within the ≥190 dB safety radius of the active array and power downs were implemented. A fifth seal was recorded 619 m (677 yd) from the operating airguns. MMOs requested a power down for this animal because of its proximity to the active airgun array. The seal was likely not exposed to a sound level ≥190 dB rms, but was likely exposed to levels ≥180 dB (rms). The remaining five seals were observed outside the ≥190 dB safety radius around the airgun array.

5-18 Monitoring in the Chukchi and Beaufort Seas: Shell Offshore Inc, 2008
TABLE 5.12. Number of individual marine mammals observed within specific safety radii and potentially exposed to the respective sound levels during the Chukchi Sea seismic survey (18 Jul - 31 Aug 2008).
Cetaceans ≥180
Seals ≥190
Pacific Walruses ≥180
0 4 0
Number of Individuals and Exposure Level in dB re 1μPa (rms)
Pacific Walruses Potentially Exposed to Sounds ≥180 dB re 1 μPa (rms) No Pacific walruses were sighted by MMOs aboard the Gilavar during the 2008 Chukchi Sea
survey. Two walruses were reported from the monitoring vessels, one of which was seen during seismic activity. This animal was estimated to be ~28 km from the operating airgun array, well outside the ≥180 dB safety radius (610 m or 667 yd). No power downs were implemented for Pacific walruses.
Estimates Extrapolated from Density The number of marine mammals visually detected by MMOs likely underestimated the actual
numbers that were present for reasons described above. To correct for animals that may have been present but not sighted by observers, the sightings recorded during seismic and non-seismic periods along with detectability corrections f(0) and g(0) were used to calculate separate densities of marine mammals present in the project area. These “corrected” densities of marine mammals multiplied by the area of water ensonified (exposed to seismic sounds) were used to estimate the number of individual marine mammals exposed to sound levels ≥160, 170, 180, and 190 dB (rms). The average number of exposures per individual marine mammal was calculated using the overlap in ensonified areas around nearby seismic lines, and the fact that an animal remaining in the area would have been exposed repeatedly to the passing seismic source.
Marine mammal densities were based on data collected from the Gilavar and its monitoring vessels (Gulf Provider, Theresa Marie, Torsvik,and two additional vessels working for Shell, Norseman II and Arctic Seal,) during SOI’s seismic operations in the Chukchi Sea. The density data for the Chukchi Sea survey, including corrections for sightability biases, are summarized in Table 5.13, and the ensonified areas are presented in Table 5.14. The methodology used to estimate the areas exposed to received levels ≥160, 170, 180 and 190 dB (rms) was described in Chapter 4 and in more detail in Appendix F.
The following estimates based on density assume that all mammals present were well below the surface where they were exposed to received sound levels at various distances as predicted in Chapter 3 and summarized in Table 4.1. Some pinnipeds and cetaceans in the water might remain close to the surface, where sound levels would be reduced by pressure-release effects (Greene and Richardson 1988). Also, some pinnipeds and cetaceans may have moved away from the path of the Gilavar before it arrived, either because the monitoring vessels frequently traveled in front of the Gilavar, or because of an avoidance response to the approaching source vessel and its airguns. The estimated number of exposures based on non-seismic periods in Tables 5.15, 5.16 and “Pacific Walruses” represented the number of animals that would have been exposed had they not shown any localized avoidance of the airguns or the ships themselves and therefore likely overestimate actual numbers of animals exposed to the various received sound levels. The estimates based on densities observed during seismic periods are likely closer to the true numbers of animals that were exposed to the various received sound levels.

Chapter 5: Chukchi Sea Seismic Survey Monitoring 5-19
TABLE 5.13. Densities of marine mammals in offshore areas of the Alaskan Chukchi Sea by seismic state for the Chukchi Sea seismic survey (18 Jul – 31 Aug 2008). Densities are corrected for f(0) and g(0) biases.
Non-seismic Densities Seismic DensitiesSpecies (No. individuals / 1000 km2) (No. individuals / 1000 km2)
Cetaceans Gray Whale 1.6026 0.1467 Humpback Whale 0.0659 0.0000 Fin Whale 0.0942 0.0000 Minke Whale 0.1323 0.0000 Harbor Porpoise 0.7764 2.0335 Unidentified Mysticete Whale 1.5508 0.0000 Unidentified Whale 0.5928 0.0000
Cetacean Total 4.8150 2.1802
Seals Bearded Seal 1.7263 0.6628 Ringed Seal 18.9720 23.2579 Spotted Seal 8.1800 0.3864 Ribbon Seal 0.0459 0.0000 Unidentified Seal 24.1214 13.6025 Unidentified Pinniped 3.0444 0.0000
Seal Total 56.0901 37.9096
Pacific Walruses 0.0592 0.0000
TABLE 5.14. Estimated areas (km2) ensonified to various sound levels during the Chukchi Sea seismic survey (18 Jul – 31 Aug 2008). Maximum area ensonified is shown with overlapping areas counted multiple times, total area ensonified shown with overlapping areas counted only once.
Area (km2) ≥120 ≥160 ≥170 ≥180 ≥190
Including Overlap Area 3,199,991 88,270 30,001 8658 2480Excluding Overlap Area 133,394 8949 4281 2137 1034
Level of ensonification (dB re1μPa (rms))

5-20 Monitoring in the Chukchi and Beaufort Seas: Shell Offshore Inc, 2008 Cetaceans
Table 5.15 summarizes the estimated numbers of cetaceans that might have been exposed to received sounds at various levels. The density data are shown in Table 5.13, and the ensonified areas are presented in Table 5.14. Higher sighting rates during non-seismic periods from both the Gilavar and its monitoring vessels (Fig. 5.4) suggest that some of the animals moved away before being exposed to strong sounds.
(A) ≥160 dB (rms): We estimated that 43 individual cetaceans would each have been exposed ~10 times to airgun pulses with received levels ≥160 dB re 1 μPa (rms) during the survey if all cetaceans showed no avoidance of active airguns or vessels (Table 5.15). Based on the proportion of identified species and available densities, ~23 of these animals would have been gray whales and there would have been approximately nine each of minke whales and harbor porpoises.
(B) ≥170 dB (rms): Some odontocete species may be disturbed only if exposed to received levels of airgun sounds ≥170 dB re 1 μPa (rms). Overall, there would have been ~21 individual cetaceans exposed to seismic sounds ≥170 dB with ~seven exposures per individual (Table 5.15).
(C) ≥180 dB (rms): If there were no avoidance of airgun noise by cetaceans, we estimated that there would have been ~10 individual cetaceans exposed ~four times each to seismic sounds ≥180 dB (Table 5.15). However, most of these cetaceans probably moved away before being exposed to received levels ≥180 dB. As noted earlier, no cetacean sightings were reported from the Gilavar during seismic operations. Seals
Table 5.16 summarizes the estimated numbers of pinnipeds potentially exposed to received sounds of various levels during the Chukchi Sea survey. Exposure estimates were based on the ensonified areas (Table 5.14) and density data (Table 5.13). Apparent reactions of seals to the vessels were recorded more often during seismic periods than non-seismic periods (Table 5.10) and the sighting frequency of seals from the Gilavar during seismic activities was lower than during non-seismic periods (Fig. 5.9). However, sighting rates from monitoring vessels during seismic operations were higher than during non-seismic periods (Fig. 5.9). Seals were not expected to display much avoidance of the survey operations (Harris et al. 2001) but some avoidance appears to have occurred based on the seismic and non-seismic densities. The ≥180-160 dB rms sound level radii extended from 2 km (1.2 mi) to 13 km (8 mi) from the sound source. Because of the large size of the area, animals may have been missed by the observers even during airgun operations conducted with good visibility.
TABLE 5.15. Estimated numbers of individual cetaceans exposed to received sound levels ≥160, 170, 180, and 190 dB (rms) and average number of exposures per individual within the Chukchi Sea seismic surveys. Estimates were based on “corrected” non-seismic and seismic densities.
Exposure level in dB re 1μPa (rms) Individuals
Exposures per Individual Individuals
Exposures per Individual
≥160 43 10 20 10≥170 21 7 9 7≥180 10 4 5 4≥190 5 2 2 2
Non-seismic Densities Seismic Densities

Chapter 5: Chukchi Sea Seismic Survey Monitoring 5-21
(A) ≥160 dB (rms): We estimated that ~502 individual seals would have been exposed ~10 times each to airgun pulses with received levels ≥160 dB re 1 μPa (rms) during the survey, assuming no avoidance of the ≥160 dB rms zone (Table 5.14). Based on the available densities and proportion of identified species, 362 of the animals would have been ringed seals, 95 would have been spotted seals, and 44 would have been bearded seals.
(B) ≥170 dB (rms): Some seals may be disturbed only if exposed to received levels ≥170 dB re 1 μPa (rms). Overall, there would have been ~240 individual seals exposed ~seven exposures each to seismic sounds ≥170 dB (Table 5.14).
(C) ≥180 dB (rms): We estimated that ~120 individual seals were each exposed ~4 times to sounds ≥180 dB assuming no avoidance of the seismic activities (Table 5.14).
(D) ≥190 dB (rms): Based on densities calculated from sighting rates during non-seismic periods, we estimated that there would have been 58 individual seals exposed twice each to received levels ≥190 dB (rms) if there were no avoidance (Table 5.16). This estimate was higher than the number of seals exposed to received levels ≥190 rms (n = 4) based on direct observations (Table 5.11) Some pinnipeds within the ≥190 dB radius presumably were missed during times when MMOs were on watch as well as at night when MMOs generally were not on watch. Even during times when MMOs were on watch, some seals at the surface could have been missed due to brief surface times, poor visibility, rough seas, and other factors. Because of this, density-based estimates of exposures and exposed individuals are higher than those based on direct observation. The monitoring vessels might be expected to displace some pinnipeds from the trackline before the Gilavar arrived, and some additional pinnipeds likely swam away in response to the approaching Gilavar to avoid exposure to seismic sound. Therefore, the actual number exposed to ≥190 dB rms was probably lower than the estimate calculated from non-seismic densities, but greater than that from direct observations.
TABLE 5.16. Estimated numbers of individual seals exposed to received sound levels ≥160, 170, 180, and 190 dB (rms) and average number of exposures per individual within the Chukchi Sea seismic surveys. Estimates were based on “corrected” non-seismic and seismic densities.
Exposure level in dB re 1μPa (rms) Individuals
Exposures per Individual Individuals
Exposures per Individual
≥160 502 10 339 10≥170 240 7 162 7≥180 120 4 81 4≥190 58 2 39 2
Non-seismic Densities Seismic Densities

5-22 Monitoring in the Chukchi and Beaufort Seas: Shell Offshore Inc, 2008 Pacific Walruses
During the survey, a single Pacific walrus was observed during a non-seismic period. Applying the density estimate based on the sighting recorded by MMOs (Table 5.13) and the area ensonified by the seismic survey activities (Table 5.14), we estimated that one Pacific walrus might have been exposed to received sound levels of ≥160 dB (rms) ~10 times.
Literature Cited Burgess, W.C. and C.R. Greene. 1999. Physical acoustics measurements. p. 3-1 to 3-65 In: W.J. Richardson (ed.),
Marine mammal and acoustical monitoring of Western Geophysical’s open-water seismic program in the Alaskan Beaufort Sea, 1998. LGL Rep. TA2230-3. Rep. from LGL Ltd., King City, Ont., and Greeneridge Sciences Inc., Santa Barbara, CA, for Western Geophysical, Anchorage, AK, and Nat. Mar. Fish. Serv., Anchorage, AK, and Silver Spring, MD. 390 p.
Caldwell, J. and W. Dragoset. 2000. Brief overview of seismic air-gun arrays. The Leading Edge 19(8, Aug.):898-902.
Gordon, J., D. Gillespie, J. Potter, A. Frantzis, M.P. Simmonds, R. Swift and D. Thompson. 2004. A review of the effects of seismic surveys on marine mammals. Mar. Technol. Soc. J. 37(4):16-34.
Greene, C.R., Jr. and W.J. Richardson. 1988. Characteristics of marine seismic survey sounds in the Beaufort Sea. J. Acoust. Soc. Am. 83(6):2246-2254.
Greene, C.R., Jr. 1997. Physical acoustics measurements. (Chap. 3, 63 p.) In: W.J. Richardson (ed.), 1997. North-star Marine Mammal Marine Monitoring Program, 1996. Marine mammal and acoustical monitoring of a seismic program in the Alaskan Beaufort Sea. Rep. TA2121–2. Rep. from LGL Ltd., King City, Ont., and Greeneridge Sciences Inc., Santa Barbara, CA, for BP Explor. (Alaska) Inc., Anchorage, AK, and U.S. Nat. Mar. Fish. Serv., Anchorage, AK, and Silver Spring, MD. 245 p.
Greene, C.R., Jr., R. Norman and J.S. Hanna. 1998. Physical acoustics measurements. p. 3-1 to 3-64 In: W.J. Richardson (ed.), Marine mammal and acoustical monitoring of BP Exploration (Alaska)’s open-water seismic program in the Alaskan Beaufort Sea, 1997. LGL Rep. TA2150-3. Rep. from LGL Ltd., King City, Ont., and Greeneridge Sciences Inc., Santa Barbara, CA, for BP Explor. (Alaska) Inc., Anchorage, AK, and U.S. Nat. Mar. Fish. Serv., Anchorage, AK, and Silver Spring, MD. 318 p.
Harris, R.E., G.W. Miller and W.J. Richardson. 2001. Seal responses to airgun sounds during summer seismic surveys in the Alaskan Beaufort Sea. Mar. Mamm. Sci. 17(4):795-812.
Miller, G.W., V.D. Moulton, R.A. Davis, M. Holst, P. Millman, A. MacGillivray and D. Hannay. 2005. Monitoring seismic effects on marine mammals--southeastern Beaufort Sea, 2001-2002. p. 511-542 In: S.L. Arms-worthy, P.J. Cranford and K. Lee (eds.), Offshore oil and gas environmental effects monitoring/Approaches and technologies. Battelle Press, Columbus, OH.
Moulton, V.D. and J.W. Lawson. 2002. Seals, 2001. p. 3-1 to 3-48 In: W.J. Richardson and J.W. Lawson (eds.), Marine mammal monitoring of WesternGeco’s open-water seismic program in the Alaskan Beaufort Sea, 2001. LGL Rep. TA2564-4. Rep. from LGL Ltd., King City, Ont., for WesternGeco LLC, Anchorage, AK; BP Explor. (Alaska) Inc., Anchorage, AK; and Nat. Mar. Fish. Serv., Anchorage, AK, and Silver Spring, MD. 95 p.
Richardson, W.J., C.R. Greene, Jr., C.I. Malme and D.H. Thomson. 1995. Marine mammals and noise. Academic Press, San Diego. 576 p.
Richardson, W.J., G.W. Miller and C.R. Greene Jr. 1999. Displacement of migrating bowhead whales by sounds from seismic surveys in shallow waters of the Beaufort Sea. J. Acoust. Soc. Am. 106(4, Pt. 2):2281.
Smultea, M.A., M. Holst, W.R. Koski and S. Stoltz. 2004. Marine mammal monitoring during Lamont-Doherty Earth Observatory’s seismic program in the Southeast Caribbean Sea and adjacent Atlantic Ocean, April–
Chapter 5: Chukchi Sea Seismic Survey Monitoring 5-23
June 2004. LGL Rep. TA2822-26. Rep. from LGL Ltd., King City, Ont., for Lamont-Doherty Earth Observatory of Columbia Univ., Palisades, NY, and Nat. Mar. Fish. Serv., Silver Spring, MD. 106 p.
Stone, C.J. 2003. The effects of seismic activity on marine mammals in UK waters 1998-2000. JNCC Rep. 323. Joint Nature Conserv. Commit., Aberdeen, Scotland. 43 p.
Tolstoy, M., J. Diebold, S. Webb, D. Bohnenstiehl and E. Chapp. 2004a. Acoustic calibration measurements. Chap. 3 In: W.J. Richardson (ed.), Marine mammal and acoustic monitoring during Lamont–Doherty Earth Observatory's acoustic calibration study in the northern Gulf of Mexico, 2003. Revised ed. Rep. from LGL Ltd., King City, Ont., for Lamont–Doherty Earth Observ., Palisades, NY, and Nat. Mar. Fish. Serv., Silver Spring, MD. (Advance copy).
Tolstoy, M., J.B. Diebold, S.C. Webb, D.R. Bohenstiehl, E. Chapp, R.C. Holmes and M. Rawson. 2004b. Broad-band calibration of R/V Ewing seismic sources. Geophys. Res. Lett. 31: L14310.


Chapter 6: Chukchi Sea Shallow Hazards Monitoring 6-1
6. CHUKCHI SEA VESSEL-BASED SHALLOW HAZARDS AND SITE CLEARANCE MONITORING8
Monitoring Effort and Marine Mammal Encounter Results This chapter summarizes the visual monitoring effort and marine mammal sightings from the Cape
Flattery and the Alpha Helix during shallow hazards and site clearance surveys in the Chukchi Sea in 2008. The Cape Flattery entered the Chukchi Sea on 28 Aug and conducted surveys, at times using up to four 10–in3 airguns, on or near SOI lease blocks in the Chukchi Sea until it exited the study area on 13 Sep. The Alpha Helix entered the Chukchi Sea on 22 Aug and conducted surveys, but did not use airguns, until it exited the study area on 1 Sep. Additional information regarding the activities of the Cape Flattery and Alpha Helix can be found in Chapter 2. Descriptions of the vessels and survey equipment can be found in Appendix D. Visual Survey Effort
In contrast to the differences in pinniped and cetacean monitoring effort during seismic surveys from the Gilavar, there was little difference (<3%) in pinniped and cetacean effort during project activities aboard the Cape Flattery and Alpha Helix. This was due to the lack of monitoring vessels near the Cape Flattery and Alpha Helix. The presence of monitoring vessels near the Gilavar resulted in less effort meeting analysis criteria for cetacean observations as described in Chapter 4. Given that cetacean and pinniped effort were similar during the shallow hazards and site clearance surveys, only cetacean effort is discussed in this section describing survey effort. Cape Flattery
In 2008, the Cape Flattery traveled along ~3180 km (~1976 mi) of trackline in the Chukchi Sea. Shallow hazards seismic survey activities were conducted along ~671 km (~417 mi) of that trackline. The Cape Flattery’s full airgun array (four 10–in3 airguns) was firing for ~449 km (~279 mi) and the single mitigation gun was firing for the remaining ~222 km (138 mi). MMOs were on watch during a total of ~2793 km (~1735 mi) of trackline, of which ~1742 km (~1082 mi; Fig. 6.1) met the data-analysis criteria described in Chapter 4. MMOs observed exclusively from the bridge of the Cape Flattery (eye-height ~11.0 m or 12.0 yd). One observer was on watch aboard the Cape Flattery during a total of ~40 km (~25 mi) and two observers were on watch during the remaining ~1702 km (~1058 mi) of survey effort. Alpha Helix
Within the Chukchi Sea, the Alpha Helix traveled along ~2623 km (~1630 mi) of trackline. The Alpha Helix did not conduct any shallow hazards seismic activity in the Chukchi Sea. However, approximately 29 km (~18 mi) of trackline, ~8 km (5 mi) of which met the data–analysis criteria, were considered exposed to seismic survey activity due to the proximity of the Alpha Helix to an active seismic vessel, the Cape Flattery. MMOs were on watch during a total of ~2075 km (~1289 mi) of trackline, of which ~1696 km (~1054 mi; Fig. 6.1) met the data-analysis criteria described in the Chapter 4. MMOs observed exclusively from the bridge of the Alpha Helix (eye height ~7.0 m or 7.7 yd). One observer was on watch aboard the Alpha Helix during a total of ~1289 km (~801 mi) and at least two observers were on watch during the remaining ~407 km (~253 mi) of survey effort.
8 By Joseph Beland, Craig Reiser, Beth Haley, and Danielle Savarese

6-2 Monitoring in the Chukchi and Beaufort Seas: Shell Offshore Inc, 2008
8
1382
1688
360
0200
400600800
100012001400
16001800
Cape Flattery Alpha Helix
MM
O E
ffort
(km
) SeismicNon-Seismic
FIGURE 6.1. Marine mammal observer effort (km) from the Cape Flattery and Alpha Helix by seismic activity in the Chukchi Sea study area (22 Aug – 13 Sep 2008).
Beaufort wind force (Bf) during observations aboard the Cape Flattery and Alpha Helix ranged from zero to five. Approximately 58% of Cape Flattery effort and ~68% of Alpha Helix effort occurred during conditions with Bf ≤ 3 (Appendix Table J.2). Survey effort from the Cape Flattery and Alpha Helix, subdivided by seismic activity and Beaufort wind force is summarized in Appendix Table J.2. Visual Sightings of Marine Mammals and Other Vessels Total Numbers of Marine Mammals Observed
In total, 15 individual marine mammals in 15 groups were recorded by MMOs on the Cape Flattery (Appendix Table J.1). Fourteen individual marine mammals in 14 groups, which included two cetacean and 12 seal sightings, met the analysis criteria and were the basis for the following analyses (Table 6.1). No polar bears or Pacific walruses were observed from the Cape Flattery.
MMOs aboard the Alpha Helix recorded a total of 203 individual marine mammals in 127 groups (Appendix Table J.1). Observations of 186 individual marine mammals in 114 groups met the analysis criteria and were the basis for the following analyses (Table 6.1). The observations included 11 sightings of cetaceans, 92 sightings of seals, and 11 sightings of Pacific walruses. No polar bears were observed from the Alpha Helix in the Chukchi Sea in 2008. Other Vessels
Few vessels not associated with survey activities near the Cape Flattery and Alpha Helix reported during the 2008 project activities. Vessels present were almost exclusively barges and support vessels associated with this project and reported elsewhere in this report. Most of these vessels were at distances >5 km (3 mi). Eleven vessels, however, were sighted within 5 km (3 mi) of the Cape Flattery and Alpha Helix. Seven marine mammals were sighted while another vessel was known to be within 5 km (3 mi) of the Cape Flattery and/or Alpha Helix, but no obvious reactions by marine mammals to the other vessels were observed.

Chapter 6: Chukchi Sea Shallow Hazards Monitoring 6-3
TABLE 6.1. Number of sightings (number of individuals) of marine mammals observed from the Cape Flattery and Alpha Helix during the Chukchi Sea shallow hazards survey (22 Aug- 13 Sep 2008).
Species
Cetaceans
Bowhead Whale 0 5 (13) 5 (13) Gray Whale 1 (1) 2 (4) 3 (5) Harbor Porpoise 1 (1) 0 1 (1) Unidentified Mysticete Whale 0 4 (6) 4 (6)
Total Cetaceans 2 (2) 11 (23) 13 (25)
Seals
Bearded Seal 1 (1) 34 (45) 35 (46) Bearded Seal (On Ice) 0 1 (1) 1 (1) Ringed Seal 7 (7) 7 (7) 14 (14) Spotted Seal 0 0 0 Unidentified Pinniped 0 12 (12) 12 (12) Unidentified Seal 4 (4) 38 (40) 42 (44)
Total Seals 12 (12) 92 (105) 104 (117)
Pacific Walruses
In Water 0 8 (16) 8 (16) On Ice 0 3 (42) 3 (42)
Total Pacific Walruses 0 11 (58) 11 (58)
Grand Total of All Sightings 14 (14) 114 (186) 128 (200)
Cape Flattery Alpha Helix Total
Cetaceans Total Numbers of Cetaceans Observed
Two cetacean sightings of two individuals were recorded from the Cape Flattery during survey activities in the Chukchi Sea in 2008 (Table 6.1). One gray whale and one harbor porpoise were identified to species.
Twenty-three cetaceans in 11 groups were sighted by MMOs on the Alpha Helix during shallow hazards and site clearance surveys in the Chukchi Sea in 2008. The observations included 13 bowheads and four gray whales in five and two groups, respectively. The remaining cetaceans were not identified to species. Cetacean Sightings with Airguns On
No cetacean sightings were recorded during periods of seismic survey activity from either the Cape Flattery or the Alpha Helix (Appendix Table J.4). Cetacean Sighting Rates
The cetacean sighting rate from the Cape Flattery during non-seismic periods (1.4 sightings/1000 km; 2.3 sightings/1000 mi) was lower than from the Alpha Helix (6.6 sightings/1000 km; 10.5 sightings/1000 mi). There was not a statistically significant difference in sighting rates between seismic

6-4 Monitoring in the Chukchi and Beaufort Seas: Shell Offshore Inc, 2008
and non-seismic periods for the Cape Flattery (χ2 = 0.522, df = 1, p = 0.470). However, the limited amount of seismic period effort (~360 km; ~224 mi) aboard the Cape Flattery makes this comparison of questionable value. A similar test was not able to be run for the Alpha Helix because of the extremely limited amount (<10 km; 6 mi) of seismic activity. Seals Total Numbers of Seals Observed
Twelve seals were sighted in 12 groups by MMOs on the Cape Flattery during the shallow hazards survey in the Chukchi Sea in 2008 (Table 6.1). Of the eight seal sightings in the study area that were identified to species by MMOs, seven were ringed seals and one was a bearded seal. Most of the unidentified seals were likely ringed seals based on the visual monitoring results and the known abundance and distribution of ringed seals in the study area. All seal sightings were of animals in the water; no seals were sighted on ice or land.
There were 92 seals sighted in 105 groups from the Alpha Helix during the 2008 Chukchi Sea shallow hazards and site clearance survey (Table 6.1). Most (~54%) of the seals observed by MMOs on the Alpha Helix were either unidentified seals or unidentified pinnipeds. In addition, one spotted seal was classified as an unidentified seal to be consistent with how spotted seals were dealt with for the Alpha Helix in the Beaufort Sea survey. Of the 42 seal sightings that were identified by MMOs, 35 were bearded seals. The remaining seven sightings were ringed seals. All seals were sighted in water with the exception of one which was on ice. Seal Sightings with Airguns On
No seal sightings were recorded during periods of seismic survey activity from either the Cape Flattery or the Alpha Helix. Seal Sighting Rates
The seal sighting rate from the Cape Flattery during non-seismic periods (8.5 sightings/1000 km; 13.7 sightings/1000 mi) was lower than from the Alpha Helix (51.6 sightings/1000 km; 83.0 sightings/1000 mi). There was not a statistically significant difference in sighting rates between seismic and non-seismic periods for the Cape Flattery (χ2 = 3.068, df = 1, p = 0.080). However, the limited amount of seismic period effort aboard the Cape Flattery makes this comparison of questionable value. Once again, a similar test was not able to be run for the Alpha Helix because of the extremely limited amount of seismic activity.
Pacific Walrus and Polar Bears Total Numbers of Pacific Walrus and Polar Bears
Eleven Pacific walrus sightings comprised of 58 individuals were recorded by MMOs on the Alpha Helix. Eight of the Pacific walrus sightings (16 individuals) were seen in the water, and the remaining three sightings (42 individuals) were seen on ice. Polar bears were not recorded by MMOs on either the Cape Flattery or Alpha Helix. Pacific Walrus and Polar Bear Sightings with Airguns On
No Pacific walrus or polar bear sightings were recorded during periods of seismic survey activity from either the Cape Flattery or the Alpha Helix. Pacific Walrus and Polar Bear Sightings Rates
Pacific walrus sighting rates from the Alpha Helix during non-seismic periods were 4.5 sightings in water /1000 km and 12.6 sightings on ice/1000 km (of effort in waters with ≥10% ice coverage).

Chapter 6: Chukchi Sea Shallow Hazards Monitoring 6-5
Meaningful comparisons of Pacific walrus and polar bear sighting rates during seismic and non-seismic periods could not be made because of the extremely limited amount of seismic activity from the Alpha Helix.
Distribution and Behavior of Marine Mammals The data collected during visual observations provided information about behavioral responses of
marine mammals to the seismic survey. The relevant data collected from the Cape Flattery and Alpha Helix included estimated closest observed points of approach (CPA) to the vessel, movement relative to the vessel, and behavior of animals at the time of the initial sightings. CPA of marine mammals to the vessel was calculated from the location of the airguns (or, during non-seismic periods, where the airguns would have been positioned behind the vessel if deployed).
Only limited behavioral data were collected during this project because individuals and/or groups of marine mammals were often at the surface only briefly, and some marine mammals may have also avoided the area of the survey activities. In addition, the Gilavar and monitoring vessels followed specific tracklines during the survey activities and were able to follow animals for further observation. This resulted in difficulties resighting animals, and in determining whether two sightings some minutes apart were repeat sightings of the same individual(s). No marine mammal sightings were recorded during shallow hazards seismic survey activities in the Chukchi Sea in 2008. However, the 2008 data from non-seismic periods could be useful as a basis of comparison with any future related results. Cetaceans Distribution and Closest Observed Point of Approach
Both cetacean sightings recorded from the Cape Flattery occurred during non-seismic periods. The mean CPA for cetaceans was 384 m or 420 yd (n = 2; s.d.= 30 m; range 362-405 m, s.d.= 33 yd; range 396-443 yd). Similarly, all 11 cetacean sightings from the Alpha Helix occurred during non-seismic periods. The mean CPA for cetaceans from the Alpha Helix was 705 m or 771 yd (n = 11; s.d.= 777 m; range 136-2834 m, s.d.= 850 yd; range 149-3099 yd). Movement and Initial Behavior
The initial behavior recorded for both cetacean sightings from the Cape Flattery was swimming. Of the two animals sighted from the Cape Flattery, one was traveling at an angle towards the vessel, and the other was traveling at an angle away from the vessel.
Behavior was recorded for nine of the 11 cetacean sightings from the Alpha Helix. The most common initial cetacean behavior was blowing (four of the 11 sightings). The initial behavior of the remaining five sightings for which behavior data were recorded were “surface active” (n = 2), diving (n= 1), fluking (n= 1), and traveling (n= 1). Of the 23 animals sighted from the Alpha Helix, six were traveling toward the vessel, three were traveling in a neutral direction relative to the vessel, and movement for 14 was unknown. Reaction Behavior
None of the cetaceans observed from either the Cape Flattery or Alpha Helix displayed an observable reaction to the vessel.

6-6 Monitoring in the Chukchi and Beaufort Seas: Shell Offshore Inc, 2008
Seals Distribution and Closest Observed Point of Approach
All seal sightings recorded from the Cape Flattery occurred during non-seismic periods. The mean CPA for seals was 305 m (334 yd; Table 6.2). Similarly, all 92 seal sightings from the Alpha Helix occurred during non-seismic periods. The mean CPA for seals from the Alpha Helix was 313 m (342 yd). Movement and Initial Behavior
Surface active and look were the most frequently recorded seal behaviors from the Cape Flattery and Alpha Helix combined (Table 6.3). Data regarding seal movement relative to the Cape Flattery and Alpha Helix during the Chukchi Sea shallow hazards survey did not contain an obvious trend. Reaction Behavior
The Cape Flattery MMOs reported that all but one seal sighted during non-seismic periods had “no reaction” to the vessel (11 of 12). Looking at the vessel was the only other reaction observed from the Cape Flattery. Seal reaction to the vessel was recorded for all seal sightings from the Alpha Helix. The most frequently recorded seal reactions from the Alpha Helix were “no reaction” (53%), “splash” (26%), and “look” (18%).
TABLE 6.2. Seal CPA recorded from the Cape Flattery and Alpha Helix by seismic state during the Chukchi Sea shallow hazards survey (22 Aug- 13 Sep 2008).
Vessel and Seismic Status Mean CPAa (m) s.d. Range (m) n
Cape Flattery Seismic -- -- -- --Cape Flattery Non-seismic 305 205 66-271 12
Cape Flattery Overall Mean 305 205 66-271 12
Alpha Helix Seismic -- -- -- --Alpha Helix Non-seismic 313 273 53-1902 92
Alpha Helix Overall Mean 313 273 53-1902 92
a CPA = Closest Point of Approach . This value is the marine mammal's closest point of approach to the airgun array. TABLE 6.3. Seal behaviors from the Cape Flattery and Alpha Helix during the Chukchi Sea shallow hazards survey (22 Aug- 13 Sep 2008). There were no seals observed during seismic periods.
Vessel and Seismic Status DiveFront Dive Thrash Look
Surface Active Sink Swim Other Totals
Cape Flattery Non-seismic 0 0 0 7 0 0 4 1 12Alpha Helix Non-seismic 0 6 2 27 39 5 5 8 92
Other= less numerous observations of bow ride, rest, travel, and unknown
Behavior

Chapter 6: Chukchi Sea Shallow Hazards Monitoring 6-7
Pacific Walruses and Polar Bears Distribution and Closest Observed Point of Approach
All 11 Pacific walrus sightings recorded from the Alpha Helix occurred during non-seismic periods. The mean CPA for Pacific walruses in the water was 152 m (166 yd; n = 8), and the mean CPA distance for Pacfic walruses on ice was 890 m (973 yd; n = 3; Table 6.4). Polar bears were not observed from either the Cape Flattery or Alpha Helix in the Chukchi Sea in 2008. Movement and Initial Behavior
The only Pacific walrus on–ice behavior observed from the Alpha Helix was resting (n=3). The most frequently recorded Pacific walrus behaviors in water were “surface active” and “look” (Table 6.5). Reaction Behavior
Nine Pacific Walrus reactions were recorded from the Alpha Helix including “no reaction” (n = six sightings), increase in speed (n = two sightings), and looking (n = one sighting). The two sightings where an increase in speed was noted were of animals in the water, and the walrus that looked was on ice. There was one occurrence where a group of walruses was initially observed hauled out on ice at a distance of 500 m and approached within 80 m as the vessel traveled through the ice. At approximately 80 m the animals moved off the ice and into the water in reaction to the passing vessel. The vessel approaching within 800m (one-half mile) of this group of walruses was in violation of the Letter of Authorization (LoA) issued to SOI, and was reported to the USFWS. TABLE 6.4. Pacific walrus CPA distances recorded in water and on ice from the Alpha Helix during the Chukchi Sea shallow hazards survey (22 Aug- 13 Sep 2008). There were no Pacific walruses observed during seismic periods.
Species and Seismic StatusMean CPA
(m)a s.d.Range
(m) n
Pacific Walruses in Water Non-Seismic 152.1 145.0 45-473 8Pacific Walruses on Ice Non-Seismic 890.0 916.9 117-1903 3
a CPA = Closest Point of Approach . For Alpha Helix: this value is the marine mammal's closest point of approach to the airgun array.
TABLE 6.5. Pacific walrus behaviors in water and on ice from the Alpha Helix during the Chukchi Sea shallow hazards survey (22 Aug- Sep 13 2008).
Species Dive Look RestSurface Active Travel Totals
Pacific Walrus in Water 1 2 0 4 1 8Pacific Walrus on Ice 0 0 3 0 0 3
Total Pacific Walruses 1 2 3 4 1 11
Behavior

6-8 Monitoring in the Chukchi and Beaufort Seas: Shell Offshore Inc, 2008
Mitigation Measures Implemented No power downs or shut-downs of the airguns were necessary or requested from the Cape
Flattery or Alpha Helix due to the detection of a marine mammal within the ≥180 and ≥190 dB safety radii. All marine mammal sightings from both the Cape Flattery and Alpha Helix occurred during non-seismic periods.
Estimated Number of Marine Mammals Present and Potentially Affected For reasons described in detail in this section in Chapter 5, it is difficult to obtain meaningful
estimates of “take by harassment”. Therefore, two methods were used to estimate the number of marine mammals exposed to seismic sound levels strong enough that they might have caused a disturbance or other potential impacts. The procedures included (A) minimum estimates based on the direct observations of marine mammals by MMOs, and (B) estimates based on cetacean and pinniped densities obtained during this study. The actual number of individuals exposed to, and potentially impacted by, strong seismic survey sounds likely was between the minimum and maximum estimates provided in the following sections. Disturbance and Safety Criteria
Table 4.5 summarizes the measured received sound levels at various distances from the airgun(s) deployed from the Cape Flattery. The ≥160 dB rms radius is an assumed behavioral disturbance criterion. During this and many other recent projects, NMFS has required that mitigation measures be applied to avoid, or minimize, the exposure of cetaceans and seals to impulse sounds with received levels ≥180 dB and ≥190 dB re 1 μPa (rms), respectively. No power downs or shut downs of the airguns were required during airgun operations for the Chukchi Sea shallow hazards and site clearance surveys in 2008. However, the safety and disturbance radii were used after the field season to estimate numbers of marine mammals potentially exposed to various received sound levels based on observed densities from the Cape Flattery. Estimates from Direct Observations
All sightings data were included in the following exposure estimates based on direct observations regardless of whether they met the data-analysis criteria discussed in Chapter 4, Analyses. The number of marine mammals observed close to the Cape Flattery during 2008 Chukchi Sea shallow seismic survey monitoring provided a minimum estimate of the number potentially affected by seismic sounds. This was likely an underestimate of the actual number potentially affected as described in detail in this section of Chapter 5.
Some animals may also have avoided the area near the seismic vessel while the airguns were firing (see Richardson et al. 1995, 1999; Stone 2003; Gordon et al. 2004; Smultea et al. 2004). The extent to which the distribution and behavior of marine mammals might be affected by the airguns (or vessels themselves) is uncertain, given variable previous results (Harris et al. 2001; Moulton and Lawson 2002; Miller et al. 2005).
Cetaceans Potentially Exposed to Sounds ≥180 dB re 1 μPa (rms) There were no cetaceans sighted from the Cape Flattery when the airguns were operating.
Therefore, the estimate of the number of cetaceans exposed to underwater sound levels ≥180 dB (rms) based on direct observations was zero.

Chapter 6: Chukchi Sea Shallow Hazards Monitoring 6-9
Seals Potentially Exposed to Sounds ≥190 dB re 1 μPa (rms) No seals were sighted from the Cape Flattery when the airguns were operating. Therefore, the
estimate of the number of seals exposed to underwater sound levels ≥190 dB (rms) based on direct observations was zero.
Pacific Walruses and Polar Bears Potentially Exposed to Sounds ≥190 dB re 1 μPa (rms) No Pacific walruses or polar bears were sighted from the Cape Flattery when the airguns were
operating. Therefore, the estimate of the numbers of walruses and polar bears exposed to underwater sound levels ≥190 dB (rms) based on direct observations was zero. Estimates Extrapolated from Density
The number of marine mammals visually detected by MMOs likely underestimated the actual numbers that were present for reasons described above. Indirect estimates based on the marine mammal densities observed from the vessels multiplied by the area ensonified (exposed to seismic sounds) provided an alternative method of estimating exposures as described in more detail in Chapter 5.
Densities were based on data collected from the Cape Flattery during SOI’s seismic operations in the Chukchi Sea. The density data for the 2008 Chukchi Sea shallow hazards survey are summarized in Table 6.6, and the ensonified areas are presented in Table 6.7.
The following estimates based on density assume that all mammals present were well below the surface where they would be exposed to the received sound levels at various distances as predicted in Chapter 3 and summarized in Table 4.5. Some pinnipeds and cetaceans in the water might remain close to the surface, where sound levels would be reduced by pressure-release effects (Greene and Richardson 1988). Also, some pinnipeds and cetaceans may have moved away from the path of the Cape Flattery, either because the approaching vessel itself, or because of an avoidance response to their airguns. The estimated number of takes based on non-seismic densities represented the number of animals that would have been exposed had they not shown any localized avoidance of the airguns or the ships themselves, and therefore likely overestimate actual numbers of animals exposed to the various received sound levels. The estimates based on densities observed during seismic periods are likely closer to the true numbers of animals that were exposed to the various received sound levels. Cetaceans
The estimated numbers of cetaceans that might have been exposed to various levels of received sounds are summarized in Table 6.8. The density data used to calculate these numbers, for non-seismic periods, are presented in Table 6.6.
(A) ≥160 dB (rms): Based on densities from non-seismic periods less than one individual cetacean was estimated to have been exposed ~three times to airgun pulses with received levels ≥160 dB re 1 μPa (rms) during the shallow-hazards survey if all cetaceans were below the surface of the water and showed no avoidance of the approaching vessel (Table 6.8).

6-10 Monitoring in the Chukchi and Beaufort Seas: Shell Offshore Inc, 2008
TABLE 6.6. Estimated densities of marine mammals in offshore areas of the Chukchi Sea based on effort and sightings from the Cape Flattery. Densities are corrected for f(0) and g(0) biases.
Non-seismic Densities Seismic DensitiesSpecies (No. individuals / 1000 km2) (No. individuals / 1000 km2)
Cetaceans Gray Whale 0.135 0.000* Harbor Porpoise 0.100 0.000*
Cetacean Total 0.236 0.000*
Seals Bearded Seal 6.586 0.000* Ringed Seal 3.188 0.000* Unidentified Seal 3.763 0.000*
Seal Total 13.537 0.000*
Pacific Walruses 0.000* 0.000*
* Estimates based on less than 500 km of effort
TABLE 6.7. Estimated areas (km2) ensonified to various sound levels during the Chukchi Sea shallow hazards survey (22 Aug - 13 Sep 2008). Maximum area ensonified is shown with overlapping areas counted multiple times, total area ensonified shown with overlapping areas counted only once.
Area (km2) 120 160 170 180 190
Including Overlap Area 78,019 1,618 501 154 46Excluding Overlap Area 8,895 630 339 128 42
Level of ensonification (dB re1μPa (rms))
TABLE 6.8. Estimated numbers of individual cetaceans exposed to received sound levels ≥160,170,180, and 190 dB (rms) and average number of exposures per individual during the Chukchi Sea shallow hazards survey (22 Aug- 13 Sep 2008). Estimates were based on densities of cetaceans calculated from effort during non-seismic periods.
Exposure level in dB re 1μPa (rms) Individuals
Exposures per Individual Individuals
Exposures per Individual
≥160 1* 2.6 0** 2.6≥170 1* 1.5 0** 1.5≥180 1* 1.2 0** 1.2≥190 1* 1.1 0** 1.1
* Actual value less than 1.** Estimates based on less than 500 km of effort
Non-seismic Densities Seismic Densities

Chapter 6: Chukchi Sea Shallow Hazards Monitoring 6-11
(B) ≥170 dB (rms): Based on non-seismic densities, less than one individual cetacean was estimated to have been exposed ~two times to seismic sounds ≥170 dB re 1 μPa (rms) assuming no cetacean avoidance of airgun noise (Table 6.8).
(C) ≥180 dB (rms): Based on non-seismic densities, less than one cetacean was estimated to have been exposed ~once to seismic sounds ≥180 dB assuming no avoidance of the seismic survey activities (Table 6.8). Seals
Table 6.9 summarizes the estimated numbers of seals that might have been exposed to received sounds at various levels during shallow hazards surveys in the Chukchi Sea in 2008. The estimated numbers in Table 6.9 are based on seal densities in Table 6.6 and estimates based on non-seismic densities represent seals that would have been exposed had the animals not shown localized avoidance of the airguns or the vessels themselves.
(A) ≥160 dB (rms): Nine individual seals were estimated to have been exposed ~three times to airgun pulses with received levels ≥160 dB re 1 μPa (rms) during the Chukchi shallow-hazards survey (Table 6.9).
(B) ≥170 dB (rms): Five individual seals were estimated to have been exposed to airgun pulses ~two times with received levels ≥170 dB re 1 μPa rms (Table 6.9).
(C) ≥180 dB (rms): Based on the densities of seals estimated from sightings data during non-seismic conditions two individuals may have been exposed once each to sounds ≥180 dB, assuming no avoidance reaction (Table 6.9).
(D) ≥190 dB (rms): One seal may have been exposed ~once to sound levels ≥190 dB (rms) assuming no seal avoidance of seismic survey activity (Table 6.9). Pacific walruses and polar bears
Based on non-seismic densities, no Pacific walruses or polar bears were likely to have been exposed to seismic sounds ≥160 dB, 170 db, 180 dB, or 190 dB (rms).
TABLE 6.9. Estimated numbers of individual seals exposed to received sound levels ≥160, 170, 180, and 190 dB (rms) and average number of exposures per individual within the Chukchi Sea shallow hazards survey period (22 Aug- 13 Sep 2008).
Exposure level in dB re 1μPa (rms) Individuals
Exposures per Individual Individuals
Exposures per Individual
≥160 9 2.6 0** 2.6≥170 5 1.5 0** 1.5≥180 2 1.2 0** 1.2≥190 1 1.1 0** 1.1
** Estimates based on less than 500 km of effort
Non-seismic Densities Seismic Densities

6-12 Monitoring in the Chukchi and Beaufort Seas: Shell Offshore Inc, 2008
Estimates Based on Densities during Seismic Periods The estimates above were based on densities recorded during non-seismic periods in order to
provide maximum estimates of the potential exposures of marine mammals. All densities during seismic periods were zero because no cetaceans, seals, Pacific walruses or polar bears were sighted during seismic periods. Lower densities might be expected during seismic periods for the Cape Flattery either because of avoidance (to the extent it occurs) or the brief duration and location of seismic operations from these vessels.
Literature Cited Gordon, J., D. Gillespie, J. Potter, A. Frantzis, M.P. Simmonds, R. Swift and D. Thompson. 2004. A review of the
effects of seismic surveys on marine mammals. Mar. Technol. Soc. J. 37(4):16-34. Greene, C.R., Jr. and W.J. Richardson. 1988. Characteristics of marine seismic survey sounds in the Beaufort Sea.
J. Acoust. Soc. Am. 83(6):2246-2254. Harris, R.E., G.W. Miller and W.J. Richardson. 2001. Seal responses to airgun sounds during summer seismic
surveys in the Alaskan Beaufort Sea. Mar. Mamm. Sci. 17(4):795-812. Miller, G.W., V.D. Moulton, R.A. Davis, M. Holst, P. Millman, A. MacGillivray and D. Hannay. 2005. Monitoring
seismic effects on marine mammals--southeastern Beaufort Sea, 2001-2002. p. 511-542 In: S.L. Arms-worthy, P.J. Cranford and K. Lee (eds.), Offshore oil and gas environmental effects monitoring/Approaches and technologies. Battelle Press, Columbus, OH.
Moulton, V.D. and J.W. Lawson. 2002. Seals, 2001. p. 3-1 to 3-48 In: W.J. Richardson and J.W. Lawson (eds.), Marine mammal monitoring of WesternGeco’s open-water seismic program in the Alaskan Beaufort Sea, 2001. LGL Rep. TA2564-4. Rep. from LGL Ltd., King City, Ont., for WesternGeco LLC, Anchorage, AK; BP Explor. (Alaska) Inc., Anchorage, AK; and Nat. Mar. Fish. Serv., Anchorage, AK, and Silver Spring, MD. 95 p.
Richardson, W.J., C.R. Greene, Jr., C.I. Malme and D.H. Thomson. 1995. Marine mammals and noise. Academic Press, San Diego. 576 p.
Richardson, W.J., G.W. Miller and C.R. Greene Jr. 1999. Displacement of migrating bowhead whales by sounds from seismic surveys in shallow waters of the Beaufort Sea. J. Acoust. Soc. Am. 106(4, Pt. 2):2281.
Smultea, M.A., M. Holst, W.R. Koski and S. Stoltz. 2004. Marine mammal monitoring during Lamont-Doherty Earth Observatory’s seismic program in the Southeast Caribbean Sea and adjacent Atlantic Ocean, April–June 2004. LGL Rep. TA2822-26. Rep. from LGL Ltd., King City, Ont., for Lamont-Doherty Earth Observatory of Columbia Univ., Palisades, NY, and Nat. Mar. Fish. Serv., Silver Spring, MD. 106 p.
Stone, C.J. 2003. The effects of seismic activity on marine mammals in UK waters 1998-2000. JNCC Rep. 323. Joint Nature Conserv. Commit., Aberdeen, Scotland. 43 p.

Chapter 7: Beaufort Sea Seismic Survey Monitoring 7-1
7. BEAUFORT SEA VESSEL-BASED SEISMIC MONITORING9
Monitoring Effort and Marine Mammal Encounter Results This section presents the marine mammal monitoring effort and sightings results from SOI’s
vessel-based activities for the Gilavar and its monitoring vessels during 2008 Beaufort Sea seismic operations. The survey period began when the Gilavar and its monitoring vessels entered the Beaufort Sea study area on 31 Aug 2008 (AKDT) and ended when the Gilavar departed the Beaufort Sea on 10 Oct 2008.
SOI’s 2008 Beaufort Sea seismic operations were conducted from the Gilavar along a total of 8238 km (5119 mi) of trackline. The Gilavar’s full airgun array was firing or the array was ramping up for 3720 km (2312 mi), and the single mitigation gun was firing for 2146 km (1333 mi; includes turns and power downs) for a total seismic trackline of 5866 km (3645 mi). The remaining 2373 km (1475 mi) of Gilavar trackline in the Beaufort Sea occurred while no airguns were firing. Gilavar MMOs conducted all watches from the bridge (eye height 12.3 m; 13.5 yd) along a total of 6723 km (4177 mi; 790 hr) of trackline. Approximately 1906 km (1184 mi; 220 hr) of this on-watch effort occurred in the dark for either nighttime power ups or because of a marine mammal power down during the previous daylight hours. Monitoring vessel activity within 75 km (46 mi) of the Gilavar occurred along a total of 28,365 km (17,625 mi) of trackline. Monitoring-vessel MMOs were on watch for a total of 18,404 km (11,436 mi; 1727 hr), and 97% of this on-watch effort took place during daylight hours.
Gilavar MMOs recorded a total of 292 marine mammals in 249 groups during the Beaufort Sea survey (Appendix Table K.1). Monitoring-vessel MMOs recorded a total of 1350 marine mammals in 1091 groups during the survey. Only the MMO sightings data the meet the analysis criteria described in Chapter 4 are presented in the following sections, except for “Mitigation Measures Implemented” and “Estimated Number of Marine Mammals Present and Potentially Affected” where all sightings are considered. Other Vessels
There were no instances when a non-SOI survey vessel was observed operating within the 2008 Beaufort Sea seismic survey area, nor were there observations of any vessel interacting with marine mammals at any time. This chapter presents the results of marine mammal monitoring from the Gilavar and it s monitoring vessels in the Beaufort Sea in 2008. Cetaceans Cetacean Effort
Cetacean effort from monitoring vessels ranged between 4,000 and 5,000 km (2485 and 3107 mi) of trackline for both seismic and non-seismic periods (Fig. 7.1). Cetacean effort from the Gilavar was much less than from monitoring vessels because of the numerous monitoring vessels and their orientation forward and within 5 km (3.1 mi) of the Gilavar. Observational data from the Gilavar did not meet the analysis criteria when another vessel was forward and within 5 km of the Gilavar (see Chapter 4). Other vessels were rarely located forward of the monitoring vessels, and this contributed to the greater amount of cetacean effort. The Gilavar had more than four times the amount of seismic effort for cetaceans when compared to non-seismic effort. A detailed breakdown of cetacean effort in km, mi, and h by Beaufort wind force is shown in Appendix Table K.2.
9 By Craig Reiser, Beth Haley, Joseph Beland, and Danielle Savarese

7-2 Monitoring in the Chukchi & Beaufort Seas: Shell Offshore, 2008
348
4096
77
4886
0
1000
2000
3000
4000
5000
Gilavar Monitoring Vessels
MM
O E
ffort
(km
)
Seismic
Non-seismic
FIGURE 7.1. Marine mammal observer cetacean effort (km) by seismic state from the Gilavar and monitoring vessels during the Beaufort Sea seismic survey (31 Aug – 10 Oct 2008).
Two MMOs were on watch aboard the Gilavar during almost all daylight hours, as required by the 2008 NMFS IHA, to monitor marine mammals and request mitigation procedures if sightings occurred within the ≥180 and ≥190 dB safety zones. It was more common for only one MMO to be on watch aboard monitoring vessels (Fig. 7.2). Cetacean Sightings
MMOs recorded 67 cetaceans in 38 groups during the Beaufort Sea seismic survey. The majority of these sightings were made by MMOs on monitoring vessels (Table 7.1). The only cetacean species positively identified was bowhead whale, and there were nearly equal numbers of bowhead whale and unidentified mysticete whale sightings. Most of the unidentified mysticete whale sightings were suspected to be bowhead whales, but MMOs were reluctant to identify any cetacean sighting to species without diagnostic evidence. Cetacean Sightings by Seismic State
More cetacean sightings from monitoring vessels were recorded during non-seismic than seismic periods (Fig. 7.3; See Appendix Table K.3 for a species breakdown of cetacean sightings by seismic state). Only three cetacean sightings were recorded by MMOs on the Gilavar, all during non-seismic periods. No cetacean sightings were recorded from the Gilavar during seismic activity when observation conditions met the data-analysis criteria, however, seven cetacean sightings (15 individuals) were recorded by Gilavar MMOs during periods of seismic activity under observation conditions that did not meet the data-analysis criteria. All sightings of cetaceans exposed to underwater sound from seismic airgun activity are discussed below in “Mitigation Measures Implemented” and “Estimated Number of Marine Mammals Present and Potentially Affected.”
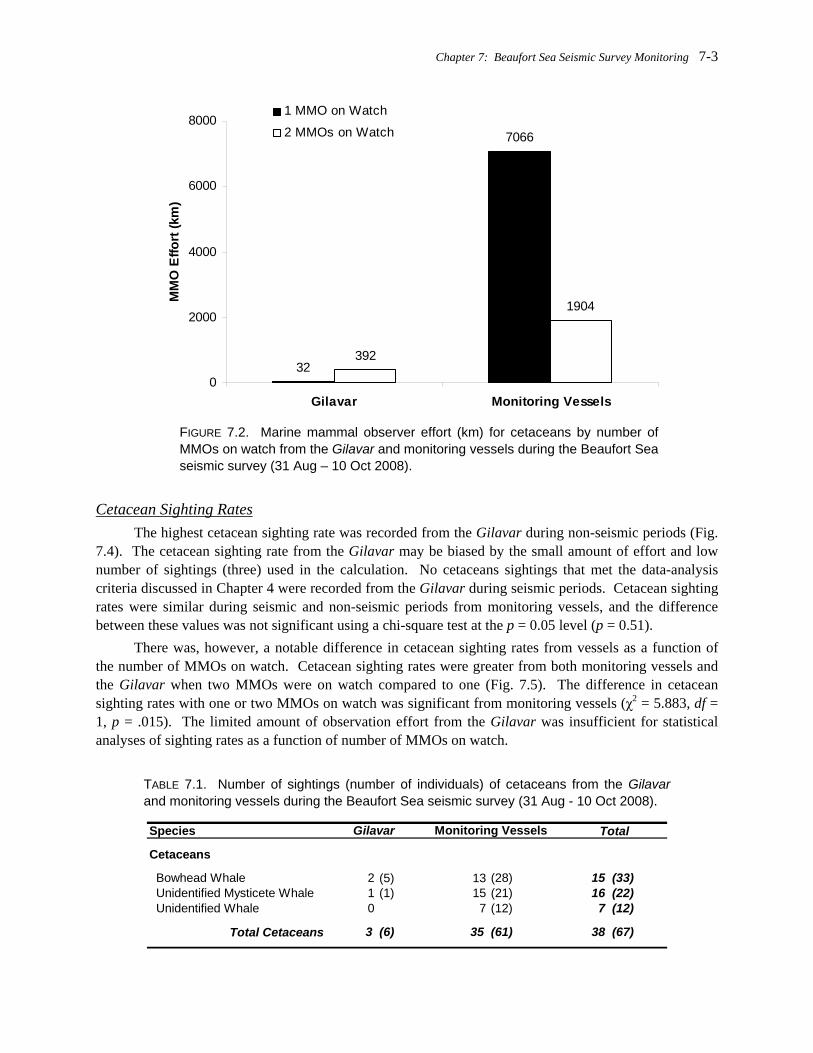
Chapter 7: Beaufort Sea Seismic Survey Monitoring 7-3
32
7066
392
1904
0
2000
4000
6000
8000
Gilavar Monitoring Vessels
MM
O E
ffort
(km
)
1 MMO on Watch
2 MMOs on Watch
FIGURE 7.2. Marine mammal observer effort (km) for cetaceans by number of MMOs on watch from the Gilavar and monitoring vessels during the Beaufort Sea seismic survey (31 Aug – 10 Oct 2008).
Cetacean Sighting Rates The highest cetacean sighting rate was recorded from the Gilavar during non-seismic periods (Fig.
7.4). The cetacean sighting rate from the Gilavar may be biased by the small amount of effort and low number of sightings (three) used in the calculation. No cetaceans sightings that met the data-analysis criteria discussed in Chapter 4 were recorded from the Gilavar during seismic periods. Cetacean sighting rates were similar during seismic and non-seismic periods from monitoring vessels, and the difference between these values was not significant using a chi-square test at the p = 0.05 level (p = 0.51).
There was, however, a notable difference in cetacean sighting rates from vessels as a function of the number of MMOs on watch. Cetacean sighting rates were greater from both monitoring vessels and the Gilavar when two MMOs were on watch compared to one (Fig. 7.5). The difference in cetacean sighting rates with one or two MMOs on watch was significant from monitoring vessels (χ2 = 5.883, df = 1, p = .015). The limited amount of observation effort from the Gilavar was insufficient for statistical analyses of sighting rates as a function of number of MMOs on watch.
TABLE 7.1. Number of sightings (number of individuals) of cetaceans from the Gilavar and monitoring vessels during the Beaufort Sea seismic survey (31 Aug - 10 Oct 2008).
Species
Cetaceans
Bowhead Whale 2 (5) 13 (28) 15 (33) Unidentified Mysticete Whale 1 (1) 15 (21) 16 (22) Unidentified Whale 0 7 (12) 7 (12)
Total Cetaceans 3 (6) 35 (61) 38 (67)
Gilavar Monitoring Vessels Total

7-4 Monitoring in the Chukchi & Beaufort Seas: Shell Offshore, 2008
0
14
3
21
0
5
10
15
20
25
Source Monitoring
Num
ber o
f Sig
htin
gs
SeismicNon-seismic
FIGURE 7.3. Number of cetacean sightings by seismic state from the Gilavar and monitoring vessels during the Beaufort Sea seismic survey (31 Aug – 10 Oct 2008).
0.03.4
39.2
4.3
0
10
20
30
40
Gilavar Monitoring Vessels
Sig
htin
gs p
er 1
000
km o
f MM
O E
ffort
SeismicNon-seismic
FIGURE 7.4. Sighting rates for cetaceans by seismic state from the Gilavar and monitoring vessels during the Beaufort Sea seismic survey (31 Aug – 10 Oct 2008). Please note the small amount of cetacean effort for the Gilavar makes a meaningful comparison of sighting rates with monitoring vessels tenuous.

Chapter 7: Beaufort Sea Seismic Survey Monitoring 7-5
0.0
3.0
7.6
6.8
0
2
4
6
8
Gilavar Monitoring Vessels
Sigh
tings
per
100
0 km
of M
MO
Effo
rt
1 MMO on Watch2 MMOs on Watch
FIGURE 7.5. Sighting rates for cetaceans by number of MMOs on watch from the Gilavar and monitoring vessels during the Beaufort Sea seismic survey (31 Aug – 10 Oct 2008). The small amount of cetacean effort from the Gilavar precluded meaningful comparison of Gilavar and monitoring-vessel sighting rates. .
Pinnipeds Pinniped Effort
Pinniped effort, as defined in Chapter 4, was used for the following analyses of seals and Pacific walruses. The Gilavar and monitoring vessels had similar amounts of seismic pinniped effort (Fig. 7.6). Pinniped effort from the monitoring vessels during non-seismic periods, however, was nearly 12 times greater than from the Gilavar. A detailed breakdown of pinniped effort in km, mi, and h by Beaufort wind force is shown in Appendix Table K.4.
Pinniped effort recorded from the Gilavar was approximately seven times greater with two MMOs on watch than with one (Fig. 7.7). Conversely, it was more common for one MMO to be on watch aboard monitoring vessels compared with two, resulting in a greater percentage of monitoring vessel effort collected by one MMO versus two.

7-6 Monitoring in the Chukchi & Beaufort Seas: Shell Offshore, 2008
23482943
712
8425
0
2500
5000
7500
10000
Gilavar Monitoring Vessels
MM
O E
ffort
(km
)
Seismic
Non-seismic
FIGURE 7.6. Marine mammal observer effort (km) for pinnipeds by seismic state from the Gilavar and monitoring vessels during the Beaufort Sea seismic survey (31 Aug – 10 Oct 2008).
382
8765
2655 2590
0
2500
5000
7500
10000
Gilavar Monitoring Vessels
MM
O E
ffort
(km
)
1 MMO on Watch
2 MMOs on Watch
FIGURE 7.7. Marine mammal observer effort (km) for pinnipeds by number of MMOs on watch from the Gilavar and monitoring vessels during the Beaufort Sea seismic survey (31 Aug – 10 Oct 2008).

Chapter 7: Beaufort Sea Seismic Survey Monitoring 7-7
Seal Sightings MMOs recorded 1123 seals in 939 groups from the Gilavar and monitoring vessels. The majority
of these sightings were made by MMOs on monitoring vessels (Table 7.2). Ringed seal was the most frequently recorded species from both the Gilavar and monitoring vessels. Many of the unidentified seals were likely ringed seals given the known distribution and abundance of seals in the project area. Bearded seal was the second most frequently-sighted seal species followed spotted seal, which was observed only from monitoring vessels. Seal Sightings by Seismic State
The number of seal sightings was greater from monitoring vessels than from the Gilavar during seismic and non-seismic periods (Fig. 7.8; See Appendix Table K.5 for a species breakdown of seal sightings by seismic state). The number of seal sightings from the Gilavar was over four times greater during seismic compared to non-seismic periods. The trend was reversed for monitoring vessels where the number of seal sightings during non-seismic periods was twice the number recorded during seismic periods. Seal Sighting Rates
Seal sighting rates were higher during seismic than non-seismic periods from both the Gilavar and monitoring vessels (Fig 7.9). The difference in seal sighting rates between seismic and non-seismic periods was significant for monitoring vessels (χ2 = 23.094, df = 1, p < 0.001), but not for the Gilavar at the p = 0.05 level (p = 0.16). Seal sighting rates from monitoring vessels during both seismic and non-seismic periods were higher than the respective rates from the Gilavar, but only the difference in seismic period sighting rates between vessel categories was significant ((χ2 = 9.361, df = 1, p = 0.003; p = 0.28 for non-seismic rate). The higher seismic sighting rates for seals likely resulted from approximately a week of extremely calm weather in late Sep during seismic acquisition.
Seal sighting rates were higher from the Gilavar and the monitoring vessels with two MMOs on watch compared to one (Fig. 7.10), and the difference between these sighting rates was significant for both the Gilavar (χ2 = 9.887, df = 1, p = 0.002) and monitoring vessels (χ2 = 161.322, df = 1, p < 0.001). Seal sighting rates were higher from monitoring vessels than from the Gilavar regardless of the number of MMOs on watch.
TABLE 7.2. Number of sightings (number of individuals) of seals from the Gilavar and monitoring vessels during the Beaufort Sea seismic survey (31 Aug - 10 Oct 2008).
Species
Seals
Bearded Seal 14 (14) 38 (41) 52 (55) Ringed Seal 127 (137) 242 (274) 369 (411) Spotted Seal 0 16 (16) 16 (16) Unidentified Seal 43 (48) 456 (590) 499 (638) Unidentified Pinniped 1 (1) 2 (2) 3 (3)
Total Seals 185 (200) 754 (923) 939 (1123)
Gilavar Monitoring Vessels Total

7-8 Monitoring in the Chukchi & Beaufort Seas: Shell Offshore, 2008
150
253
35
501
0
150
300
450
600
Gilavar Monitoring Vessels
Num
ber o
f Sig
htin
gs
SeismicNon-seismic
FIGURE 7.8. Number of seal sightings by seismic state from the Gilavar and monitoring vessels during the Beaufort Sea seismic survey (31 Aug – 10 Oct 2008).
63.9
86.0
49.2
59.5
0
20
40
60
80
100
Gilavar Monitoring Vessels
Sig
htin
gs p
er 1
000
km o
f MM
O E
ffort
SeismicNon-seismic
FIGURE 7.9. Sighting rates for seals by seismic state from the Gilavar and monitoring vessels during the Beaufort Sea seismic survey (31 Aug – 10 Oct 2008).

Chapter 7: Beaufort Sea Seismic Survey Monitoring 7-9
23.5
49.6
65.9
122.8
0
25
50
75
100
125
Gilavar Monitoring Vessels
Sigh
tings
per
100
0 km
of M
MO
Effo
rt
1 MMO on Watch2 MMOs on Watch
FIGURE 7.10. Sighting rates for seals by number of MMOs on watch from the Gilavar and monitoring vessels during the Beaufort Sea seismic survey (31 Aug – 10 Oct 2008).
Pacific Walruses and Polar Bears Only one Pacific walrus was recorded during the 2008 Beaufort Sea seismic survey. The walrus
was recorded by a monitoring-vessel MMO during active seismic acquisition, and the resulting Pacific walrus sighting rate for monitoring vessels during seismic periods was 0.3 sightings per 1000 km (0.5 sightings per 1000 mi).
No polar bears were recorded by the Gilavar or monitoring-vessel MMOs during the 2008 Beaufort Sea seismic survey.
Distribution and Behavior of Marine Mammals Distribution, movement, behavior and reaction information were analyzed to investigate the
potential effects of seismic operations on marine mammals. We present both seismic and non-seismic sightings data from the Gilavar and monitoring vessels. Bearing and distance from the observer station to the “closest point of approach” (CPA) of marine mammals were calculated and grouped by seismic state. The Gilavar sightings data were further refined to calculate the CPA of animals to the airgun array located ~300 m (328 yd) aft of the observer station on the Gilavar. Most observations were of animals forward of the vessels or lateral to the ships’ tracklines.
Information on the movement of observed marine mammals is presented in tables to show the direction of marine mammal movement relative to vessels. In addition to the movement data, MMOs recorded marine mammal behavior and any observed reaction to the vessel. Marine mammal behavior and reaction were difficult to observe, especially at a distance from vessels, because individuals and/or groups typically spent most of their time below the water surface and could not be observed for extended periods. Furthermore, marine mammal behaviors and reactions to vessels vary across species and also across individuals within the same species.

7-10 Monitoring in the Chukchi & Beaufort Seas: Shell Offshore, 2008
Cetaceans Cetacean Distribution and Closest Observed Point of Approach
Cetacean CPAs ranged from 1325 m (1449 yd) to 2560 m (2800 yd) for the three non-seismic cetacean sightings from the Gilavar (Table 7.3). The mean cetacean CPA from monitoring vessels was ~300 m closer to the vessel during non-seismic than seismic periods, but this difference was not significant after running a Wilcoxon rank sum test (p = 0.41). The low CPA sample size from the Gilavar precluded a valid statistical analysis between seismic and non-seismic periods on Gilavar and between the Gilavar and monitoring vessels. Cetacean Movement
Most cetacean movement relative to the vessels was either “neutral” or “unknown,” followed by “swim away” and “swim toward” (Table 7.4). Sample sizes were too low to make meaningful comparisons of cetacean movements relative to the Gilavar and monitoring vessels during seismic and non-seismic periods. TABLE 7.3. Comparison of cetacean CPA distances by seismic state from the Gilavar and monitoring vessels during the Beaufort Sea seismic survey ((31 Aug – 10 Oct 2008).
Vessel and Seismic Status Mean CPAa (m) s.d. Range (m) n
Gilavar Seismic -- -- -- --Gilavar Non-seismic 1982 621 1325-2560 3
Gilavar Overall Mean 1982 621 1325-2560 3
Monitoring Vessels Seismic 1537 1024 500-3514 14Monitoring Vessels Non-seismic 1221 838 200-3000 21
Monitoring Vessels Overall Mean 1348 916 200-3514 35
a CPA = Closest Point of Approach . For Gilavar this value is the marine mammal's closest point of approach to the airgunarray, for monitoring vessels this value is the marine mammal's closest point of approach to the MMO/vessel.
TABLE 7.4. Comparison of cetacean movement relative to vessels by seismic state from the Gilavar and monitoring vessels during the Beaufort Sea seismic survey (31 Aug - 10 Oct 2008).
Vessel and Seismic StatusSwim
TowardsSwim Away Neutral Unknown Totals
Gilavar Seismic -- -- -- -- --Gilavar Non-seismic 3 0 0 0 3
Gilavar Total 3 0 0 0
Monitoring Vessels Seismic 0 2 7 5 1
3
4Monitoring Vessels Non-seismic 1 4 6 10 21
Monitoring Vessels Total 1 6 13 15 35
Movement Relative to Vessel

Chapter 7: Beaufort Sea Seismic Survey Monitoring 7-11
Cetacean Initial Behavior “Blow” was the most frequently recorded initial cetacean behavior recorded from the monitoring
vessels, and the only behavior recorded from the Gilavar (Table 7.5). Other behaviors recorded from the monitoring vessels included “surface active” and “swim.” The remaining behavior categories were recorded infrequently. Cetacean Reaction Behavior
Thirty four of the 35 cetaceans recorded by Gilavar and monitoring-vessel MMOs during the Beaufort Sea seismic survey showed no detectable reaction to the presence of the vessels (Table 7.6). A single cetacean sighted from a monitoring vessel during a seismic period was observed increasing its speed. TABLE 7.5. Comparison of cetacean behaviors by seismic state from the Gilavar and monitoring vessels during the Beaufort Sea seismic survey (31 Aug – 10 Oct 2008).
Vessel and Seismic Status BlowBow Ride
Surface Active Swim Travel Unknown Totals
Gilavar Seismic -- -- -- -- -- -- --Gilavar Non-seismic 3 0 0 0 0 0 3
Gilavar Total 3 0 0 0 0 0 3
Monitoring Vessels Seismic 9 0 3 2 0 0 14Monitoring Vessels Non-seismic 13 1 2 3 1 1 21
Monitoring Vessels Total 22 1 5 5 1 1 35
Initial Behavior
TABLE 7.6. Comparison of cetacean reactions by seismic state from the Gilavar and monitoring vessels during the Beaufort Sea seismic survey (31 Aug - 10 Oct 2008).
Vessel and Seismic StatusIncrease Speed None Totals
Gilavar Seismic -- -- --Gilavar Non-seismic 0 3 3
Gilavar Total 0 3 3
Monitoring Vessels Seismic 1 13 14Monitoring Vessels Non-seismic 0 21 21
Monitoring Vessels Total 1 34 35
Reaction

7-12 Monitoring in the Chukchi & Beaufort Seas: Shell Offshore, 2008
Seals Seal Distribution and Closest Observed Point of Approach
Seals recorded by Gilavar MMOs during the Beaufort Sea seismic survey approached an average of 127 m (139 yd) closer to the airgun array during non-seismic compared with seismic periods (Table 7.7), but this difference was not significant after running a Wilcoxon rank sum test (p = 0.27). Seals observed from monitoring vessels approached an average of 41 m (45 yd) closer to the vessel during seismic compared with non-seismic periods, and this difference was significant (Wilcoxon rank sum test: W = 55162.5, p = 0.004). Seal Movement
The movement of most seals during the Beaufort Sea survey was either “unknown” or “neutral” relative to vessels (Table 7.8). Seals were recorded “swimming away” from the Gilavar more frequently than “swimming towards,” where as seals “swam towards” monitoring vessels more frequently than “swam away.” The differences in seal movement relative to the Gilavar versus monitoring vessels were observed during both seismic and non-seismic periods. TABLE 7.7. Comparison of seal CPA distances by seismic state from the Gilavar and monitoring vessels during the Beaufort Sea seismic survey (31 Aug - 10 Oct 2008).
Vessel and Seismic Status Mean CPAa (m) s.d. Range (m) n
Gilavar Seismic 759 405 259-2614 150Gilavar Non-seismic 632 211 312-1172 35
Gilavar Overall Mean 735 379 259-2614 185
Monitoring Vessels Seismic 147 166 10-1043 253Monitoring Vessels Non-seismic 188 216 1-1700 501
Monitoring Vessels Overall Mean 174 201 1-1700 754
a CPA = Closest Point of Approach . For Gilavar this value is the marine mammal's closest point of approach to the airgunarray, for monitoring vessels this value is the marine mammal's closest point of approach to the MMO/vessel.
TABLE 7.8. Comparison of seal movement relative to vessels by seismic state from the Gilavar and monitoring vessels during the Beaufort Sea seismic survey (31 Aug - 10 Oct 2008).
Vessel and Seismic StatusSwim
TowardsSwim Away Neutral None Unknown Totals
Gilavar Seismic 16 42 64 2 26 150Gilavar Non-seismic 6 11 13 5 35
Gilavar Total 22 53 77 2 31 185
Monitoring Vessels Seismic 55 21 85 5 87 253Monitoring Vessels Non-seismic 56 47 151 12 235 501
Monitoring Vessels Total 111 68 236 17 322 754
Movement Relative to Vessel

Chapter 7: Beaufort Sea Seismic Survey Monitoring 7-13
Seal Initial Behavior The two most frequently observed initial behaviors by seals during the Beaufort Sea seismic survey
were “look” and “swim,” which collectively accounted for ~77% of seal initial behaviors recorded from the Gilavar and monitoring vessels (Table 7.9). Behavior breakdowns for seals across seismic and vessel categories were similar with the exception of “surface active,” which was recorded by monitoring–vessel MMOs but was not recorded by Gilavar MMOs. Seal Reaction Behavior
Seals reaction behaviors were recorded for 531 of the 939 sightings during the Beaufort Sea seismic survey (Table 7.10). The most frequently recorded reaction was “look” (~71%) followed by “splash” (~21%). Other reaction behaviors were recorded less frequently. Pacific Walruses and Polar Bears
The single Pacific walrus sighted during the 2008 Beaufort Sea seismic survey had a CPA to the monitoring vessel of 20 m (22 yd) and its initial behavior was “look.” It reacted to the vessel with a “splash” behavior.
There were no polar bears recorded by Gilavar or monitoring–vessel MMOs during the 2008 Beaufort Sea seismic survey. TABLE 7.9. Comparison of seal behaviors by seismic state from the Gilavar and monitoring vessels during the Beaufort Sea seismic survey (31 Aug - 10 Oct 2008).
Vessel and Seismic Status DiveFront Dive Look
Surface Active Sink Swim Other Totals
Gilavar Seismic 2 4 63 0 0 78 3 150Gilavar Non-seismic 0 2 11 0 0 20 2 35
Gilavar Total 2 6 74 0 0 98 5 185
Monitoring Vessels Seismic 15 6 131 13 1 75 12 253Monitoring Vessels Non-seismic 23 18 230 65 18 112 35 501
Monitoring Vessels Total 38 24 361 78 19 187 47 754
a Other = includes less numerous observations of rest, raft, porpoise, travel, and unknown behaviors with no correlation to seismic state.
Initial Behavior

7-14 Monitoring in the Chukchi & Beaufort Seas: Shell Offshore, 2008
TABLE 7.10. Comparison of seal reactions by seismic state from the Gilavar and monitoring vessels during the Beaufort Sea seismic survey (31 Aug - 10 Oct 2008).
Vessel and Seismic StatusChange
DirectionIncrease Speed Look Splash None Totals
Gilavar Seismic 1 1 57 4 87 150Gilavar Non-seismic 2 0 9 1 23 35
Gilavar Total 3 1 66 5 110 185
Monitoring Vessels Seismic 2 4 130 33 84 253Monitoring Vessels Non-seismic 10 21 181 75 214 501
Monitoring Vessels Total 12 25 311 108 298 754
Reaction
Mitigation Measures Implemented SOI utilized two different sets of marine mammal safety radii during the 2008 Beaufort Sea seismic
survey based on location and available sound source measurements as described in Chapter 4 (Table 4.3). Gilavar MMOs requested 44 power downs of the airguns due to sightings of marine mammals within or approaching the pertinent ≥180 or ≥190 dB (rms) safety radius of the full airgun array during the 2008 Beaufort Sea seismic survey (Table 7.11). Over one-half of these power downs were for ringed seals (n = 23). One emergency shut down of the Gilavar’s mitigation airgun was implemented on 10 Sep after a report from a monitoring vessel of a ringed seal within the seismic survey area that may have been injured. This ringed seal was reported while the Gilavar was firing only the 30-in3 mitigation gun, and its CPA to this airgun was 3283 m (3590 yd). MMOs were unable to confirm its condition and the animal remained milling at the water surface when vessels departed the area. NMFS was contacted and informed of the sighting before operations resumed.
Of the 44 total Beaufort Sea survey power downs for marine mammals, 11 occurred during ramp ups of the airgun array (airgun volume between 30 and 3147 in3), and the other 33 took place while the airguns were firing at full array volume (3147 in3). All marine mammal power downs were for individual animals with one exception; Gilavar MMOs requested a power down for two unidentified mysticete whales on 19 Sep (Table 7.11). Monitoring vessels participated in mitigation efforts by radioing all of their marine mammal sightings to the Gilavar. Gilavar MMOs then used navigation equipment to plot the location of these sightings with respect to the airgun array. Four of the 44 power downs and the single shut down for marine mammals during the Beaufort Sea seismic survey resulted from sighting information reported to the Gilavar by MMOs on monitoring vessels. This section includes all MMO sightings data, not only those that meet the analysis criteria described in Chapter 4. ≥160 dB and ≥120 dB Zone Monitoring Results Described
In addition to helping monitor the ≥180 dB safety zone, monitoring vessels were used to clear the Gilavar’s >160 dB (rms) disturbance radius throughout seismic operations in the Beaufort Sea. This monitoring focused on identifying whether aggregates of 12 or more non-migratory mysticete whales were present within the 160 dB (rms) disturbance zone per NMFS IHA stipulation. SOI interpreted this stipulation conservatively as the presence of 12 or more whales inside the ≥160 dB radius regardless of how they were distributed. Monitoring-vessel MMOs reported all cetacean sightings to Gilavar MMOs. Gilavar MMOs plotted the cetacean sightings on electronic navigation charts to assess real-time cetacean
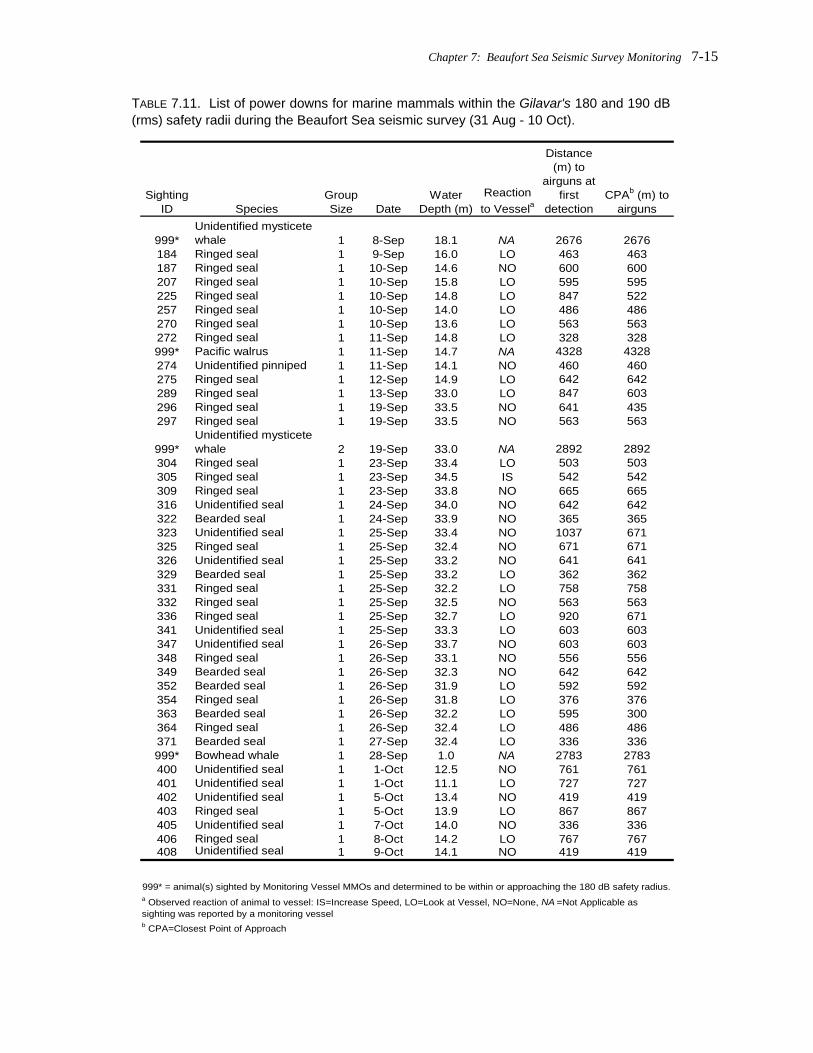
Chapter 7: Beaufort Sea Seismic Survey Monitoring 7-15
TABLE 7.11. List of power downs for marine mammals within the Gilavar's 180 and 190 dB (rms) safety radii during the Beaufort Sea seismic survey (31 Aug - 10 Oct).
Sighting ID Species
Group Size Date
Water Depth (m)
Reaction to Vessela
Distance (m) to
airguns at first
detectionCPAb (m) to
airguns
999*Unidentified mysticete whale 1 8-Sep 18.1 NA 2676 2676
184 Ringed seal 1 9-Sep 16.0 LO 463 463187 Ringed seal 1 10-Sep 14.6 NO 600 600207 Ringed seal 1 10-Sep 15.8 LO 595 595225 Ringed seal 1 10-Sep 14.8 LO 847 522257 Ringed seal 1 10-Sep 14.0 LO 486 486270 Ringed seal 1 10-Sep 13.6 LO 563 563272 Ringed seal 1 11-Sep 14.8 LO 328 328999* Pacific walrus 1 11-Sep 14.7 NA 4328 4328274 Unidentified pinniped 1 11-Sep 14.1 NO 460 460275 Ringed seal 1 12-Sep 14.9 LO 642 642289 Ringed seal 1 13-Sep 33.0 LO 847 603296 Ringed seal 1 19-Sep 33.5 NO 641 435297 Ringed seal 1 19-Sep 33.5 NO 563 563
999*Unidentified mysticete whale 2 19-Sep 33.0 NA 2892 2892
304 Ringed seal 1 23-Sep 33.4 LO 503 503305 Ringed seal 1 23-Sep 34.5 IS 542 542309 Ringed seal 1 23-Sep 33.8 NO 665 665316 Unidentified seal 1 24-Sep 34.0 NO 642 642322 Bearded seal 1 24-Sep 33.9 NO 365 365323 Unidentified seal 1 25-Sep 33.4 NO 1037 671325 Ringed seal 1 25-Sep 32.4 NO 671 671326 Unidentified seal 1 25-Sep 33.2 NO 641 641329 Bearded seal 1 25-Sep 33.2 LO 362 362331 Ringed seal 1 25-Sep 32.2 LO 758 758332 Ringed seal 1 25-Sep 32.5 NO 563 563336 Ringed seal 1 25-Sep 32.7 LO 920 671341 Unidentified seal 1 25-Sep 33.3 LO 603 603347 Unidentified seal 1 26-Sep 33.7 NO 603 603348 Ringed seal 1 26-Sep 33.1 NO 556 556349 Bearded seal 1 26-Sep 32.3 NO 642 642352 Bearded seal 1 26-Sep 31.9 LO 592 592354 Ringed seal 1 26-Sep 31.8 LO 376 376363 Bearded seal 1 26-Sep 32.2 LO 595 300364 Ringed seal 1 26-Sep 32.4 LO 486 486371 Bearded seal 1 27-Sep 32.4 LO 336 336999* Bowhead whale 1 28-Sep 1.0 NA 2783 2783400 Unidentified seal 1 1-Oct 12.5 NO 761 761401 Unidentified seal 1 1-Oct 11.1 LO 727 727402 Unidentified seal 1 5-Oct 13.4 NO 419 419403 Ringed seal 1 5-Oct 13.9 LO 867 867405 Unidentified seal 1 7-Oct 14.0 NO 336 336406 Ringed seal 1 8-Oct 14.2 LO 767 767408 Unidentified seal 1 9-Oct 14.1 NO 419 419
999* = animal(s) sighted by Monitoring Vessel MMOs and determined to be within or approaching the 180 dB safety radius. a Observed reaction of animal to vessel: IS=Increase Speed, LO=Look at Vessel, NO=None, NA =Not Applicable as sighting was reported by a monitoring vesselb CPA=Closest Point of Approach

7-16 Monitoring in the Chukchi & Beaufort Seas: Shell Offshore, 2008
distribution within the operative seismic area. Sightings from aerial surveys were also relayed to the Gilavar MMOs and used to monitor the ≥160 dB (rms) disturbance zone. No distinct aggregates or other distribution of 12 or more non-migratory mysticete whales were encountered within the ≥160 dB (rms) disturbance zone during the Beaufort Sea seismic survey.
Aerial overflights were used during the Beaufort Sea seismic survey to monitor the Gilavar’s ≥120 dB (rms) zone. The 2008 NMFS IHA required that the airgun array be shut down if four or more bowhead cow/calf pairs were observed during an aerial survey of the ≥120 dB (rms) zone. No power downs were implemented in response to aerial observations of bowhead cow/calf pairs in the ≥120 dB zone around the Gilavar.
Monitoring-vessel MMOs reported bowhead whale cow/calf pairs to Gilavar MMOs on several occasions for consideration of ≥120 dB (rms) zone mitigation requirements. Four such reports were made over the span of nine hours on 28 Sep 2008. It was unclear to vessel-based MMOs whether each of these reports represented a different bowhead cow/calf pair, or if they were resightings of animals seen earlier in the day. Spatial and temporal analysis of these sightings by the Gilavar lead MMO suggested a high likelihood of duplication. An aerial survey of the ≥120 dB zone on that same day did not observe any bowhead cow/calf pairs and recorded only one sighting of two adult whales (Chapter 9). No ≥120 dB (rms) zone mitigation measures were implemented by vessel-based MMOs given the uncertain nature of the cow/calf pair sightings and also because of the limitations of using sightings from vessels to implement monitoring and mitigation stipulations designed for aerial-based surveys.
Estimated Number of Marine Mammals Present and Potentially Affected For reasons described in detail in this section of Chapter 5, it is difficult to obtain meaningful
estimates of “take by harassment” for marine mammals. Therefore, two methods were used to estimate the number of marine mammals exposed to seismic sound levels strong enough that they might have caused a disturbance or other potential impacts. The procedures included (A) minimum estimates based on the direct observations of marine mammals by MMOs, and (B) estimates based on cetacean and pinniped densities obtained during this study. The actual number of individuals exposed to, and potentially impacted by, strong seismic survey sounds likely was between the minimum and maximum estimates provided in the following sections. These sections include all MMO sightings data, not only those that meet the analysis criteria described in Chapter 4. Disturbance and Safety Criteria
Table 4.3 shows estimated received sound levels at various distances from the Gilavar’s 24-airgun array in Camden and Harrison bays, which were the two geographic areas where seismic acquisition occurred during the 2008 Beaufort Sea survey. USFWS employed the received sound levels of ≥180 dB and ≥190 dB re 1 μPa (rms) as mitigation criteria for Pacific walruses and polar bears, respectively, in 2008. The application of the ≥180 dB (rms) criterion for Pacific walruses for the second consecutive year was a more conservative approach to walrus mitigation than the ≥190 dB (rms) exclusion area required in 2006. Estimates from Direct Observations
All sightings data were included in the following exposure estimates based on direct observations regardless of whether they met the data-analysis criteria discussed in Chapter 4. The number of marine mammals observed close to the Gilavar during 2008 Beaufort Sea seismic survey monitoring provided a minimum estimate of the number potentially affected by seismic sounds. This was likely an under-estimate of the actual number potentially affected as described in detail in this section of Chapter 5.

Chapter 7: Beaufort Sea Seismic Survey Monitoring 7-17
Some animals may also have avoided the area near the seismic vessel while the airguns were firing (see Richardson et al. 1995, 1999; Stone 2003; Gordon et al. 2004; Smultea et al. 2004). The extent to which the distribution and behavior of marine mammals might be affected by the airguns (or vessels themselves) was uncertain, given variable previous results (Harris et al. 2001; Moulton and Lawson 2002; Miller et al. 2005).
Cetaceans Potentially Exposed to Sounds ≥180 dB re 1 μPa (rms) Fifty sightings of 79 individual cetaceans were observed by Gilavar and monitoring-vessel MMOs
while the Gilavar’s airguns were firing during the 2008 Beaufort Sea survey. Gilavar MMOs recorded seven of these cetacean sightings (15 individuals) and monitoring vessels recorded the remaining 43 (64 individuals). Only one of these cetacean sightings of a single animal was observed within the ≥180 dB safety radius, and this individual may have been exposed to sound levels ≥180 dB (Tables 7.12 and 7.14). This single cetacean sighting within the ≥180 dB safety radius was recorded as an unidentified mysticete whale by a monitoring-vessel MMO and was reported to Gilavar MMOs who immediately requested a power down of the airguns.
Seals Potentially Exposed to Sounds ≥190 dB re 1 μPa (rms) There were 1067 sightings of 1281 individual seals observed by Gilavar and monitoring-vessel
MMOs while the Gilavar’s airguns were firing during the 2008 Beaufort Sea survey. Gilavar MMOs recorded 178 of these seal sightings (194 individuals) and MMOs on monitoring vessels recorded the remaining 889 (1087 individuals). Only 34 of these seal sightings (35 individuals) were observed within the ≥190 dB safety radius, and these 35 individuals may have been exposed to sound levels ≥190 dB rms (Tables 7.13 and 7.14). Thirty three of the 34 seal sightings (33 individuals) within the ≥190 dB safety radius were recorded by Gilavar MMOs and the remaining sighting of two seals was recorded by monitoring-vessel MMOs (Table 7.13). Each of the seal sightings recorded within the Gilavar’s ≥190 dB safety radius resulted in a power down of the airguns.
Pacific Walruses Potentially Exposed to Sounds ≥180 dB re 1 μPa (rms) One sighting of one Pacific walrus was recorded from a monitoring vessel while the Gilavar’s
airguns were firing during the 2008 Beaufort Sea survey. The CPA for this walrus sighting was 4328 m (4733 yd) from the airguns, and it was unlikely that this animal was exposed to sound levels ≥180 dB rms (Table 7.14). The maximum received sound level to this Pacific walrus was estimated to be ~178 dB (rms). Gilavar MMOs did, however, request a power down of the airguns for this sighting as a precautionary measure because a precise estimate of the animal’s distance from the airguns was difficult.
Polar Bears Exposed to Sounds ≥190 dB re 1 μPa (rms) There were no polar bear sightings during the 2008 Beaufort Sea seismic survey.
Estimates Extrapolated from Density The number of marine mammals visually detected by MMOs likely underestimated the actual
numbers that were present for reasons described above. Indirect estimates based on the marine mammal densities observed from the vessels multiplied by the area ensonified (exposed to seismic sounds) provided an alternative method of estimating exposures as described in more detail in Chapter 5.
Densities were based on data collected from the Gilavar and monitoring vessels (Gulf Provider, Norseman II, Theresa Marie, Torsvik) during SOI’s seismic operations in the Beaufort Sea. The density data for the 2008 Beaufort Sea survey are summarized in Table 7.15, and the ensonified areas are presented in Table 7.16.

7-18 Monitoring in the Chukchi & Beaufort Seas: Shell Offshore, 2008
TABLE 7.12. Number of individual cetaceans observed within sound level bins and exposed to the respective sound levels during the Beaufort Sea seismic survey (31 Aug - 10 Oct 2008).
Vessel < 120 120 - 159 160 - 169 170 - 179 > 180
Gilavar 0 6 5 4 0
Monitoring Vessels 16 36 2 9 1
Number of Individuals and Exposure Level in dB re 1μPa (rms)
TABLE 7.13. Number of individual seals observed within applied sound level bins and exposed to the respective sound levels during the Beaufort Sea seismic survey (31 Aug - 10 Oct 2008). This table does not include 189 seals exposed to maximum sound levels <120 dB.
Vessel 120 - 159 160 - 169 170 - 179 180 - 189 > 190
Gilavar 12 102 11 25 33
Monitoring Vessels 597 99 140 71 2
Number of Individuals and Exposure Level in dB re 1μPa (rms)
TABLE 7.14. Number of individual marine mammals observed within relevant safety radii and exposed to the respective sound levels during the Beaufort Sea seismic survey (31 Aug - 10 Oct 2008).
Cetaceans ≥180
Seals ≥190
Pacific Walruses ≥180
1 35 0
Number of Individuals and Exposure Level in dB re 1μPa (rms)
The following estimates based on density assume that all mammals present were well below the surface where they would be exposed to the received sound levels at various distances as predicted in Chapter 3 and summarized in Table 4.3. Some pinnipeds and cetaceans in the water might remain close to the surface, where sound levels would be reduced by pressure-release effects (Greene and Richardson 1988). Also, some pinnipeds and cetaceans may have moved away from the path of the Gilavar before it arrived, either because the monitoring vessels frequently traveled in front of the Gilavar, or because of an avoidance response to the approaching source vessel and its airguns. The estimated number of takes based on non-seismic periods represented the number of animals that would have been exposed had they not shown any localized avoidance of the airguns or the ships themselves and therefore likely overestimate actual numbers of animals exposed to the various received sound levels. The estimates based on densities observed during seismic periods are likely closer to the true numbers of animals that were exposed to the various received sound levels.
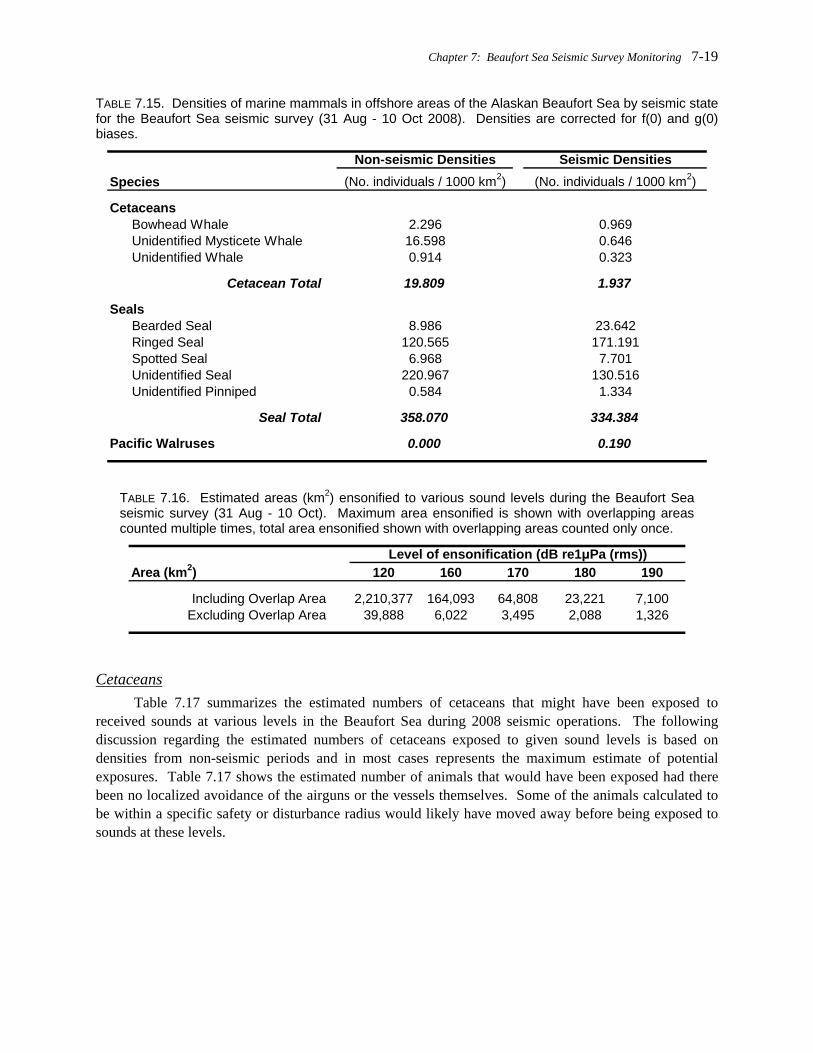
Chapter 7: Beaufort Sea Seismic Survey Monitoring 7-19
TABLE 7.15. Densities of marine mammals in offshore areas of the Alaskan Beaufort Sea by seismic state for the Beaufort Sea seismic survey (31 Aug - 10 Oct 2008). Densities are corrected for f(0) and g(0) biases.
Non-seismic Densities Seismic DensitiesSpecies (No. individuals / 1000 km2) (No. individuals / 1000 km2)
Cetaceans Bowhead Whale 2.296 0.969 Unidentified Mysticete Whale 16.598 0.646 Unidentified Whale 0.914 0.323
Cetacean Total 19.809 1.937
Seals Bearded Seal 8.986 23.642 Ringed Seal 120.565 171.191 Spotted Seal 6.968 7.701 Unidentified Seal 220.967 130.516 Unidentified Pinniped 0.584 1.334
Seal Total 358.070 334.384
Pacific Walruses 0.000 0.190
TABLE 7.16. Estimated areas (km2) ensonified to various sound levels during the Beaufort Sea seismic survey (31 Aug - 10 Oct). Maximum area ensonified is shown with overlapping areas counted multiple times, total area ensonified shown with overlapping areas counted only once.
Area (km2) 120 160 170 180 190
Including Overlap Area 2,210,377 164,093 64,808 23,221 7,100Excluding Overlap Area 39,888 6,022 3,495 2,088 1,326
Level of ensonification (dB re1μPa (rms))
Cetaceans
Table 7.17 summarizes the estimated numbers of cetaceans that might have been exposed to received sounds at various levels in the Beaufort Sea during 2008 seismic operations. The following discussion regarding the estimated numbers of cetaceans exposed to given sound levels is based on densities from non-seismic periods and in most cases represents the maximum estimate of potential exposures. Table 7.17 shows the estimated number of animals that would have been exposed had there been no localized avoidance of the airguns or the vessels themselves. Some of the animals calculated to be within a specific safety or disturbance radius would likely have moved away before being exposed to sounds at these levels.

7-20 Monitoring in the Chukchi & Beaufort Seas: Shell Offshore, 2008
TABLE 7.17. Estimated numbers of individual cetaceans exposed to received levels ≥160, 170, 180, and 190 dB rms, and average number of exposures per individual during the Beaufort Sea seismic survey (31 Aug - 10 Oct).
Exposure level in dB re 1μPa (rms) Individuals
Exposures per Individual Individuals
Exposures per Individual
≥160 119 27 12 27≥170 69 19 7 19≥180 41 11 4 11≥190 26 5 3 5
Non-seismic Densities Seismic Densities
(A) ≥160 dB (rms): We estimated that 119 individual cetaceans would each have been exposed 27 times to airgun pulses with received levels ≥160 dB re 1 μPa (rms) during the Beaufort Sea survey if all cetaceans showed no avoidance behavior (Table 7.17). Based on the available densities, approximately 100 of the 119 individual cetaceans would have been unidentified mysticete whales, most of which likely would have been bowhead whales. Approximately 14 of the 119 individual cetaceans would have been bowhead whales, and the remaining five would have been unidentified whales.
(B) ≥170 dB (rms): The potential disturbance to cetaceans based on the estimated number of exposures would be less than in the ≥160 dB (rms) zone due to the smaller area of the ≥170 dB rms zone. There would have been an estimated 69 individual cetaceans each exposed 19 times to seismic sounds ≥170 dB during the Beaufort Sea survey (Table 7.17). These 69 individual cetaceans would be comprised of 58 unidentified mysticete whales, eight bowhead whales, and three unidentified whales based on available density estimates.
(C) ≥180 dB (rms): If there was no avoidance of airgun noise by cetaceans, 41 individual cetaceans would have been exposed 11 times each to seismic sounds ≥180 dB (Table 7.17; the safety zone for cetaceans was ≥180 dB, and the animals potentially exposed to sound levels ≥190 dB are included in the “≥180 dB” row of this table). However, most of these cetaceans probably moved away before being exposed to received levels ≥180 dB. As noted earlier, only 24 cetacean sightings (37 individuals) were recorded from the Gilavar and monitoring vessels when airguns were operating, and only a single animal was observed within the ≥180 dB safety radius. It is possible that some additional cetaceans were present within the ≥180 dB radius and not seen by the MMOs. The density-based estimate of 41 individual cetacean exposures to received levels of ≥180 dB would be comprised of ~34 unidentified mysticete whales, five bowhead whales, and two unidentified whales. Seals
Table 7.18 summarizes the estimated numbers of seals that might have been exposed to received sounds at various levels in the Beaufort Sea during 2008 seismic operations. The following discussion regarding the estimated numbers of seals exposed to given sound levels was based on densities from non-seismic periods and in most cases represented the maximum estimate of potential exposures.
(A) ≥ 160 dB (rms): We estimated that approximately 2156 individual seals were exposed to airgun pulses 27 times with received levels ≥160 dB re 1 μPa (rms) during the Beaufort Sea survey if all animals exhibited no avoidance of the ≥160 dB zone (Table 7.18). Many (n = 1330) of these 2156 individual seals would have been unidentified to species. In addition to these unidentified seals, ~726 ringed seals, 54 bearded

Chapter 7: Beaufort Sea Seismic Survey Monitoring 7-21
seals, 42 spotted seals, and three unidentified pinnipeds, based on non-seismic densities collected during this survey, would have been exposed to these sound levels.
(B) ≥ 170 dB (rms): About 1251 individual seals would have been exposed 19 times each to received levels ≥170 dB (rms) using available non-seismic density data from the Beaufort Sea seismic survey (Table 7.18). These 1251 individual seals would have been comprised of ~772 unidentified seals, 421 ringed seals, 31 bearded seals, 24 spotted seals, and two unidentified pinnipeds using the non-seismic density values from Table 7.15.
(C) ≥ 180 dB (rms): We estimated that 748 individual seals were exposed 11 times each to received levels ≥180 dB (Table 7.18). The breakdown of these 748 individual seals would be approximately 462 unidentified seals, 252 ringed seals, 19 bearded seals, 15 spotted seals, and one unidentified pinniped using the non-seismic density values from Table 7.15.
(D) ≥ 190 dB (rms): Some seals within the ≥190 dB radius around the operating airguns may have been missed by the observers even during airgun operations conducted with good visibility. Based on densities calculated from sighting rates during non-seismic periods, we estimated that there would have been 475 individual seals exposed five times each to airgun sounds at ≥190 dB (rms) if there was no avoidance of the airguns or vessels (Table 7.18). These 475 individual seals would have been comprised of ~293 unidentified seals, 160 ringed seals, 12 bearded seals, nine spotted seals, and one unidentified pinniped using the non-seismic density values from Table 7.15. Pacific Walruses and Polar Bears
Table 7.19 summarizes the estimated numbers of Pacific walruses that might have been exposed to received sounds at various levels in the Beaufort Sea during 2008 seismic operations. The following information regarding the estimated numbers of Pacific walruses exposed to specific sound levels was based on seismic densities because no Pacific walrus sightings were recorded during non-seismic periods and non-seismic densities were not available. Pacific walruses are uncommon in the Beaufort Sea and it would be unlikely that more than a few were present in the survey area.
(A) ≥ 160 dB (rms): We estimated that a single Pacific walrus was exposed to airgun pulses 27 times with received levels ≥160 dB re 1 μPa (rms) during the Beaufort Sea survey if there was no avoidance of the ≥160 dB zone (Table 7.19).
(B) ≥ 170, ≥ 180, ≥ 190 dB (rms): Based on seismic densities (Table 7.15), less than one Pacific walrus was exposed to sound levels ≥170 dB re 1 μPa (rms), assuming no avoidance behavior. This relatively small estimate was the result of only one Pacific walrus observation during seismic periods in the Beaufort Sea. Polar Bears
There were no polar bear sightings from vessels during the 2008 Beaufort Sea seismic survey.

7-22 Monitoring in the Chukchi & Beaufort Seas: Shell Offshore, 2008
TABLE 7.18. Estimated numbers of individual seals exposed to received levels ≥160, 170, 180, and 190 dB rms, and average number of exposures per individual during the Beaufort Sea seismic survey (31 Aug - 10 Oct).
Exposure level in dB re 1μPa (rms) Individuals
Exposures per Individual Individuals
Exposures per Individual
≥160 2156 27 2014 27≥170 1251 19 1169 19≥180 748 11 698 11≥190 475 5 443 5
Non-seismic Densities Seismic Densities
TABLE 7.19. Estimated numbers of individual Pacific walruses exposed to received levels ≥160, 170, 180, and 190 dB rms, and average number of exposures per individual during the Beaufort Sea seismic survey (31 Aug - 10 Oct).
Exposure level in dB re 1μPa (rms) Individuals
Exposures per Individual Individuals
Exposures per Individual
≥160 NA NA 1 27≥170 NA NA 1* 19≥180 NA NA 1* 11≥190 NA NA 1* 5
1* = actual value is between zero and one individual Pacific walrus
Non-seismic Densities Seismic Densities
Literature Cited Gordon, J., D. Gillespie, J. Potter, A. Frantzis, M.P. Simmonds, R. Swift and D. Thompson. 2004. A review of the
effects of seismic surveys on marine mammals. Mar. Technol. Soc. J. 37(4):16-34. Greene, C.R., Jr. and W.J. Richardson. 1988. Characteristics of marine seismic survey sounds in the Beaufort Sea.
J. Acoust. Soc. Am. 83(6):2246-2254. Harris, R.E., G.W. Miller and W.J. Richardson. 2001. Seal responses to airgun sounds during summer seismic
surveys in the Alaskan Beaufort Sea. Mar. Mamm. Sci. 17(4):795-812. Miller, G.W., V.D. Moulton, R.A. Davis, M. Holst, P. Millman, A. MacGillivray and D. Hannay. 2005. Monitoring
seismic effects on marine mammals--southeastern Beaufort Sea, 2001-2002. p. 511-542 In: S.L. Arms-worthy, P.J. Cranford and K. Lee (eds.), Offshore oil and gas environmental effects monitoring/Approaches and technologies. Battelle Press, Columbus, OH.
Moulton, V.D. and J.W. Lawson. 2002. Seals, 2001. p. 3-1 to 3-48 In: W.J. Richardson and J.W. Lawson (eds.), Marine mammal monitoring of WesternGeco’s open-water seismic program in the Alaskan Beaufort Sea, 2001. LGL Rep. TA2564-4. Rep. from LGL Ltd., King City, Ont., for WesternGeco LLC, Anchorage, AK; BP Explor. (Alaska) Inc., Anchorage, AK; and Nat. Mar. Fish. Serv., Anchorage, AK, and Silver Spring, MD. 95 p.
Richardson, W.J., C.R. Greene, Jr., C.I. Malme and D.H. Thomson. 1995. Marine mammals and noise. Academic Press, San Diego. 576 p.

Chapter 7: Beaufort Sea Seismic Survey Monitoring 7-23
Richardson, W.J., G.W. Miller and C.R. Greene Jr. 1999. Displacement of migrating bowhead whales by sounds from seismic surveys in shallow waters of the Beaufort Sea. J. Acoust. Soc. Am. 106(4, Pt. 2):2281.
Smultea, M.A., M. Holst, W.R. Koski and S. Stoltz. 2004. Marine mammal monitoring during Lamont-Doherty Earth Observatory’s seismic program in the Southeast Caribbean Sea and adjacent Atlantic Ocean, April–June 2004. LGL Rep. TA2822-26. Rep. from LGL Ltd., King City, Ont., for Lamont-Doherty Earth Observatory of Columbia Univ., Palisades, NY, and Nat. Mar. Fish. Serv., Silver Spring, MD. 106 p.
Stone, C.J. 2003. The effects of seismic activity on marine mammals in UK waters 1998-2000. JNCC Rep. 323. Joint Nature Conserv. Commit., Aberdeen, Scotland. 43 p.


Chapter 8: Beaufort Sea Shallow Hazards Monitoring 8-1
8. BEAUFORT SEA VESSEL-BASED SHALLOW HAZARDS AND SITE CLEARANCE MONITORING10
Monitoring Effort and Marine Mammal Encounter Results This chapter summarizes the visual monitoring effort and marine mammal sightings from the
Henry Christoffersen (Henry C.) and the Alpha Helix during the Beaufort Sea shallow hazards and site clearance surveys in 2008. The Henry C. entered the Alaskan Beaufort Sea on 21 Jul and conducted surveys on or near SOI lease blocks in the Beaufort Sea until it returned to Canadian waters on 24 Aug. The Alpha Helix entered the Beaufort Sea from the Chukchi Sea on 29 Jul and conducted surveys in the Beaufort Sea until it returned to the Chukchi Sea on 22 Aug. Additional information regarding the activities of the Henry C. and Alpha Helix can be found in Chapter 2. Descriptions of the vessels and survey equipment can be found in Appendix D. Visual Survey Effort
In contrast to the differences in pinniped and cetacean monitoring effort during seismic surveys from the Gilavar, there was little difference (~4%) in pinniped and cetacean effort during project activities aboard the Henry C. and Alpha Helix. The presence of monitoring vessels near the Gilavar resulted in reduced cetacean effort relative to pinniped effort based on the vessel proximity criteria described in Chapter 4. Additional vessels did not assist with monitoring the safety zones around the small airgun sources deployed form the Henry C. and Alpha Helix. Given that cetacean effort and pinniped effort were similar, only cetacean effort is discussed in this section describing survey effort. Henry C.
In 2008, the Henry C. traveled along ~4599 km (~2858 mi) of trackline in the Beaufort Sea. Shallow hazards seismic survey activities were conducted along ~1362 km (~846 mi) of the Henry C.’s trackline. This seismic effort included periods of seismic acquisition and periods during which only the mitigation gun was firing (during turns, power downs, and ramp ups). MMOs were on watch during a total of ~4183 km (~2599 mi) of trackline, of which ~2753 km (~1711 mi; Fig. 8.1) met the data-analysis criteria described in Chapter 4. MMOs observed almost exclusively (99.9% of watch time) from the conning tower of the Henry C. (eye-height ~14.5 m or 15.8 yd above water), with the remaining observations conducted from the bridge (eye-height ~8.4 m or 9.2 yd). One observer was on watch aboard the Henry C. during a total of ~995 km (~618 mi) and at least two observers were on watch during the remaining ~1758 km (~1092 mi) of survey effort. Alpha Helix
Within the Beaufort Sea, the Alpha Helix traveled along ~4016 km (~2495 mi) of trackline. Shallow hazards seismic survey activities were conducted along ~96 km (~60 mi) of that trackline. The full airgun array (two 10–in3 airguns) was firing for roughly one-half (~49 km, ~30 mi) of the seismic effort and the single mitigation airgun was firing for the remaining ~47 km (~29 mi). Approximately 234 km (~152 mi) of additional observer effort (~155 km of which met the data–analysis criteria) were considered exposed to seismic survey activity due to the Alpha Helix’s proximity to an active seismic vessel, the Henry C. MMOs were on watch during a total of ~3803 km (~2363 mi) of trackline, of which ~2950 km (~1833 mi; Fig. 8.1) met the data-analysis criteria described in Chapter 4. MMOs observed exclusively from the bridge of the Alpha Helix (eye height ~7.0 m or 7.7 yd). One observer was on watch
10 By Joseph Beland, Craig Reiser, Beth Haley, and Danielle Savarese

8-2 Monitoring in the Chukchi and Beaufort Seas: Shell Offshore Inc, 2008
aboard the Alpha Helix during a total of ~1627 km (~1011 mi) and at least two observers were on watch during the remaining ~1322 km (~821 mi) of survey effort.
Survey effort from the Henry C. and Alpha Helix, subdivided by seismic activity and Beaufort wind force, is summarized in Appendix Table L.2. Beaufort wind force (Bf) during observations aboard the Henry C. and Alpha Helix ranged from zero to five. In general, observation conditions were good with greater than 80% of Henry C. effort and ~72% of Alpha Helix effort having occurred during conditions with Bf ≤ 3. Visual Sightings of Marine Mammals and Other Vessels Total Numbers of Marine Mammals Observed
In total, 274 individual marine mammals in 221 groups were recorded by MMOs on the Henry C. in 2008 (Appendix Table L.1). There were 202 individual marine mammals in 158 groups that met the analysis criteria and are the basis for the following analyses (Table 8.1). No polar bears or Pacific walruses were observed from the Henry C.
MMOs aboard the Alpha Helix recorded a total of 299 individual marine mammals in 217 groups (Table L.1). Observations of 234 individual marine mammals in 167 groups met the analysis criteria and are the basis for the following analyses (Table 8.1). No Pacific walruses were observed from the Alpha Helix in the Beaufort Sea in 2008. Other Vessels
There were few vessels near the Henry C. and Alpha Helix during the 2008 project activities. Vessels present were almost exclusively barges and support vessels associated with this project. Most of these vessels were at distances >5 km (3 mi). Ten vessels, however, were sighted within 5 km (3 mi) of the Henry C. and Alpha Helix. Thirty-three marine mammals were sighted while another vessel was within 5 km (3 mi) of the Henry C. and/or Alpha Helix., but no obvious reactions by marine mammals to the other vessels were observed.
251
1894
2699
859
0
500
1000
1500
2000
2500
3000
Henry C. Alpha Helix
MM
O E
ffort
(km
)
Seismic
Non-Seismic
FIGURE 8.1. Marine mammal observer effort (km) from the Henry C. and Alpha Helix by seismic activity during the Beaufort Sea shallow hazards survey (21 Jul – 24 Aug 2008).

Chapter 8: Beaufort Sea Shallow Hazards Monitoring 8-3
TABLE 8.1. Number of sightings (number of individuals) of marine mammals observed during the Beaufort Sea shallow hazards survey (21 Jul – 24 Aug 2008) from the Henry C. and Alpha Helix.
Species
Cetaceans
Beluga Whale 1 (2) 0 1 (2) Bowhead Whale 7 (8) 6 (7) 13 (15) Gray Whale 0 2 (2) 2 (2) Unidentified Whale 1 (2) 0 1 (2)
Total Cetaceans 9 (12) 8 (9) 17 (21)
Seals
Bearded Seal 12 (12) 13 (13) 25 (25) Ringed Seal 118 (158) 14 (21) 132 (179) Spotted Seal 1 (1) 0 1 (1) Unidentified Pinniped 0 10 (10) 10 (10) Unidentified Seal 18 (19) 116 (158) 134 (177)
Total Seals 149 (190) 153 (202) 302 (392)
Polar Bears
In Water 0 4 (4) 4 (4) On Ice 0 2 (19) 2 (19)
Total Polar Bears 0 6 (23) 6 (23)
Grand Total of All Sightings 158 (202) 167 (234) 325 (436)
Henry C. Alpha Helix Total
Cetaceans Total Numbers of Cetaceans Observed
Nine cetacean sightings of 12 individuals were recorded from the Henry C. (Table 8.1). Two belugas and eight bowheads in one and seven groups, respectively, were identified to species. The remaining cetaceans were unidentified.
Nine cetaceans in eight groups were sighted by MMOs on the Alpha Helix. The observations included seven bowheads and two gray whales in six and two groups, respectively. Both gray whales were sighted within 25 km north of Point Barrow in the western Beaufort. Cetacean Sightings with Airguns On
No cetacean sightings were recorded during periods of seismic survey activity for either the Henry C. or the Alpha Helix (Appendix Table L.4). Cetacean Sighting Rates
The cetacean sighting rate from the Henry C. during non-seismic periods (4.8 sightings/1000 km; 7.6 sightings/1000 mi) was higher than from the Alpha Helix (3.0 sightings/1000 km; 4.8 sightings/1000 mi). There was a statistically significant difference in sighting rates between seismic and non-seismic periods for the Henry C. (χ2 = 4.083, df = 1, p = 0.043), but not for the Alpha Helix (χ2 = 0.836, df = 1, p = 0.361).

8-4 Monitoring in the Chukchi and Beaufort Seas: Shell Offshore Inc, 2008
Seals Total Numbers of Seals Observed
There were 190 seals sighted in 149 groups by MMOs on the Henry C. (Table 8.2). Three seal species were identified. Ringed seal was the most frequently identified species, followed by bearded seals. In addition, one spotted seal was recorded. Of the 149 seal sightings in the study area that were identified by MMOs, 118 (or 79.2%) were ringed seals. Most of the unidentified seals were likely ringed seals given the visual monitoring results and the known occurrence of this species throughout the study area. All seal sightings were of animals in the water; no seals were sighted on ice or land.
From the Alpha Helix 202 seals were sighted in 153 groups (Table 8.2). Most (~67%) of the seals observed by MMOs on the Alpha Helix were identified as spotted seals. Due to the small number of spotted seals identified by MMOs on other vessels in the study area, and known spotted seal abundance and distribution in the Beaufort Sea, all spotted seal sightings were classified as unidentified seals. Therefore, unidentified seals accounted for ~76% of the seals sighted from the Alpha Helix. Fourteen of the remaining seal sightings were identified as ringed seals, and 13 were identified as bearded seals. All of these individuals were in the water as opposed to on ice or land. Seal Sightings with Airguns On
Of the 149 seal sightings recorded from the Henry C., 23 were recorded during the 125 h of airgun operation (Fig. 8.2). No seals were sighted within the ≥190 dB safety radius around the operating airguns so there were no power downs or shut downs of the airguns due to seal sightings.
Of the 153 seal sightings recorded from the Alpha Helix, only one bearded seal was recorded during the ~26 h of airgun activity. The bearded seal did not enter the applicable safety radius around the operating airguns, so no power down or shut down of the airgun array was necessary. Seal Sighting Rates
Seal sighting rates from the Henry C. and Alpha Helix by seismic activity are presented in Fig. 8.3 The seal sighting rate from the Henry C. during seismic periods was ~42% of the rate during non-seismic periods suggesting possible localized avoidance of seismic survey activities by seals. Seal sighting rates from the Alpha Helix were also lower during seismic periods than non-seismic periods, but the effort during seismic periods was too low to make meaningful comparisons of seal sighting rates during seismic and non-seismic periods (Fig. 8.1).
TABLE 8.2. Number of sightings (number of individuals) of seals observed during the Beaufort Sea shallow hazards survey (21 Jul – 24 Aug 2008) from the Henry C. and Alpha Helix.
Species
Seals
Bearded Seal 12 (12) 13 (13) 25 (25) Ringed Seal 118 (158) 14 (21) 132 (179) Spotted Seal 1 (1) 0 1 (1) Unidentified Pinniped 0 10 (10) 10 (10) Unidentified Seal 18 (19) 116 (158) 134 (177)
Total Seals 149 (190) 153 (202) 302 (392)
Henry C. Alpha Helix Total
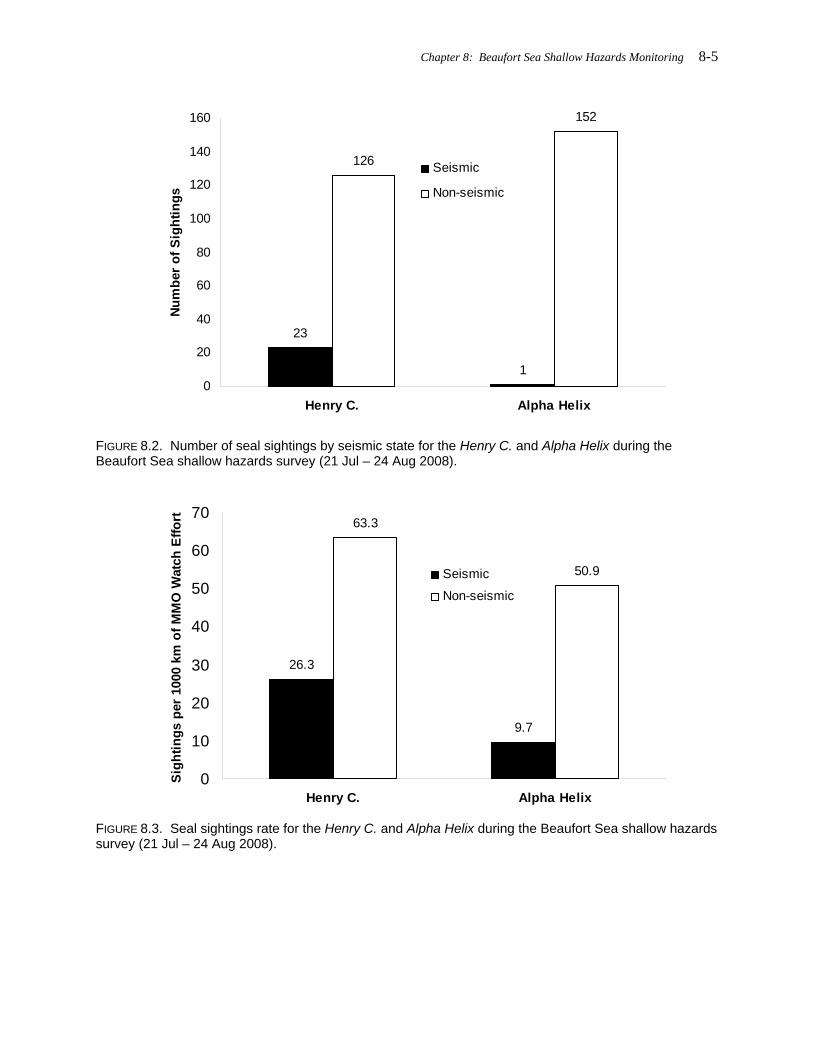
Chapter 8: Beaufort Sea Shallow Hazards Monitoring 8-5
23
1
126
152
0
20
40
60
80
100
120
140
160
Henry C. Alpha Helix
Num
ber o
f Sig
htin
gsSeismic
Non-seismic
FIGURE 8.2. Number of seal sightings by seismic state for the Henry C. and Alpha Helix during the Beaufort Sea shallow hazards survey (21 Jul – 24 Aug 2008).
26.3
9.7
63.3
50.9
0
10
20
30
40
50
60
70
Henry C. Alpha Helix
Sigh
tings
per
100
0 km
of M
MO
Wat
ch E
ffort
Seismic
Non-seismic
FIGURE 8.3. Seal sightings rate for the Henry C. and Alpha Helix during the Beaufort Sea shallow hazards survey (21 Jul – 24 Aug 2008).

8-6 Monitoring in the Chukchi and Beaufort Seas: Shell Offshore Inc, 2008
Pacific Walrus and Polar Bears Total Numbers of Pacific Walrus and Polar Bears
Pacific walruses were not recorded by MMOs on either the Henry C. or Alpha Helix. Six polar bear sightings of 23 individuals were recorded by MMOs on the Alpha Helix. Polar bears were not recorded from the Henry C. Polar Bear Sightings with Airguns On
Of the six polar bear sightings recorded from the Alpha Helix, one sighting was recorded while the airguns were operating. One bear was observed approaching the ≥190 dB safety radius around the operating airguns and resulted in a shut down of the airgun array. Polar Bear Sightings Rates
The sighting rate for polar bears in water during seismic periods (9.7 sightings/1000 km; 15.5 sightings/1000 mi) was much higher than during non-seismic periods (1.0 sightings/1000 km; 1.6 sightings/1000 mi). However, the amount of effort was low during seismic periods precluding meaningful comparisons of sighting rates during seismic and non-seismic periods. Polar bears were rarely encountered during the Beaufort Sea shallow hazards survey, which is demonstrated by the sighting rate during both seismic and non-seismic periods being zero for the Henry C.
Distribution and Behavior of Marine Mammals Data collected during visual observations provided information about behavioral responses of marine
mammals to the seismic survey. The relevant data collected from the Henry C. and Alpha Helix included estimated closest observed points of approach (CPA) to the vessel, movement relative to the vessel, and behavior of animals at the time of the initial sightings. CPA of marine mammals to the vessel was calculated from the location of the airguns (or, during non-seismic periods, where they would have been positioned if deployed).
Marine mammal behavior is difficult to observe, especially from a seismic vessel, because individuals and/or groups are often at the surface only briefly, there may be avoidance behavior, and the vessels follow specified tracklines and are not able to follow animals for further observation. This causes difficulties in resighting those animals, and in determining whether two sightings some minutes apart are repeat sightings of the same individual(s). Only limited behavioral data were collected during this project because marine mammals were often seen at a distance from the vessel, and it was not possible to track them for long distances or durations while the vessels were underway along a predetermined course. Only 25 marine mammal sightings were recorded during shallow hazards seismic survey activities in the Beaufort Sea in 2008. However, previous studies in the Alaskan Beaufort Sea have provided comparable data on seal behavior in the presence and absence of airgun operations (e.g., Moulton and Lawson 2002). The 2008 data from non-seismic periods could be useful as a basis of comparison with any future related results. Cetaceans Distribution and Closest Observed Point of Approach
All nine cetacean sightings recorded from the Henry C. occurred during non-seismic periods. The mean CPA for cetaceans was 1965 m or 2149 yd (n = 9; s.d.= 1306 m; range 258-3745 m, s.d.= 1428 yd; range 282-4096 yd).

Chapter 8: Beaufort Sea Shallow Hazards Monitoring 8-7
Similarly, all eight cetacean sightings from the Alpha Helix occurred during non-seismic periods. The mean CPA for cetaceans from the Alpha Helix was 540 m or 335 yd (n = 8; s.d.= 558 m; range 108-1843 m, s.d.= 346 yd; range 67-1145 yd). The large difference in mean CPA between the two vessels may be related to the difference in height of the observers above water line at their respective observation posts.
Movement and Initial Behavior The initial behaviors recorded for cetacean sightings from the Henry C. were swimming (five) and
blowing (four). Of the 12 animals sighted from the Henry C., 10 were traveling in a neutral direction relative to the vessel, one was traveling toward the vessel, and one was traveling away from the vessel.
Behavior was recorded for all nine cetaceans sighted from the Alpha Helix. The most common initial cetacean behavior was travelling (four of the eight sightings, or 50%). The initial behavior of the remaining four sightings was either blowing (n = 3) or “surface active” (n = 1). Of the nine animals sighted from the Alpha Helix, five were traveling away from the vessel, three were traveling in a neutral direction relative to the vessel, and one was swimming toward the vessel.
Reaction Behavior Only one of the 12 cetaceans observed from the Henry C. displayed an activity that may have been
a reaction to the vessel. This was a group of two beluga whales observed during a non-seismic period that changed their direction of travel.
Of the nine cetaceans observed from the Alpha Helix, a single bowhead whale observed splashing during a non-seismic period was interpreted by an MMO as a potential reaction to the vessel. Seals Distribution and Closest Observed Point of Approach
MMOs on the Henry C. recorded 149 seals in the Beaufort Sea during seismic and non-seismic periods in 2008. More seals were observed during non-seismic than seismic periods (126 and 23 sightings, respectively; Fig 8.2). CPA values for seals were slightly higher during seismic (247 m or 271 yd) than non-seismic periods (225 m or 246 yd). However, there was not a significant difference between mean CPA distances of seal sightings during seismic and non-seismic periods on the Henry C. (wilcoxon test: W = 1706, p = 0.178). TABLE 8.3. Seal CPA recorded from the Henry C. and Alpha Helix during the Beaufort Sea shallow hazards survey (21 Jul – 24 Aug 2008).
Vessel and Seismic Status Mean CPAa (m) s.d. Range (m) n
Henry C. Seismic 247 140 73-613 23Henry C. Non-seismic 225 193 38-1427 126
Henry C. Overall Mean 228 186 38-1427 149
Alpha Helix Seismic 186 NA 186 1Alpha Helix Non-seismic 177 129 25-835 152
Alpha Helix Overall Mean 177 129 25-835 153

8-8 Monitoring in the Chukchi and Beaufort Seas: Shell Offshore Inc, 2008
The one seal observed from the Alpha Helix during seismic activity was at a distance of 186 m (203 yd). The mean CPA for seals during non-seismic periods was 177 m (193 yd; n = 152). Sightings data were insufficient during seismic periods to make meaningful comparisons of seal CPAs to the Alpha Helix between seismic and non-seismic periods. Movement and Initial Behavior
The 23 seals observed during seismic activity from the Henry C. did not demonstrate detectable differences in observed movement or behavior from those observed during non-seismic periods. For most (91.3%) sightings, seals were observed swimming and/or looking at the vessel during both seismic and non-seismic periods (Table 8.4). Meaningful comparisons of seal behavior during seismic and non-seismic periods from the Alpha Helix could not be made due to the low number of seal sightings during seismic periods. Behaviors for nearly two-thirds of the non-seismic seal sightings (100 of 152 sightings) were either swimming and/or looking at the vessel. Data regarding seal movement relative to the Henry C. and Alpha Helix do not show a consistent trend. Movements of seals during both seismic and non-seismic periods were similar. Reaction Behavior
Most seals observed from the Henry C. during seismic periods did not have a noticeable reaction to the vessel (11 of 23). Of the three remaining reaction types recorded during seismic periods, the most frequent was looking at the vessel (83%). Seal reactions from the Henry C. during non-seismic periods were similar to those recorded during seismic periods (Table 8.5).
“No reaction” was the most frequently recorded seal reaction during non-seismic periods from the Alpha Helix (43%), followed by splash (34%), and looking (22%). The one seal seen during seismic activity reacted by looking at the vessel. TABLE 8.4. Seal behaviors by seismic period from the Henry C. and Alpha Helix during the Beaufort Sea shallow hazards survey (21 Jul – 24 Aug 2008).
Vessel and Seismic Status DiveFront Dive Log Look
Surface Active Sink Swim Othera Totals
Henry C. Seismic 1 0 0 9 1 0 12 0 23Henry C. Non-seismic 2 0 3 51 0 0 64 6 126
Henry C. Total 3 0 3 60 1 0 76 6 149
Alpha Helix Seismic 0 0 0 0 0 0 1 0 1Alpha Helix Non-seismic 7 7 0 56 21 6 43 12 152
Alpha Helix Total 7 7 0 56 21 6 44 12 153aOther= less numerous observations of feed, rest, travel, and unknown
Behavior

Chapter 8: Beaufort Sea Shallow Hazards Monitoring 8-9
TABLE 8.5. Seal reactions by seismic period from the Henry C. and Alpha Helix during the Beaufort Sea shallow hazards survey (21 Jul – 24 Aug 2008).
Vessel and Seismic Status SplashIncrease in Speed
Change in
Direction
Looked at
VesselInteracted with Gear None Totals
Henry C. Seismic 1 0 0 10 1 11 23Henry C. Non-seismic 8 15 14 54 0 35 126
Henry C. Total 9 15 14 64 1 46 149
Alpha Helix Seismic 0 0 0 1 0 0 1Alpha Helix Non-seismic 52 1 0 33 0 66 152
Alpha Helix Total 52 1 0 34 0 66 153
Reaction
Pacific Walruses and Polar Bears Distribution and Closest Observed Point of Approach
Pacific walruses were not recorded by MMOs on either the Henry C. or Alpha Helix. The one polar bear observed from the Alpha Helix during seismic survey activity was in water at a distance of 136 m (149 yd). The mean CPA for polar bears in water during non-seismic periods was 193 m (211 yd; n = 3). The low sample size precluded any meaningful analysis of polar bear CPA as a function of seismic state. No polar bears were observed from the Henry C. Movement and Initial Behavior
The majority of the polar bear sightings were recorded while the Alpha Helix was near the barrier islands. All polar bears in water were seen swimming/traveling. The polar bear sighted during seismic activity was close to (CPA distance of 136 m; 149 yd) and swimming towards the vessel. The MMOs aboard the Alpha Helix requested a shut down of the airgun array to avoid potentially exposing the polar bear to sounds ≥190 dB. Polar bear behavior and movement did not show any notable differences between seismic non-seismic periods. For more details, refer to the Mitigation section below. Reaction Behavior
The Alpha Helix MMOs reported that half of the polar bears in water exhibited no reaction (n = 2), and the other half looked at the vessel (n = 2). The polar bear seen during seismic activity was one of the two that reacted by looking at the vessel.
Mitigation Measures Implemented
Henry C. No power downs or shut-downs of the airguns were necessary or requested due to the detection of a
marine mammal within the ≥180 and ≥190 dB safety radii. The 23 seal sightings during seismic activity were outside the ≥190 db safety radius. All other sightings occurred during non-seismic periods. Alpha Helix
One shut down of the airguns was requested by the Alpha Helix MMOs due to a polar bear approaching the ≥190 dB (rms) safety radius of the full airgun array. No power downs or shut downs of the airguns for cetaceans or seals were necessary or requested.

8-10 Monitoring in the Chukchi and Beaufort Seas: Shell Offshore Inc, 2008
Estimated Number of Marine Mammals Present and Potentially Affected For reasons described in detail in this section in Chapter 5, it is difficult to obtain meaningful
estimates of “take by harassment.” Therefore, two methods are used to estimate the number of marine mammals exposed to seismic sound levels strong enough that they might have caused a disturbance or other potential impacts. The procedures included (A) minimum estimates based on the direct observations of marine mammals by MMOs, and (B) estimates based on cetacean and pinniped densities obtained during this study multiplied by the area exposed to various received levels of sound. The actual number of individuals exposed to, and potentially impacted by, strong seismic survey sounds likely was between the minimum and maximum estimates provided in the following sections. Disturbance and Safety Criteria
Tables 4.4 and 4.5 summarize measured received sound levels at various distances from the airgun(s) deployed from the Henry C. and Alpha Helix, respectively. The ≥160 dB rms radius is an assumed behavioral disturbance criterion. During this and many other recent seismic survey projects, NMFS has required that mitigation measures be applied to avoid, or minimize, the exposure of cetaceans and seals to impulse sounds with received levels ≥180 dB and ≥190 dB re 1 μPa (rms), respectively. Only one shut down of the airguns was required during airgun operations for the Beaufort Sea shallow hazards and site clearance surveys in 2008. In addition, the safety and disturbance radii were used after the field season to estimate numbers of marine mammals potentially exposed to various received sound levels based on estimated densities observed from both the Henry C. and Alpha Helix. Estimates from Direct Observations
All sightings data were included in the following exposure estimates based on direct observations regardless of whether they met the data-analysis criteria discussed in Chapter 4, Analyses. The number of marine mammals observed close to the Henry C. and Alpha Helix during 2008 Beaufort Sea shallow seismic survey monitoring provided a minimum estimate of the number potentially affected by seismic sounds. This was likely an underestimate of the actual number potentially affected as described in detail in this section of Chapter 5.
Some animals may also have avoided the area near the seismic vessel while the airguns were firing (see Richardson et al. 1995, 1999; Stone 2003; Gordon et al. 2004; Smultea et al. 2004). The extent to which the distribution and behavior of marine mammals might be affected by the airguns (or vessels themselves) is uncertain, given variable previous results (Harris et al. 2001; Moulton and Lawson 2002; Miller et al. 2005).
Cetaceans Potentially Exposed to Sounds ≥180 dB re 1 μPa (rms) There were no cetaceans sighted from either the Henry C. or Alpha Helix when the airguns were
operating. The estimate of cetacean exposures to underwater sound levels ≥180 dB rms based on direct observations was zero.
Seals Potentially Exposed to Sounds ≥190 dB re 1 μPa (rms) During the Henry C’s seismic operations, no seals were sighted within the 10 m safety radius around the
airguns. There were 23 seal sightings while the airguns were operating, but no individual seal was observed within the ≥190 dB rms radius.
One seal was sighted during the Alpha Helix’s seismic survey activity, and was determined to be outside of the ≥190 dB safety radius of 55 m. It was unlikely that this seal was exposed to sound levels ≥190 dB rms. The estimate of seal exposures to underwater sounds ≥190 dB rms from the Henry C. and Alpha Helix based on direct observations was zero.

Chapter 8: Beaufort Sea Shallow Hazards Monitoring 8-11
Pacific Walruses and Polar Bears Potentially Exposed to Sounds ≥190 dB re 1 μPa (rms) Pacific walruses were not recorded by MMOs on either the Henry C. or Alpha Helix during shallow
hazards survey activities in the Beaufort Sea in 2008. There was one sighting of a polar bear recorded from the Alpha Helix while airguns were firing. This polar bear was observed swimming towards the vessel and approached the ≥190 dB safety radius resulting in a shut down of the airgun array. The airguns were shut down before the polar bear entered the ≥190 dB safety radius, and exposure to sound levels ≥190 dB was unlikely. Polar bears were not recorded from the Henry C. in the Beaufort Sea in 2008. Estimates Extrapolated from Density
The number of marine mammals visually detected by MMOs likely underestimated the actual numbers that were present for reasons described above. Indirect estimates based on the marine mammal densities observed from the vessels multiplied by the area ensonified (exposed to seismic sounds) provided an alternate method of estimating exposures as described in more detail in Chapter 5.
Densities were based on data collected from the Henry C. and Alpha Helix during SOI’s seismic operations in the Beaufort Sea. The density data for the 2008 Beaufort Sea shallow hazards survey are summarized in Table 8.6, and the ensonified areas are presented in Table 8.7. TABLE 8.6. Estimated densities of marine mammals in offshore areas of the Beaufort Sea based on effort and sightings from the Henry C. and Alpha Helix (see Chapter 4 for more details). Densities were corrected for f(0) and g(0) biases.
Non-seismic Densities Seismic DensitiesSpecies (No. individuals / 1000 km2) (No. individuals / 1000 km2)
Cetaceans Beluga Whale 0.426 0.000 Bowhead Whale 1.262 0.000 Gray Whale 0.123 0.000 Unidentified Whale 0.143 0.000
Cetacean Total 1.954 0.000
Seals Bearded Seal 17.650 24.250 Ringed Seal 108.620 59.074 Ribbon Seal 0.146 0.000 Unidentified Pinniped 4.797 0.000 Unidentified Seala 146.023 10.425
Seal Total 277.236 93.749a Unidentified Seals includes spotted and unidentified seals

8-12 Monitoring in the Chukchi and Beaufort Seas: Shell Offshore Inc, 2008
The following estimates based on density assume that all mammals present were well below the surface where they would be exposed to the received sound levels at various distances as predicted in Chapter 3 and summarized in Table 4.5. Some pinnipeds and cetaceans in the water might remain close to the surface, where sound levels would be reduced by pressure-release effects (Greene and Richardson 1988). Also, some pinnipeds and cetaceans may have moved away from the path of the Henry C. and Alpha Helix before they arrived, either because the approaching vessels themselves, or because of an avoidance response to their airguns. The estimated number of takes based on non-seismic periods represented the number of animals that would have been exposed had they not shown any localized avoidance of the airguns or the ships themselves and therefore likely overestimate actual numbers of animals exposed to the various received sound levels. The estimates based on densities observed during seismic periods are likely closer to the true numbers of animals that were exposed to the various received sound levels. Cetaceans
The estimated numbers of cetaceans that might have been exposed to various received sound levels are summarized in Table 8.8. The cetacean density estimates below were based on densities recorded during non-seismic periods because no cetaceans were observed during seismic periods.
(A) ≥160 dB (rms): Based on densities from non-seismic periods for both the Henry C. and Alpha Helix, we estimated there may have been one individual cetacean exposed to airgun pulses with received levels ≥160 dB re 1 μPa (rms) approximately two times from both the Henry C. and Alpha Helix during the shallow-hazards and site clearance survey if all cetaceans showed no avoidance of airguns or the approaching vessel (Table 8.8).
(B) ≥170 dB (rms): If there were no avoidance of airgun noise by cetaceans, we estimated that there would have been one exposure to one individual cetacean exposed to seismic sounds ≥170 dB re 1 μPa (rms) from the Henry C. (Table 6.7). For the Alpha Helix we estimated that there would have been one cetacean exposed to seismic sounds ≥170 dB re 1 μPa (rms) with two exposures per individual.
(C) ≥180 dB (rms): Based on non-seismic densities we estimated that there would have been one cetacean exposed to airgun pulses ≥180 dB re 1 μPa (rms) approximately one time from the Henry C., and one cetacean would have been exposed approximately two times from the Alpha Helix (Table 8.8). Seals
Table 8.9 summarizes the estimated numbers of seals that might have been exposed to received sounds from shallow hazards survey activities at various levels in the Beaufort Sea in 2008. Calculations of potential seal exposures to various received sound levels were based on density estimates (Table 8.6) derived from sightings data during both seismic and non-seismic periods. (A) ≥160 dB (rms): Approximately 176 individual seals from the Henry C. and ~18 individual seals from the Alpha Helix were estimated to have been exposed approximately two times each to airgun pulses with received levels ≥160 dB re 1 μPa (rms) during the shallow hazards and site clearance survey in the Beaufort Sea if all seals were below the surface of the water and showed no avoidance of the approaching vessel (Table 8.9). Given the predominance of ringed seals in the Beaufort Sea, most of the individuals exposed would have been ringed seals, with lesser numbers of bearded and spotted seals.
(B) ≥170 dB (rms): The estimated number of seals exposed to received levels ≥170 dB was ~28% and ~41% of the corresponding estimates for ≥160 dB radii for the Henry C. and Alpha Helix, respectively. This resulted in estimated exposure of ~77 individual seals from the Henry C. and ~9 individual seals from the Alpha Helix to airgun pulses with received levels ≥170 dB re 1 μPa (rms).

Chapter 8: Beaufort Sea Shallow Hazards Monitoring 8-13
TABLE 8.7. Estimated areas (km2) ensonified to various sound levels during the Beaufort Sea shallow hazards survey (21 Jul - 24 Aug 2008). Maximum area ensonified is shown with overlapping areas counted multiple times, total area ensonified shown with overlapping areas counted only once.
Area (km2) 120 160 170 180 190Henry C.
Including Overlap Area 56,956 1,260 351 92 24Excluding Overlap Area 3,632 633 276 84 24
Alpha HelixIncluding Overlap Area 4,003 144 57 24 9
Excluding Overlap Area 1,814 65 32 13 5
Level of ensonification (dB re1μPa (rms)
TABLE 8.8. Estimated numbers of individual cetaceans exposed to received sound levels ≥160, 170, 180, and 190 dB (rms) and average number of exposures per individual for the Henry C. and Alpha Helix during the Beaufort Sea shallow hazards survey (21 Jul – 24 Aug 2008). Estimates are based on "corrected" densities of cetaceans calculated from effort and sightings data during non-seismic periods.
Exposure level in dB re 1μPa (rms) Individuals
Exposures per Individual Individuals
Exposures per Individual
Henry C≥160 1 2.0 0 2.0≥170 1 1.3 0 1.3≥180 1* 1.1 0 1.1≥190 1* 1.0 0 1.0
Alpha Helix≥160 1* 2.2 0 2.2≥170 1* 1.8 0 1.8≥180 1* 1.9 0 1.9≥190 1* 1.7 0 1.7
* Actual value less than 1.
Non-seismic Densities Seismic Densities
(C) ≥180 dB (rms): Some seals may have been within the ≥180 dB radius around the operating airguns but were not seen by the observers even though the majority of airgun operations were conducted in good visibility conditions. Approximately 23 individual seals were estimated to have been exposed approximately one time to airgun pulses ≥180 dB re 1 μPa (rms) from the Henry C., and four individual seals may have been exposed approximately two times from the Alpha Helix (Table 8.9).

8-14 Monitoring in the Chukchi and Beaufort Seas: Shell Offshore Inc, 2008
TABLE 8.9. Estimated numbers of individual seals exposed to received sound levels ≥160, 170, 180, and 190 dB (rms) and average number of exposures per individual for the Henry C. and Alpha Helix within the Beaufort Sea shallow hazards survey (21 Jul – 24 Aug 2008).
Exposure level in dB re 1μPa (rms) Individuals
Exposures per Individual Individuals
Exposures per Individual
Henry C≥160 176 2.0 59 2.0≥170 77 1.3 26 1.3≥180 23 1.1 8 1.1≥190 7 1.0 2 1.0
Alpha Helix≥160 18 2.2 6 2.2≥170 9 1.8 3 1.8≥180 4 1.9 1 1.9≥190 2 1.7 1* 1.7
* Actual value less than 1.
Non-seismic Densities Seismic Densities
(D) ≥190 dB (rms): Based on densities calculated from sighting rates during non-seismic periods,
seven individual seals were estimated to have been exposed to airgun pulses ≥190 dB re 1 μPa (rms) one time from the Henry C., and two individual seals would have been exposed approximately two times from the Alpha Helix (Table 8.9). These estimates were greater than the number of seals exposed to sound levels ≥190 dB rms based on direct observations (zero). Some seals within the ≥190 dB radius may have been unobserved during times when MMOs were on watch because some seals at the surface can be missed due to brief surface times, poor visibility, rough seas, and other factors. Because of this, density-based estimates of exposures and exposed individuals are higher than those based on direct observation. However, estimates based on densities during non-seismic periods are likely overestimates of the numbers actually exposed. Estimates Based on Densities during Seismic Periods
The above estimates were based on densities recorded during non-seismic periods. Seal densities during seismic periods were about one-third of the non-seismic densities (Table 8.6). Lower densities during seismic periods may have resulted from seal avoidance of the seismic activity.
Literature Cited Gordon, J., D. Gillespie, J. Potter, A. Frantzis, M.P. Simmonds, R. Swift and D. Thompson. 2004. A review of the
effects of seismic surveys on marine mammals. Mar. Technol. Soc. J. 37(4):16-34. Greene, C.R., Jr. and W.J. Richardson. 1988. Characteristics of marine seismic survey sounds in the Beaufort Sea.
J. Acoust. Soc. Am. 83(6):2246-2254. Harris, R.E., G.W. Miller and W.J. Richardson. 2001. Seal responses to airgun sounds during summer seismic
surveys in the Alaskan Beaufort Sea. Mar. Mamm. Sci. 17(4):795-812.

Chapter 8: Beaufort Sea Shallow Hazards Monitoring 8-15
Miller, G.W., V.D. Moulton, R.A. Davis, M. Holst, P. Millman, A. MacGillivray and D. Hannay. 2005. Monitoring seismic effects on marine mammals--southeastern Beaufort Sea, 2001-2002. p. 511-542 In: S.L. Arms-worthy, P.J. Cranford and K. Lee (eds.), Offshore oil and gas environmental effects monitoring/Approaches and technologies. Battelle Press, Columbus, OH.
Moulton, V.D. and J.W. Lawson. 2002. Seals, 2001. p. 3-1 to 3-48 In: W.J. Richardson and J.W. Lawson (eds.), Marine mammal monitoring of WesternGeco’s open-water seismic program in the Alaskan Beaufort Sea, 2001. LGL Rep. TA2564-4. Rep. from LGL Ltd., King City, Ont., for WesternGeco LLC, Anchorage, AK; BP Explor. (Alaska) Inc., Anchorage, AK; and Nat. Mar. Fish. Serv., Anchorage, AK, and Silver Spring, MD. 95 p.
Richardson, W.J., C.R. Greene, Jr., C.I. Malme and D.H. Thomson. 1995. Marine mammals and noise. Academic Press, San Diego. 576 p.
Richardson, W.J., G.W. Miller and C.R. Greene Jr. 1999. Displacement of migrating bowhead whales by sounds from seismic surveys in shallow waters of the Beaufort Sea. J. Acoust. Soc. Am. 106(4, Pt. 2):2281.
Smultea, M.A., M. Holst, W.R. Koski and S. Stoltz. 2004. Marine mammal monitoring during Lamont-Doherty Earth Observatory’s seismic program in the Southeast Caribbean Sea and adjacent Atlantic Ocean, April–June 2004. LGL Rep. TA2822-26. Rep. from LGL Ltd., King City, Ont., for Lamont-Doherty Earth Observatory of Columbia Univ., Palisades, NY, and Nat. Mar. Fish. Serv., Silver Spring, MD. 106 p.
Stone, C.J. 2003. The effects of seismic activity on marine mammals in UK waters 1998-2000. JNCC Rep. 323. Joint Nature Conserv. Commit., Aberdeen, Scotland. 43 p.


Chapter 9: Beaufort Sea Aerial Surveys 9–1
9. BEAUFORT SEA AERIAL MARINE MAMMAL MONITORING PROGRAM11
Introduction An aerial monitoring program for marine mammals was conducted from 6 Jul to 11 Oct 2008 in
support of seismic exploration activities by Shell Offshore, Inc. (SOI) in the Alaskan Beaufort Sea. Surveys were flown to meet required monitoring and mitigation measures and obtain detailed data on the occurrence, distribution, and movements of marine mammals, particularly bowhead whales, in the seismic survey areas and nearby waters. Previous studies have shown that migrating bowhead whales have avoided seismic operations at received levels of 116–135 dB re 1 μPa (rms) (Miller et al. 1999; Richardson et al. 1999). The Incidental Harassment Authorization (IHA) issued to SOI by NMFS required aerial monitoring of the ≥120 dB re 1 ųPa (rms) zone of the seismic survey area for bowhead whale cow/calf pairs. If four or more bowhead cow/calf pairs were sighted within the ≥120 dB (rms) isopleth, the aerial survey crew was required to notify marine mammal observers (MMOs) on the seismic vessels (Gilavar, Henry C., and Alpha Helix). Aerial observers were also required to notify MMOs on the seismic vessel if aggregations of 12 or more bowhead whales were sighted within the ≥160 dB isopleth during aerial surveys. These notifications allowed MMOs on the vessels to implement specific mitigation procedures required by the IHA.
During the fall, migrating bowhead whales have been reported to avoid areas within 20 km (12 mi) of seismic activities, and to exhibit subtle behavioral reactions at greater distances (Richardson et al. 1986; Koski and Johnson 1987; Ljungblad et al. 1988; Richardson and Malme 1993; Miller et al. 1999). Hence, bowhead sighting rates may be lower during seismic activities than in non–seismic periods, particularly in the immediate vicinity of seismic activities (e.g. central sub-areas as defined below). Furthermore, we might expect migrating whales to alter their headings and increase their distance from seismic operations (by moving either farther offshore or closer to shore), in areas near (central sub-area) and west (west sub-area) of the seismic prospect. Feeding whales, on the other hand, can be more tolerant to seismic sounds when high food concentrations are available and therefore may not alter their position in response to seismic activity (Miller et al. 2005). These hypotheses are tested below.
Beluga whales also have the potential to be negatively affected by seismic activity, as they can hear seismic sounds (Richardson et al. 1995b; Richardson and Würsig 1997). However, little is known about specific reactions of this species to seismic activities, and it has been suggested that because belugas migrate at great distances offshore during the fall, they are unlikely to be strongly affected by seismic exploration (Richardson 1999). To help elucidate beluga whale responses to seismic activity, sighting rates, distribution, and headings in relation to seismic activities were examined.
Objectives The objectives of the aerial survey program were to: • advise operating vessels of the presence of marine mammals, particularly bowhead whale
cow/calf pairs and aggregations of 12 or more whales, near the operation to meet the requirements of the Incidental Harassment Authorization (IHA) issued by NMFS and the Letter of Authorization (LOA) issued by USFWS;
11 By Courtney Lyons and Katie Christie

9–2 Monitoring in the Chukchi and Beaufort Seas: Shell Offshore Inc, 2008
• collect and report information on the distribution, abundance, direction of travel, and activities of marine mammals near the seismic operations with special emphasis on bowhead whales;
• support regulatory reporting related to the estimation of impacts of seismic operations on marine mammals;
• document the extent, duration, and location of any bowhead whale deflections in response to seismic activities.
Methods
Study Area Aerial surveys in 2008 were located at two sites in the central Beaufort Sea (Camden and
Harrison Bays) in conjunction with SOI seismic operations. Data analyses focused on identification of bowhead whale response to seismic activities. Trends in marine mammal distribution and behavior, however, may differ due to seasonal and geographic differences. To help account for these potentially confounding variables, analyses were performed separately on three data subsets: (1) Jul–Aug surveys in the Camden Bay area, (2) surveys of the Harrison Bay area, and (3) Sep surveys in the Camden Bay area. Within these data subsets, survey areas were divided into three spatial sub-areas (west, central, and east) and four seismic states (pre–seismic, seismic, post–seismic, and non–seismic) to assess cetacean responses to seismic survey work at different spatial and temporal scales (Figure 9.1).
FIGURE 9.1. Survey areas covered by aerial surveys in the Alaskan Beaufort Sea from 6 Jul through 11 Oct 2008.

Chapter 9: Beaufort Sea Aerial Surveys 9–3
Jul–Aug Surveys in the Camden Bay Area Initial aerial surveys were conducted in the Camden Bay area from 6 Jul to 23 Aug in support of
shallow–hazard seismic activities at the Sivulliq prospect, prior to the documented start of the bowhead fall migration through the Alaskan Beaufort Sea (Ljungblad et al. 1986, Moore and Clarke 1989). The survey grid consisted of 10 transects varying in length from 63 km (39 mi) to 87 km (54 mi), with a total transect length of 777 km (483 mi) and a total survey area of 5658 km2 (2185 mi2; Figure 9.2). Surveys of the Harrison Bay Area
Aerial surveys were conducted in the Harrison Bay area from 25 Aug through 11 Oct 2008 in support of SOI’s 3D deep seismic activities in the Como prospect area (Figure 9.3). The initial survey grid was composed of relatively short, high–density lines, and was flown until just before the Gilavar began seismic work in Harrison Bay. On 5 Sep, transects were altered. These longer and more widely spaced lines were designed to cover the Gilavar’s ≥120 dB radius, based on 2007 sound–source verification (SSV) results (Figure 9.3). These lines were later (29 Sep) reduced in length to reflect 2008 SSV results. The total survey area (encompassing all transects) was 18,299km2 (7065 mi2). Sep Surveys in the Camden Bay Area
From 13 to 28 Sep, aerial surveys in the Camden Bay area were expanded to encompass the larger sound radii associated with the Gilavar, which was conducting 3D deep seismic surveys at the Torpedo and Masva prospects (Figure 9.4). Transects in the survey grid varied in length from 67 km (42 mi) to 129 km (80 mi), and were extended northward on 24 Sep to more accurately reflect location–specific SSV results used for mitigation. The total area surveyed was 17,891 km2 (6908 mi2).
FIGURE 9.2. Aerial survey transect lines flown in the Camden Bay area of the Alaskan Beaufort Sea from 6 Jul through 23 Aug 2008. The SOI shallow hazard seismic survey area is also shown.

9–4 Monitoring in the Chukchi and Beaufort Seas: Shell Offshore Inc, 2008
FIGURE 9.3. Aerial survey transect lines flown in the Harrison Bay area of the Alaskan Beaufort Sea from 25 Aug through 11 Oct 2008. The Shell 3D deep seismic and PGS/ENI nearshore seismic survey areas are shown.
FIGURE 9.4. Aerial survey transect lines flown in the Camden Bay area of the Alaskan Beaufort Sea from 13 Sep through 28 Sep 2008. The Shell 3D deep seismic survey area is also shown.

Chapter 9: Beaufort Sea Aerial Surveys 9–5
Survey Procedures
Surveys were conducted in a DHC–300 Twin Otter aircraft, operated by Bald Mountain Air. The aircraft was specially modified for survey work including upgraded engines, a STOL kit to allow safer flight at low speeds, wing–tip fuel tanks, an internal auxiliary tank for part of the season, multiple GPS navigation systems, bubble windows for primary observers, and 110 V AC power for survey equipment. Surveys were conducted at an altitude of 305 m (1000 ft) above sea level and at a groundspeed of approximately 222 km/hr (120 knots). Fuel capacity and weather conditions determined flight duration.
Two primary observers and up to two secondary observers sat at bubble windows on opposite sides of the aircraft and scanned the water within approximately 2 km (1.2 mi) of the aircraft for marine mammals. When a marine mammal was sighted, observers dictated into a digital voice recorder the species, number of individuals, sighting cue, age class (when determinable), activity, heading, swimming speed category (if relevant), and inclinometer reading. The inclinometer reading was recorded when the animal’s location was perpendicular to the path of the aircraft, allowing calculation of lateral distance from the aircraft trackline. A GPS position was also marked at this time by the computer operator (see Data Recording below).
In addition to marine mammal sightings, each observer recorded the time, sightability (subjectively classified as excellent, good, moderately impaired, seriously impaired, or impossible), sea conditions (Beaufort wind force), ice cover (percentage), ice type, slush cover (percentage), and sun glare (none, little, moderate, or severe) at 2–min intervals along transects, and at the end of each transect. These provided data in units suitable for statistical summaries and analyses of effects of these variables on the probability of detecting animals (see Davis et al. 1982; Miller et al. 1999; Thomas et al. 2002). Data Recording An additional observer onboard the aircraft entered data from primary and secondary observers into a laptop computer and also searched for marine mammals during periods when data entry was not necessary. This observer entered transect starts and stops, 2–min intervals at which environmental data were collected, and sightings into the GPS–linked laptop. These data and additional details about environmental variables and each sighting were simultaneously recorded on digital voice recorders by the primary observers for backup, validation, and later entry into the survey database. At the start of each transect, the data recorder also entered the transect start time, ceiling height (ft), cloud cover (%), wind speed (kts), and outside air temperature (°C). NRoute® position logging software was used to automatically record time and aircraft position at pre–selected intervals (typically every two seconds for straight–line transect surveys) and for all entries noted above (i.e., start, stop, each 2-min interval) for later calculation and analysis of survey effort. Analyses of Aerial Survey Data On–Transect Sightings and Effort
Environmental factors such as sea conditions, low clouds, and glare can affect an observer’s ability to see marine mammals during aerial surveys and bias results if not accounted for during analysis. To minimize bias, environmental data were used to classify sightings and effort as on–transect or other for quantitative analyses. Cetacean sightings and effort were considered on–transect when the following criteria were met: the animal was sighted while the aircraft was flying a pre–established north–south oriented transect, Beaufort wind force was 4 or less (winds 20–30 km/h; 11–16 kts), glare covered 30% or less of the viewing field, and overall sightability was described as excellent to moderately impaired. Similar restrictions were applied to determine on–transect pinniped effort and sightings except that Beaufort wind

9–6 Monitoring in the Chukchi and Beaufort Seas: Shell Offshore Inc, 2008
force was further restricted to ≤2 (winds 7–11 km/hr; 11–15 kts). Pinnipeds were only visible during optimal sightability conditions and were difficult to identify to species; therefore, no in–depth analyses of pinniped data were conducted. Seismic State Jul–Aug Surveys of the Camden Bay Area—Data from Jul–Aug surveys of the Camden Bay area were grouped into four seismic state categories (pre–seismic, seismic, post–seismic, and non–seismic) based on shotfiles recorded on the seismic source vessels. Surveys in Jul conducted prior to the start of seismic activity were termed pre–seismic. Data categorized as seismic were collected at times when airguns were active (including periods of ramp–up and mitigation–gun firing) and up to three minutes after airgun activity ceased. Data categorized as post–seismic were collected from three minutes to 24 hours after airgun activity ceased. This category represented the refractory period during which mammals potentially affected by seismic activities return to normal behavior and, as such, was analyzed separately. Miller et al. (1999) observed migrating bowhead whales to resume their “normal” migratory course 12 to 24 hrs after the cessation of seismic activities. All other effort was considered non–seismic. Sightings rates were compared among seismic states using a Chi–square test for goodness–of–fit. Surveys of the Harrison Bay Area—Two separate seismic programs (PGS nearshore seismic and SOI offshore seismic) occurred simultaneously in the Harrison Bay area. This report, however, only analyses the affects of SOI’s offshore seismic activities on bowhead whales. When analyzed separately, PGS nearshore activities appeared to have no affect on cetacean sighting rates or distributions offshore of the PGS survey area (Hauser et al. 2008) and therefore these activities were not considered when categorizing seismic state for analytical purposes in this report. Survey effort and sightings data for surveys in the Harrison Bay area were divided into three categories based on corresponding offshore 3D deep seismic activities of the Gilavar: seismic, post–seismic, and non–seismic and were determined as described above. Sep surveys of the Camden Bay Area—Survey effort and sightings data for Sep surveys in the Camden Bay area were divided into three categories based on corresponding offshore 3D deep seismic activities of the Gilavar: seismic, post–seismic, and non–seismic. These definitions were the same as described above for Jul–Aug surveys in the Camden Bay area. Mapping All on–transect sightings made during aerial surveys were mapped using ArcMap 9.3 (ESRI 1999–2008) and coded with different symbols to indicate seismic state and species. Each symbol represented one sighting, regardless of the number of individuals recorded within that sighting. We emphasized sightings rather than individuals for analyses because sightings were statistically independent, whereas a tally of individuals would include groups of individuals that were not independent of one another. In addition, bowheads often travel alone or in pairs and average group sizes seen during offshore aerial surveys of the Beaufort Sea have not been higher than 1.5 from 2006–2008 (Thomas et al. 2008; Lyons et al. 2008). Abundance and Density Abundance and density estimates were calculated to determine the numbers of whales potentially exposed to the various levels of sound during the seismic program. We calculated bowhead and beluga whale densities and abundances using DISTANCE software (Thomas et al. 2006) for each survey. Abundance estimates, however, were only calculated when effort was greater than 250 km (155 mi). Corrections for missed sightings at increasing distance from observers, f(0) values, were calculated by DISTANCE using data from sightings in the Chukchi and Beaufort seas over the past three years (2006–

Chapter 9: Beaufort Sea Aerial Surveys 9–7
2008; Thomas et al. 2008, Lyons et al. 2008). Corrections for groups that were on or near to the trackline but unavailable for detection by observers, g(0) values, were based on previous research (bowhead whales g(0) = 0.144, Thomas et al. 2002; beluga whales g(0) = 0.58, Martin and Smith 1992). In addition, right truncation distances were calculated by graphing sightings and excluding sightings where the detection probability was <0.10. Left truncation distances were set at 100 ft, because animals directly below the aircraft were difficult to see and attempting to detect all animals below the aircraft would have resulted in substantially fewer sightings. Several models were created and compared in DISTANCE, and the best fitting model, with the lowest Akaike's Information Criterion (AIC, Burnham and Anderson, 1998), was chosen. Bootstrapped abundance averages were then calculated using the Resampling Tool Add–on for Excel (Blank et al. 2000). Spatial differences
As described briefly in the introduction, changes in the distribution of bowhead whales, and other species to a lesser extent, relative to seismic survey activity have been documented (Richardson et al. 1986, Koski and Johnson 1987, Ljungblad et al. 1988, Richardson and Malme 1993; Miller et al. 1999). During the fall bowhead migration westward through the Alaskan Beaufort Sea, the location of whales relative to shore and/or water depth would be expected to change as they pass seismic survey activities. East of seismic survey activities, whales would be expected to be following the ‘normal’ migratory path for that year. At or very near to the seismic activities, the distance from shore and/or depth of water where whales occur would be expected to change, if they react to the survey activities. West of the seismic survey whales either return to their ‘normal’ migratory distribution, or perhaps their distribution remains somewhat altered for an unknown distance. Therefore, differences in distance from shore, water depths at sightings, and longitudinal distribution of bowhead whales relative to seismic activity were of interest.
To assess these differences, we divided each of the three survey areas (Jul–Aug surveys of the Camden Bay area, surveys of the Harrison Bay area, and Sep surveys of the Camden Bay area) into three sub–areas: east, central, and west. These sub-areas were designed so that the central sub-area included the seismic survey area (see Figures 9.2–9.4). We expected that one potential response of bowhead whales to seismic activity might be to increase distance from seismic activity (either by moving farther offshore or closer to shore) in the central and perhaps the west sub-areas.
Effort and sightings data were divided into 5–km distance from shore bins, with a “0-km from shore” line approximating the shoreline or the outer edge of the barrier islands. To assess any offshore deflections, sighting rates were computed within each of these bins and statistically compared between seismic and non–seismic states with a bootstrapped Kolmogorov–Smirnov test (K–S test) in the R statistical software package (R Development Core Team 2008). This test compares the empirical distribution (in our case the distribution of observed sightings relative to shore) to a normal cumulative distribution of random numbers. The statistical power of a standard K–S test decreases when data are grouped. A further decrease in power results as the categories are broadened, to create fewer groups,. Grouping was necessary for density data, however, to relate sightings to survey effort by distance from shore. The loss of power can be minimized by using a larger number of narrow categories and for this reason we used 5–km (3–mi) categories, even though 10–km (6–mi) categories result in a smoother distribution of sightings–per–unit–effort vs. distance from shore. In addition, the bootstrapped K–S test is more robust than the standard K–S test when datasets include ties and was used to further increase the validity of tests. This statistical test was used to determine whether the effect of seismic activity appeared to alter whale distributions among east, central, and west sub-areas, when sample sizes permitted.

9–8 Monitoring in the Chukchi and Beaufort Seas: Shell Offshore Inc, 2008
Distribution Relative to the Center of the Seismic Survey Area The distribution of mammal sightings relative to the center of the seismic survey area was calculated by plotting the seismic prospect in ArcMap 9.3 and estimating the geographical center with the measure tool. Sightings were then plotted and the GIS add–on Hawth’s Tools (Beyer, 2004) used to determine distances between sightings and the center point of the prospect. Data were then compared with the non–parametric Kruskall–Wallis test to determine whether average distance from the center of the seismic survey area differed among seismic states. Headings, Activities, and Speed
We assessed headings, speeds, and activities of whales relative to seismic activities in the study areas to further consider potential impacts of the survey. Headings were plotted by area and seismic state and mean vector headings and circular standard deviations assessed with Oriana statistical software (KCS 2008). Speeds and headings were only assessed for whales observed to be either traveling or swimming. If possible, behavior (movements or processes in which animal is engaged) and activity (a collection of behaviors that indicate the animal is working toward an overall goal such as migrating) were recorded for each sighting. Behaviors included swimming, diving, surface active (flipper or fluke slaps, splashing, etc.), and hauled out; whereas activities included feeding, traveling, socializing, resting, and milling. Due to the limited time period for which an animal was observed, it was not always possible to determine the behavior, activity, speed, and/or heading for every sighting; as a result, a subset of this information was often collected. Estimated Exposures
Aerial survey densities used to estimate exposures were calculated using DISTANCE software. Densities were calculated for each survey individually, and then a weighted average was calculated for Jul–Aug surveys in Camden Bay, all surveys in Harrison Bay, and Sep surveys in Camden Bay. The weighted average density for each of these three periods was then multiplied by the area of water exposed to received sound levels ≥160dB re 1µPa (rms) and ≥180dB re 1µPa (rms) to calculate the estimated number of individual whales potentially exposed at those levels. Estimated number of exposures per individual was calculated by determining the ratio of the total area of water ensonified (including areas that were ensonified multiple times) to the area of water ensonified with overlapping areas excluded.
Results
All Surveys Survey effort
Aerial surveys were flown over the Alaskan Beaufort Sea from 6 Jul through 11 Oct 2008; a total of 23,745 km (14,755 mi) of effort was obtained during 52 surveys. Survey effort was most extensive for Jul–Aug surveys of the Camden Bay area, with over twice as much effort as in the Harrison Bay area, and five times as much effort as Sep surveys of the Camden Bay area. Effort among survey sub-areas (west, central, east) and within distance from shore categories was similar for both the Harrison and Camden Bay areas. Because seismic activity did not start until well after the initiation of Jul–Aug surveys in the Camden Bay area, these surveys had more pre– and non–seismic effort than the Harrison Bay area surveys or Sep surveys of the Camden Bay area.
To account for potentially confounding variables, such as season and geographic location, the 2008 aerial survey data set was split into three data subsets: (1) Jul-Aug surveys of the Camden Bay area, (2)

Chapter 9: Beaufort Sea Aerial Surveys 9–9
surveys of the Harrison Bay area, and (3) Sep surveys of the Camden Bay area. Each of these subsets are analyzed in detail below.
Jul–Aug Surveys in the Camden Bay Area Survey effort Surveys were flown in the Camden Bay area from 6 Jul to 23 Aug (Figure 9.5). Survey effort ranged from 18 km (11 mi) to 732 km (455 mi) per survey (2% to 91% of the survey grid) with poor weather, low ceiling or high winds frequently prohibiting or truncating survey effort (Appendix Figure M.1). The pre–seismic period lasted until 22 Jul, when SOI seismic activities began, and comprised the majority of survey effort (5009 km of effort; 3112 mi). Seismic and post–seismic periods occurred in late Jul to mid–Aug (Figure 9.5). Overall, 1442 km (896 mi) of survey effort were collected during seismic activities, 974 km (605 mi) during post–seismic activities, and an additional 3199 km during non–seismic activities (1988 mi). Dates of aerial survey flights are compared with hours of vessel–based seismic data acquisition in Appendix Figure M.2.
When compared among areas, effort was similar, though slightly higher in the central sub-area (Figure 9.6). When assessed by 5–km (3–mi) distance from shore bins, survey effort was highest in the 10–15 km (6–9 mi) from shore bin (Figure 9.7). In general, effort was relatively high up to approximately 55 km (34 mi) offshore and dropped substantially beyond 70 km (43 mi) from shore (Figure 9.7).
0100200300400500600700800
6 Jul
9 Jul
12 Ju
l
15 Ju
l
18 Ju
l
21 Ju
l
24 Ju
l
27 Ju
l
30 Ju
l
2 Aug
5 Aug
8 Aug
11 Aug
14 Aug
17 Aug
20 Aug
23 Aug
Date
Effo
rt (k
m)
Pre-seismicSeismicPost-seismicNon-seismic
FIGURE 9.5. Survey effort by seismic state (indicated by fill pattern) in the Camden Bay area from 6 Jul to 23 Aug 2008.

9–10 Monitoring in the Chukchi and Beaufort Seas: Shell Offshore Inc, 2008
0
1000
2000
3000
4000
5000
West Central East
Survey Area Within Camden Bay
Surv
ey E
ffort
(km
)
FIGURE 9.6. Aerial survey effort in west, central, and east sub-areas of the Camden Bay area from 6 Jul to 23 Aug 2008.
0100200300400500600700800900
1000
0-5
10-1
5
20-2
5
30-3
5
40-4
5
50-5
5
60-6
5
70-7
5
80-8
5
90-9
5
100-
105
110-
115
Distance From Shore (km)
Surv
ey E
ffor
t (km
)
FIGURE 9.7. Aerial survey effort by 5–km distance from shore bins in the Camden Bay area from 6 Jul to 23 Aug 2008.
Bowhead Whales Sightings and Sighting rates.—A total of 28 bowhead whale sightings (35 individual whales) were recorded during Jul–Aug surveys in the Camden Bay area. Twelve of these sightings (18 individuals) were recorded on–transect in acceptable sightability conditions (Figure 9.8, Table 9.1; see Methods for definitions of sightability and on–transect) and are used in the following analyses and discussion. Bowhead whales were observed on 23% of surveys and an overall rate of 1.13 sightings/1000 km (1.82 sightings/1000 mi). Sighting rates ranged from 0–7 sightings/1000 km (0–11 sightings/1000 mi) and 0 to 11 individuals/1000 km (0–18 individuals/1000 mi). Bowhead whale sighting rates were highest in early Jul and late Aug, with peak rates of 7 sightings/1000 km (11 sightings/1000 mi) on 9 Jul and 4 sightings/1000 km (6 sightings/1000 mi) on 23 Aug .

Chapter 9: Beaufort Sea Aerial Surveys 9–11
FIGURE 9.8. Bowhead whale (BHW) and unidentified mysticete whale (UMW) sighting locations during Jul–Aug surveys in the Camden Bay area in the Alaskan Beaufort Sea from 6 Jul to 23 Aug 2008. The SOI shallow hazard seismic survey area in Camden Bay is also shown.
Bowhead sighting rates were calculated for surveys conducted during pre–seismic, seismic, post–seismic, and non–seismic periods. Overall bowhead whale sighting rates (all areas) were highest during the pre–seismic period (1.6 sightings/1000 km; 2.6 sightings/1000 mi) and lowest during post–seismic periods (0 sightings/1000 km; 0 sightings/1000 mi; Figure 9.9, Table 9.2). However, sighting rates did not differ significantly among seismic states (Chi–square test, p > 0.05, Table 9.3).
When we examined sighting rates by sub-area within the Camden Bay area, sighting rates were lowest in the west; however, this difference was not statistically significant (Chi–square test, p > 0.05, Table 9.4). In the central sub-area (where seismic activities occurred), sightings appeared to be higher during pre–seismic and non–seismic periods than in other seismic states, however, the low sample size precluded statistical analyses for this subset of the data.

9–12 Monitoring in the Chukchi and Beaufort Seas: Shell Offshore Inc, 2008
TABLE 9.1. Summary of aerial survey effort and sighting rates in the Camden Bay area from 6 Jul through 23 Aug 2008. Numbers of sightings and individuals in parentheses were based on <500 km of effort and should be viewed with caution. Sighting rates were not calculated (“NC”) when effort was less than 250 km (155 mi).
Sightings Individuals Sightings/1000 km
Individuals/1000 km
6 Jul 1 636 67 0 0 0.0 0.07 Jul 2 664 70 1 1 1.5 1.58 Jul 3 501 53 0 0 0.0 0.09 Jul 4 732 77 5 8 6.8 10.910 Jul 5 626 66 0 0 0.0 0.011 Jul 6 526 55 0 0 0.0 0.012 Jul 7 706 74 2 2 2.8 2.813 Jul 8 18 2 (0) (0) NC NC14 Jul 9 599 63 0 0 0.0 0.022 Jul 10 220 23 (0) (0) NC NC25 Jul 11 31 3 (0) (0) NC NC27 Jul 12 405 43 (0) (0) 0.0 0.028 Jul 13 328 35 (0) (0) 0.0 0.01 Aug 14 190 20 (0) (0) NC NC2 Aug 14 475 50 (0) (0) 0.0 0.04 Aug 15 653 69 0 0 0.0 0.05 Aug 16 542 57 0 0 0.0 0.06 Aug 17 398 42 (0) (0) 0.0 0.08 Aug 17 207 22 (0) (0) NC NC11 Aug 18 607 64 0 0 0.0 0.016 Aug 19 189 20 (0) (0) NC NC18 Aug 20 565 60 0 0 0.0 0.019 Aug 21 104 11 (1) (1) NC NC21 Aug 22 0 0 (0) (0) NC NC23 Aug 22 701 74 3 6 4.3 8.6
Total 22 10623 100 12 18 1.13 1.69
Bowhead Whale
Date Survey No.
Effort (km)
Percent of Survey
Area

Chapter 9: Beaufort Sea Aerial Surveys 9–13
012345678
6 Ju
l8
Jul
10 J
ul12
Jul
14 J
ul16
Jul
18 J
ul20
Jul
22 J
ul24
Jul
26 J
ul28
Jul
30 J
ul1
Aug
3 A
ug5
Aug
7 A
ug9
Aug
11 A
ug13
Aug
15 A
ug17
Aug
19 A
ug21
Aug
23 A
ug
Date
Sigh
tings
/100
0 km
Pre-seismicNon-seismicPost-seismicSeismic
* * * * * * * * * * * * * * * ** * +
FIGURE 9.9. Bowhead whale sighting rates from aerial surveys of the central Beaufort Sea from 6 Jul through 23 Aug 2008. Days on which surveys were conducted but no sightings were recorded are indicated by an asterisk. Sighting rates for surveys with less than 250 km (311 mi) of effort were not calculated, but are indicated with a plus-sign. Seismic activities at the time of sightings are indicated by fill pattern.
TABLE 9.2. Bowhead whale sightings and sighting rates during aerial surveys in the Camden Bay area by seismic state from 6 Jul through 23 Aug 2008.
Pre-seismic Seismic Post-seismic Non-seismic Total
West Sightings 0 0 0 0 0Individuals 0 0 0 0 0Sightings/1000 km 0.0 0.0 0.0 0.0 0.0Individuals/1000 km 0.0 0.0 0.0 0.0 0.0
Central Sightings 3 0 0 3 6Individuals 3 0 0 6 9Sightings/1000 km 1.4 0.0 0.0 2.4 1.4Individuals/1000 km 1.4 0.0 0.0 4.7 2.1
East Sightings 5 1 0 0 6Individuals 8 1 0 0 9Sightings/1000 km 4 2 0 0 2Individuals/1000 km 6 2 0 0 3
All areas Sightings 8 1 0 3 12Individuals 11 1 0 6 18Sightings/1000 km 1.6 0.7 0.0 0.9 1.1Individuals/1000 km 2.2 0.7 0.0 1.9 1.7

9–14 Monitoring in the Chukchi and Beaufort Seas: Shell Offshore Inc, 2008
TABLE 9.3. Chi–square test comparing differences in number of bowhead whale sightings by seismic state during aerial surveys in the Camden Bay area, 6 Jul through 23 Aug 2008.
Area Pre-seismic Seismic Post-seismic Non-seismic χ2 One-tailed p
All Sightings (obs.) 8 1 0 3 2.416 0.491Sightings (exp.) 5.7 1.6 1.1 3.6Effort (km) 5008.8 1441.8 973.6 3198.7
TABLE 9.4. Chi–square test comparing bowhead sighting rates in the east, west and central sub-areas during aerial surveys in the Camden Bay area, 6 Jul through 23 Aug 2008.
West Central East χ2 One-tailed p
Sightings (obs.) 0 6 6 22.595 0.108Sightings (exp.) 3 5 4Effort (km) 2768.3 4376.2 3478.5
Abundance and Density—Numbers of bowheads present within the Camden Bay area from 6
Jul through 23 Aug 2008 were estimated using DISTANCE software (Table 9.5). Approximately 59 (weighted average based on data in Table 9.5, s.d.= 31.4, 95% C.I.= 5–127) bowhead whales were estimated to have been present in the aerial survey area each day during the study. However, no bowhead whales were sighted from 12 Jul through 19 Aug and, as such, abundances during this period were likely less than the average of 59 whales. Estimates during individual surveys ranged from 0 to 406 individuals, with highest numbers on 9 Jul and 23 Aug. Some estimates should be interpreted with caution due to low survey effort (<500 km). In addition, survey effort was too low to calculate a bowhead abundance estimate for five surveys, although the effort and sightings from these surveys were included in the calculation of weighted average abundance.
Distance from shore and depth—Peak bowhead sighting rates were observed at distances 60–65 km (37–40 mi) from shore (Figure 9.10) during this survey period. This pattern was observed in the east and central sub-areas (no sightings were observed in the west). When assessed by seismic state, peak sighting rates were farthest offshore during pre–seismic periods (60–65 km; 37–40 mi). In contrast, sighting rates during seismic periods were highest somewhat closer to shore (10–15 km; 6–9 mi). However, there were too few sightings to compare differences statistically. Values for all distance from shore bins are shown in Appendix Table M.1.
Distance from shore and depth were strongly correlated and we would expect that patterns in sighting rates by depth should be similar to those observed in the distance from shore analysis above. We therefore did not conduct a detailed analysis of water depth in relation to sighting rates. Observed water depth where bowhead whales were sighted varied from 24 to 133 m (79 to 436 ft). The majority of sightings, made during pre–seismic activity early in the season, were at depths greater than 50 m (164 ft; Figure 9.11).

Chapter 9: Beaufort Sea Aerial Surveys 9–15
TABLE 9.5. Estimated numbers of bowhead whales in the Camden Bay area, 6 Jul through 23 Aug 2008. Estimates were obtained using DISTANCE software for each individual survey. Numbers in parentheses should be interpreted with caution due to low effort (<500 km or 311 mi). Estimates include allowance for f(0) (as calculated by DISTANCE) and g(0) (value of 0.144 from Thomas et al. 2002).
Survey No. Date Effort
(km) SightingsDensity
(No./1000 km2)Est. No. Whales
1 6 Jul 636 0 0.0 0 -- --2 7 Jul 664 1 9.9 56 11 2923 8 Jul 501 0 0.0 0 -- --4 9 Jul 732 5 71.7 406 166 9925 10 Jul 626 0 0.0 0 -- --6 11 Jul 526 0 0.0 0 -- --7 12 Jul 706 2 18.6 105 25 4508 13 Jul 18 (0) NC NC -- --9 14 Jul 599 0 0.0 0 -- --10 22 Jul 220 (0) NC NC -- --11 25 Jul 31 (0) NC NC -- --12 27 Jul 405 (0) (0.0) (0) -- --13 28 Jul 328 (0) (0.0) (0) -- --14 1, 2 Aug 665 0 0.0 0 -- --15 4 Aug 653 0 0.0 0 -- --16 5 Aug 542 0 0.0 0 -- --17 6, 8 Aug 605 0 0.0 0 -- --18 11 Aug 607 0 0.0 0 -- --19 16 Aug 189 (0) NC NC -- --20 18 Aug 565 0 0.0 0 -- --21 19 Aug 104 (1) NC NC -- --22 23 Aug 701 3 56.1 318 76 1330
95% C.I.

9–16 Monitoring in the Chukchi and Beaufort Seas: Shell Offshore Inc, 2008
(A) Central
(B) East
(C) All sub-areas
0
50
100
150
200
0-5
10-1
5
20-2
5
30-3
5
40-4
5
50-5
5
60-6
5
70-7
5
80-8
5
90-9
5
100-
105
110-
115Si
ghtin
gs/1
000
km SeismicPost seismicNonseismicPre-seismic
0
50
100
150
200
0-5
10-1
5
20-2
5
30-3
5
40-4
5
50-5
5
60-6
5
70-7
5
80-8
5
90-9
5
100-
105
110-
115Si
ghtin
gs/1
000
km
050
100150200
0-5
10-1
5
20-2
5
30-3
5
40-4
5
50-5
5
60-6
5
70-7
5
80-8
5
90-9
5
100-
105
110-
115
Distance From Shore (km)
Sigh
tings
/100
0 km
FIGURE 9.10. Bowhead sighting rates within 5–km distance-from-shore bins during aerial surveys in the Camden Bay area from 6 Jul through 23 Aug 2008; (A) central, (B) east, (C) all sub-areas. No sightings were made in the west sub-area.

Chapter 9: Beaufort Sea Aerial Surveys 9–17
0
1
2
3
4
0-5
10-1
5
20-2
5
30-3
5
40-4
5
50-5
5
60-6
5
70-7
5
80-8
5
90-9
5
100-
105
110-
115
120-
125
130-
135
140-
145
Water Depth (m)
Num
ber o
f Sig
htin
gsPre-seismicNon-seismicPost-seismicSeismic
FIGURE 9.11. Number of bowhead whale sightings at 5–m (16–ft) water depth intervals during aerial surveys from 6 Jul through 23 Aug 2008. Seismic state at the time of sightings is indicated by fill pattern.
Distribution around seismic operations—Data were examined with respect to the distance of
sightings from the center of the seismic survey area in 2008. The single bowhead whale observed during seismic activity was slightly farther from the prospect center compared with bowheads observed during pre–seismic and non–seismic periods (Table 9.6); however, meaningful conclusions could not be drawn due to the small sample size. Details on bowhead sightings made during seismic periods are presented in Appendix Table M.2.
Activities—Specific activities were recorded for six bowhead whale sightings. Three sightings were of traveling whales, two were of feeding whales, and one was of a resting whale (Figure 9.12). Resting or traveling whales were observed during pre–seismic periods, whereas feeding whales were observed during seismic or non–seismic periods.
Speed—Whales that were not classified as feeding or resting moved at slow (three sightings) or moderate speeds (five sightings; Figure 9.13). There did not appear to be any relationship between speed and seismic activity, although data were too limited to conduct statistical analysis.
Headings— We assumed bowheads that were swimming or traveling were migrating and compared their headings during different seismic states. Headings of eight bowhead whales were recorded, seven of which were sighted in the pre–seismic period, and one during a non-seismic period. These individuals had a mean vector heading of 84.6ºT (Figure 9.14). The one sighting made during non–seismic activities had a westward heading (270ºT). When assessed by sub-area, no patterns were apparent. Mean vector headings were easterly in the east sub-area (94.3ºT) and northeasterly in the central sub-area (28.0ºT). No headings were recorded for sightings made in the west sub-area.

9–18 Monitoring in the Chukchi and Beaufort Seas: Shell Offshore Inc, 2008
TABLE 9.6. Minimum, maximum and mean distance (km) of bowhead whale sightings from the center of the seismic prospect by seismic state in the Camden Bay area, 6 Jul through 23 Aug 2008.
Sightingsn Min. Max. Mean
Pre-seismic 8 31.7 38.1 45.5Seismic 1 54.8 54.8 54.8Post-seismic 0 -- -- --Non-seismic 3 10.5 13.3 18.8
Seismic StateDistance from Prospect Center
0
1
2
3
4
Feed Mill Rest SurfaceActive
Socialize Travel
Activity
Num
ber o
f Obs
erva
tions
Pre-seismicNon-seismicPost-seismicSeismic
FIGURE 9.12. Observed activities of bowhead whales sighted during aerial surveys from 6 Jul through 23 Aug 2008 in the Camden Bay area. Seismic state at the time of sighting is indicated by the fill pattern.
0
1
2
3
4
5
6
Slow Moderate Fast
Speed
Num
ber o
f Obs
erva
tions
Pre-seismicNon-seismicPost-seismicSeismic
FIGURE 9.13. Observed speeds of bowhead whales sighted during aerial surveys from 6 Jul through 23 Aug 2008 in the Camden Bay area. Seismic state at the time of sighting is indicated by the fill pattern.

Chapter 9: Beaufort Sea Aerial Surveys 9–19
(A) Pre-seismic (B) Non-seismic
n Mean Circular s.d. n Mean Circular s.d. 7 84.6° 34.2° 1 270.0° --
(C) East (D) Central
n Mean Circular s.d. n Mean Circular s.d. 5 94.3° 29.6° 3 28.0° 84.9°
g0
90
180
270
0
90
180
270
0
90
180
270
0
90
180
270
FIGURE 9.14. Headings of bowhead whales during pre–seismic and non–seismic periods in the Camden Bay area from 6 Jul through 23 Aug 2008.
Mitigation Measures Implemented—As required by the 2008 IHA issued by the NMFS,
mitigation was necessary if an aggregation of 12 or more bowhead whales was observed within the ≥160 dB (rms) radius, or if four or more cow/calf pairs were observed within the ≥120 dB radius. No bowhead whales were detected within the ≥160 dB or ≥120 dB zones of SOI’s shallow–hazard surveys while seismic activities were underway during the 6 Jul through 23 Aug period.
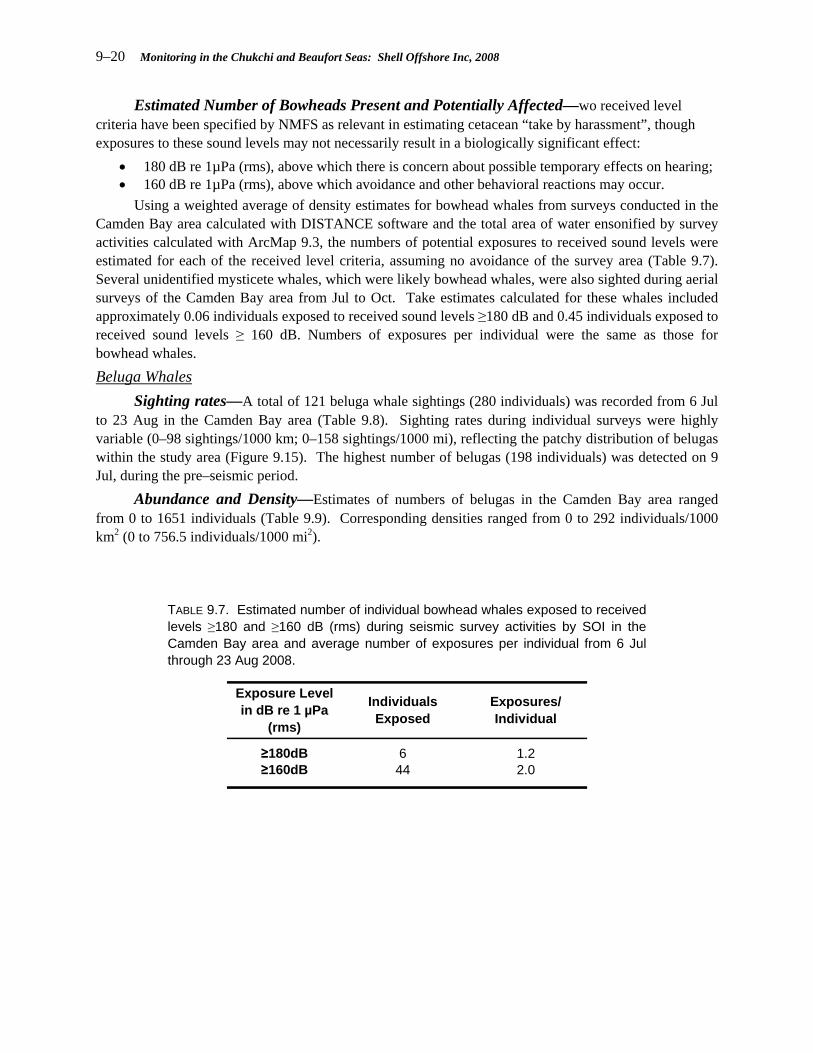
9–20 Monitoring in the Chukchi and Beaufort Seas: Shell Offshore Inc, 2008
Estimated Number of Bowheads Present and Potentially Affected—wo received level criteria have been specified by NMFS as relevant in estimating cetacean “take by harassment”, though exposures to these sound levels may not necessarily result in a biologically significant effect:
• 180 dB re 1µPa (rms), above which there is concern about possible temporary effects on hearing; • 160 dB re 1µPa (rms), above which avoidance and other behavioral reactions may occur.
Using a weighted average of density estimates for bowhead whales from surveys conducted in the Camden Bay area calculated with DISTANCE software and the total area of water ensonified by survey activities calculated with ArcMap 9.3, the numbers of potential exposures to received sound levels were estimated for each of the received level criteria, assuming no avoidance of the survey area (Table 9.7). Several unidentified mysticete whales, which were likely bowhead whales, were also sighted during aerial surveys of the Camden Bay area from Jul to Oct. Take estimates calculated for these whales included approximately 0.06 individuals exposed to received sound levels ≥180 dB and 0.45 individuals exposed to received sound levels ≥ 160 dB. Numbers of exposures per individual were the same as those for bowhead whales. Beluga Whales Sighting rates—A total of 121 beluga whale sightings (280 individuals) was recorded from 6 Jul to 23 Aug in the Camden Bay area (Table 9.8). Sighting rates during individual surveys were highly variable (0–98 sightings/1000 km; 0–158 sightings/1000 mi), reflecting the patchy distribution of belugas within the study area (Figure 9.15). The highest number of belugas (198 individuals) was detected on 9 Jul, during the pre–seismic period. Abundance and Density—Estimates of numbers of belugas in the Camden Bay area ranged from 0 to 1651 individuals (Table 9.9). Corresponding densities ranged from 0 to 292 individuals/1000 km2 (0 to 756.5 individuals/1000 mi2).
TABLE 9.7. Estimated number of individual bowhead whales exposed to received levels ≥180 and ≥160 dB (rms) during seismic survey activities by SOI in the Camden Bay area and average number of exposures per individual from 6 Jul through 23 Aug 2008.
≥180dB 6 1.2≥160dB 44 2.0
Exposure Level in dB re 1 µPa
(rms)
Individuals Exposed
Exposures/ Individual

Chapter 9: Beaufort Sea Aerial Surveys 9–21
TABLE 9.8. Summary of aerial survey effort and beluga whale sighting rates in the Camden Bay area from 6 Jul through 23 Aug 2008. Numbers of sightings and individuals in parentheses were based on <500 km (311 mi) of effort and should be viewed with caution. Sighting rates were not calculated (“NC”) when effort was less than 250 km (155 mi).
Sightings Individuals Sightings/1000 km
Individuals/1000 km
6 Jul 1 636 67 2 5 3.1 7.97 Jul 2 664 70 4 7 6.0 10.58 Jul 3 501 53 0 0 0.0 0.09 Jul 4 732 77 72 198 98.4 270.6
10 Jul 5 626 66 11 17 17.6 27.211 Jul 6 526 55 1 3 1.9 5.712 Jul 7 706 74 7 18 9.9 25.513 Jul 8 18 2 (0) (0) NC NC14 Jul 9 599 63 10 18 16.7 30.022 Jul 10 220 23 (0) (0) NC NC25 Jul 11 31 3 (0) (0) NC NC27 Jul 12 405 43 (1) (1) 2.5 2.528 Jul 13 328 35 (2) (2) 6.1 6.11 Aug 14 190 20 (0) (0) NC NC2 Aug 14 475 50 (7) (7) 14.8 14.84 Aug 15 653 69 1 1 1.5 1.55 Aug 16 542 57 0 0 0.0 0.06 Aug 17 398 42 (0) (0) 0.0 0.08 Aug 17 207 22 (0) (0) NC NC
11 Aug 18 607 64 2 2 3.3 3.316 Aug 19 189 20 (0) (0) NC NC18 Aug 20 565 60 0 0 0.0 0.019 Aug 21 104 11 (0) (0) NC NC21 Aug 22 0 0 (0) (0) NC NC23 Aug 22 701 74 1 1 1.4 1.4
Total 22 10623 100 121 280 11.39 26.36
Beluga Whale
Date Survey No.
Effort (km)
Percent of Survey
Area

9–22 Monitoring in the Chukchi and Beaufort Seas: Shell Offshore Inc, 2008
FIGURE 9.15. Beluga whale (W W) and unidentified odontocete whale (UT W) sightings during aerial surveys in the Camden Bay area from 6 Jul through 23 Aug 2008.

Chapter 9: Beaufort Sea Aerial Surveys 9–23
TABLE 9.9. Estimated numbers of beluga whales in the Camden Bay area, 6 Jul through 23 Aug 2008. Estimates obtained using DISTANCE software for each individual survey. Numbers in parentheses should be interpreted with caution due to low effort (<500 km or 311 mi). Estimates include allowance for f(0) (as calculated by DISTANCE) and g(0) (value of 0.58 from Martin and Smith 1992). No density was calculated for 23 Aug, as the single sighting that day fell outside of truncation distances.
Survey No. Date Effort
(km) SightingsDensity
(No./1000 km2)Est. No. Whales
1 6 Jul 636 2 13.5 76 10 5982 7 Jul 664 4 15.5 88 24 3173 8 Jul 501 0 0.0 0 -- --4 9 Jul 732 72 291.8 1651 662 41165 10 Jul 626 11 33.0 187 38 9276 11 Jul 526 1 9.8 55 9 3487 12 Jul 706 7 19.0 108 16 7188 13 Jul 18 (0) NC NC -- --9 14 Jul 599 10 43.0 243 51 116910 22 Jul 220 (0) NC NC -- --11 25 Jul 31 (0) NC NC -- --12 27 Jul 405 (1) (4.2) (24) (5) (109)13 28 Jul 328 (2) (10.5) (59) (13) (275)14 1, 2 Aug 665 7 18.1 102 30 34415 4 Aug 653 1 2.6 15 2 10216 5 Aug 542 0 0.0 0 -- --17 6, 8 Aug 605 0 0.0 0 -- --18 11 Aug 607 2 5.7 32 6 17319 16 Aug 189 (0) NC NC -- --20 18 Aug 565 0 0.0 0 -- --21 19 Aug 104 (0) NC NC -- --22 23 Aug 701 1 0.0 0 -- --
95% C.I.
Distance from shore and depth—Beluga whale sightings increased in frequency at the northern end of transects, and most sightings were between 50 and 85 km (31 and 53 mi) from shore (Figure 9.16). Most beluga sightings were north of the seismic survey area, at depths > 40 m (131 ft).
Activities and speed—Based on beluga observations for which movement data were collected, most beluga whales were moving at moderate speeds (87%) while swimming or traveling (Figure 9.17). Smaller numbers were moving at either fast (8%) or slow (5%) speeds. More observations of belugas moving at fast or moderate speeds were made during pre–seismic periods than other periods; however, the low sample sizes during non–seismic and seismic periods precluded statistical analyses.
Estimated Number of Beluga Whales Present and Potentially Affected—Methods for calculating beluga whale exposures to received sound levels (≥180 dB and ≥160 dB) were the same as those used for bowhead whales. We estimated that three belugas potentially would have been exposed to sound levels ≥180 dB (1.2 exposures each), and that 21 individuals potentially would have been exposed to sound levels ≥160dB (two exposures each; Table 9.10) if they showed no avoidance of the survey activities. In addition, takes were similarly calculated for unidentified odontocete whales observed in the study area, which were likely belugas. Approximately 0.03 individual unidentified odontocete whales were exposed to sound levels ≥180 dB and approximately 0.23 individuals to sound levels of ≥160dB. Exposure levels were equivalent to those for beluga whales.
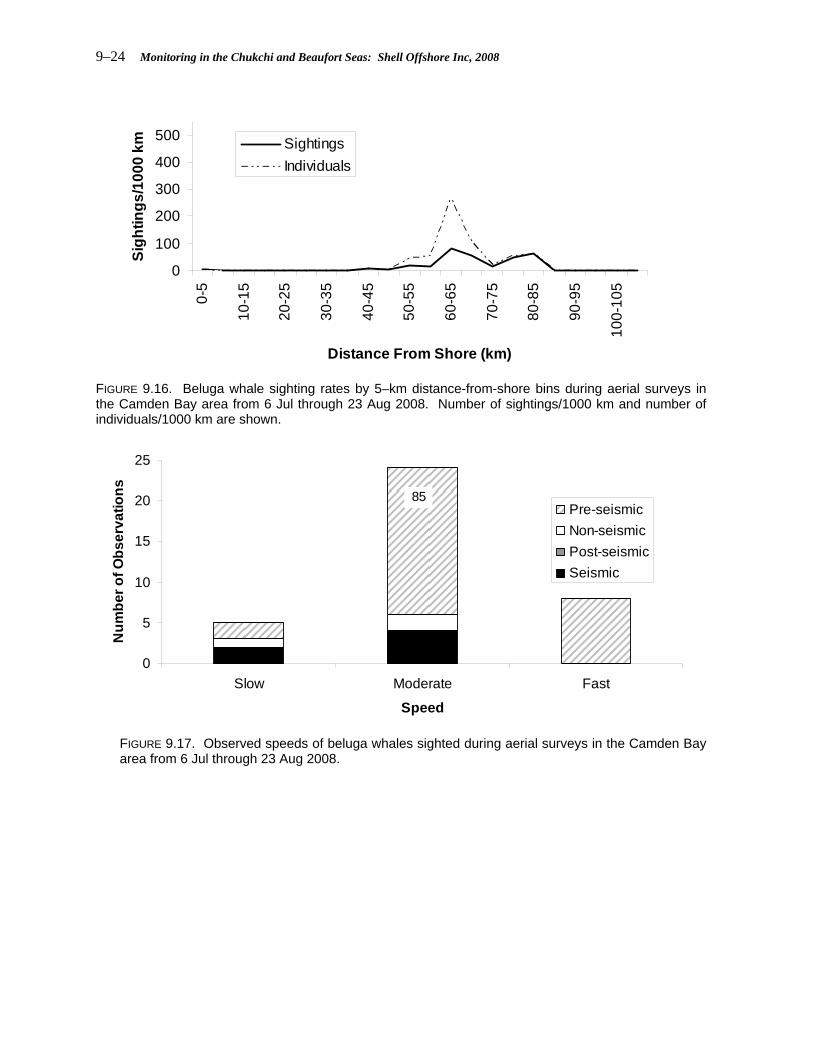
9–24 Monitoring in the Chukchi and Beaufort Seas: Shell Offshore Inc, 2008
0
100
200
300
400
500
0-5
10-1
5
20-2
5
30-3
5
40-4
5
50-5
5
60-6
5
70-7
5
80-8
5
90-9
5
100-
105
Distance From Shore (km)
Sigh
tings
/100
0 km Sightings
Individuals
FIGURE 9.16. Beluga whale sighting rates by 5–km distance-from-shore bins during aerial surveys in the Camden Bay area from 6 Jul through 23 Aug 2008. Number of sightings/1000 km and number of individuals/1000 km are shown.
0
5
10
15
20
25
Slow Moderate Fast
Speed
Num
ber o
f Obs
erva
tions
Pre-seismicNon-seismicPost-seismicSeismic
85
FIGURE 9.17. Observed speeds of beluga whales sighted during aerial surveys in the Camden Bay area from 6 Jul through 23 Aug 2008.

Chapter 9: Beaufort Sea Aerial Surveys 9–25
TABLE 9.10. Estimated number of individual beluga whales exposed to received levels ≥180 and ≥160 dB re 1ųPa (rms) and average number of exposures per individual during seismic survey activities by SOI in the Camden Bay area from 6 Jul through 23 Aug 2008.
≥180dB 3 1.2≥160dB 21 2.0
Exposure Level in dB re 1 µPa
(rms)
Individuals Exposed
Exposures/ Individual
Polar bears
Eleven polar bears sightings (19 individuals) were recorded in the Camden Bay area from 6 Jul to 23 Aug, 10 of which were off–transect on or near barrier islands (Figure 9.18). None of the bears were sighted during the pre–seismic period, four sightings were during seismic activities, one during post–seismic periods, and six during non–seismic periods. One bear was sighted approximately 56 km north of the barrier islands and was swimming north. Five of the sightings were sows with their young, and all other sightings were either adults or of undetermined age.
FIGURE 9.18. Polar bear (PB) sightings during aerial surveys relative to shallow hazard seismic activities in the Camden Bay area from 6 Jul through 23 Aug 2008.

9–26 Monitoring in the Chukchi and Beaufort Seas: Shell Offshore Inc, 2008
Seals A total of 47 bearded seal sightings (57 individuals), 37 ringed seal sightings (142 individuals), three
spotted seal sightings (three individuals) and 97 sightings (130 individuals) of small, unidentified seals, was observed during aerial surveys (Figures 9.19 and 9.20). Seals were only visible during optimal sightability conditions and were not easily identifiable to species at the survey altitude of 305 m (1000 ft) above sea level; therefore, no in–depth analyses of seal data were conducted.
FIGURE 9.19. Bearded seal (BS) and unknown pinniped (UP) sightings during aerial surveys in the Camden Bay area from 6 Jul through 23 Aug 2008.

Chapter 9: Beaufort Sea Aerial Surveys 9–27
FIGURE 9.20. Ringed seal (RS), spotted seal (SS), and unidentified marine mammal (U) sightings during aerial surveys in the Camden Bay area from 6 Jul through 23 Aug 2008.
Surveys of the Harrison Bay Area Survey Effort Surveys were flown in the Harrison Bay area from 25 Aug to 11 Oct. Effort was limited by weather conditions (Appendix Figure M.3) and ranged from 6 km (4 mi) to 1167 km (725 mi) per survey. Most surveys were conducted during non–seismic periods, although surveys did overlap with seismic activities on nine survey days (Figure 9.21, Appendix Figure M.4). When assessed by sub-area, effort was greatest in the central sub-area of the Harrison Bay survey area (5308 km; 3298 mi) and lowest in the east (1287 km or 800 mi; Figure 9.22). We surveyed up to 115 km (71 mi) from shore, though effort was concentrated between 10 km (6 mi) and 75 km (47 mi) from shore (Figure 9.23).

9–28 Monitoring in the Chukchi and Beaufort Seas: Shell Offshore Inc, 2008
0
250
500
750
1000
25 Aug
28 Aug
31 Aug
3 Sep
6 Sep
9 Sep
12 Sep
15 Sep
18 Sep
21 Sep
24 Sep
27 Sep
30 Sep
3 Oct
6 Oct
9 Oct
Date
Effo
rt (k
m)
SeismicPost-seismicNon-seismic
FIGURE 9.21. Survey effort over time from 25 Aug to 11 Oct 2008 in the Harrison Bay area. Seismic state for each date is shown by the fill pattern.
0
1000
2000
3000
4000
5000
6000
West Central East
Survey Area in Harrison Bay
Surv
ey E
ffort
(km
)
FIGURE 9.22. Aerial survey effort in the west, central and east sub-areas of the Harrison Bay grid from 25 Aug to 11 Oct 2008.

Chapter 9: Beaufort Sea Aerial Surveys 9–29
0
250
500
750
1000
0-5
10-1
5
20-2
5
30-3
5
40-4
5
50-5
5
60-6
5
70-7
5
80-8
5
90-9
5
100-
105
110-
115
Distance from Shore (km)
Surv
ey E
ffort
(km
)
FIGURE 9.23. Aerial survey effort by 5–km distance-from-shore bins in the Harrison Bay area from 25 Aug to 11 Oct 2008.
Bowhead Whales
Sightings and Sighting rates—A total of 71 bowhead whale sightings (94 individual whales) was made during surveys of the Harrison Bay area. Of these, 40 sightings (55 individuals) were observed on–transect in acceptable sightability conditions (Table 9.11, Figure 9.24) and are used in the following analyses and discussion. Bowhead whales were observed on 67% of surveys at an overall rate of 4.4 sightings/1000 km (7.1 sightings/1000 mi). Bowhead whale sighting rates were highest in late Aug and early Sep (29 Aug– 12 Sep), with a peak rate of 14 sightings/1000 km (23 sightings/1000 mi) on 29 Aug (Figure 9.25).
Bowhead sighting rates were calculated by seismic state (Table 9.12). Overall bowhead whale sighting rates (all sub-areas) were slightly higher during non–seismic (5.0 sightings/1000 km; 8.0 sightings/1000 mi) compared to seismic periods (3.7 sightings/1000 km; 6.0 sightings/1000 mi) and post-seismic periods (4.2 sightings/1000 km; 6.8 sightings/1000 mi). This difference, however, was not statistically significant (Chi–square test, p > 0.05, Table 9.13).
Bowhead sighting rates were also compared among sub–areas within the Harrison Bay area. Most sightings were in the central sub-area, but there were no statistical differences among sighting rates in the east, west and central sub-areas (Chi–square test, p > 0.05, Table 9.14). When differences between seismic states were assessed within east, west, and central sub-areas, no statistically significant differences were observed (Chi–square test, all χ2 ≤ 3.55, p ≥ 0.06, df = 1).

9–30 Monitoring in the Chukchi and Beaufort Seas: Shell Offshore Inc, 2008
TABLE 9.11. Summary of aerial survey effort and sighting rates in the Harrison Bay area from 25 Aug through 11 Oct 2008. Numbers in parentheses should be interpreted with caution due to low effort (<500 km or 311 mi). Sighting rates were not calculated (“NC”) when effort was less than 250 km (155 mi).
Sightings Individuals Sightings/1000 km
Individuals/1000 km
25 Aug 23 717 75.6 1 1 1.4 1.428 Aug 24 17 1.8 (0) (0) NC NC29 Aug 24 795 83.8 11 17 13.8 21.430 Aug 25 3 0.4 (0) (0) NC NC31 Aug 25 75 7.9 (0) (0) NC NC5 Sep 26 466 55.9 (2) (3) (4.3) (6.4)6 Sep 27 629 75.4 6 9 9.5 14.39 Sep 28 328 39.4 (0) (0) (0.0) (0.0)10 Sep 29 383 45.9 (0) (0) (0.0) (0.0)12 Sep 30 908 108.9 7 9 7.7 9.914 Sep 32 7 0.8 (0) (0) NC NC18 Sep 33 228 27.4 (1) (1) NC NC19 Sep 51 219 26.2 (1) (1) NC NC23 Sep 36 68 8.1 (1) (2) NC NC24 Sep 52 113 16.8 (2) (3) NC NC25 Sep 53 230 34.2 (2) (2) NC NC27 Sep 53 937 139.3 2 2 2.1 2.129 Sep 54 693 103.0 1 1 1.4 1.41 Oct 55 187 27.8 (0) (0) NC NC2 Oct 56 462 68.7 (1) (1) (2.2) (2.2)6 Oct 57 421 62.6 (0) (0) (0.0) (0.0)8 Oct 58 144 21.5 (0) (0) NC NC9 Oct 58 389 57.9 (2) (3) (5.1) (7.7)10 Oct 59 325 48.3 (0) (0) (0.0) (0.0)11 Oct 60 323 48.0 (0) (0) (0.0) (0.0)
Total 21 9069 100 40 55 4.41 6.06
Bowhead Whale
Date Survey No.
Effort (km)
Percent of Survey
Grid

Chapter 9: Beaufort Sea Aerial Surveys 9–31
FIGURE 9.24. Bowhead whale (BHW), unknown mysticete whale (UMW), and whale track (WTRACK) sightings during surveys of the Harrison Bay area from 25 Aug through 11 Oct 2008. Seismic state at the time is indicated. Shell 3D deep seismic and PGS nearshore seismic survey areas are also shown.
0
5
10
15
25 A
ug27
Aug
29 A
ug31
Aug
2 S
ep4
Sep
6 S
ep8
Sep
10 S
ep12
Sep
14 S
ep16
Sep
18 S
ep20
Sep
22 S
ep24
Sep
26 S
ep28
Sep
30 S
ep2
Oct
4 O
ct6
Oct
8 O
ct10
Oct
Date
Sigh
tings
/100
0 km
Non-seismicPost-seismicSeismic
* * * * * * * * * * ** + + + + +
FIGURE 9.25. Bowhead whale sighting rates during surveys of the Harrison Bay area from 25 Aug through 11 Oct 2008. Days on which surveys were flown but zero sightings were recorded are indicated by asterisks. Sighting rates for surveys with less than 250 km (311 mi) of effort were not calculated, but are indicated with a plus-sign. Seismic state at the time of sightings is indicated by shading.

9–32 Monitoring in the Chukchi and Beaufort Seas: Shell Offshore Inc, 2008
TABLE 9.12. Bowhead whale sightings and sighting rates by seismic state during aerial surveys of the Harrison Bay area from 25 Aug through 11 Oct 2008.
Seismic Post-seismic Non-seismic Total
West Sightings 5 1 1 7Individuals 8 2 1 11Sightings/1000 km 4.4 2.2 1.1 2.8Individuals/1000 km 7.0 4.5 1.1 4.4
Central Sightings 3 3 19 25Individuals 4 3 26 33Sightings/1000 km 2.0 3.6 6.4 4.7Individuals/1000 km 2.7 3.6 8.7 6.2
East Sightings 3 3 2 8Individuals 4 4 3 11Sightings/1000 km 8.4 7.9 3.6 6.2Individuals/1000 km 11.2 10.5 5.5 8.5
All areas Sightings 11 7 22 40Individuals 16 9 30 55Sightings/1000 km 3.7 4.2 5.0 4.4Individuals/1000 km 5.4 5.4 6.8 6.1
TABLE 9.13. Chi–square comparison of bowhead whale sighting rates by seismic state during aerial surveys of the Harrison Bay area, 25 Aug through 11 Oct 2008.
Seismic Post-seismic Non-seismic Χ2 One-tailed P
Sightings (obs.) 11 7 22 0.681 0.711Sightings (exp.) 13 7 20Effort (km) 2981 1662 4426
TABLE 9.14. Chi–square comparison of bowhead whale sighting rates by area during surveys of the Harrison Bay area, 25 Aug through 11 Oct 2008.
East Central West χ2 One-tailed p
Sightings (obs.) 8 25 7 2.460 0.292Sightings (exp.) 6 23 11Effort (km) 1287 5309 2474
Abundance and Density—An average of approximately 692 (weighted average based on data in Table 9.15, s.d.=209, 95% C.I.=329–1140) bowhead whales were estimated to be present in the aerial survey area each day during the study. Survey estimates (based on surveys with sufficient effort) ranged from 187–1496 individuals with the highest numbers observed on 5 Sep. Densities ranged from 10 individuals/1000 km2 (25.9 individuals/1000 mi2) to 127 individuals/1000 km2 (329 individuals/1000

Chapter 9: Beaufort Sea Aerial Surveys 9–33
mi2). Effort was insufficient to estimate bowhead whale abundance for several surveys, although the effort and sightings from these surveys were included in the calculation of weighted average abundance.
Distance from shore and depth—Most bowhead whale sightings were recorded between 20 km (12 mi) and 65 km (40 mi) from shore, with peak sighting rates between 20 km and 35 km (12–22 mi; Figure 9.26). The distribution of whales relative to the shoreline did not differ among seismic states (Table 9.16). Most bowhead whales were sighted in water depths between 20 m (66 ft) and 35 m (115 ft; Figure 9.27). See Appendix Table M.3 for information on sighting rates within each 5–km distance from shore bin.
TABLE 9.15. Estimated numbers of bowhead whales in the Harrison Bay area, 25 Aug through 11 Oct 2008. Estimates obtained using DISTANCE software for each individual survey. Numbers in parentheses should be interpreted with caution due to low effort (<500 km or 311 mi). Estimates include allowance for f(0) (as calculated by DISTANCE) and g(0) (value of 0.144 from Thomas et al. 2002).
Survey No. Date Effort
(km) SightingsDensity
(No./1000 km2)Est. No. Whales
23 25 Aug 717 1 10.2 187 28 123424 28, 29 Aug 812 11 126.7 2319 470 11,45025 30, 31 Aug 78 (0) NC NC NC NC26 5 Sep 466 (2) (47.3) (866) (118) (6337)27 6 Sep 629 6 81.8 1496 461 486028 9 Sep 328 (0) (0.0) -- -- --29 10 Sep 383 (0) (0.0) -- -- --30 12 Sep 908 7 24.3 444 151 130432 14 Sep 7 (0) NC NC NC NC33 18 Sep 228 (1) NC NC NC NC51 19 Sep 219 (1) NC NC NC NC36 23 Sep 68 (1) NC NC NC NC52 24 Sep 113 (2) NC NC NC NC53 25, 27 Sep 1167 4 18.9 346 120 99554 29 Sep 693 1 10.6 194 29 131755 1 Oct 187 (0) NC NC NC NC56 2 Oct 462 (1) (15.9) (291) (49) (1715)57 6 Oct 421 (0) (0.0) -- -- --58 8, 9 Oct 534 2 41.3 756 80 716659 10 Oct 325 (0) (0.0) -- -- --60 11 Oct 323 (0) (0.0) -- -- --
95% C.I.

9–34 Monitoring in the Chukchi and Beaufort Seas: Shell Offshore Inc, 2008
(A) West
(B) Central
(C) East
(D) All areas
0
25
50
75
100
0-5
10-1
5
20-2
5
30-3
5
40-4
5
50-5
5
60-6
5
70-7
5
80-8
5
90-9
5
100-
105
110-
115Si
ghtin
gs/1
000
km SeismicPost-seismicNon-seismic
0
25
50
75
100
0-5
10-1
5
20-2
5
30-3
5
40-4
5
50-5
5
60-6
5
70-7
5
80-8
5
90-9
5
100-
105
110-
115Si
ghtin
gs/1
000
km
0
25
50
75
100
0-5
10-1
5
20-2
5
30-3
5
40-4
5
50-5
5
60-6
5
70-7
5
80-8
5
90-9
5
100-
105
110-
115Si
ghtin
gs/1
000
km
0255075
100
0-5
10-1
5
20-2
5
30-3
5
40-4
5
50-5
5
60-6
5
70-7
5
80-8
5
90-9
5
100-
105
110-
115
Distance From Shore (km)
Sigh
tings
/100
0 km
FIGURE 9.26. Bowhead sighting rates within 5–km distance-from-shore bins during surveys of the Harrison Bay area from 25 Aug through 11 Oct 2008 in the following sub-areas: (A) west (B) central, (C) east, (D) all sub-areas. Seismic activity at the time of sighting is indicated by line type.

Chapter 9: Beaufort Sea Aerial Surveys 9–35
TABLE 9.16. Results of statistical analysis (Kolmogorov–Smirnov test) comparing offshore distributions of bowhead sighting rates (assigned to 5–km (16–ft) distance from shore bins) during seismic and non–seismic periods in the Harrison Bay area from 25 Aug through 11 Oct 2008. The number of distance from shore bins in which survey effort was obtained (Effort) and the number in which sightings (Sightings) took place are also shown.
Effort Sightings Effort Sightings Dmax Bootstrapped P
All Sightings/1000 km by distance from shore 22 5 22 7 0.091 0.937
Two-tailed PSeismic Non-seismicArea Test of
0
5
10
15
20
25
0-5 5-10 10-15 15-20 20-25 25-30 30-35 35-40 40-45 45-50 50-55
Depth (m)
Num
ber o
f Sig
htin
gs
Non-seismicPost-seismicSeismic
FIGURE 9.27. Bowhead sighting rates by 5-m (16-ft) water depth bins in the Harrison Bay area from 25 Aug through 11 Oct 2008. Seismic state is indicated by shading.
Distribution around seismic operations—During surveys in the Harrison Bay area, bowhead
sightings were farther from the center of the seismic survey area during seismic than during non–seismic periods. This difference was statistically significant (Kruskal–Wallis test, p<0.05, Table 9.17). See Appendix Table M.4 for distance of each sighting from the center of the seismic area and time elapsed since the start of seismic operations.

9–36 Monitoring in the Chukchi and Beaufort Seas: Shell Offshore Inc, 2008
TABLE 9.17. Mean distance (km) of bowhead whale sightings from the center of the seismic survey area by seismic state in the Harrison Bay area, 25 Aug through 11 Oct 2008. Comparisons made with the Kruskal–Wallis test.
Sightings Distance from prospect center (km)n Min. Max. Mean
Seismic 11 28.9 100.3 60.1 <0.01Post-seismic 7 36.5 104.8 57.0Non-seismic 22 13.1 83.7 31.7
Two-tailed PSeismic State
Activities—Specific activities were recorded for 23 bowhead whale sightings (Figure 9.28).
Traveling was the most common activity observed, and occurred at similar frequencies regardless of seismic state. The only other activity observed during seismic periods was feeding. In contrast, non–seismic observations of activity included milling, resting, surface active behaviors and socializing.
Speed—Bowhead whales tended to move at slow (30% of sightings) or moderate speeds (70% of sightings; Figure 9.29). There did not appear to be any relationship between speed and seismic activity.
Headings—Headings were recorded for 24 sightings of bowhead whales that appeared to be traveling or swimming and mean vector headings were calculated by area and seismic state. Bowheads observed in the Harrison Bay area tended to move in a northwesterly direction, with mean headings ranging from 254ºT to 296ºT. A few outliers occurred, and these were whales heading in easterly or southerly directions in the west and central sub-areas (Figure 9.30). Headings did not appear to differ by seismic state, with the majority of whales heading in a northwesterly direction regardless of seismic state (Figure 9.31).
0
3
6
9
12
15
Feed Mill Rest SurfaceActive
Socialize Travel
Activity
Num
ber o
f Obs
erva
tions
Non-seismic
Post-seismic
Seismic
FIGURE 9.28. Observed activities of bowhead whales sighted during aerial surveys from 25 Aug through 11 Oct 2008 in the Harrison Bay area. Seismic state at the time of observation is indicated by shading.

Chapter 9: Beaufort Sea Aerial Surveys 9–37
02468
10121416
Slow Moderate Fast
Speed
Num
ber o
f Obs
erva
tions
Non-seismicPost-seismicSeismic
FIGURE 9.29. Observed speeds of bowhead whales sighted during aerial surveys in the Harrison Bay area from 25 Aug through 11 Oct 2008.
Mitigation Measures Implemented—The 2008 IHA issued by NMFS stated that mitigation was
necessary when an aggregation of 12 or more bowhead whales were observed within an area where received sound levels were ≥160 dB rms, or if four or more cow/calf pairs were observed within an area ensonified to ≥120 dB rms. Aggregations of 12 or more bowhead whales were not sighted within the ≥160 dB rms zone during surveys in the Harrison Bay area. Furthermore, no more than one cow/calf pair was observed on any survey. Cow/calf pairs were sighted in the Harrison Bay area on three occasions: 12 Sep, 23 Sep, and 9 Oct. Only one observation (9 Oct) was made during seismic activity. For all three occasions, notification of the sighting was made to the seismic vessel MMO crew via VHF radio.
Estimated Number of Bowhead Whales Present and Potentially Affected—Based on densities recorded during non-seismic periods, we estimated that 44 bowhead whales (11.3 exposures each) were potentially exposed to sound levels ≥180 dB, and 99 bowhead whales (24.1 exposures each) were potentially exposed to sound levels ≥160 dB (Table 9.18) if they showed no avoidance of seismic survey activities. Takes were also calculated for unidentified mysticete whales in the Harrison Bay area. Approximately 0.86 unidentified mysticete whales were exposed to received sound levels ≥180 dB and 1.92 whales were exposed to received sound levels ≥160 dB rms.

9–38 Monitoring in the Chukchi and Beaufort Seas: Shell Offshore Inc, 2008
(A) West (B) East
n Mean Circular s.d. n Mean Circular s.d.3 261.3° 83.9° 6 291.4° 12.8°
n Circular s.d.15 59.8°
(C) Central
Mean292.3°
0
90
180
270
0
90
180
270
0
90
180
270
FIGURE 9.30. Headings of bowhead whales in east, central and west sub-areas of the Harrison Bay area from 25 Aug through 11 Oct 2008.
(A) Seismic (C ) Non-seismic
n Mean Circular s.d. n Mean Circular s.d.7 303.2° 57.5° 12 282.4° 48.0°
(B) Post-seismic
n Circular s.d.5 58.6°
Mean293.0°
0
90
180
270
0
90
180
270
0
90
180
270
FIGURE 9.31. Headings of bowhead whales by seismic state in the Harrison Bay area from 25 Aug through 11 Oct 2008.

Chapter 9: Beaufort Sea Aerial Surveys 9–39
TABLE 9.18. Estimated number of individual bowhead whales exposed to received levels ≥180 and ≥160 dB (rms) and average number of exposures per individual during seismic survey activities by SOI in the Harrison Bay area from 25 Aug through 11 Oct 2008.
≥180dB 44 11.3≥160dB 97 24.1
Exposure level in dB re 1 uPa (rms)
Individuals Exposed
Exposures per individual
Beluga Whales Sighting rates—A total of 14 beluga sightings (77 individuals) were recorded from 25 Aug to 11 Oct in the Harrison Bay area (Table 9.19). Seven of these sighting (15 individuals) were observed on–transect in good sightability conditions and used in subsequent analyses. In general, sighting rates were relatively low (0–5.3 sightings/1000 km; 0–8.1 sightings/1000 mi) and an overall rate of only 0.77/1000 km (1.2/1000 mi), reflecting the low densities of belugas within the study area at this time (Figure 9.32). The highest number of belugas (13 individuals) was detected at the northern end of transects on 27 Sep, while no seismic activities were underway. Distance from Shore and depth—Two sightings, each of one beluga whale, were recorded at distances of 5–10 km (3–6 mi) and 25–30 km (16–19 mi) from shore, at depths of 17 m (56 mi) and 26 m (85 mi), respectively (Figure 9.33). Five sightings (13 individuals) recorded at the north end of transects were located 95–105 km (59–65 mi) from shore, at depths of 1915–2030 m (6283–6660 ft).
Activities and speed—Only one observation of beluga activity was made and it was of a resting whale. Speeds were recorded for whales that appeared to be swimming or traveling and moderate was the predominantly observed speed (75% of observations). An additional 25% of whales were swimming slowly. Estimated Number of Belugas Present and Potentially Affected—Based on densities observed during non-seismic periods, we estimated that three beluga whales (11.3 exposures each) were potentially exposed to sound levels ≥180 dB, and six belugas (24.1 exposures each) were potentially exposed to sound levels ≥160 dB (Table 9.20) if they showed no avoidance of the seismic survey activities. An additional 0.27 unidentified odontocete whales were likely exposed to sound levels ≥180 dB and 0.59 individuals to sound levels ≥160 dB. Given that most beluga and unidentified odontocete whale sightings were well north of survey activities, these are almost certainly overestimates.

9–40 Monitoring in the Chukchi and Beaufort Seas: Shell Offshore Inc, 2008
TABLE 9.19. Summary of aerial survey effort and beluga whale sighting rates in the Harrison Bay area 25 Aug through 11 Oct 2008. Values in parentheses are to be interpreted with caution, as they were calculated using less than 500 km (311 mi) of effort. Sighting rates were not calculated (“NC”) when effort was less than 250 km (155 mi).
Sightings Individuals Sightings/1000 km
Individuals/1000 km
25 Aug 23 717 75.6 0 0 0.0 0.028 Aug 24 17 1.8 (0) (0) NC NC29 Aug 24 795 83.8 0 0 0.0 0.030 Aug 25 3 0.4 (0) (0) NC NC31 Aug 25 75 7.9 (0) (0) NC NC5 Sep 26 466 55.9 (0) (0) (0.0) (0.0)6 Sep 27 629 75.4 0 0 0.0 0.09 Sep 28 328 39.4 (0) (0) (0.0) (0.0)
10 Sep 29 383 45.9 (0) (0) (0.0) (0.0)12 Sep 30 908 108.9 1 1 1.1 1.114 Sep 32 7 0.8 (0) (0) NC NC18 Sep 33 228 27.4 (0) (0) NC NC19 Sep 51 219 26.2 (0) (0) NC NC23 Sep 36 68 8.1 (0) (0) NC NC24 Sep 52 113 16.8 (1) (1) NC NC25 Sep 53 230 34.2 (0) (0) NC NC27 Sep 53 937 139.3 5 13 5.3 13.929 Sep 54 693 103.0 0 0 0.0 0.01 Oct 55 187 27.8 (0) (0) NC NC2 Oct 56 462 68.7 (0) (0) (0.0) (0.0)6 Oct 57 421 62.6 (0) (0) (0.0) (0.0)8 Oct 58 144 21.5 (0) (0) NC NC9 Oct 58 389 57.9 (0) (0) (0.0) (0.0)
10 Oct 59 325 48.3 (0) (0) (0.0) (0.0)11 Oct 60 323 48.0 (0) (0) (0.0) (0.0)
Total 21 9069 100 7 15 0.77 1.65
Beluga Whale
Date Survey No.
Effort (km)
Percent of Survey
Grid

Chapter 9: Beaufort Sea Aerial Surveys 9–41
FIGURE 9.32. Beluga whale (WW), unidentified odontocete whale (UTW), and harbor porpoise (HP) sightings during aerial surveys in the Harrison Bay area 25 Aug through 11 Oct 2008. Seismic activity at the time of observation is indicated by color.
0
100
200
300
400
500
0-5
10-1
5
20-2
5
30-3
5
40-4
5
50-5
5
60-6
5
70-7
5
80-8
5
90-9
5
100-
105
Distance from Shore (km)
Sigh
tings
/100
0 km Sightings
Individuals
FIGURE 9.33. Beluga whale sighting rates and numbers of individuals by 5–km (16–ft) distance-from-shore bins during aerial surveys in the Harrison Bay area from 25 Aug through 11 Oct 2008. Number of sightings/1000 km and number of individuals/1000 km are indicated by line type.

9–42 Monitoring in the Chukchi and Beaufort Seas: Shell Offshore Inc, 2008
TABLE 9.20. Estimated number of individual beluga whales exposed to received levels ≥180 and ≥160 dB (rms) and average number of exposures per individual during seismic survey activities by SOI in the Harrison Bay area from 25 Aug through 11 Oct 2008.
≥180dB 3 11.3≥160dB 6 24.1
Exposure level in dB re 1 uPa (rms)
Individuals Exposed
Exposures per individual
Harbor Porpoises
Two sightings of harbor porpoises (six individuals) were recorded during aerial surveys in the Harrison Bay area (Figure 9.32). The first was an individual sighted off–transect on 25 Aug. This individual was swimming vigorously approximately 72 km (28 mi) from shore. The second was an on–transect sighting on 5 Sep and included five individuals. These porpoises were swimming in a northeasterly direction (62ºT) approximately 54 km (21 mi) from shore. Both sightings were recorded during non–seismic periods. Although harbor porpoise sightings from aerial surveys in the Beaufort Sea are rare, we are confidant in these identifications, as the observer (Bill Koski) was experienced and sighting conditions were optimal. Polar bears
A total of 6 polar bears sightings (22 individuals) were recorded during aerial surveys, most of which were on barrier islands east of the Harrison Bay area (Figure 9.34). A group of 15 bears was observed on Cross Island on 12 Sep, likely in association with a whale carcass there. One bear was sighted on the mainland west of the Harrison Bay area. Polar bears were observed during both seismic and non–seismic periods. All sightings were adult or sub–adult bears, resting or walking. Polar bear responses to the survey aircraft were limited to one occasion when a bear looked up at the aircraft. Seals
A total of 56 bearded seal sightings (58 individuals), 112 ringed seal sightings (248 individuals), two spotted seal sightings (two individuals) and 201 sightings (592 individuals) of small, unidentified seals were recorded during aerial surveys (Figures 9.35 and 9.36).

Chapter 9: Beaufort Sea Aerial Surveys 9–43
FIGURE 9.34. Polar bear (PB) sightings during aerial surveys of the Harrison Bay area from 25 Aug through 11 Oct 2008. Seismic state at the time of sighting is also shown.
FIGURE 9.35. Bearded seal (BS) and unidentified pinniped (UP) sightings during aerial surveys of the Harrison Bay area from 25 Aug 2008 through 11 Oct 2008. Seismic state at the time of sighting is also shown.

9–44 Monitoring in the Chukchi and Beaufort Seas: Shell Offshore Inc, 2008
FIGURE 9.36. Ringed seal (RS), spotted seal (SS), and unidentified marine mammal (Unknown) sightings during aerial surveys in the Harrison Bay area from 25 Aug through 11 Oct 2008. Seismic state at the time of sighting is also shown.
Sep Surveys in the Camden Bay Area Survey Effort Nine surveys were flown in the Camden Bay area in Sep. Effort on these surveys ranged from 38.8 km (24.1 mi) to 868.2 km (539.5 mi; Figure 9.37) and surveys were conducted primarily during seismic survey activity (Figure 9.37). No survey effort was conducted during post–seismic periods. Detailed figures comparing effort to weather conditions and hours of seismic acquisition can be found in Appendix Figures M.5 and M.6. When assessed by survey sub-area, effort was greatest in the west (1653.8 km; 1027.6 mi) and least in the east (1075.5 km; 668.3 mi; Figure 9.38). In addition, effort by distance from shore peaked between 10 and 15 km (6 and 9 mi) from shore (Figure 9.39).

Chapter 9: Beaufort Sea Aerial Surveys 9–45
0
250
500
750
1000
13 S
ep
14 S
ep
15 S
ep
16 S
ep
17 S
ep
18 S
ep
19 S
ep
20 S
ep
21 S
ep
22 S
ep
23 S
ep
24 S
ep
25 S
ep
26 S
ep
27 S
ep
28 S
ep
Date
Effo
rt (k
m)
SeismicNon-seismic
FIGURE 9.37. Daily survey effort by seismic state in the Camden Bay area from 13 Sep to 28 Sep 2008. No survey effort was conducted during post-seismic periods.
0
500
1000
1500
2000
West Central East
Survey Area Within the Central Alaskan Beaufort Sea
Surv
ey E
ffort
(km
)
FIGURE 9.38. Aerial survey effort by sub-area in the Camden Bay area from 13 Sep to 28 Sep 2008.

9–46 Monitoring in the Chukchi and Beaufort Seas: Shell Offshore Inc, 2008
0
100
200
300
400
0-5
10-1
5
20-2
5
30-3
5
40-4
5
50-5
5
60-6
5
70-7
5
80-8
5
90-9
5
100-
105
110-
115
Distance from Shore (km)
Surv
ey E
ffort
(km
)
FIGURE 9.39. Aerial survey effort by 5–km (3 mi) distance-from-shore bins in the Camden Bay area from 13 Sep to 28 Sep 2008.
Bowhead Whales Sightings and Sighting rates—A total of 48 bowhead whale sightings (69 individual whales) was recorded during Sep surveys of the Camden Bay area. Of these sightings, 40 (58 individuals) were on transect (see Methods for definition of on–transect) during useable survey conditions and hence included in the following analyses (Figure 9.40). Bowhead whales were sighted on 78% of surveys, with an overall sighting rate of 9.9 sightings/1000 km (15.9 sightings/1000 mi; Table 9.21). Sightings by survey ranged from zero (14 and 23 Sep) to 16 (19 Sep). In general, sightings were highest in early Sep (13–20 Sep) and decreased later in the month (21–28 Sep). The majority of survey effort was conducted during periods with seismic activity and the small amount of non–seismic effort came from a single survey, so comparisons between seismic states should be interpreted cautiously. Although most sightings were observed during seismic periods, sighting rates were greater during non–seismic periods (Table 9.22). This trend was driven by high sighting rates on the only survey (with low effort; 288.2 km) that occurred during a non-seismic period (18 Sep; Figure 9.41) and, as such, a statistical test comparing sighting rates among seismic periods was considered inappropriate. When we compared east, west, and central sub-areas, significant differences in sighting rates were observed (p < 0.01; Table 9.23), with higher sighting rates in the west than in the east or central sub-areas. Abundance and Density—Bowhead abundance estimates during Sep surveys in the Camden Bay area ranged from zero (28 Sep) to 2510 (18 Sep; Table 9.24). Low survey effort precluded abundance calculations for two surveys (14 and 23 Sep). Overall, mean daily abundance in the aerial survey study area for this period was 1094 (bootstrapped mean based on data in Table 9.24, s.d.=209, 95% C.I.=321–1141), but this mean value should be interpreted with caution given the change in numbers, distribution and activity of whales during the survey period.

Chapter 9: Beaufort Sea Aerial Surveys 9–47
TABLE 9.21. Summary of aerial survey effort and bowhead whale sighting rates in the Camden Bay area from 13 Sep to 28 Sep 2008. Values in parentheses are based on less than 500 km (311 mi) of effort and should be viewed with caution. Sighting rates were not calculated (“NC”) when effort was less than 250 km (155 mi).
13 Sep 31 737.2 102 12 17 16.3 23.114 Sep 32 38.8 5 (0) (0) NC NC18 Sep 33 288.2 40 (6) (10) (20.8) (34.7)19 Sep 34 868.2 120 16 24 18.4 27.622 Sep 35 292.3 40 (2) (2) (6.8) (6.8)23 Sep 36 125.3 17 (0) (0) NC NC25 Sep 37 449.4 55 (1) (1) (2.2) (2.2)26 Sep 38 671.0 82 2 2 3.0 3.028 Sep 39 582.4 71 1 2 1.7 3.4
Total 9 4053 100 40 58 9.87 14.31
Date Survey No.
Effort (km)
Percent of Survey Area Sightings Individuals Sightings/
1000 kmIndividuals/
1000 km
FIGURE 9.40. Bowhead whale (BHW) and unknown mysticete whale (UMW) sightings during aerial surveys of the Camden Bay area from 13 Sep through 28 Sep 2008. Seismic survey areas are also shown and seismic state at the time of sighting is indicated by shading.

9–48 Monitoring in the Chukchi and Beaufort Seas: Shell Offshore Inc, 2008
0
5
10
15
20
25
13 S
ep
14 S
ep
15 S
ep
16 S
ep
17 S
ep
18 S
ep
19 S
ep
20 S
ep
21 S
ep
22 S
ep
23 S
ep
24 S
ep
25 S
ep
26 S
ep
27 S
ep
28 S
ep
Date
Sigh
tings
/100
0 km
Non-seismicSeismic
* *
FIGURE 9.41. Daily bowhead whale sighting rates by seismic state in the Camden Bay area from 13 Sep to 28 Sep. No survey effort was conducted during post-seismic periods. Days on which surveys were flown but zero sightings were recorded are indicated by asterisks.
TABLE 9.22. Bowhead whale sightings and sighting rates during aerial surveys in the Camden Bay area by seismic state and area from 13 Sep through 28 Sep 2008.
Area Seismic Non-seismic Total
West Sightings 26 1 27Individuals 36 2 38Sightings/1000 km 17.0 7.8 16.3Individuals/1000 km 23.6 15.7 23.0
Central Sightings 3 5 8Individuals 6 8 14Sightings/1000 km 2.4 57.2 6.0Individuals/1000 km 4.9 91.5 10.6
East Sightings 5 0 5Individuals 6 0 6Sightings/1000 km 5.0 -- 4.6Individuals/1000 km 6.0 -- 5.6
All areas Sightings 34 6 40Individuals 48 10 58Sightings/1000 km 9.0 20.8 9.9Individuals/1000 km 12.8 34.7 14.3
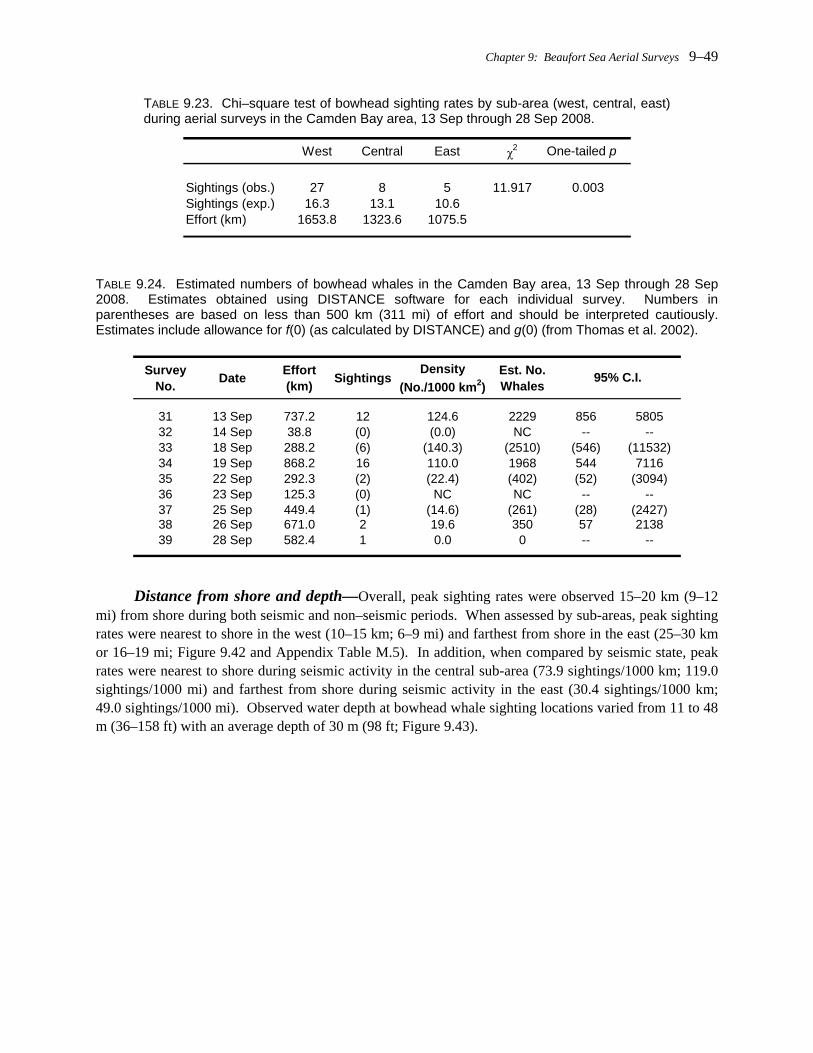
Chapter 9: Beaufort Sea Aerial Surveys 9–49
TABLE 9.23. Chi–square test of bowhead sighting rates by sub-area (west, central, east) during aerial surveys in the Camden Bay area, 13 Sep through 28 Sep 2008.
West Central East χ2 One-tailed p
Sightings (obs.) 27 8 5 11.917 0.003Sightings (exp.) 16.3 13.1 10.6Effort (km) 1653.8 1323.6 1075.5
TABLE 9.24. Estimated numbers of bowhead whales in the Camden Bay area, 13 Sep through 28 Sep 2008. Estimates obtained using DISTANCE software for each individual survey. Numbers in parentheses are based on less than 500 km (311 mi) of effort and should be interpreted cautiously. Estimates include allowance for f(0) (as calculated by DISTANCE) and g(0) (from Thomas et al. 2002).
Survey No. Date Effort
(km) SightingsDensity
(No./1000 km2)Est. No. Whales
31 13 Sep 737.2 12 124.6 2229 856 580532 14 Sep 38.8 (0) (0.0) NC -- --33 18 Sep 288.2 (6) (140.3) (2510) (546) (11532)34 19 Sep 868.2 16 110.0 1968 544 711635 22 Sep 292.3 (2) (22.4) (402) (52) (3094)36 23 Sep 125.3 (0) NC NC -- --37 25 Sep 449.4 (1) (14.6) (261) (28) (2427)38 26 Sep 671.0 2 19.6 350 57 213839 28 Sep 582.4 1 0.0 0 -- --
95% C.I.
Distance from shore and depth—Overall, peak sighting rates were observed 15–20 km (9–12 mi) from shore during both seismic and non–seismic periods. When assessed by sub-areas, peak sighting rates were nearest to shore in the west (10–15 km; 6–9 mi) and farthest from shore in the east (25–30 km or 16–19 mi; Figure 9.42 and Appendix Table M.5). In addition, when compared by seismic state, peak rates were nearest to shore during seismic activity in the central sub-area (73.9 sightings/1000 km; 119.0 sightings/1000 mi) and farthest from shore during seismic activity in the east (30.4 sightings/1000 km; 49.0 sightings/1000 mi). Observed water depth at bowhead whale sighting locations varied from 11 to 48 m (36–158 ft) with an average depth of 30 m (98 ft; Figure 9.43).

9–50 Monitoring in the Chukchi and Beaufort Seas: Shell Offshore Inc, 2008
(A) West
(B) Central
(C) East
(D) All sub-areas
0
100
200
300
0-5
10-1
5
20-2
5
30-3
5
40-4
5
50-5
5
60-6
5
70-7
5
80-8
5
90-9
5
100-
105
110-
115Si
ghtin
gs/1
000
km SeismicPost seismicNon-seismic
0
100
200
300
0-5
10-1
5
20-2
5
30-3
5
40-4
5
50-5
5
60-6
5
70-7
5
80-8
5
90-9
5
100-
105
110-
115Si
ghtin
gs/1
000
km
0
100
200
300
0-5
10-1
5
20-2
5
30-3
5
40-4
5
50-5
5
60-6
5
70-7
5
80-8
5
90-9
5
100-
105
110-
115Si
ghtin
gs/1
000
km
0
100
200
300
0-5
10-1
5
20-2
5
30-3
5
40-4
5
50-5
5
60-6
5
70-7
5
80-8
5
90-9
5
100-
105
110-
115
Distance From Shore (km)
Sigh
tings
/100
0 km
FIGURE 9.42. Bowhead sighting rates within 5–km (16–ft) distance from shore bins during aerial surveys in the Camden Bay area from 13 Sep through 28 Sep 2008, (A) west, (B) central, (C) east, (D) all sub-areas.

Chapter 9: Beaufort Sea Aerial Surveys 9–51
0123456789
0-5 5-10 10-15 15-20 20-25 25-30 30-35 35-40 40-45 45-50 50-55
Depth (m)
Num
ber o
f Sig
htin
gsNon-seismicPost-seismicSeismic
FIGURE 9.43. Number of bowhead sightings during aerial surveys of the central Beaufort Sea in the Camden Bay area by 5-m (16-ft) depth bins and seismic state. Data were collected from 13 Sep through 28 Sep 2008.
Distribution around seismic operations—Average distance of whales from the center of the seismic survey area was compared by seismic state. In general, whales sighted during non–seismic periods were closer to the center of the seismic survey area (18.8 km; 11.7 mi) than those observed during seismic periods (24.3 km; 15.1 mi; Table 9.25); however, effort during non-seismic periods (one survey only) was concentrated closer to the shoreline due to adverse weather, making comparisons difficult. Details on bowhead sightings made during seismic periods are presented in Appendix Table M.6.
Activities—Activity was recorded for 13 sightings of bowhead whales during Sep surveys in the Camden Bay area (Figure 9.44). Feeding was the most commonly observed activity (77% of observations), followed by resting (15%), and traveling (8%).
Speed—Speeds were recorded for whales observed to be swimming or traveling (Figure 9.45). 58% of these whales were swimming at slow speeds and 42% were swimming at moderate speeds.
Headings—Headings were recorded for 14 whales that appeared to be traveling or swimming. Mean vector headings were calculated by area and seismic state (Figure 9.46, 9.47). In all subgroups with more than one observation, mean vector headings were to the west. Small sample sizes prevented statistical comparisons between seismic states or among sub-areas.

9–52 Monitoring in the Chukchi and Beaufort Seas: Shell Offshore Inc, 2008
TABLE 9.25. Minimum, maximum and mean distance (km) of bowhead whale sightings from the center of the seismic prospect by seismic state in the Camden Bay area, 13 Sep through 28 Sep 2008 as compared with the Kruskal-Wallis test.
Sightingsn Min. Max. Mean
Seismic 34 24.3 47.1 102.1 <0.01Non-seismic 6 18.8 28.2 68.0
Two-tailed pSeismic StateDistance from prospect center (km)
0
2
4
6
8
10
12
Feed Mill Rest SurfaceActive
Socialize Travel
Activity
Num
ber o
f Obs
erva
tions Non-seismic
Post-seismic
Seismic
FIGURE 9.44. Observed activities of bowhead whales sighted during aerial surveys from 13 Sep through 28 Sep 2008 in the Camden Bay area. Seismic state at the time of sighting is indicated by color.
012345678
Slow Moderate Fast
Speed
Num
ber o
f Obs
erva
tions Non-seismic
Post-seismicSeismic
FIGURE 9.45. Observed speeds of traveling or swimming bowhead whales sighted in the Camden Bay area from 13 Sep through 28 Sep 2008. Seismic state at the time of sighting is indicated by color.

Chapter 9: Beaufort Sea Aerial Surveys 9–53
(A) West (B) East
n Mean Circular s.d.2 280.0° --
n Mean Circular s.d.11 285.0° 24.7°
n Circular s.d.1 --
(C) Central
Mean120.0°
0
90
180
270
0
90
180
270
0
90
180
270
FIGURE 9.46. Headings of traveling or swimming bowhead whales by sub-areas in Camden Bay area from 13 Sep through 28 Sep 2008.
(A) Seismic (B) Non-seismic
n Mean Circular s.d. n Mean Circular s.d.13 284.2° 22.7° 1 120.0° --
g0
90
180
270
0
90
180
270
FIGURE 9.47. Headings of traveling or swimming bowhead whales by seismic state in Camden Bay area from 13 Sep through 28 Sep 2008.

9–54 Monitoring in the Chukchi and Beaufort Seas: Shell Offshore Inc, 2008
Mitigation Measures Implemented— Survey lines were designed to cover the entire ≥120 dB radius around the seismic source vessel, and therefore all cow/calf pairs sighted were considered within this radius. As a result, any time a cow/calf pair was sighted, aerial surveyors relayed the sighting location to the lead MMO on the source vessel. Cow/calf pairs were sighted (and their locations subsequently reported to the source vessel) on four occasions during Sep surveys in the Camden Bay area: two sightings on 13 Sep, one on 18 Sep, and one on 19 Sep. In addition, surveys conducted by NMFS on 18 Sep detected a large number of cow/calf pairs near Flaxman Island (Pete Sloane, personal communication), just outside of the 160 dB radius where mitigation would have been necessary. Although not required by the IHA, SOI decided to move their operations 5-6 km north at that time to avoid potential disturbance to the whales that might cause them to abandon the feeding area. Mitigation was also required if aggregations of 12 or more whales were sighted within the 160 dB radius of the seismic source vessel. Aggregations of this size were not observed within the 160 dB radius.
Estimated Number of Bowhead Whales Present and Potentially Affected—We estimated that 58 and 215 individual bowhead whales would have been potentially exposed to ≥180 dB and ≥160 dB, respectively (Table 9.26) if they did not show avoidance of the seismic survey activities. These individuals were estimated to have been exposed 10.9 times to sound levels ≥180 dB and 29.6 times to sound levels ≥160 dB if they had remained in one location near the survey area. No unidentified mysticete whales were sighted during this period. Beluga Whales and Harbor Porpoises
During Sep surveys in the Camden Bay area, one off–transect beluga whale sighting and one on–transect harbor porpoise sighting were made (Figure 9.48). Three adult belugas were sighted on 18 Sep approximately 4.5 km (2.8 mi) from shore during a non–seismic period and appeared to be resting. The single adult harbor porpoise was sighted on 19 Sep from an altitude of approximately 305 m (1000 ft) and appeared to be resting. It was observed during seismic activity, but was approximately 10.4 km (6.5 mi) from the center of the seismic survey area. The harbor porpoise was identified to species by an experienced observer (Bill Koski) during optimal sighting conditions.
TABLE 9.26. Estimated number of individual bowhead whales exposed to received levels ≥180 and 160 dB (rms) and average number of exposures per individual during seismic survey activities by SOI in the Camden Bay area from 13 Sep through 28 Sep 2008.
≥180dB 58 10.9≥160dB 215 29.6
Exposure level in dB re 1 uPa (rms)
Individuals Exposed
Exposures per individual

Chapter 9: Beaufort Sea Aerial Surveys 9–55
FIGURE 9.48. Beluga whale (WW) and Harbor porpoise (HP) sightings during aerial surveys in the Camden Bay area from 13 Sep through 28 Sep 2008. Seismic state at the time of sighting is also shown.
Pacific Walruses and Polar Bears Two pacific walrus sightings were made during Sep surveys of the Camden Bay area (Figure 9.49). The sightings were made on 19 and 23 Sep and each consisted of one adult walrus observed during seismic activity. The first walrus was sighted in the central sub-area at a distance of 14.0 km (8.7 mi) from the center of the seismic survey area. The second was sighted in the west sub-area at a distance of 103.3 km (64.0 mi) from the center of the seismic survey area. Three polar bear sightings (24 individuals) were made, all of which were on barrier islands during seismic periods. Two large groups (17 and 6 individuals) were observed on Cross Island on 22 and 26 Sep, respectively, and these bears were likely attracted to a whale carcass on the island. In addition, one individual was observed on a barrier island in the Camden Bay area on 23 Sep. The bears did not appear to react to the presence of the aircraft. Seals
A total of 27 bearded seal sightings (29 individuals), 131 ringed seal sightings (294 individuals), and 170 sightings (385 individuals) of small, unidentified seals, was recorded during Sep surveys of the Camden Bay area (Figures 9.50 and 9.51). Because the ability of an MMO to observe seals at 305 m (1000 ft) is highly weather–dependent, data were not analyzed in detail and estimates of density were not made.

9–56 Monitoring in the Chukchi and Beaufort Seas: Shell Offshore Inc, 2008
FIGURE 9.49. Polar bear (PB) and Pacific walrus (PWA) sightings during aerial surveys in the Camden Bay area from 13 Sep through 28 Sep 2008. Seismic state at the time of sighting is also shown.
FIGURE 9.50. Bearded seal (BS) and unidentified pinniped (UP) sightings during aerial surveys in the Camden Bay area from 13 Sep through 28 Sep 2008.

Chapter 9: Beaufort Sea Aerial Surveys 9–57
FIGURE 9.51. Ringed seal (RS) and unknown seal (US) sightings during aerial surveys in the Camden Bay area from 13 Sep through 28 Sep 2008.
Discussion
Patterns of bowhead whale distribution, activity and headings in the Harrison Bay and Camden Bay survey areas were similar to those seen during the fall-migration period during many previous studies (e.g., Wursig et al. 2002, Miller et al. 2002). Bowhead whales tended to be less than 50 km (31 mi) from shore, mostly in waters 20–35 m (66-115 ft) deep and were observed to be traveling or feeding while moving westward. Peak sighting rates occurred in mid-Sep (13–19 Sep) within the Camden Bay area and a few days later (23–25 Sep) in the Harrison Bay area. In contrast, sightings made during Jul–Aug surveys of the Camden Bay area indicated that whales were further offshore (60–65 km; 37–40 mi) in waters around 66 m (217 ft) deep. Whales observed in Jul–early Aug were traveling at a moderate pace to the east and in late Aug (in the Harrison Bay area) whales were observed to be migrating to the west. These patterns reflect well–documented differences in seasonal use of the Alaskan Beaufort Sea by bowhead whales (Miller et al. 1999, 2002; Würsig et al. 2002).
Typically, bowhead whales migrate eastward through the Alaskan Beaufort Sea in the spring to reach feeding grounds in the Canadian Beaufort (Braham et al. 1984; Moore and Clarke 1989; Moore and Reeves 1993). Abundances in the Alaskan Beaufort Sea in summer tend to be low and behaviors at this time consist mainly of slow or moderate eastward travel (Moore and Reeves 1993). In late summer and fall, however, bowheads commence a westward migration, moving from Canadian feeding grounds to wintering areas off the Siberian coast (Bogoslovskaya et al. 1982). On occasion, whales linger in Alaskan waters to feed, resulting in higher sighting rates at this time (Würsig et al. 2002). Peak sighting rates tend to occur in mid–Sep and decline through Oct (Miller et al. 2002).
Differences in bowhead sighting rates by seismic activity were difficult to assess, because survey effort was low in several seismic state categories (e.g. post-seismic and non-seismic periods in Sep

9–58 Monitoring in the Chukchi and Beaufort Seas: Shell Offshore Inc, 2008
surveys of the Camden Bay area). With the limited data available, seismic activity did not appear to affect bowhead whale sighting rates in Jul–Aug surveys of the Camden Bay area or surveys of the Harrison Bay area. During Sep surveys of the Camden Bay area, sighting rates were highest during non-seismic periods, however, effort during non-seismic periods was extremely low (a single survey day) thus making meaningful comparisons among seismic states impossible. In Sep, sighting rates were significantly higher in the west sub-area than in central and east sub-areas of the Camden Bay area, suggesting the absence of northward deflection in response to seismic activities. On the other hand, whales tended to be closer to the center of the seismic survey area during non–seismic periods compared with seismic periods in both the Harrison Bay and Camden Bay areas, indicating that seismic activities may have resulted in localized displacement of whales away from the center of the seismic survey area. This result, however, should be interpreted with caution due to low sample size, particularly during non-seismic periods.
Overall trends in beluga activity, speed, distance from shore, and sighting rates were consistent with previous studies (Miller et al. 2002; Würsig et al. 2002). Beluga sighting rates were highest in early Jul and late Sep and the majority of migrating belugas appeared to pass north of our survey area, with peak sighting rates near the shelf break along the northern boundary of our survey area. Beluga activities consisted primarily of traveling at slow to moderate speeds or resting. These data are consistent with prior research indicating that belugas spend the majority of their time in the Beaufort Sea along the shelf break or far offshore during spring and fall migrations (Treacy 1994; Richard et al. 1997, 1998b).
Literature Cited Blank, S., C. Seiter, P. Bruce. 2000. Resampling Stats Add-in for Excel. Resampling Stats Inc., Arlington, Virginia.
http://www.resample.com/ Bogoslovskaya, L.S., L.M. Votrogov, and I.I. Krupnik. 1982. The bowhead whale off Chukotka: migrations and
aboriginal whaling. Rep. Int. Whal. Comm. 32: 391–400. Braham, H.W., B.D. Krogman and G.M. Carroll. 1984. Bowhead and white whale migration, distribution, and
abundance in the Bering, Chukchi, and Beaufort Seas, 1975–78. NOAA Tech. Rep. NMFS SSRF–778. Nat. Oceanic & Atmos. Admin., Nat. Mar. Fish. Serv. 39 p. NTIS PB84-157908.
Burnham, K.P. and D.R. Anderson 1998. Model Selection and Inference: A Practical Information–Theoretic Approach. Springer–Verlag, New York. 353 p.
Beyer, H.L. 2004. Hawth's Analysis Tools for ArcGIS. Available at http://www.spatialecology.com/htools. Davis, R.A., W.R. Koski, W.J. Richardson, C.R. Evans, and W.G. Alliston. 1982. Distribution, numbers and
productivity of the Western Arctic stock of bowhead whales in the eastern Beaufort Sea and Amundsen Gulf, summer 1981. Rep. from LGL Ltd., Toronto, Ont., for Sohio Alaska Petrol. Co. [now BP Alaska], Anchorage, AK and Dome Petrol. Ltd., Calgary, Alb. (co–managers). 134 p.
ESRI 2008. ArcView Version 9.3. Earth Science Research Institute. Redlands, CA, USA. Hauser, D.D.W., V.D. Moulton, K. Christie, C. Lyons, G. Warner, C. O’Neill, D. Hannay, and S. Inglis. 2008.
Marine mammal and acoustic monitoring of the Eni/PGS open-water seismic program near Thetis, Spy and Leavitt islands, Alaskan Beaufort Sea, 2008: 90-day report. LGL Rep. P1065–1. Rep. from LGL Alaska Research Associates Inc. and JASCO Research Ltd., for Eni US Operating Co. Inc., PGS Onshore, Inc., Nat. Mar. Fish. Serv., and U.S. Fish & Wildlife Serv. 180 p.
Koski, W.R. and S.R. Johnson. 1987. Behavioral studies and aerial photogrammetry. Chapter 4, 124 p. In: LGL and Greenridge, Responses of bowhead whales to an offshore drilling operation in the Alaskan Beaufort Sea, autumn 1986. Rep. from LGL Ltd., King City, Ont., and Greenridge Sciences Inc., Santa Barbara, CA, for Shell Western E & P Inc., Anchorage, AK. 371 p.

Chapter 9: Beaufort Sea Aerial Surveys 9–59
KCS. 2008. Oriana Version 2.0. Kovach Computing Services. Anglesey, Wales. Ljungblad, D.K., S.E. Moore and D.R. Van Schoik. 1986. Seasonal Patterns of distribution, abundance, migration
and behavior of the western Arctic stock of bowhead whales, Balaena mysticetus in Alaskan seas. Rep. Int. whal. Com. Special Issue 8: 177–205.
Ljunblad, D.K., B. Würsig, S.L. Swartz and J.M. Keene. 1988. Observations on the behavioural responses of bowhead whales (Balaena mysticetus) to active geophysical vessels in the Alaskan Beaufort Sea. Arctic 41(3):183–194.
Lyons, C., W. Koski and D. Ireland. 2008. Beaufort Sea aerial marine mammal monitoring program. Chapter 7, 39 p. In: D.W. Funk, R. Rodrigues, D.S. Ireland, and W.R. Koski (eds.). Joint Monitoring Program in the Chukchi and Beaufort seas, July–November 2006. LGL Alaska Report P891–2, Report from LGL Alaska Research Associates, Inc., LGL Ltd., Greeneridge Sciences, Inc., Bioacoustics Research Program, Cornell University, and Bio–Wave Inc. for Shell Offshore, Inc., ConocoPhillips Alaska, Inc., and GX Technology, and National Marine Fisheries Service, U.S. Fish and Wildlife Service. 316 p. plus Appendices.
Martin, A.R., and T.G. Smith. 1992. Deep diving in wild, free–ranging beluga whales, Delphinapteras leucas. Can. J. Fish. Aquat. Sci. 49: 462–466.
Miller, G.W., R.E. Elliott, W.R. Koski, V.D. Moulton and W.J. Richardson. 1999. Whales. Chapter 5, 109 p. In: W.J. Richardson (ed.), Marine mammal and acoustical monitoring of Western Geophysical’s open–water seismic program in the Alaskan Beaufort Sea, 1998. LGL Rep. TA2230–3. Rep. from LGL Ltd., King City, Ont., and Greeneridge Sciences Inc., Santa Barbara, CA, for Western Geophysical, Houstan, TX and U.S. Nat. Mar. Fish. Serv., Anchorage, AK, and Silver Spring, MD. 390 p.
Miller, G.W. T.A. Thomas, V.D. Moulton and W.R. Koski. 2002. Distribution and numbers of bowhead whales in the eastern Alaskan Beaufort Sea during the late summer and autumn, 1979–2000. In: W.J. Richardson and D.H. Thomson (eds.). Bowhead whale feeding in the eastern Alaskan Beaufort Sea: Update of Scientific and Traditional Information. OCS Study MMS 2002–012. Rep. from LGL Ltd., King City, Ontario, for US Minerals Management Service, Anchorage, Alaska and Herndon Virginia, USA. xliv+420 p. NTIS PB2004–101568.
Moore, S.E. and J.T. Clarke. 1989. Bowhead whale (Balaena mysticetus) spatial and temporal distribution in the central Beaufort Sea during late summer and early fall, 1979–86. Rep. Int. Whal. Comm. 39:283–290.
Moore, S.E. and R.R. Reeves. 1993. Distribution and movement. p. 313–386 In: J.J. Burns, J.J. Montague and C.J. Cowles (eds.), The Bowhead Whale. Spec. Publ. 2. Soc. Mar. Mammal., Lawrence, KS. 787 p.
R Development Core Team. 2008. R: A Language and Environment for Statistical Computing. R Foundation for Statistical Computing. Vienna, Austria. http://www.R–project.org.
Richard, P.R., A. R. Martin, and J.R. Orr. 1997. Study of summer and fall movements and dive behavior of Beaufort Sea belugas, using satellite telemetry: 1992–1995. Environmental Studies Research Funds Report No. 134. 26p. Available from Fisheries and Oceans, Resource Management Division, Freshwater Institute, MB.
Richard, P.R., A. R. Martin, and J.R. Orr. 1998b. Study of late summer and fall movements and dive behavior of Beaufort Sea belugas, using satellite telemetry: 1997. Final Report Minerals Management Service OCS Study 98–0016. 25p. Available from Fisheries and Oceans, Resource Management Division, Freshwater Institute, MB.
Richardson, W.J., B. Würsig and C.R. Green Jr. 1986. Reactions of bowhead whales, Balaena mysticetus, to seismic exploration in the Canadian Beaufort Sea. J. Acoust. Soc. Am. 79(4):1117–1128.
Richardson, W.J. and C.I. Malme. 1993. Man–made noise and behavioral responses. P. 631–700. In: J.J. Burns, J.J. Montague, C.J. Cowles (eds.). The bowhead whale. Spec. Pub. 2. Soc. Mar. Mammal., Lawrence, KS. 787 p.
Richardson, W.J., C.R. Greene Jr., J.S. Hanna, W.R. Koski, G.W. Miller, N.J. Patenaude and M.A. Smultea with R. Blaylock, R. Elliott and B. Würsig. 1995b. Acoustic effects of oil production activities on bowhead and white whales visible during spring migration near Pt. Barrow, Alaska–1991 and 1994 phases. OCS Study MMS

9–60 Monitoring in the Chukchi and Beaufort Seas: Shell Offshore Inc, 2008
95–0051; LGL Rep. TA954. Rep. from LGL Ltd., King City, Ont., for U.S. Minerals Manage. Serv., Herndon, VA. 539 p. NTIS PB98–107667.
Richardson, W.J. and B. Würsig. 1997. Influences of man—made noise and other human actions on cetacean behavior. Mar. Freshwat. Behav. Physiol. 29(1–4):183–209.
Richardson, W.J. (ed.). 1999. Marine mammal and acoustical monitoring of Western Geophysical’s open–water seismic program in the Alaskan Beaufort Sea, 1998. LGL Report TA–2230–2. King City, Ont., Canada: LGL Ltd., Environmental Research Associates, 390 p.
Richardson, W.J., G.W. Miller and C.R. Greene, Jr. 1999. Displacement of migrating bowhead whales by sounds from seismic surveys in shallow waters of the Beaufort Sea. J. Acoust. Soc. Am. 106(4, Pt. 2):2281.
Thomas, T.A., W.R. Koski and W.J. Richardson. 2002. Correction factors to calculate bowhead whale numbers form aerial surveys of the Beaufort Sea. Chapter 15, 28 p. In: W.J. Richardson and D.H. Thomson (eds.). Bowhead whale feeding in the eastern Alaskan Beaufort Sea: Update of Scientific and Traditional Information. OCS Study MMS 2002–012. Rep. from LGL Ltd., King City, Ontario, for US Minerals Management Service, Anchorage, Alaska and Herndon Virginia, USA. xliv+420 p. NTIS PB2004–101568.
Thomas, T.A., W.R. Koski and T. Elliot. 2008. Beaufort Sea aerial surveys in support of shallow hazard surveys. Chapter 8, 18p. In: Funk, D. W., R. Rodrigues, D. S. Ireland, and W. R. Koski (eds.). Joint Monitoring Program in the Chukchi and Beaufort seas, July–November 2006. LGL Alaska Report P891–2, Report from LGL Alaska Research Associates, Inc., LGL Ltd., Greeneridge Sciences, Inc., Bioacoustics Research Program, Cornell University, and Bio–Wave Inc. for Shell Offshore, Inc., ConocoPhillips Alaska, Inc., and GX Technology, and National Marine Fisheries Service, U.S. Fish and Wildlife Service. 316 p. plus Appendices.
Thomas, L., J.L. Laake, S. Strindberg, F.F.C. Marques, S.T. Buckland, D.L. Borchers, D.R. Anderson, K.P. Burnham, S.L. Hedley, J.H. Pollard, J.R.B. Bishop, and T.A. Marques. 2006. Distance 5.0. Release 2. Research Unit for Wildlife Population Assessment, University of St. Andrews, UK. http://www.ruwpa.st–and.ac.uk/distance/
Treacy, S.D.1994. Aerial surveys for endangered whales in the Beaufort Sea, fall 1993. OCS Study, MMS 94–0032. U.S. Department of the Interior, Minerals Management Service, Alaska OCS Region. Available from Minerals Management Serv., Anchorage, AK.
Würsig, B., W.R. Koski, T.A. Thomas and W.J. Richardson. 2002. Activities and behaviors of bowhead whales in the eastern Alaskan Beaufort Sea during late summer and autumn. Chapter 12, 38 p. In: W. J. Richardson and D.H. Thomas (eds.), Bowhead whale feeding in the eastern Alaskan Beaufort Sea: update of scientific and traditional information, vol. 1. OCS Study MMS 2002–012; LGL Rep. TA2196–7. Rep. from LGL Ltd., King City, Ont., for U.S. Minerals Manage. Serv., Anchorage, AK and Herndon, VA.Vol.1, xliv + 420 p; Vol. 2, 277 p.

