shell cove boatharbourr.b5z.net/i/u/10059336/f/monthly_monitoring_summary...oil and grease, ph,...
TRANSCRIPT

SHELL COVE BOATHARBOUR STAGE 2 AND BREAKWATERS MONTHLY MONITORING SUMMARY October, 2017 COASTWIDE CIVIL PTY LTD ADDRESS: 19 CROOME LANE, ALBION PARK, 2527 POSTAL: P.O.BOX 116, KIAMA, 2533 E-MAIL: [email protected] ABN: 71 073 648 594 TELEPHONE: (02) 4256 1499 FAX: (02) 4256 5243 MOBILE: 0418 229 702 A.H.: (02) 4232 2173
Coastwide Civil Shell Cove Boat Harbour, Stage 2 and Breakwaters
Monthly Environmental Monitoring Report October, 2017
2 | P a g e
Contents 1. Preliminaries ................................................................................................................................................ 3
1.1. Background .......................................................................................................................................... 3
1.2. Introduction ......................................................................................................................................... 3
2. Monitoring Requirements ........................................................................................................................... 4
2.1. Water Quality ...................................................................................................................................... 4
2.2. Noise .................................................................................................................................................... 7
2.3. Air Quality ............................................................................................................................................ 8
2.4. Vibration .............................................................................................................................................. 8
2.5. Blasting ................................................................................................................................................ 9
2.6. Acid Sulphate Soils ............................................................................................................................... 9
3. Water Quality ............................................................................................................................................ 10
3.1. Near Shore Monitoring – Monitoring Points 8, 9, 12 and 20 ............................................................ 10
3.2. Surface Water: Inbound flow– Monitoring Points 10, 11, 14, 21 and Outbound Flow – Monitoring Points 12 and 20 ............................................................................................................................................ 12
3.3. Storage Pond – Monitoring Point 7 ................................................................................................... 16
4. Air, Noise and Vibration Testing ................................................................................................................ 18
4.1. Noise Testing ..................................................................................................................................... 18
4.2. Air Quality .......................................................................................................................................... 20
4.3. Vibration ............................................................................................................................................ 20
4.4. Blasting .............................................................................................................................................. 20
5. Acid Sulphate Soils ..................................................................................................................................... 21
5.1. Odour Monitoring .............................................................................................................................. 21
Appendix A – Site Map Appendix B – Lab Testing Results Appendix C – Rainfall Monitoring Results
Coastwide Civil Shell Cove Boat Harbour, Stage 2 and Breakwaters
Monthly Environmental Monitoring Report October, 2017
3 | P a g e
1. Preliminaries 1.1. Background
This project involves the construction of a boat harbour consisting of inner and outer harbour basins located behind an existing beach dune system in what is currently a degraded swamp, and an access channel across the beach. Included in the boat harbour project are:
• inner and outer harbour basins; • boardwalk/promenade surrounding the inner and outer harbours; • regional boat launching ramp located in the outer harbour; • 470m long rock breakwater on the northern side of the access channel; • 282m long rock groyne on the southern side of the access channel; • dune construction and beach nourishment; • land platform works for hotel, shopping centre, residential development, marina support facilities
and dry boat storage surrounding the boat harbour; • a staged 300 berth floating marina in the inner harbour; • vessel fuelling facilities and sewage pump out facilities in the outer harbour; and • a boat lift and hardstand area for vessel maintenance.
The works are to be conducted over multiple stages. Coastwide Civil have won the contract to conduct Stage 2 works. In addition, Coastwide Civil have also won the contract to construct the breakwaters for the boatharbour. The environmental management plan and practices in place for the Stage 2 project have broadened to also cover the breakwater works. The main components of Stage 2 works are:
Excavation of the remainder of the Boatharbour which was not excavated in Stage 1
Surcharging (and removal) of the P2B Surcharge Area and any incomplete portions of the P3 Surcharge Area
Removal of the surcharge material from Surcharge P1A, P1B and P2A
Construct edge treatment for the Boatharbour
Install boardwalk piles
Construct boat ramp in the Outer Harbour The main components of the Breakwater works are:
the construction of a 470m long breakwater north of the channel
280m groyne (smaller breakwater) south of the channel
full excavation of the entrance channel
Installation of navigation aids (navigation lights and buoys)
Construction of permanent access roads along the breakwater and groyne
1.2. Introduction
This document provides a summary of monthly environmental performance on site. It includes the following:
Section 2 outlines monitoring requirements as per the conditions of the Environmental Protection Licence (EPL), the Site Environmental Management Plan (SEMP) and the Construction Environmental Management Plan (CEMP);
Sections 3 to 5 detail the results of environmental monitoring undertaken on site; and
Results of any lab testing are included as Appendix B. A copy of rainfall monitoring results for the month is attached as Appendix C.
Coastwide Civil Shell Cove Boat Harbour, Stage 2 and Breakwaters
Monthly Environmental Monitoring Report October, 2017
4 | P a g e
2. Monitoring Requirements In this month, an additional monitoring point, MP24, was added to the EPL. The new requirements are included in this section, and elaborated upon in Section 3.3. 2.1. Water Quality
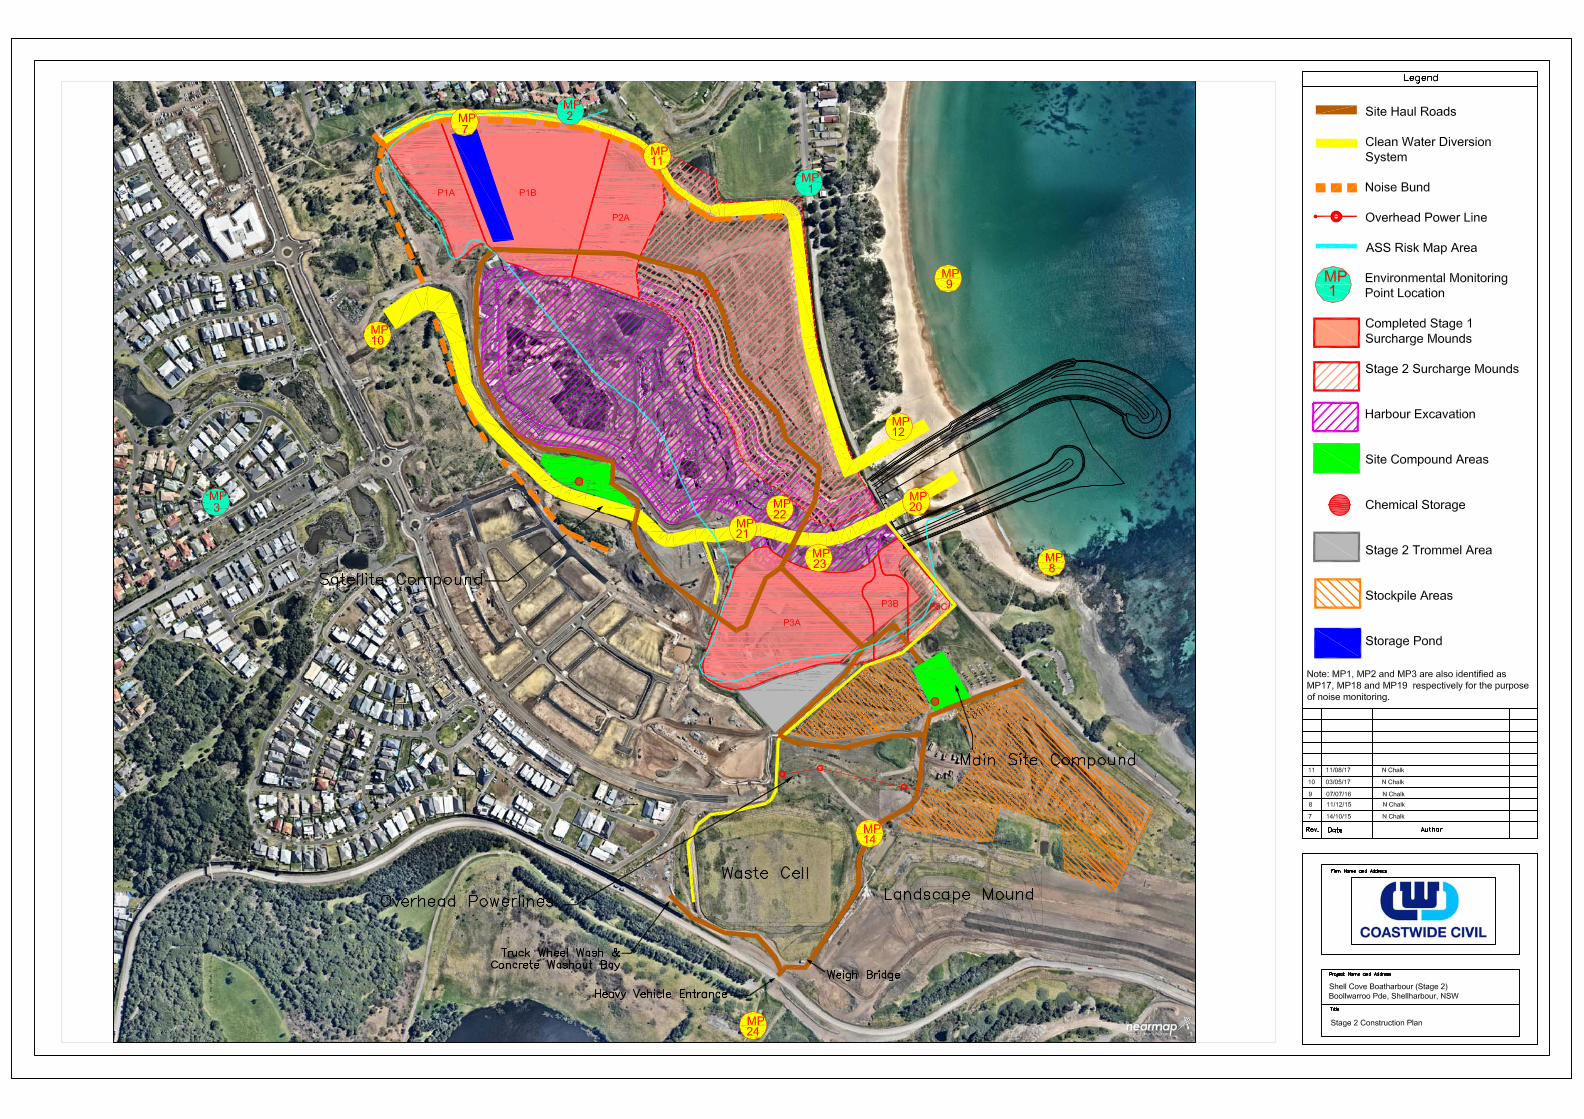
Water Quality Inbound and Outbound Channels Monitoring Locations – See Appendix A - Site Map for location of monitoring points As nominated in EPL 12426, Section 2, P1.3
Station no. Location Testing Required
10 Upstream Location – Runoff into site from West
Oil and Grease, pH, Total Suspended Solids, Turbidity and Colour
11 Upstream Location– Runoff into site from North
Oil and Grease, pH, Total Suspended Solids, Turbidity and Colour
12 Shellharbour Swamp – Discharge into near shore zone
Oil and Grease, pH, Total Suspended Solids, Turbidity and Colour
14 Upstream Location – Runoff into site from South
Oil and Grease, pH, Total Suspended Solids, Turbidity and Colour
20 Beach Zone Rectangular Pond – Discharge into near shore zone
Oil and Grease, pH, Total Suspended Solids, Turbidity and Colour
21 Southern Channel – Downstream of Precinct B1 and C1
Oil and Grease, pH, Total Suspended Solids, Turbidity and Colour
Monitoring Requirements As nominated in EPL 12426, Section 5, M2. No limit values for monitoring of inflows and outflows are specified in the EPL.
Station no. Testing Requirement Compliance Criteria Frequency
10,11,12,14, 20,21
Oil and Grease Not specified in EPL
Special Frequency 2 – daily if turbidity >5NTU at MP8,9,12, otherwise weekly
pH Not specified in EPL
Total Suspended solids
Not specified in EPL
Turbidity Not specified in EPL
Coastwide Civil Shell Cove Boat Harbour, Stage 2 and Breakwaters
Monthly Environmental Monitoring Report October, 2017
5 | P a g e
Near Shore Monitoring Monitoring Locations – See Appendix A - Site Map for location of monitoring points As nominated in EPL 12426, Section 2, P1.3 for MP8, 9, 12 and 20:
Station no. Location Testing Required
8 Surf zone, 100m south of groyne
Colour, Turbidity
9 Surf zone 100m north of breakwater
Colour, Turbidity
12 Surface Water leaving site into the near shore zone
Colour, Turbidity
20 Beach zone rectangular pond
Colour, Turbidity
Monitoring Requirements Limit criteria for points 8 and 9 are as established in the SEMP Section 11.4. The EPL establishes a 5 NTU turbidity trigger value at points 8, 9, and 12 to initiate monitoring at monitoring points 10, 11, 12, 14, 20 and 21 as per special frequency 2.
Station no. Testing Requirement Compliance Criteria Frequency
8,9,12,20
Turbidity <5 NTU Special Frequency 1 – weekly during dry weather, daily during wet weather (>20mm rainfall within 24 hours in rain gauge), daily during any water break out on site Daily during marine works
Colour Visual Assessment
The amber alert level triggers an investigation and review of the source of turbidity, and may prompt and adjustment in site practices if the source of turbidity is due to marine construction.
Station no. Testing Requirement Action Criteria Frequency
8, 9 Turbidity >15 NTU (Amber Alert)
Special Frequency 1 – weekly during dry weather, daily during wet weather (>20mm rainfall within 24 hours in rain gauge), daily during any water break out on site Daily during marine works
Coastwide Civil Shell Cove Boat Harbour, Stage 2 and Breakwaters
Monthly Environmental Monitoring Report October, 2017
6 | P a g e
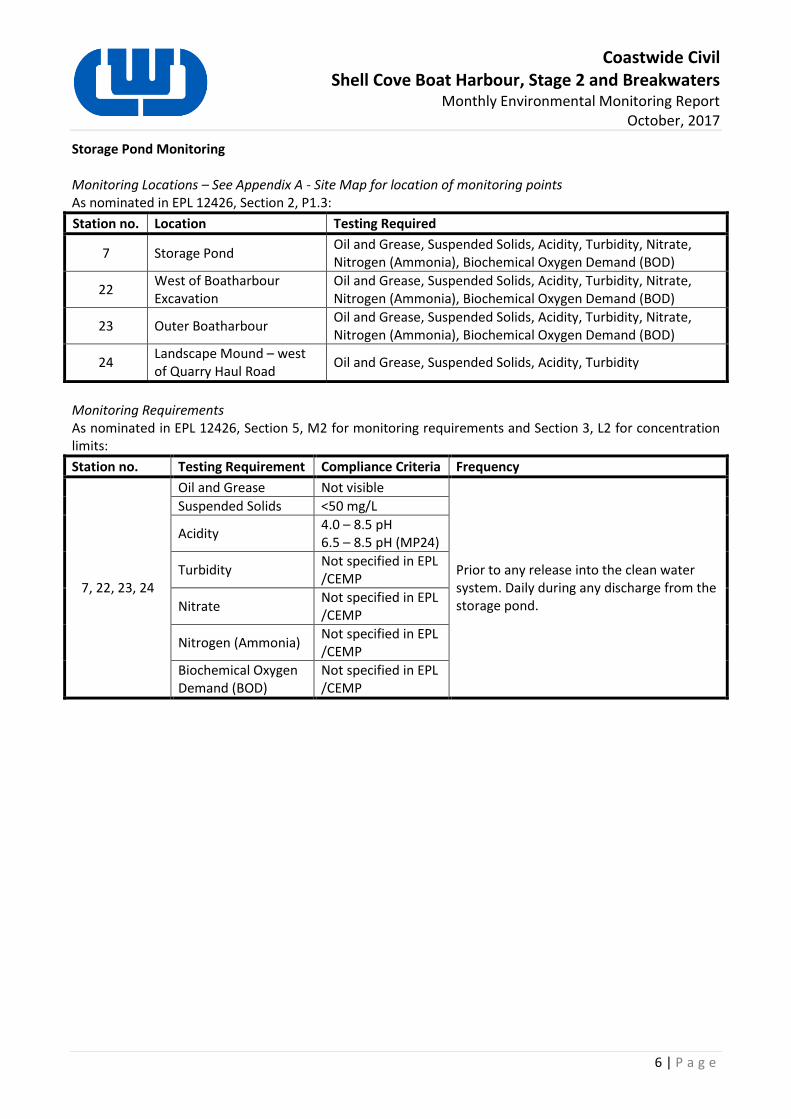
Storage Pond Monitoring Monitoring Locations – See Appendix A - Site Map for location of monitoring points As nominated in EPL 12426, Section 2, P1.3:
Station no. Location Testing Required
7 Storage Pond Oil and Grease, Suspended Solids, Acidity, Turbidity, Nitrate, Nitrogen (Ammonia), Biochemical Oxygen Demand (BOD)
22 West of Boatharbour Excavation
Oil and Grease, Suspended Solids, Acidity, Turbidity, Nitrate, Nitrogen (Ammonia), Biochemical Oxygen Demand (BOD)
23 Outer Boatharbour Oil and Grease, Suspended Solids, Acidity, Turbidity, Nitrate, Nitrogen (Ammonia), Biochemical Oxygen Demand (BOD)
24 Landscape Mound – west of Quarry Haul Road
Oil and Grease, Suspended Solids, Acidity, Turbidity
Monitoring Requirements As nominated in EPL 12426, Section 5, M2 for monitoring requirements and Section 3, L2 for concentration limits:
Station no. Testing Requirement Compliance Criteria Frequency
7, 22, 23, 24
Oil and Grease Not visible
Prior to any release into the clean water system. Daily during any discharge from the storage pond.
Suspended Solids <50 mg/L
Acidity 4.0 – 8.5 pH 6.5 – 8.5 pH (MP24)
Turbidity Not specified in EPL /CEMP
Nitrate Not specified in EPL /CEMP
Nitrogen (Ammonia) Not specified in EPL /CEMP
Biochemical Oxygen Demand (BOD)
Not specified in EPL /CEMP

Coastwide Civil Shell Cove Boat Harbour, Stage 2 and Breakwaters
Monthly Environmental Monitoring Report October, 2017
7 | P a g e
2.2. Noise
Monitoring Locations – See Appendix A - Site Map for location of monitoring points As nominated in EPL 12426, Section 2, P1.4:
Station no. Location
17 Southernmost property on Boollwarroo Parade
18 Nearest residence on Mary, William or Sophia Streets
19 Nearest residence on Whitsunday or Apollo Drives
Monitoring Requirements As nominated in EPL 12426, Section 3, L4: “For any exceedance of the background noise level by more than 10 dB(A) the licensee must undertake community liaison and consultation in order to identify and implement any additional reasonable and feasible noise mitigation options. L4.2 5dB(A) must be added to the measured noise levels if the noise is substantially tonal or impulsive in character.” Table 4.6 of the CEMP summarises noise trigger values based on background levels determined by Wilkinson Murray in 2005 as:
Parameter Trigger Value Measurement Location
Construction Noise
LAeq,15 min: 52 dBA Nearest residence on Boollwarroo Parade
LAeq,15 min: 44 dBA Nearest residence on Mary, William or Sophia Streets
LAeq,15 min: 44 dBA Nearest residence on Whitsunday or Apollo Drives
Coastwide Civil Shell Cove Boat Harbour, Stage 2 and Breakwaters
Monthly Environmental Monitoring Report October, 2017
8 | P a g e
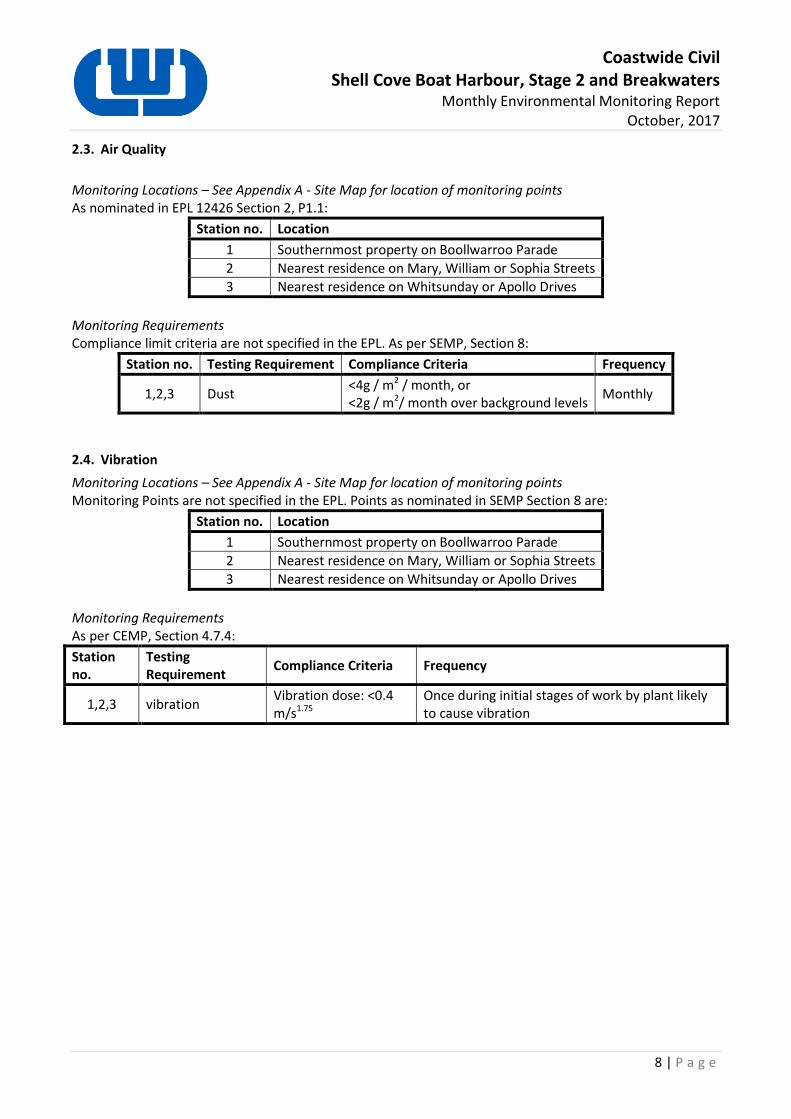
2.3. Air Quality
Monitoring Locations – See Appendix A - Site Map for location of monitoring points As nominated in EPL 12426 Section 2, P1.1:
Station no. Location
1 Southernmost property on Boollwarroo Parade
2 Nearest residence on Mary, William or Sophia Streets
3 Nearest residence on Whitsunday or Apollo Drives
Monitoring Requirements Compliance limit criteria are not specified in the EPL. As per SEMP, Section 8:
Station no. Testing Requirement Compliance Criteria Frequency
1,2,3 Dust <4g / m2 / month, or <2g / m2/ month over background levels
Monthly
2.4. Vibration
Monitoring Locations – See Appendix A - Site Map for location of monitoring points Monitoring Points are not specified in the EPL. Points as nominated in SEMP Section 8 are:
Station no. Location
1 Southernmost property on Boollwarroo Parade
2 Nearest residence on Mary, William or Sophia Streets
3 Nearest residence on Whitsunday or Apollo Drives
Monitoring Requirements As per CEMP, Section 4.7.4:
Station no.
Testing Requirement
Compliance Criteria Frequency
1,2,3 vibration Vibration dose: <0.4 m/s1.75
Once during initial stages of work by plant likely to cause vibration
Coastwide Civil Shell Cove Boat Harbour, Stage 2 and Breakwaters
Monthly Environmental Monitoring Report October, 2017
9 | P a g e
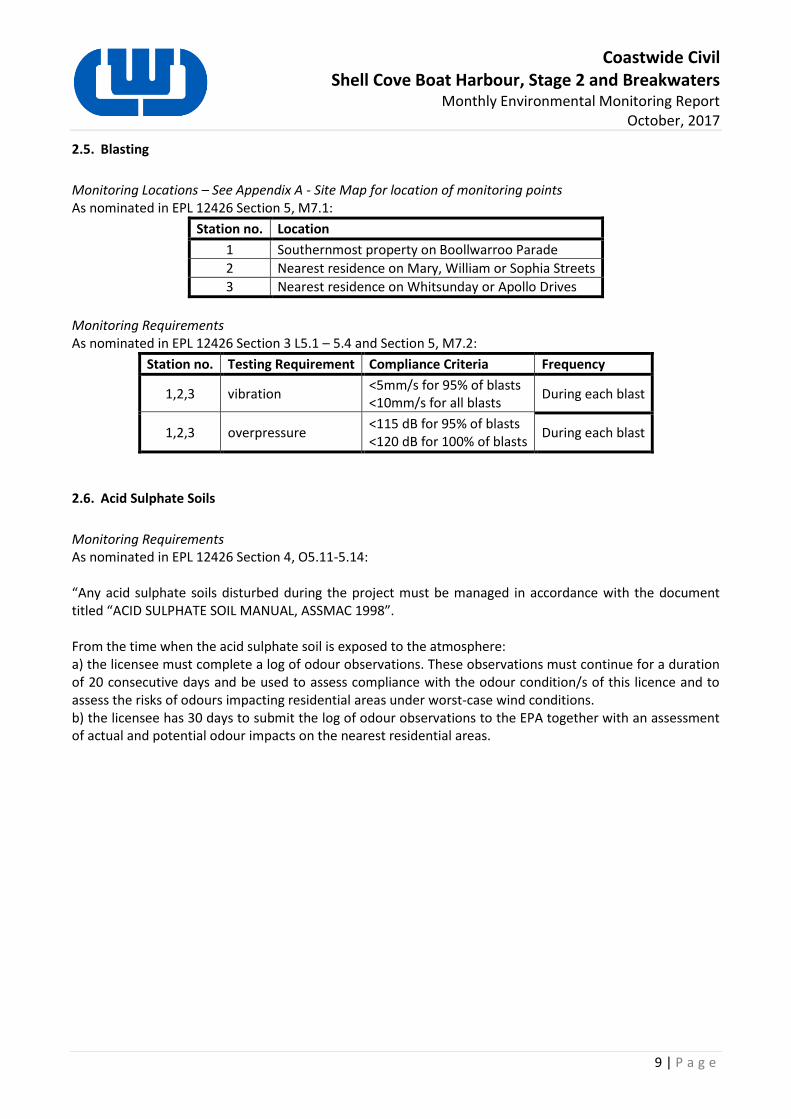
2.5. Blasting
Monitoring Locations – See Appendix A - Site Map for location of monitoring points As nominated in EPL 12426 Section 5, M7.1:
Station no. Location
1 Southernmost property on Boollwarroo Parade
2 Nearest residence on Mary, William or Sophia Streets
3 Nearest residence on Whitsunday or Apollo Drives
Monitoring Requirements As nominated in EPL 12426 Section 3 L5.1 – 5.4 and Section 5, M7.2:
Station no. Testing Requirement Compliance Criteria Frequency
1,2,3 vibration <5mm/s for 95% of blasts <10mm/s for all blasts
During each blast
1,2,3 overpressure <115 dB for 95% of blasts <120 dB for 100% of blasts
During each blast
2.6. Acid Sulphate Soils
Monitoring Requirements As nominated in EPL 12426 Section 4, O5.11-5.14: “Any acid sulphate soils disturbed during the project must be managed in accordance with the document titled “ACID SULPHATE SOIL MANUAL, ASSMAC 1998”. From the time when the acid sulphate soil is exposed to the atmosphere: a) the licensee must complete a log of odour observations. These observations must continue for a duration of 20 consecutive days and be used to assess compliance with the odour condition/s of this licence and to assess the risks of odours impacting residential areas under worst-case wind conditions. b) the licensee has 30 days to submit the log of odour observations to the EPA together with an assessment of actual and potential odour impacts on the nearest residential areas.
Coastwide Civil Shell Cove Boat Harbour, Stage 2 and Breakwaters
Monthly Environmental Monitoring Report October, 2017
10 | P a g e
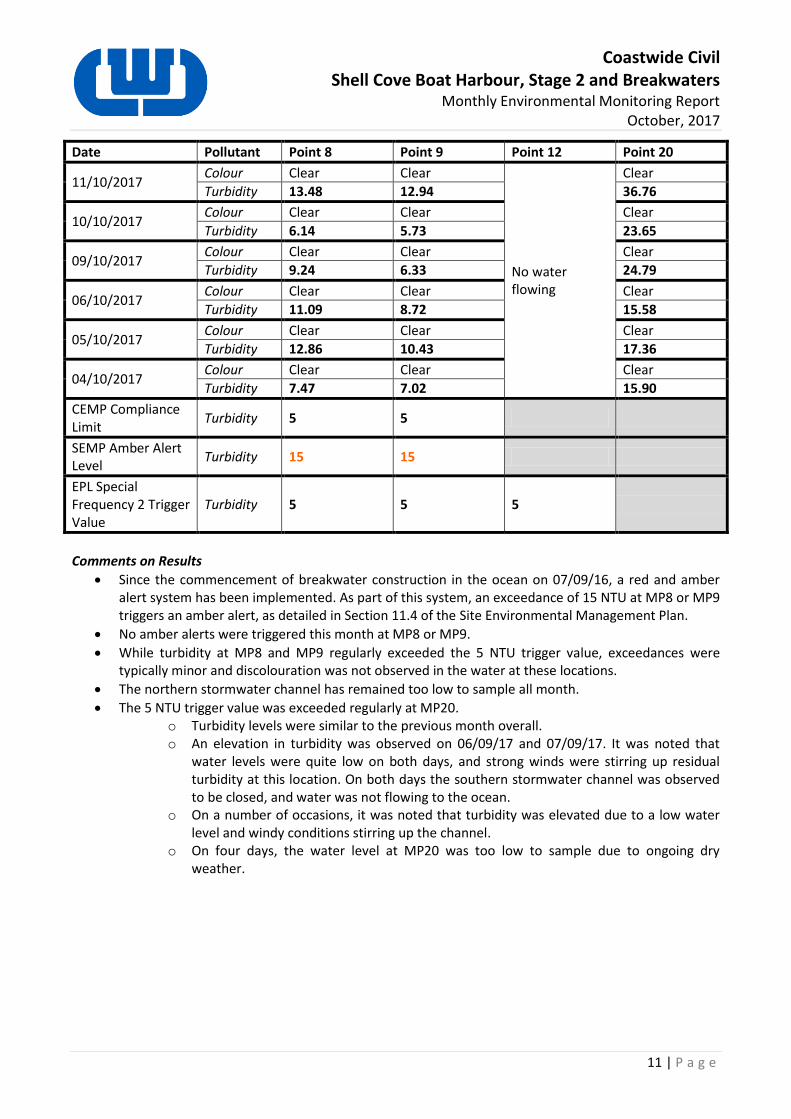
3. Water Quality 3.1. Near Shore Monitoring – Monitoring Points 8, 9, 12 and 20
Test Results Test frequency: Special Frequency 1 (Weekly in dry weather, daily in wet weather and daily during break out). To be completed daily during marine works.
Date Pollutant Point 8 Point 9 Point 12 Point 20
31/10/2017 Colour Clear Clear
No water flowing
Clear
Turbidity 8.91 7.88 32.04
30/10/2017 Colour Clear Clear Clear
Turbidity 10.33 10.01 20.82
27/10/2017 Colour Clear Clear Clear
Turbidity 7.20 7.56 22.31
26/10/2017 Colour Clear Clear Clear
Turbidity 6.10 7.18 17.41
25/10/2017 Colour Clear Clear Clear
Turbidity 3.20 4.64 37.35
24/10/2017 Colour Clear Clear Clear
Turbidity 12.36 11.25 30.29
23/10/2017 Colour Clear Clear Clear
Turbidity 12.14 10.00 21.63
20/10/2017 Colour Clear Clear Clear
Turbidity 7.25 7.98 24.05
19/10/2017 Colour Clear Clear
No water flowing
Turbidity 12.49 11.88
18/10/2017 Colour Clear Clear
Turbidity 9.24 10.65
17/10/2017 Colour Clear Clear
Turbidity 7.03 6.51
16/10/2017 Colour Clear Clear
Turbidity 6.24 3.77
13/10/2017 Colour Clear Clear Clear
Turbidity 12.02 8.75 35.08
12/10/2017 Colour Clear Clear Clear
Turbidity 6.40 5.23 20.35
CEMP Compliance Limit
Turbidity 5 5
SEMP Amber Alert Level
Turbidity 15 15
EPL Special Frequency 2 Trigger Value
Turbidity 5 5 5
Coastwide Civil Shell Cove Boat Harbour, Stage 2 and Breakwaters
Monthly Environmental Monitoring Report October, 2017
11 | P a g e
Date Pollutant Point 8 Point 9 Point 12 Point 20
11/10/2017 Colour Clear Clear
No water flowing
Clear
Turbidity 13.48 12.94 36.76
10/10/2017 Colour Clear Clear Clear
Turbidity 6.14 5.73 23.65
09/10/2017 Colour Clear Clear Clear
Turbidity 9.24 6.33 24.79
06/10/2017 Colour Clear Clear Clear
Turbidity 11.09 8.72 15.58
05/10/2017 Colour Clear Clear Clear
Turbidity 12.86 10.43 17.36
04/10/2017 Colour Clear Clear Clear
Turbidity 7.47 7.02 15.90
CEMP Compliance Limit
Turbidity 5 5
SEMP Amber Alert Level
Turbidity 15 15
EPL Special Frequency 2 Trigger Value
Turbidity 5 5 5
Comments on Results
Since the commencement of breakwater construction in the ocean on 07/09/16, a red and amber alert system has been implemented. As part of this system, an exceedance of 15 NTU at MP8 or MP9 triggers an amber alert, as detailed in Section 11.4 of the Site Environmental Management Plan.
No amber alerts were triggered this month at MP8 or MP9.
While turbidity at MP8 and MP9 regularly exceeded the 5 NTU trigger value, exceedances were typically minor and discolouration was not observed in the water at these locations.
The northern stormwater channel has remained too low to sample all month.
The 5 NTU trigger value was exceeded regularly at MP20. o Turbidity levels were similar to the previous month overall. o An elevation in turbidity was observed on 06/09/17 and 07/09/17. It was noted that
water levels were quite low on both days, and strong winds were stirring up residual turbidity at this location. On both days the southern stormwater channel was observed to be closed, and water was not flowing to the ocean.
o On a number of occasions, it was noted that turbidity was elevated due to a low water level and windy conditions stirring up the channel.
o On four days, the water level at MP20 was too low to sample due to ongoing dry weather.
Coastwide Civil Shell Cove Boat Harbour, Stage 2 and Breakwaters
Monthly Environmental Monitoring Report October, 2017
12 | P a g e
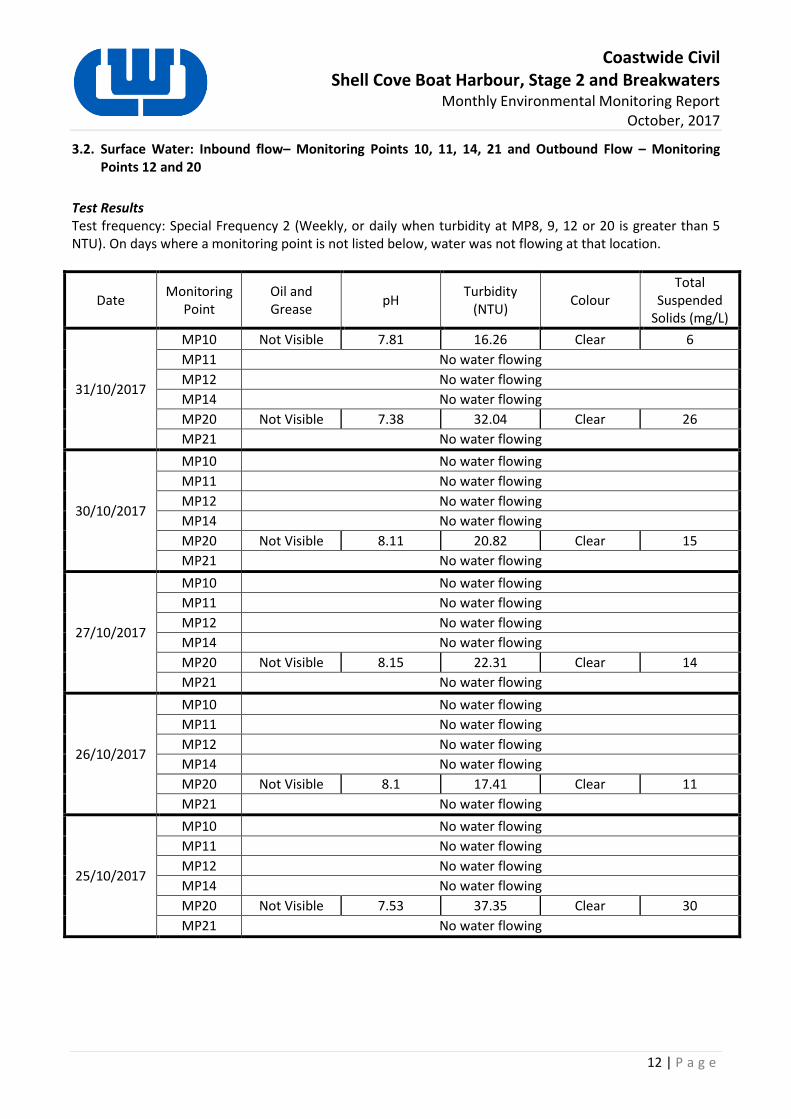
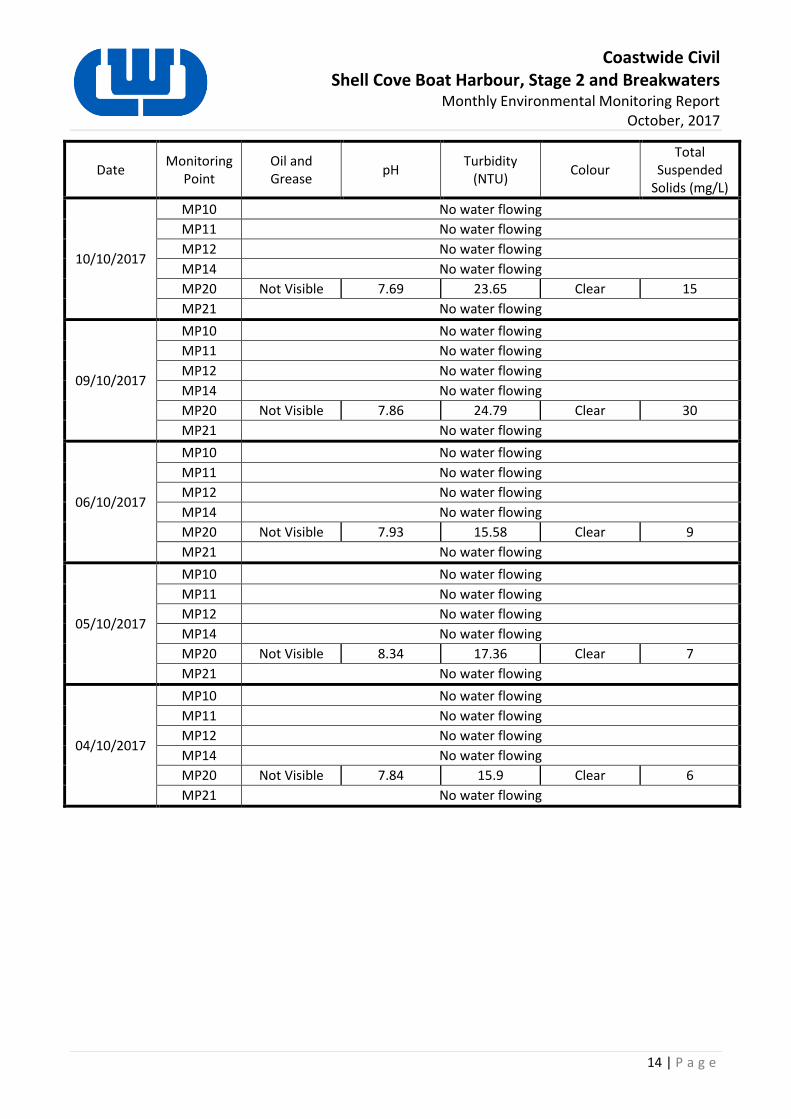
3.2. Surface Water: Inbound flow– Monitoring Points 10, 11, 14, 21 and Outbound Flow – Monitoring Points 12 and 20
Test Results Test frequency: Special Frequency 2 (Weekly, or daily when turbidity at MP8, 9, 12 or 20 is greater than 5 NTU). On days where a monitoring point is not listed below, water was not flowing at that location.
Date Monitoring
Point Oil and Grease
pH Turbidity
(NTU) Colour
Total Suspended
Solids (mg/L)
31/10/2017
MP10 Not Visible 7.81 16.26 Clear 6
MP11 No water flowing
MP12 No water flowing
MP14 No water flowing
MP20 Not Visible 7.38 32.04 Clear 26
MP21 No water flowing
30/10/2017
MP10 No water flowing
MP11 No water flowing
MP12 No water flowing
MP14 No water flowing
MP20 Not Visible 8.11 20.82 Clear 15
MP21 No water flowing
27/10/2017
MP10 No water flowing
MP11 No water flowing
MP12 No water flowing
MP14 No water flowing
MP20 Not Visible 8.15 22.31 Clear 14
MP21 No water flowing
26/10/2017
MP10 No water flowing
MP11 No water flowing
MP12 No water flowing
MP14 No water flowing
MP20 Not Visible 8.1 17.41 Clear 11
MP21 No water flowing
25/10/2017
MP10 No water flowing
MP11 No water flowing
MP12 No water flowing
MP14 No water flowing
MP20 Not Visible 7.53 37.35 Clear 30
MP21 No water flowing

Coastwide Civil Shell Cove Boat Harbour, Stage 2 and Breakwaters
Monthly Environmental Monitoring Report October, 2017
13 | P a g e
Date Monitoring
Point Oil and Grease
pH Turbidity
(NTU) Colour
Total Suspended
Solids (mg/L)
24/10/2017
MP10 No water flowing
MP11 No water flowing
MP12 No water flowing
MP14 No water flowing
MP20 Not Visible 7.59 30.29 Clear 22
MP21 No water flowing
23/10/2017
MP10 No water flowing
MP11 No water flowing
MP12 No water flowing
MP14 No water flowing
MP20 Not Visible 8.36 21.63 Clear 17
MP21 No water flowing
20/10/2017
MP10 No water flowing
MP11 No water flowing
MP12 No water flowing
MP14 No water flowing
MP20 Not Visible 8.17 24.05 Clear 20
MP21 No water flowing
13/10/2017
MP10 No water flowing
MP11 No water flowing
MP12 No water flowing
MP14 No water flowing
MP20 Not Visible 8.16 35.08 Clear 29
MP21 No water flowing
12/10/2017
MP10 No water flowing
MP11 No water flowing
MP12 No water flowing
MP14 No water flowing
MP20 Not Visible 8.07 20.35 Clear 9
MP21 No water flowing
11/10/2017
MP10 No water flowing
MP11 No water flowing
MP12 No water flowing
MP14 No water flowing
MP20 Not Visible 7.77 36.76 Clear 39
MP21 No water flowing
Coastwide Civil Shell Cove Boat Harbour, Stage 2 and Breakwaters
Monthly Environmental Monitoring Report October, 2017
14 | P a g e
Date Monitoring
Point Oil and Grease
pH Turbidity
(NTU) Colour
Total Suspended
Solids (mg/L)
10/10/2017
MP10 No water flowing
MP11 No water flowing
MP12 No water flowing
MP14 No water flowing
MP20 Not Visible 7.69 23.65 Clear 15
MP21 No water flowing
09/10/2017
MP10 No water flowing
MP11 No water flowing
MP12 No water flowing
MP14 No water flowing
MP20 Not Visible 7.86 24.79 Clear 30
MP21 No water flowing
06/10/2017
MP10 No water flowing
MP11 No water flowing
MP12 No water flowing
MP14 No water flowing
MP20 Not Visible 7.93 15.58 Clear 9
MP21 No water flowing
05/10/2017
MP10 No water flowing
MP11 No water flowing
MP12 No water flowing
MP14 No water flowing
MP20 Not Visible 8.34 17.36 Clear 7
MP21 No water flowing
04/10/2017
MP10 No water flowing
MP11 No water flowing
MP12 No water flowing
MP14 No water flowing
MP20 Not Visible 7.84 15.9 Clear 6
MP21 No water flowing

Coastwide Civil Shell Cove Boat Harbour, Stage 2 and Breakwaters
Monthly Environmental Monitoring Report October, 2017
15 | P a g e
Comments on Results
Northern channel opening (MP12): o Was closed for the entire month.
Southern channel opening (MP20): o Channel was mechanically opened on three occasions this month. Channel was closed to the
ocean on 12 out of 20 days this month and was otherwise open to the ocean.
Inbound streams: o MP10 flowed on 1 occasion only. Turbidity was 16.26 NTU on this day. o MP11 was not observed to flow this month. o MP14 was not observed to flow this month. o MP21 was not observed to flow this month.
Notable Rainfall Events: o No significant rainfall this month o 6 occasions of <10.0mm rainfall recorded, full rainfall records included in Appendix C
On one occasion, a sample was obtainable at MP10, but not taken downstream at MP21. Due to the configuration of the channel, water may be deep enough on some days to collect a sample at the upstream location, but a wider, shallower flow at MP21 may not be able to be sampled.
Coastwide Civil Shell Cove Boat Harbour, Stage 2 and Breakwaters
Monthly Environmental Monitoring Report October, 2017
16 | P a g e
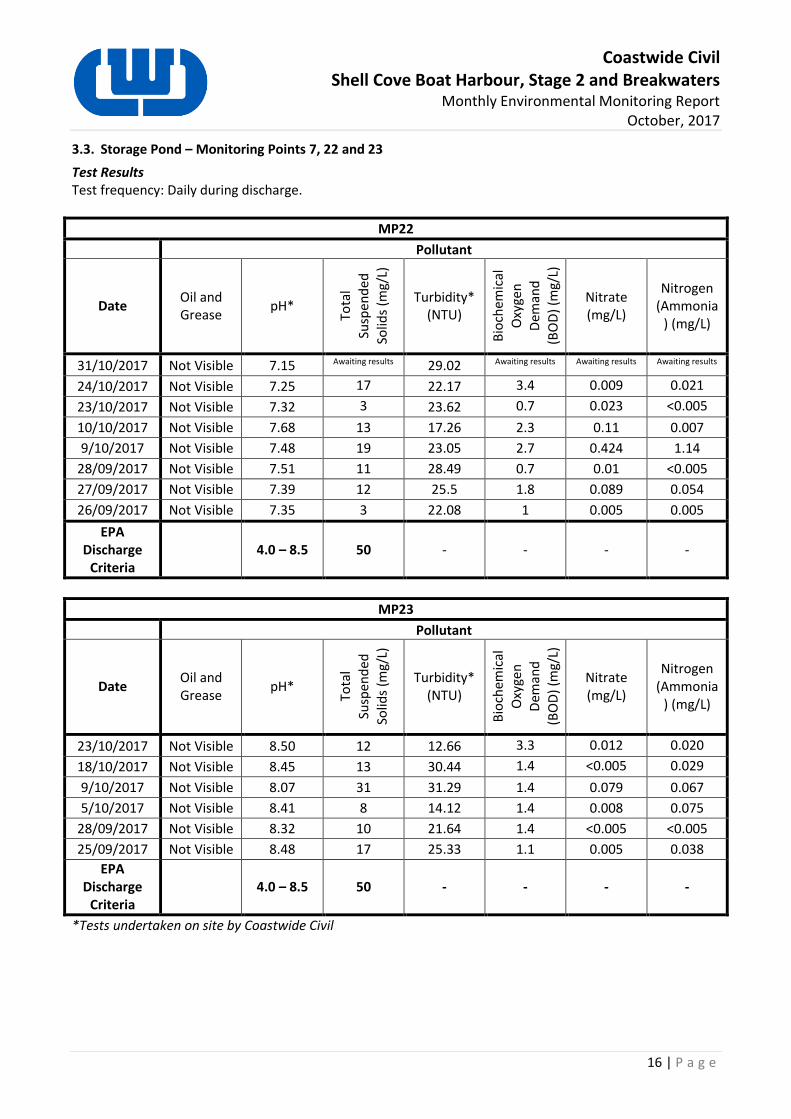
3.3. Storage Pond – Monitoring Points 7, 22 and 23
Test Results Test frequency: Daily during discharge.
MP22
Pollutant
Date Oil and Grease
pH*
Tota
l
Susp
end
ed
Solid
s (m
g/L)
Turbidity* (NTU)
Bio
chem
ical
O
xyge
n
Dem
and
(BO
D)
(mg/
L)
Nitrate (mg/L)
Nitrogen (Ammonia
) (mg/L)
31/10/2017 Not Visible 7.15 Awaiting results 29.02 Awaiting results Awaiting results Awaiting results
24/10/2017 Not Visible 7.25 17 22.17 3.4 0.009 0.021
23/10/2017 Not Visible 7.32 3 23.62 0.7 0.023 <0.005
10/10/2017 Not Visible 7.68 13 17.26 2.3 0.11 0.007
9/10/2017 Not Visible 7.48 19 23.05 2.7 0.424 1.14
28/09/2017 Not Visible 7.51 11 28.49 0.7 0.01 <0.005
27/09/2017 Not Visible 7.39 12 25.5 1.8 0.089 0.054
26/09/2017 Not Visible 7.35 3 22.08 1 0.005 0.005
EPA Discharge
Criteria
4.0 – 8.5 50 - - - -
MP23
Pollutant
Date Oil and Grease
pH*
Tota
l
Susp
end
ed
Solid
s (m
g/L)
Turbidity* (NTU)
Bio
chem
ical
O
xyge
n
Dem
and
(BO
D)
(mg/
L)
Nitrate (mg/L)
Nitrogen (Ammonia
) (mg/L)
23/10/2017 Not Visible 8.50 12 12.66 3.3 0.012 0.020
18/10/2017 Not Visible 8.45 13 30.44 1.4 <0.005 0.029
9/10/2017 Not Visible 8.07 31 31.29 1.4 0.079 0.067
5/10/2017 Not Visible 8.41 8 14.12 1.4 0.008 0.075
28/09/2017 Not Visible 8.32 10 21.64 1.4 <0.005 <0.005
25/09/2017 Not Visible 8.48 17 25.33 1.1 0.005 0.038
EPA Discharge
Criteria 4.0 – 8.5 50 - - - -
*Tests undertaken on site by Coastwide Civil
Coastwide Civil Shell Cove Boat Harbour, Stage 2 and Breakwaters
Monthly Environmental Monitoring Report October, 2017
17 | P a g e
Remarks – MP22
Discharge was undertaken on the above listed days. All site based monitoring and received lab testing results were compliant with discharge criteria.
Remarks – MP23
Discharge was undertaken on the above listed days. All site based monitoring and received lab testing results are compliant with discharge criteria
Remarks – MP24
No discharges have been required to date.
Coastwide Civil Shell Cove Boat Harbour, Stage 2 and Breakwaters
Monthly Environmental Monitoring Report October, 2017
18 | P a g e
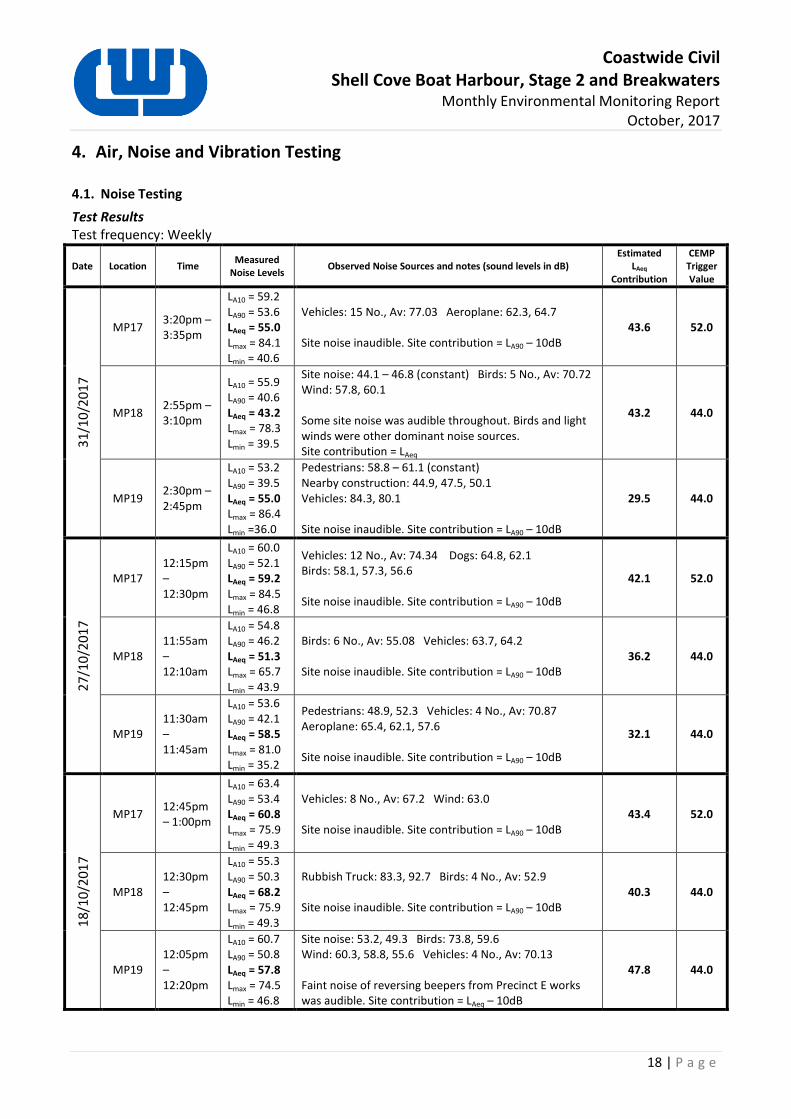
4. Air, Noise and Vibration Testing 4.1. Noise Testing
Test Results Test frequency: Weekly
Date Location Time Measured
Noise Levels Observed Noise Sources and notes (sound levels in dB)
Estimated LAeq
Contribution
CEMP Trigger Value
31/
10
/20
17
MP17 3:20pm – 3:35pm
LA10 = 59.2 LA90 = 53.6 LAeq = 55.0 Lmax = 84.1 Lmin = 40.6
Vehicles: 15 No., Av: 77.03 Aeroplane: 62.3, 64.7 Site noise inaudible. Site contribution = LA90 – 10dB
43.6 52.0
MP18 2:55pm – 3:10pm
LA10 = 55.9 LA90 = 40.6 LAeq = 43.2 Lmax = 78.3 Lmin = 39.5
Site noise: 44.1 – 46.8 (constant) Birds: 5 No., Av: 70.72 Wind: 57.8, 60.1 Some site noise was audible throughout. Birds and light winds were other dominant noise sources. Site contribution = LAeq
43.2 44.0
MP19 2:30pm – 2:45pm
LA10 = 53.2 LA90 = 39.5 LAeq = 55.0 Lmax = 86.4 Lmin =36.0
Pedestrians: 58.8 – 61.1 (constant) Nearby construction: 44.9, 47.5, 50.1 Vehicles: 84.3, 80.1 Site noise inaudible. Site contribution = LA90 – 10dB
29.5 44.0
27/
10
/20
17
MP17 12:15pm – 12:30pm
LA10 = 60.0 LA90 = 52.1 LAeq = 59.2 Lmax = 84.5 Lmin = 46.8
Vehicles: 12 No., Av: 74.34 Dogs: 64.8, 62.1 Birds: 58.1, 57.3, 56.6 Site noise inaudible. Site contribution = LA90 – 10dB
42.1 52.0
MP18 11:55am – 12:10am
LA10 = 54.8 LA90 = 46.2 LAeq = 51.3 Lmax = 65.7 Lmin = 43.9
Birds: 6 No., Av: 55.08 Vehicles: 63.7, 64.2 Site noise inaudible. Site contribution = LA90 – 10dB
36.2 44.0
MP19 11:30am – 11:45am
LA10 = 53.6 LA90 = 42.1 LAeq = 58.5 Lmax = 81.0 Lmin = 35.2
Pedestrians: 48.9, 52.3 Vehicles: 4 No., Av: 70.87 Aeroplane: 65.4, 62.1, 57.6 Site noise inaudible. Site contribution = LA90 – 10dB
32.1 44.0
18/
10/2
017
MP17 12:45pm – 1:00pm
LA10 = 63.4 LA90 = 53.4 LAeq = 60.8 Lmax = 75.9 Lmin = 49.3
Vehicles: 8 No., Av: 67.2 Wind: 63.0 Site noise inaudible. Site contribution = LA90 – 10dB
43.4 52.0
MP18 12:30pm – 12:45pm
LA10 = 55.3 LA90 = 50.3 LAeq = 68.2 Lmax = 75.9 Lmin = 49.3
Rubbish Truck: 83.3, 92.7 Birds: 4 No., Av: 52.9 Site noise inaudible. Site contribution = LA90 – 10dB
40.3 44.0
MP19 12:05pm – 12:20pm
LA10 = 60.7 LA90 = 50.8 LAeq = 57.8 Lmax = 74.5 Lmin = 46.8
Site noise: 53.2, 49.3 Birds: 73.8, 59.6 Wind: 60.3, 58.8, 55.6 Vehicles: 4 No., Av: 70.13 Faint noise of reversing beepers from Precinct E works was audible. Site contribution = LAeq – 10dB
47.8 44.0
Coastwide Civil Shell Cove Boat Harbour, Stage 2 and Breakwaters
Monthly Environmental Monitoring Report October, 2017
19 | P a g e
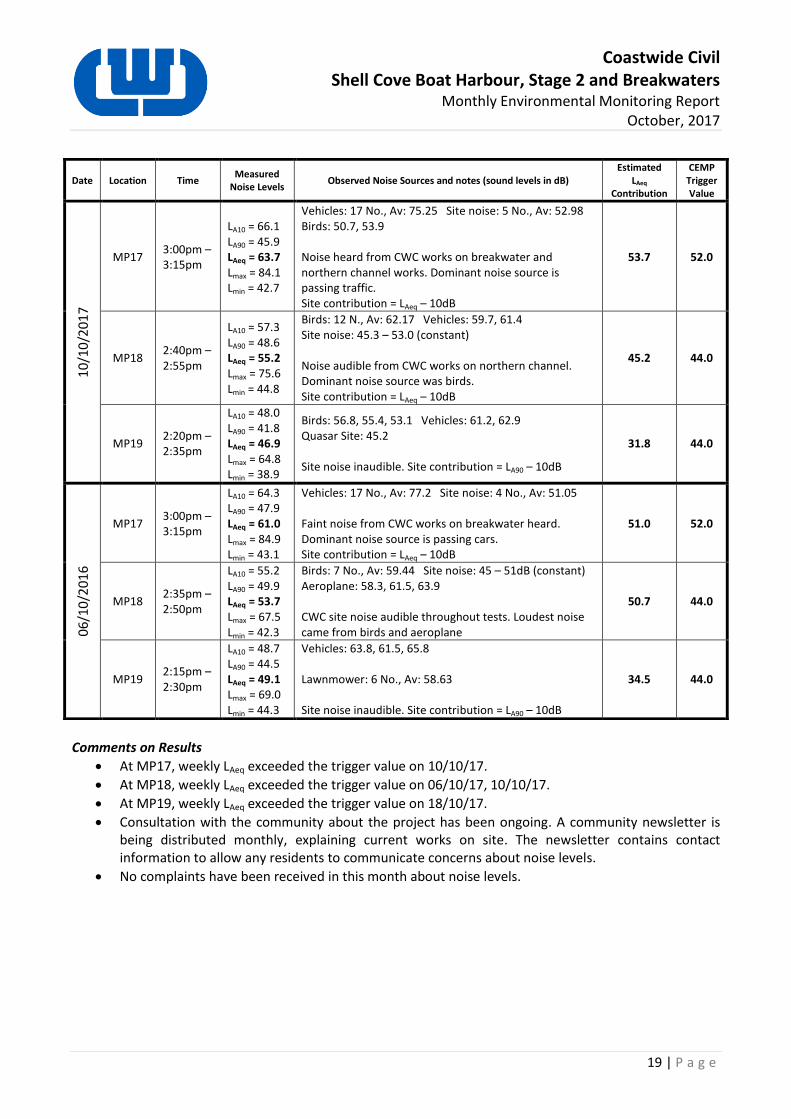
Comments on Results
At MP17, weekly LAeq exceeded the trigger value on 10/10/17.
At MP18, weekly LAeq exceeded the trigger value on 06/10/17, 10/10/17.
At MP19, weekly LAeq exceeded the trigger value on 18/10/17.
Consultation with the community about the project has been ongoing. A community newsletter is being distributed monthly, explaining current works on site. The newsletter contains contact information to allow any residents to communicate concerns about noise levels.
No complaints have been received in this month about noise levels.
Date Location Time Measured
Noise Levels Observed Noise Sources and notes (sound levels in dB)
Estimated LAeq
Contribution
CEMP Trigger Value
10
/10
/20
17
MP17 3:00pm – 3:15pm
LA10 = 66.1 LA90 = 45.9 LAeq = 63.7 Lmax = 84.1 Lmin = 42.7
Vehicles: 17 No., Av: 75.25 Site noise: 5 No., Av: 52.98 Birds: 50.7, 53.9 Noise heard from CWC works on breakwater and northern channel works. Dominant noise source is passing traffic. Site contribution = LAeq – 10dB
53.7 52.0
MP18 2:40pm – 2:55pm
LA10 = 57.3 LA90 = 48.6 LAeq = 55.2 Lmax = 75.6 Lmin = 44.8
Birds: 12 N., Av: 62.17 Vehicles: 59.7, 61.4 Site noise: 45.3 – 53.0 (constant) Noise audible from CWC works on northern channel. Dominant noise source was birds. Site contribution = LAeq – 10dB
45.2 44.0
MP19 2:20pm – 2:35pm
LA10 = 48.0 LA90 = 41.8 LAeq = 46.9 Lmax = 64.8 Lmin = 38.9
Birds: 56.8, 55.4, 53.1 Vehicles: 61.2, 62.9 Quasar Site: 45.2 Site noise inaudible. Site contribution = LA90 – 10dB
31.8 44.0
06
/10
/20
16
MP17 3:00pm – 3:15pm
LA10 = 64.3 LA90 = 47.9 LAeq = 61.0 Lmax = 84.9 Lmin = 43.1
Vehicles: 17 No., Av: 77.2 Site noise: 4 No., Av: 51.05 Faint noise from CWC works on breakwater heard. Dominant noise source is passing cars. Site contribution = LAeq – 10dB
51.0 52.0
MP18 2:35pm – 2:50pm
LA10 = 55.2 LA90 = 49.9 LAeq = 53.7 Lmax = 67.5 Lmin = 42.3
Birds: 7 No., Av: 59.44 Site noise: 45 – 51dB (constant) Aeroplane: 58.3, 61.5, 63.9 CWC site noise audible throughout tests. Loudest noise came from birds and aeroplane
50.7 44.0
MP19 2:15pm – 2:30pm
LA10 = 48.7 LA90 = 44.5 LAeq = 49.1 Lmax = 69.0 Lmin = 44.3
Vehicles: 63.8, 61.5, 65.8 Lawnmower: 6 No., Av: 58.63 Site noise inaudible. Site contribution = LA90 – 10dB
34.5 44.0
Coastwide Civil Shell Cove Boat Harbour, Stage 2 and Breakwaters
Monthly Environmental Monitoring Report October, 2017
20 | P a g e
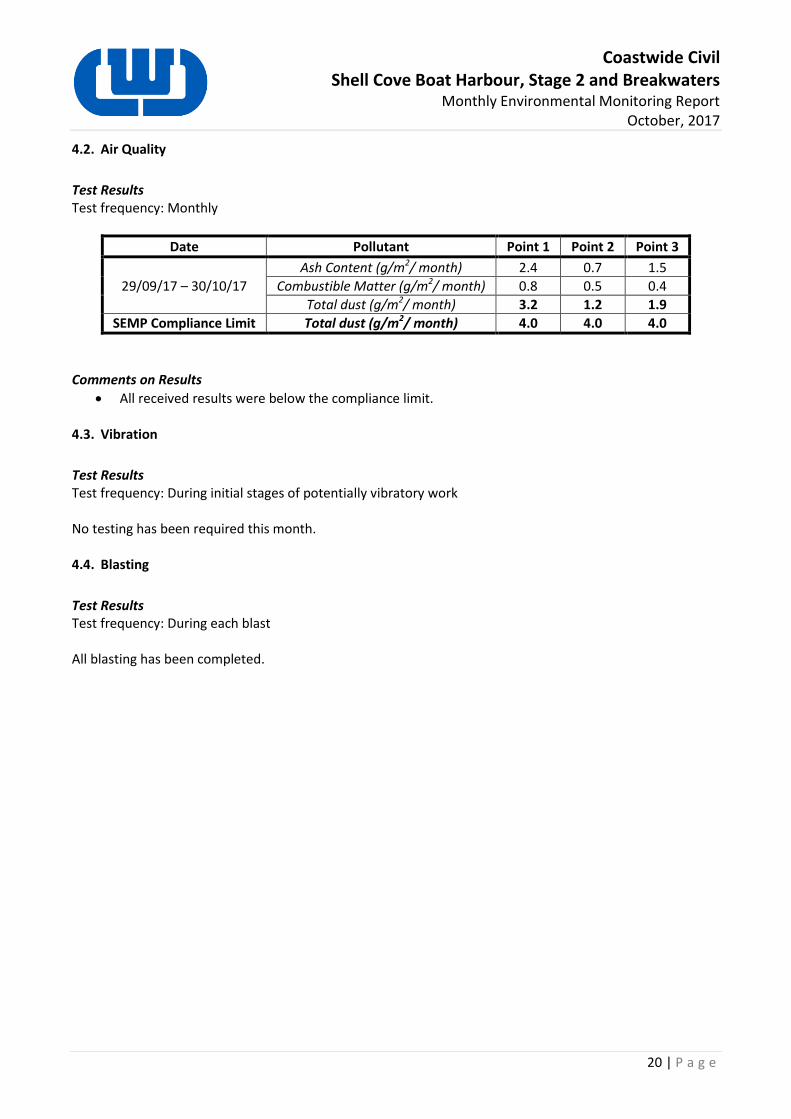
4.2. Air Quality
Test Results Test frequency: Monthly
Date Pollutant Point 1 Point 2 Point 3
29/09/17 – 30/10/17
Ash Content (g/m2/ month) 2.4 0.7 1.5
Combustible Matter (g/m2/ month) 0.8 0.5 0.4
Total dust (g/m2/ month) 3.2 1.2 1.9
SEMP Compliance Limit Total dust (g/m2/ month) 4.0 4.0 4.0
Comments on Results
All received results were below the compliance limit. 4.3. Vibration
Test Results Test frequency: During initial stages of potentially vibratory work No testing has been required this month. 4.4. Blasting
Test Results Test frequency: During each blast All blasting has been completed.

Coastwide Civil Shell Cove Boat Harbour, Stage 2 and Breakwaters
Monthly Environmental Monitoring Report October, 2017
21 | P a g e
5. Acid Sulphate Soils 5.1. Odour Monitoring
The monitoring of odour from any encountered Acid Sulphate Soil areas is ongoing as per the requirements of the EPL. Completed odour monitoring logs have been forwarded to the EPA as required.
Coastwide Civil Shell Cove Boat Harbour, Stage 2 and Breakwaters
Monthly Environmental Monitoring Report October, 2017
22 | P a g e
Appendix A – Site Map
Coastwide Civil Shell Cove Boat Harbour, Stage 2 and Breakwaters
Monthly Environmental Monitoring Report October, 2017
23 | P a g e
Appendix B – Lab Testing Results
PAGE 1OF 1
Environmental Analysis Laboratory, Southern Cross University, Tel. 02 6620 3678, website: scu.edu.au/eal
checked: ...............Graham Lancaster
Laboratory Manager
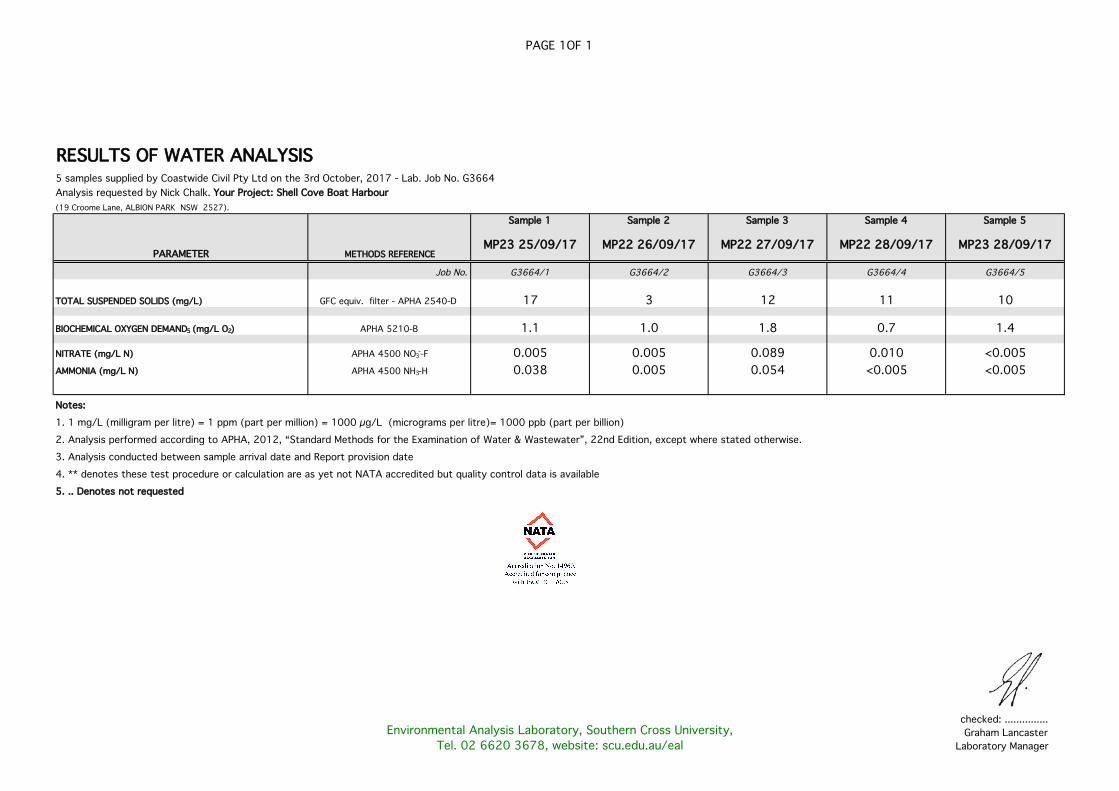
RESULTS OF WATER ANALYSIS 5 samples supplied by Coastwide Civil Pty Ltd on the 3rd October, 2017 - Lab. Job No. G3664Analysis requested by Nick Chalk. Your Project: Shell Cove Boat Harbour(19 Croome Lane, ALBION PARK NSW 2527).
Sample 1 Sample 2 Sample 3 Sample 4 Sample 5
PARAMETER METHODS REFERENCEMP23 25/09/17 MP22 26/09/17 MP22 27/09/17 MP22 28/09/17 MP23 28/09/17
Job No. G3664/1 G3664/2 G3664/3 G3664/4 G3664/5
TOTAL SUSPENDED SOLIDS (mg/L) GFC equiv. filter - APHA 2540-D 17 3 12 11 10
BIOCHEMICAL OXYGEN DEMAND5 (mg/L O2) APHA 5210-B 1.1 1.0 1.8 0.7 1.4
NITRATE (mg/L N) APHA 4500 NO3--F 0.005 0.005 0.089 0.010 <0.005
AMMONIA (mg/L N) APHA 4500 NH3-H 0.038 0.005 0.054 <0.005 <0.005
Notes: 1. 1 mg/L (milligram per litre) = 1 ppm (part per million) = 1000 µg/L (micrograms per litre)= 1000 ppb (part per billion)2. Analysis performed according to APHA, 2012, “Standard Methods for the Examination of Water & Wastewater”, 22nd Edition, except where stated otherwise.3. Analysis conducted between sample arrival date and Report provision date4. ** denotes these test procedure or calculation are as yet not NATA accredited but quality control data is available5. .. Denotes not requested
Page 1 of 1
Environmental Analysis Laboratory, Southern Cross University, Tel. 02 6620 3678, website: scu.edu.au/eal
checked: ...............Graham Lancaster
Laboratory Manager
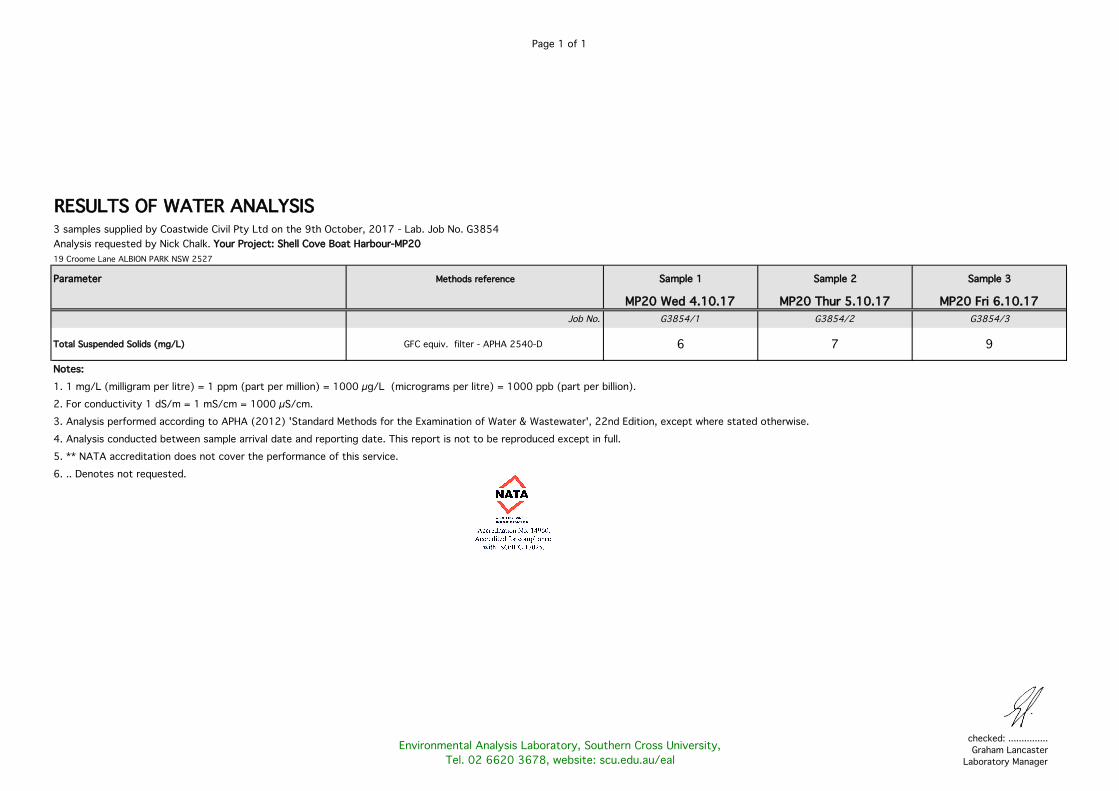
RESULTS OF WATER ANALYSIS3 samples supplied by Coastwide Civil Pty Ltd on the 9th October, 2017 - Lab. Job No. G3854Analysis requested by Nick Chalk. Your Project: Shell Cove Boat Harbour-MP2019 Croome Lane ALBION PARK NSW 2527
Parameter Methods reference Sample 1 Sample 2 Sample 3
MP20 Wed 4.10.17 MP20 Thur 5.10.17 MP20 Fri 6.10.17Job No. G3854/1 G3854/2 G3854/3
Total Suspended Solids (mg/L) GFC equiv. filter - APHA 2540-D 6 7 9
Notes: 1. 1 mg/L (milligram per litre) = 1 ppm (part per million) = 1000 µg/L (micrograms per litre) = 1000 ppb (part per billion).2. For conductivity 1 dS/m = 1 mS/cm = 1000 µS/cm.3. Analysis performed according to APHA (2012) 'Standard Methods for the Examination of Water & Wastewater', 22nd Edition, except where stated otherwise.4. Analysis conducted between sample arrival date and reporting date. This report is not to be reproduced except in full.5. ** NATA accreditation does not cover the performance of this service.6. .. Denotes not requested.
PAGE 1OF 1
Environmental Analysis Laboratory, Southern Cross University, Tel. 02 6620 3678, website: scu.edu.au/eal
checked: ...............Graham Lancaster
Laboratory Manager
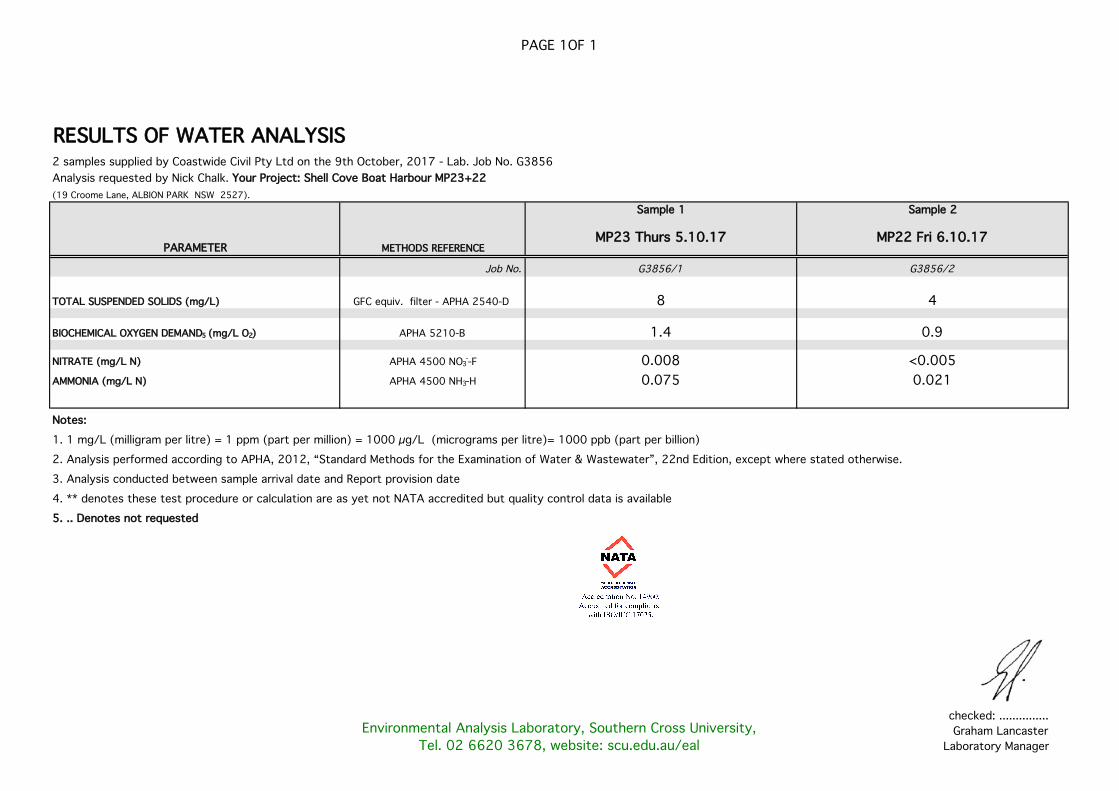
RESULTS OF WATER ANALYSIS 2 samples supplied by Coastwide Civil Pty Ltd on the 9th October, 2017 - Lab. Job No. G3856Analysis requested by Nick Chalk. Your Project: Shell Cove Boat Harbour MP23+22(19 Croome Lane, ALBION PARK NSW 2527).
Sample 1 Sample 2
PARAMETER METHODS REFERENCEMP23 Thurs 5.10.17 MP22 Fri 6.10.17
Job No. G3856/1 G3856/2
TOTAL SUSPENDED SOLIDS (mg/L) GFC equiv. filter - APHA 2540-D 8 4
BIOCHEMICAL OXYGEN DEMAND5 (mg/L O2) APHA 5210-B 1.4 0.9
NITRATE (mg/L N) APHA 4500 NO3--F 0.008 <0.005
AMMONIA (mg/L N) APHA 4500 NH3-H 0.075 0.021
Notes: 1. 1 mg/L (milligram per litre) = 1 ppm (part per million) = 1000 µg/L (micrograms per litre)= 1000 ppb (part per billion)2. Analysis performed according to APHA, 2012, “Standard Methods for the Examination of Water & Wastewater”, 22nd Edition, except where stated otherwise.3. Analysis conducted between sample arrival date and Report provision date4. ** denotes these test procedure or calculation are as yet not NATA accredited but quality control data is available5. .. Denotes not requested
PAGE 1OF 1
Environmental Analysis Laboratory, Southern Cross University, Tel. 02 6620 3678, website: scu.edu.au/eal
checked: ...............Graham Lancaster
Laboratory Manager
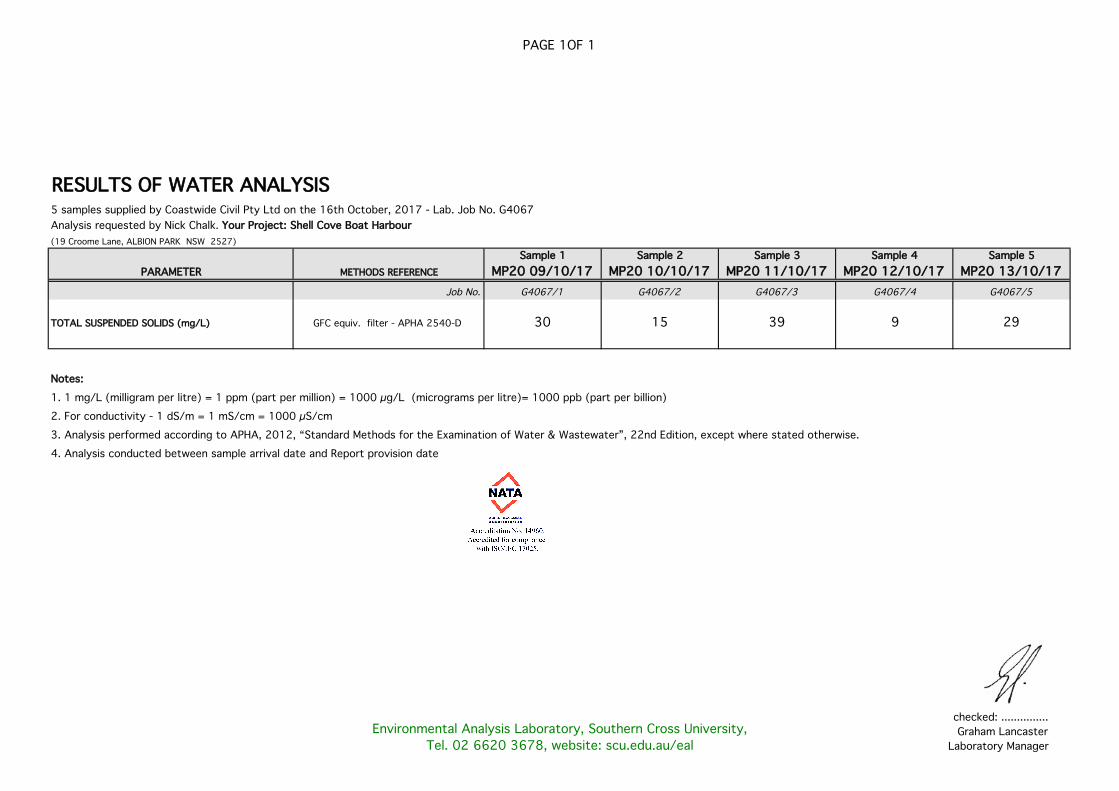
RESULTS OF WATER ANALYSIS 5 samples supplied by Coastwide Civil Pty Ltd on the 16th October, 2017 - Lab. Job No. G4067Analysis requested by Nick Chalk. Your Project: Shell Cove Boat Harbour(19 Croome Lane, ALBION PARK NSW 2527)
Sample 1 Sample 2 Sample 3 Sample 4 Sample 5PARAMETER METHODS REFERENCE MP20 09/10/17 MP20 10/10/17 MP20 11/10/17 MP20 12/10/17 MP20 13/10/17
Job No. G4067/1 G4067/2 G4067/3 G4067/4 G4067/5
TOTAL SUSPENDED SOLIDS (mg/L) GFC equiv. filter - APHA 2540-D 30 15 39 9 29
Notes: 1. 1 mg/L (milligram per litre) = 1 ppm (part per million) = 1000 µg/L (micrograms per litre)= 1000 ppb (part per billion)2. For conductivity - 1 dS/m = 1 mS/cm = 1000 µS/cm3. Analysis performed according to APHA, 2012, “Standard Methods for the Examination of Water & Wastewater”, 22nd Edition, except where stated otherwise.4. Analysis conducted between sample arrival date and Report provision date

PAGE 1OF 1
Environmental Analysis Laboratory, Southern Cross University, Tel. 02 6620 3678, website: scu.edu.au/eal
checked: ...............Graham Lancaster
Laboratory Manager
RESULTS OF WATER ANALYSIS 3 samples supplied by Coastwide Civil Pty Ltd on the 16th October, 2017 - Lab. Job No. G4068Analysis requested by Nick Chalk. Your Project: Shell Cove Boat Harbour(19 Croome Lane, ALBION PARK NSW 2527).
Sample 1 Sample 2 Sample 3
PARAMETER METHODS REFERENCEMP22 09/10/17 MP23 09/10/17 MP22 10/10/17
Job No. G4068/1 G4068/2 G4068/3
TOTAL SUSPENDED SOLIDS (mg/L) GFC equiv. filter - APHA 2540-D 19 31 13
BIOCHEMICAL OXYGEN DEMAND5 (mg/L O2) APHA 5210-B 2.7 1.4 2.3
NITRATE (mg/L N) APHA 4500 NO3--F 0.424 0.079 0.110
AMMONIA (mg/L N) APHA 4500 NH3-H 1.140 0.067 0.007
Notes: 1. 1 mg/L (milligram per litre) = 1 ppm (part per million) = 1000 µg/L (micrograms per litre)= 1000 ppb (part per billion)2. Analysis performed according to APHA, 2012, “Standard Methods for the Examination of Water & Wastewater”, 22nd Edition, except where stated otherwise.3. Analysis conducted between sample arrival date and Report provision date4. ** denotes these test procedure or calculation are as yet not NATA accredited but quality control data is available5. .. Denotes not requested

PAGE 1OF 1
Environmental Analysis Laboratory, Southern Cross University, Tel. 02 6620 3678, website: scu.edu.au/eal
checked: ...............Graham Lancaster
Laboratory Manager
RESULTS OF WATER ANALYSIS 2 samples supplied by Coastwide Civil Pty Ltd on the 23rd October, 2017 - Lab. Job No. G4253Analysis requested by Nick Chalk. Your Project: Shell Cove Boat Harbour(19 Croome Lane, ALBION PARK NSW 2527).
Sample 1 Sample 2
PARAMETER METHODS REFERENCEMP23 - 18/10/2017 MP20 - 20/10/2017
Job No. G4253/1 G4253/2
TOTAL SUSPENDED SOLIDS (mg/L) GFC equiv. filter - APHA 2540-D 13 20
BIOCHEMICAL OXYGEN DEMAND5 (mg/L O2) APHA 5210-B 1.4 ..
NITRATE (mg/L N) APHA 4500 NO3--F <0.005 ..
AMMONIA (mg/L N) APHA 4500 NH3-H 0.029 ..
Notes: 1. 1 mg/L (milligram per litre) = 1 ppm (part per million) = 1000 µg/L (micrograms per litre)= 1000 ppb (part per billion)2. Analysis performed according to APHA, 2012, “Standard Methods for the Examination of Water & Wastewater”, 22nd Edition, except where stated otherwise.3. Analysis conducted between sample arrival date and Report provision date4. ** denotes these test procedure or calculation are as yet not NATA accredited but quality control data is available5. .. Denotes not requested
PAGE 1OF 1
Environmental Analysis Laboratory, Southern Cross University, Tel. 02 6620 3678, website: scu.edu.au/eal
checked: ...............Graham Lancaster
Laboratory Manager
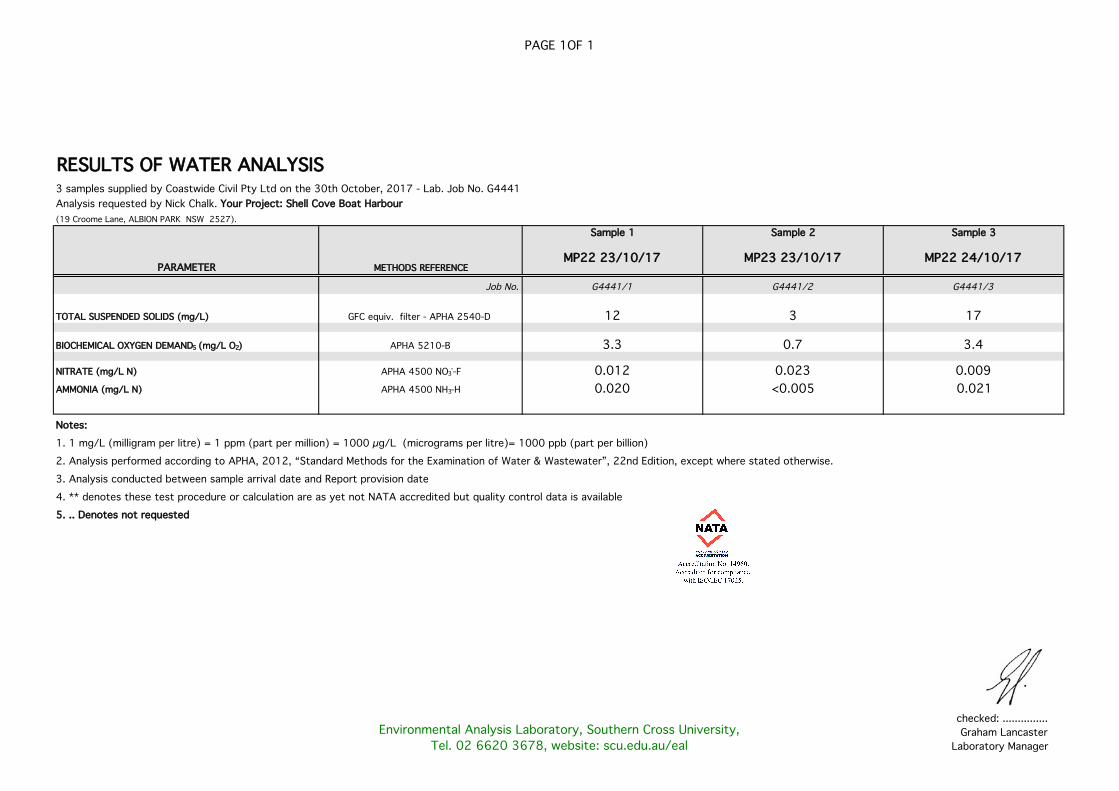
RESULTS OF WATER ANALYSIS 3 samples supplied by Coastwide Civil Pty Ltd on the 30th October, 2017 - Lab. Job No. G4441Analysis requested by Nick Chalk. Your Project: Shell Cove Boat Harbour(19 Croome Lane, ALBION PARK NSW 2527).
Sample 1 Sample 2 Sample 3
PARAMETER METHODS REFERENCEMP22 23/10/17 MP23 23/10/17 MP22 24/10/17
Job No. G4441/1 G4441/2 G4441/3
TOTAL SUSPENDED SOLIDS (mg/L) GFC equiv. filter - APHA 2540-D 12 3 17
BIOCHEMICAL OXYGEN DEMAND5 (mg/L O2) APHA 5210-B 3.3 0.7 3.4
NITRATE (mg/L N) APHA 4500 NO3--F 0.012 0.023 0.009
AMMONIA (mg/L N) APHA 4500 NH3-H 0.020 <0.005 0.021
Notes: 1. 1 mg/L (milligram per litre) = 1 ppm (part per million) = 1000 µg/L (micrograms per litre)= 1000 ppb (part per billion)2. Analysis performed according to APHA, 2012, “Standard Methods for the Examination of Water & Wastewater”, 22nd Edition, except where stated otherwise.3. Analysis conducted between sample arrival date and Report provision date4. ** denotes these test procedure or calculation are as yet not NATA accredited but quality control data is available5. .. Denotes not requested
Page 1 of 1
Environmental Analysis Laboratory, Southern Cross University, Tel. 02 6620 3678, website: scu.edu.au/eal
checked: ...............Graham Lancaster
Laboratory Manager
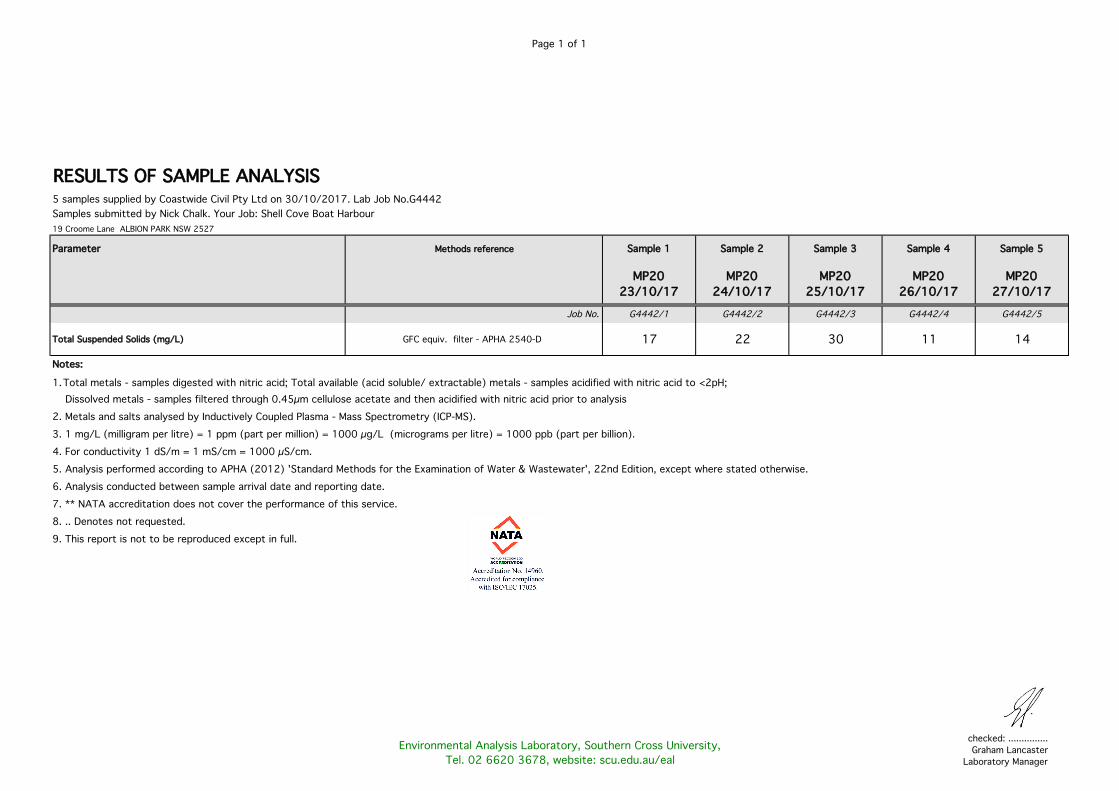
RESULTS OF SAMPLE ANALYSIS5 samples supplied by Coastwide Civil Pty Ltd on 30/10/2017. Lab Job No.G4442Samples submitted by Nick Chalk. Your Job: Shell Cove Boat Harbour19 Croome Lane ALBION PARK NSW 2527
Parameter Methods reference Sample 1 Sample 2 Sample 3 Sample 4 Sample 5
MP20 23/10/17
MP20 24/10/17
MP20 25/10/17
MP20 26/10/17
MP20 27/10/17
Job No. G4442/1 G4442/2 G4442/3 G4442/4 G4442/5
Total Suspended Solids (mg/L) GFC equiv. filter - APHA 2540-D 17 22 30 11 14
Notes:
1. Total metals - samples digested with nitric acid; Total available (acid soluble/ extractable) metals - samples acidified with nitric acid to <2pH; Dissolved metals - samples filtered through 0.45µm cellulose acetate and then acidified with nitric acid prior to analysis2. Metals and salts analysed by Inductively Coupled Plasma - Mass Spectrometry (ICP-MS).3. 1 mg/L (milligram per litre) = 1 ppm (part per million) = 1000 µg/L (micrograms per litre) = 1000 ppb (part per billion).4. For conductivity 1 dS/m = 1 mS/cm = 1000 µS/cm.5. Analysis performed according to APHA (2012) 'Standard Methods for the Examination of Water & Wastewater', 22nd Edition, except where stated otherwise.6. Analysis conducted between sample arrival date and reporting date.7. ** NATA accreditation does not cover the performance of this service.8. .. Denotes not requested.9. This report is not to be reproduced except in full.
Page 1 of 1
Environmental Analysis Laboratory, Southern Cross University, Tel. 02 6620 3678, website: scu.edu.au/eal
checked: ...............Graham Lancaster
Laboratory Manager
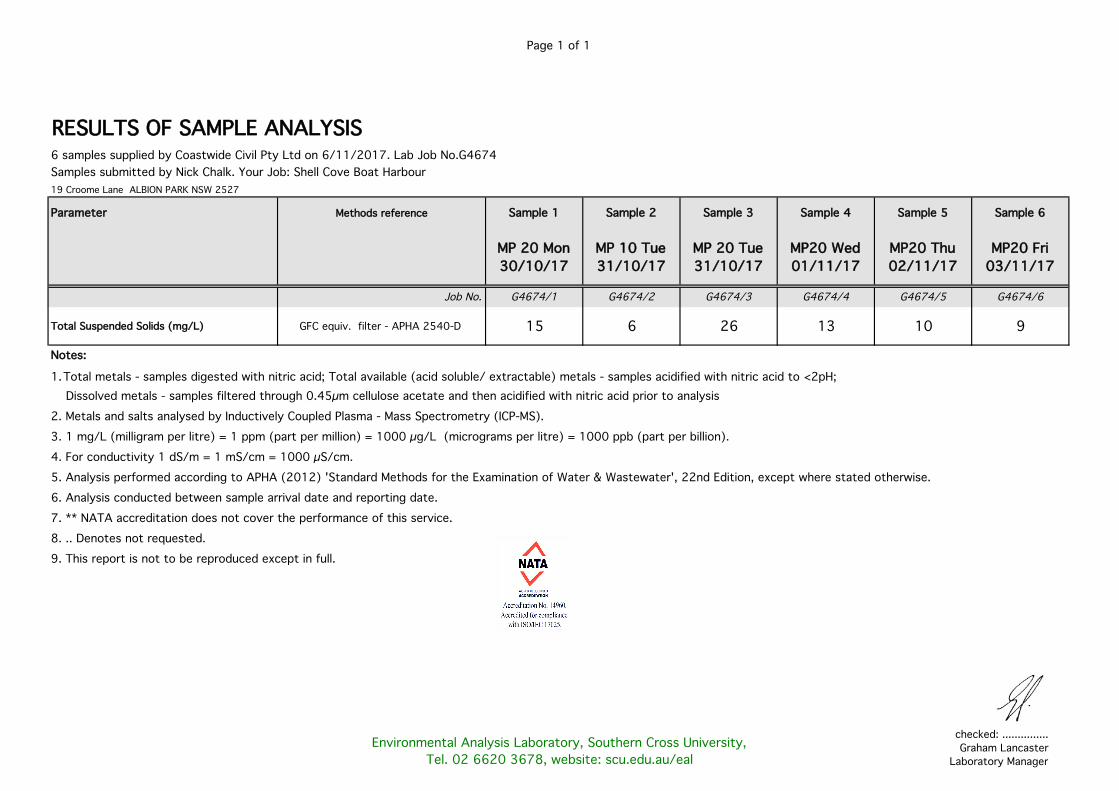
RESULTS OF SAMPLE ANALYSIS6 samples supplied by Coastwide Civil Pty Ltd on 6/11/2017. Lab Job No.G4674Samples submitted by Nick Chalk. Your Job: Shell Cove Boat Harbour19 Croome Lane ALBION PARK NSW 2527
Parameter Methods reference Sample 1 Sample 2 Sample 3 Sample 4 Sample 5 Sample 6
MP 20 Mon 30/10/17
MP 10 Tue 31/10/17
MP 20 Tue 31/10/17
MP20 Wed 01/11/17
MP20 Thu 02/11/17
MP20 Fri 03/11/17
Job No. G4674/1 G4674/2 G4674/3 G4674/4 G4674/5 G4674/6
Total Suspended Solids (mg/L) GFC equiv. filter - APHA 2540-D 15 6 26 13 10 9
Notes:
1. Total metals - samples digested with nitric acid; Total available (acid soluble/ extractable) metals - samples acidified with nitric acid to <2pH; Dissolved metals - samples filtered through 0.45µm cellulose acetate and then acidified with nitric acid prior to analysis2. Metals and salts analysed by Inductively Coupled Plasma - Mass Spectrometry (ICP-MS).3. 1 mg/L (milligram per litre) = 1 ppm (part per million) = 1000 µg/L (micrograms per litre) = 1000 ppb (part per billion).4. For conductivity 1 dS/m = 1 mS/cm = 1000 µS/cm.5. Analysis performed according to APHA (2012) 'Standard Methods for the Examination of Water & Wastewater', 22nd Edition, except where stated otherwise.6. Analysis conducted between sample arrival date and reporting date.7. ** NATA accreditation does not cover the performance of this service.8. .. Denotes not requested.9. This report is not to be reproduced except in full.
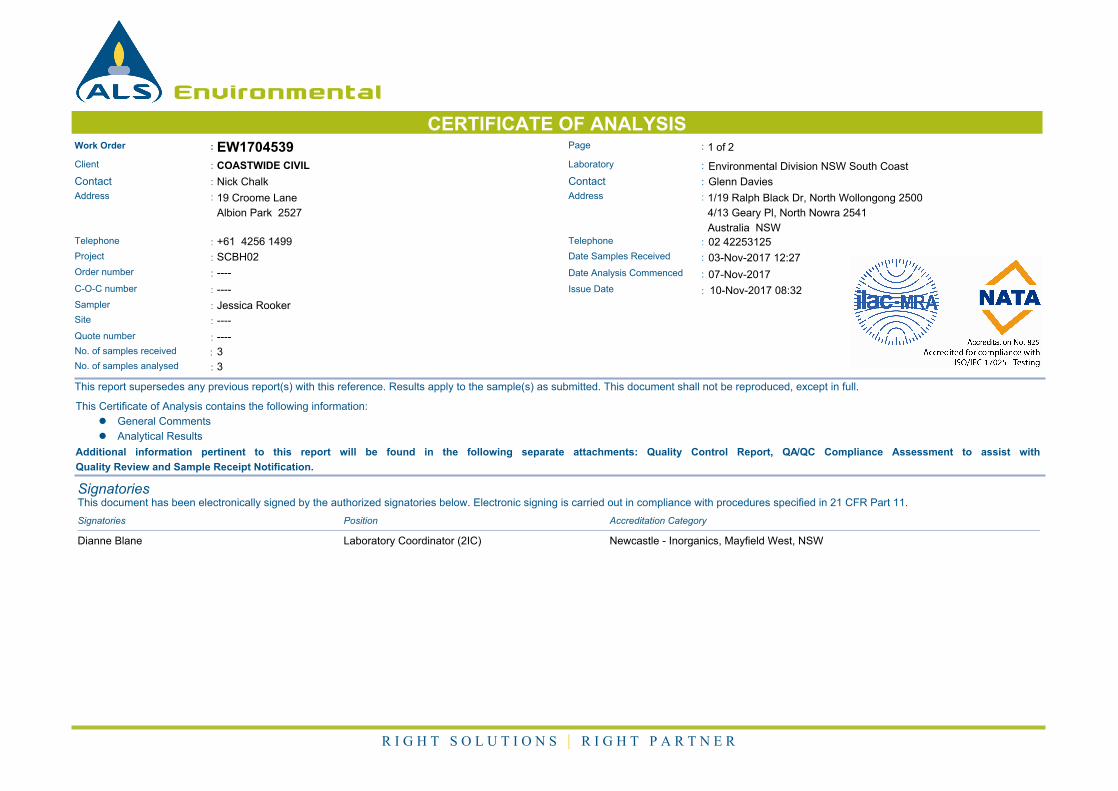
0 0.00 True
Environmental
CERTIFICATE OF ANALYSISWork Order : Page : 1 of 2EW1704539
:: LaboratoryClient COASTWIDE CIVIL Environmental Division NSW South Coast
: :ContactContact Nick Chalk Glenn Davies
:: AddressAddress 19 Croome Lane
Albion Park 2527
1/19 Ralph Black Dr, North Wollongong 2500
4/13 Geary Pl, North Nowra 2541
Australia NSW
:Telephone +61 4256 1499 :Telephone 02 42253125
:Project SCBH02 Date Samples Received : 03-Nov-2017 12:27
:Order number ---- Date Analysis Commenced : 07-Nov-2017
:C-O-C number ---- Issue Date : 10-Nov-2017 08:32
Sampler : Jessica Rooker
Site : ----
Quote number : ----
3:No. of samples received
3:No. of samples analysed
This report supersedes any previous report(s) with this reference. Results apply to the sample(s) as submitted. This document shall not be reproduced, except in full.
This Certificate of Analysis contains the following information:
l General Comments
l Analytical Results
Additional information pertinent to this report will be found in the following separate attachments: Quality Control Report, QA/QC Compliance Assessment to assist with
Quality Review and Sample Receipt Notification.
SignatoriesThis document has been electronically signed by the authorized signatories below. Electronic signing is carried out in compliance with procedures specified in 21 CFR Part 11.
Signatories Accreditation CategoryPosition
Dianne Blane Laboratory Coordinator (2IC) Newcastle - Inorganics, Mayfield West, NSW
R I G H T S O L U T I O N S | R I G H T P A R T N E R
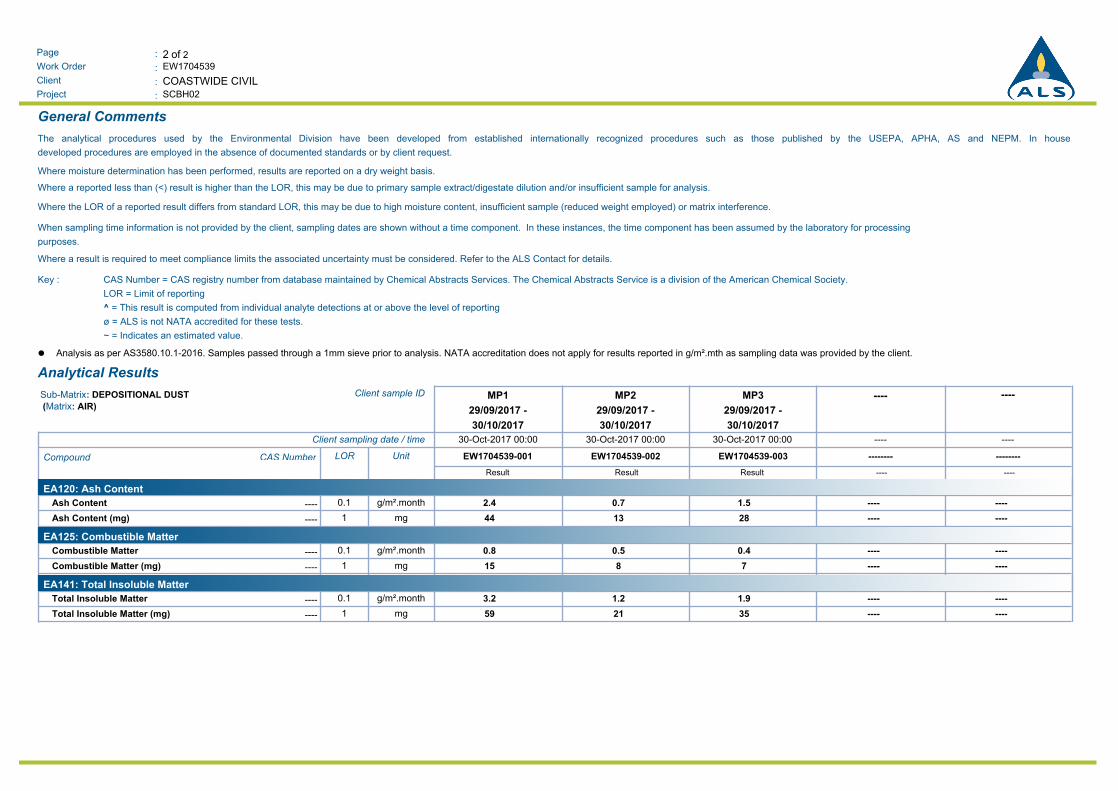
2 of 2:Page
Work Order :
:Client
EW1704539
SCBH02:Project
COASTWIDE CIVIL
General Comments
The analytical procedures used by the Environmental Division have been developed from established internationally recognized procedures such as those published by the USEPA, APHA, AS and NEPM. In house
developed procedures are employed in the absence of documented standards or by client request.
Where moisture determination has been performed, results are reported on a dry weight basis.
Where a reported less than (<) result is higher than the LOR, this may be due to primary sample extract/digestate dilution and/or insufficient sample for analysis.
Where the LOR of a reported result differs from standard LOR, this may be due to high moisture content, insufficient sample (reduced weight employed) or matrix interference.
When sampling time information is not provided by the client, sampling dates are shown without a time component. In these instances, the time component has been assumed by the laboratory for processing
purposes.
Where a result is required to meet compliance limits the associated uncertainty must be considered. Refer to the ALS Contact for details.
CAS Number = CAS registry number from database maintained by Chemical Abstracts Services. The Chemical Abstracts Service is a division of the American Chemical Society.
LOR = Limit of reporting
^ = This result is computed from individual analyte detections at or above the level of reporting
ø = ALS is not NATA accredited for these tests.
~ = Indicates an estimated value.
Key :
Analysis as per AS3580.10.1-2016. Samples passed through a 1mm sieve prior to analysis. NATA accreditation does not apply for results reported in g/m².mth as sampling data was provided by the client.l
Analytical Results
--------MP3
29/09/2017 -
30/10/2017
MP2
29/09/2017 -
30/10/2017
MP1
29/09/2017 -
30/10/2017
Client sample IDSub-Matrix: DEPOSITIONAL DUST
(Matrix: AIR)
--------30-Oct-2017 00:0030-Oct-2017 00:0030-Oct-2017 00:00Client sampling date / time
----------------EW1704539-003EW1704539-002EW1704539-001UnitLORCAS NumberCompound
Result Result Result ---- ----
EA120: Ash Content
2.4 0.7 1.5 ---- ----g/m².month0.1----Ash Content
44 13 28 ---- ----mg1----Ash Content (mg)
EA125: Combustible Matter
0.8 0.5 0.4 ---- ----g/m².month0.1----Combustible Matter
15 8 7 ---- ----mg1----Combustible Matter (mg)
EA141: Total Insoluble Matter
3.2 1.2 1.9 ---- ----g/m².month0.1----Total Insoluble Matter
59 21 35 ---- ----mg1----Total Insoluble Matter (mg)

Coastwide Civil Shell Cove Boat Harbour, Stage 2 and Breakwaters
Monthly Environmental Monitoring Report October, 2017
24 | P a g e
Appendix C – Site Rainfall Measurements
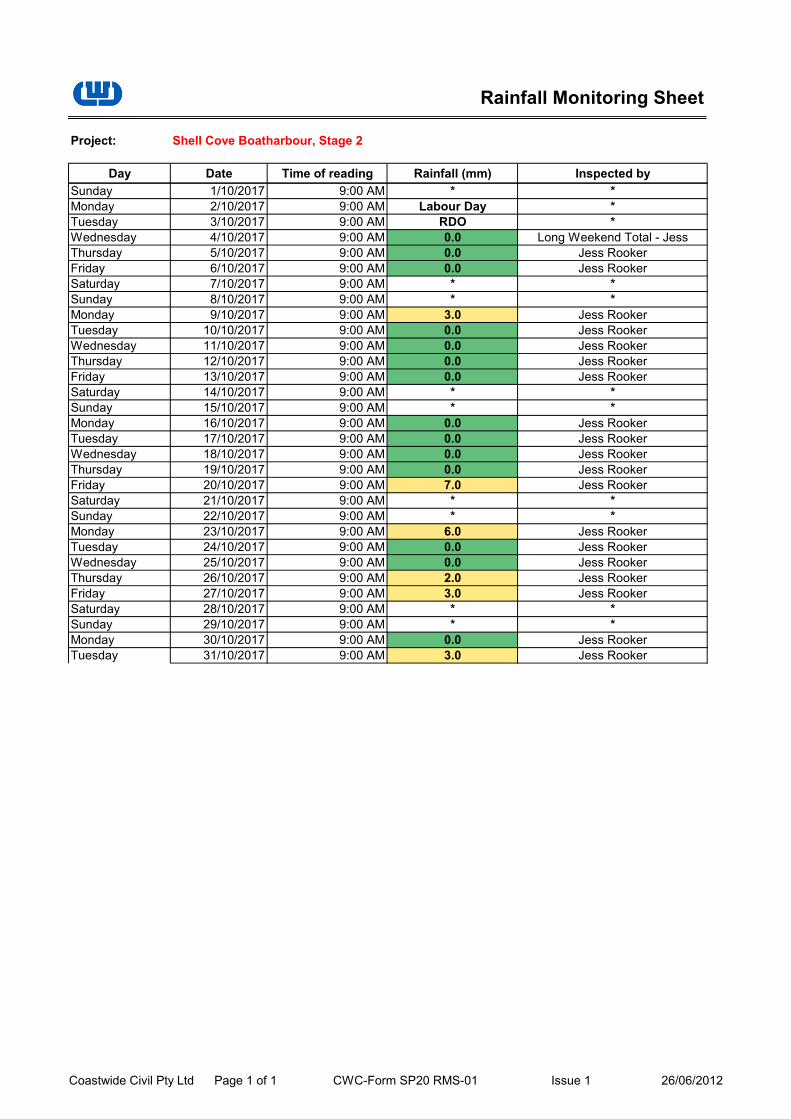
Rainfall Monitoring Sheet
Project: Shell Cove Boatharbour, Stage 2
Day Date Time of reading Rainfall (mm) Inspected by
Sunday 1/10/2017 9:00 AM * *Monday 2/10/2017 9:00 AM Labour Day *Tuesday 3/10/2017 9:00 AM RDO *Wednesday 4/10/2017 9:00 AM 0.0 Long Weekend Total - JessThursday 5/10/2017 9:00 AM 0.0 Jess RookerFriday 6/10/2017 9:00 AM 0.0 Jess RookerSaturday 7/10/2017 9:00 AM * *Sunday 8/10/2017 9:00 AM * *Monday 9/10/2017 9:00 AM 3.0 Jess RookerTuesday 10/10/2017 9:00 AM 0.0 Jess RookerWednesday 11/10/2017 9:00 AM 0.0 Jess RookerThursday 12/10/2017 9:00 AM 0.0 Jess RookerFriday 13/10/2017 9:00 AM 0.0 Jess RookerSaturday 14/10/2017 9:00 AM * *Sunday 15/10/2017 9:00 AM * *Monday 16/10/2017 9:00 AM 0.0 Jess RookerTuesday 17/10/2017 9:00 AM 0.0 Jess RookerWednesday 18/10/2017 9:00 AM 0.0 Jess RookerThursday 19/10/2017 9:00 AM 0.0 Jess RookerFriday 20/10/2017 9:00 AM 7.0 Jess RookerSaturday 21/10/2017 9:00 AM * *Sunday 22/10/2017 9:00 AM * *Monday 23/10/2017 9:00 AM 6.0 Jess RookerTuesday 24/10/2017 9:00 AM 0.0 Jess RookerWednesday 25/10/2017 9:00 AM 0.0 Jess RookerThursday 26/10/2017 9:00 AM 2.0 Jess RookerFriday 27/10/2017 9:00 AM 3.0 Jess RookerSaturday 28/10/2017 9:00 AM * *Sunday 29/10/2017 9:00 AM * *Monday 30/10/2017 9:00 AM 0.0 Jess RookerTuesday 31/10/2017 9:00 AM 3.0 Jess Rooker
Coastwide Civil Pty Ltd Page 1 of 1 CWC-Form SP20 RMS-01 Issue 1 26/06/2012