sheffield city region transport strategy 2011-2026 · sheffield city region transport strategy,...
TRANSCRIPT

Sheffield City Region tRanSpoRt StRategy, 2011-2026 1
Sheffield City Region tRanSpoRt StRategy 2011-2026
Published April 2011


We are pleased to present the Sheffield City Region Transport Strategy for the next 15 years, from April 2011 to 2026. Transport has an impact on everybody’s life, and we therefore need a clear transport strategy to help make our city, towns and villages the best places to live, work, invest and visit . This strategy defines our vision for the future of our neighbourhoods and communities and specifies the goals that our transport system needs to meet in order to achieve this vision.
This strategy is part of the Third Local Transport Plan for South Yorkshire, which includes the districts of Barnsley, Doncaster, Rotherham and Sheffield. It is complemented by an implementation plan, presented in a separate document, which explains how the strategic priorities identified here will be delivered.
People’s travel patterns do not always match the administrative boundaries between South Yorkshire and its adjacent counties. We have therefore defined the Sheffield City Region, which covers most of the localities from which people regularly travel to Sheffield or to its neighbouring towns. Sheffield City Region includes the whole of South Yorkshire, and also parts of Derbyshire and Nottinghamshire, including the Peak District National Park.
The Integrated Transport Authority for South Yorkshire has worked in collaboration with authorities across the Sheffield City Region to create this strategy. The Local Enterprise Partnership for the Sheffield City Region has a key role in developing our policies to support the area’s prosperity and economic growth, which are at the heart of this strategy.
In developing this strategy we have consulted with business groups, environmental groups, the health sector, the Police and emergency services, voluntary organisations, community stakeholders and transport operators. The strategy also incorporates feedback received from the general public, following a twelve-week public consultation period.
Having listened to their wide range of views, we believe that the strategy strikes the right balance between the different roles transport has. It acknowledges that it is critical for the transport system to provide access to opportunities, attract investment and help create more jobs. At the same time, it aims to improve air quality, help people get physically active to keep them healthy and reduce carbon emissions.
The long-term aspirations listed here are ambitious in these times when funding for transport investments is likely to be extremely constrained. Even if we are successful in fully implementing our plans, such investments take time to have a significant effect. This strategy is presented knowing that our priorities must remain consistent over time and that we will have to deliver them with determination to ensure the continued success of the Sheffield City Region.
Cllr Mick Jameson,Chair of South Yorkshire Integrated Transport Authority
James NewmanChair of the Sheffield City Region Local Enterprise Partnership
foRewoRd


Sheffield City Region tRanSpoRt StRategy, 2011-2026 i
Our strategy
Sheffield City Region (SCR) is an area renowned for its strong industrial heritage and unique natural beauty. It lies at the heart of the UK, covering South Yorkshire (Barnsley, Doncaster, Rotherham and Sheffield) and parts of Nottinghamshire and Derbyshire, including the Peak District National Park. SCR has had a decade of rapid growth; it has re-established itself as a centre of advanced manufacturing and engineering, while also developing expertise in new areas such as digital media.
Despite its impressive transformation into a centre of 21st-century technologies, large parts of SCR still suffer from the effects of recession and deprivation. Some of the main urban areas are waiting to be redeveloped. Partners from across SCR have a vision to see it offering people a great place in which to live, work, invest and visit. Focusing on SCR’s prosperity and growth, we want it to make a greater contribution to the UK economy by having a local economy less dependent on the public sector, providing conditions for businesses to grow, and becoming the prime national centre for advanced manufacturing and low-carbon industries. To make SCR such a place, we need to keep people and goods moving effectively.
This Transport Strategy has been developed jointly by the SCR partners. The strategy defines our priorities for our transport system, to be implemented over the next 15 years. It forms part of the Local Transport Plan for South Yorkshire, but it covers the wider SCR, which functions as a coherent economic area, with a transport system that also serves people from Chesterfield, Worksop, the Peak District and their vicinity. Formally, this strategy will influence spending priorities in South Yorkshire only, as the other counties are also developing their own transport strategies, but we are working in partnership so that this strategy is shared by all SCR districts.
exeCutive SummaRy
Rotherham town centre
0 2010
Kilometers
Doncaster
Sheffield Rotherham
Barnsley
Chesterfield
Bassetlaw
Bolsover
Derbyshire Dales
N.E.Derbyshire
The Sheffield City Region

ii Sheffield City Region tRanSpoRt StRategy, 2011-2026
Our gOals
The transport networks in SCR have to meet a range of needs and support different types of travellers or businesses. Our transport system needs to help people get around as easily as possible, in order to enable them to be economically, socially and physically active. Transport links should ensure that people are connected to a range of work, training, shopping and leisure opportunities which they can then choose from. We separate this overall vision into several different elements so that we can associate them with clear actions and then measure their outcomes.
Our first and primary goal is for the transport system to support the economic growth of SCR. We see SCR becoming a magnet for investment and business relocation; this requires improved connectivity to local and national destinations by reducing congestion, unreliability and overcrowding. SCR is set for major regeneration and redevelopment; this calls for providing new transport links as well as improving townscape in some places. We are determined to enable everyone in SCR to enjoy the benefits of employment and education; this entails making such opportunities easily accessible to those seeking them.
Our second goal is for the transport system to enhance social inclusion and health. The transport system needs to ensure that people in all parts of SCR have access to a variety of activities, paying particular attention to those who cannot easily afford their travel, to people who do not have access to a car and to those with other special needs. Transport improvements are necessary to provide good access to medical, social and community services. People’s travel habits have a direct impact on their health, and we therefore intend to further encourage active means of travel so that people can remain fit for whatever activities they choose to take part in.
Our third goal is to reduce the emissions from vehicles, since they lead to air pollution and climate change. We mean to create a culture whereby people are happy to make sustainable travel choices and where economic prosperity goes hand-in-hand with carbon efficiency. We also intend to promote sustainability by establishing an integrated approach to transport and land use planning.
Our fourth goal is to make transport increasingly safe and secure, especially to those who are currently at a higher risk. People should become confident that they can use our transport networks free of harm and that their safety does not depend on which form of transport they use. This will have a direct impact on people’s wellbeing, but also a more indirect benefit in economic terms.
The four goals are summarised in the figure below, alongside the need to keep people and goods moving effectively, which derives directly from our vision.
Our Goals
To support economic growth
To keep people and goods moving effectively
To reduce emissions
To enhance social inclusion
and health
To maximise safety
Sheffield City Hall
Sheffield City Region tRanSpoRt StRategy, 2011-2026 iii
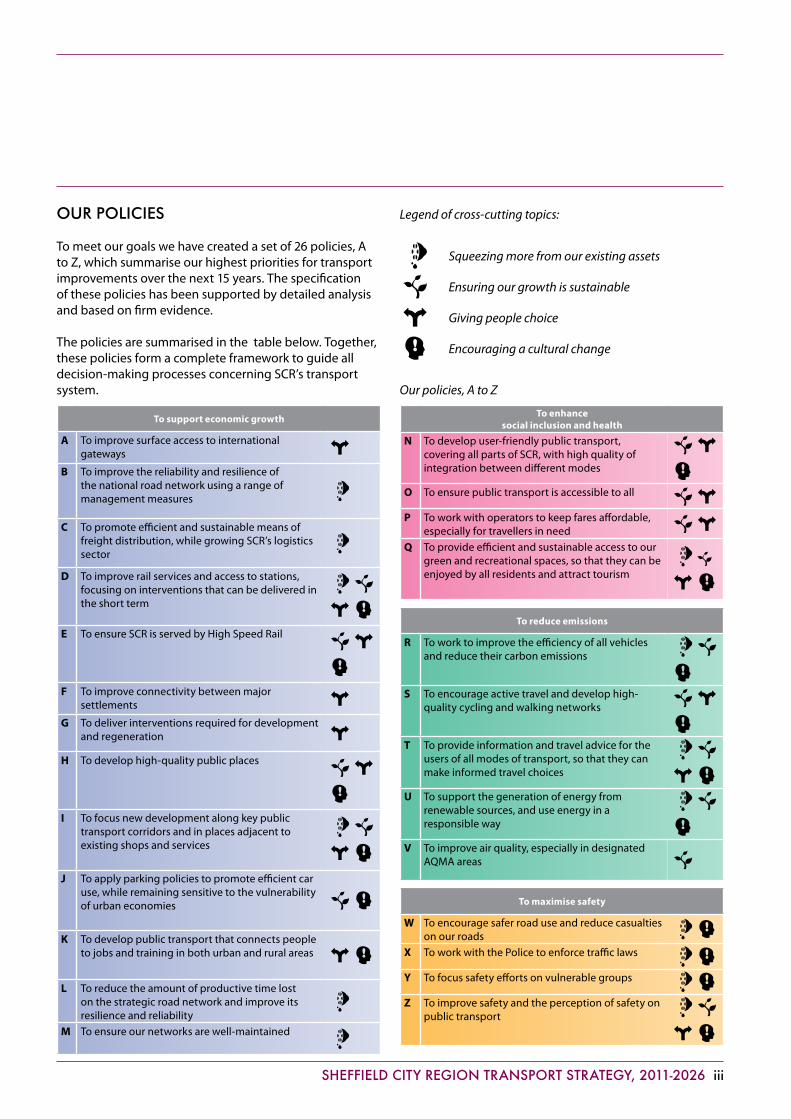
Our pOlicies
To meet our goals we have created a set of 26 policies, A to Z, which summarise our highest priorities for transport improvements over the next 15 years. The specification of these policies has been supported by detailed analysis and based on firm evidence.
The policies are summarised in the table below. Together, these policies form a complete framework to guide all decision-making processes concerning SCR’s transport system.
Legend of cross-cutting topics:
Squeezing more from our existing assets
Ensuring our growth is sustainable
Giving people choice
Encouraging a cultural change
Our policies, A to Z
To support economic growth
A To improve surface access to international gateways
B To improve the reliability and resilience of the national road network using a range of management measures
C To promote efficient and sustainable means of freight distribution, while growing SCR’s logistics sector
D To improve rail services and access to stations, focusing on interventions that can be delivered in the short term
E To ensure SCR is served by High Speed Rail
F To improve connectivity between major settlements
G To deliver interventions required for development and regeneration
H To develop high-quality public places
I To focus new development along key public transport corridors and in places adjacent to existing shops and services
J To apply parking policies to promote efficient car use, while remaining sensitive to the vulnerability of urban economies
K To develop public transport that connects people to jobs and training in both urban and rural areas
L To reduce the amount of productive time lost on the strategic road network and improve its resilience and reliability
M To ensure our networks are well-maintained
To enhancesocial inclusion and health
N To develop user-friendly public transport, covering all parts of SCR, with high quality of integration between different modes
O To ensure public transport is accessible to all
P To work with operators to keep fares affordable, especially for travellers in need
Q To provide efficient and sustainable access to our green and recreational spaces, so that they can be enjoyed by all residents and attract tourism
To reduce emissions
R To work to improve the efficiency of all vehicles and reduce their carbon emissions
S To encourage active travel and develop high-quality cycling and walking networks
T To provide information and travel advice for the users of all modes of transport, so that they can make informed travel choices
U To support the generation of energy from renewable sources, and use energy in a responsible way
V To improve air quality, especially in designated AQMA areas
To maximise safety
W To encourage safer road use and reduce casualties on our roads
X To work with the Police to enforce traffic laws
Y To focus safety efforts on vulnerable groups
Z To improve safety and the perception of safety on public transport
iv Sheffield City Region tRanSpoRt StRategy, 2011-2026
Our actiOns
The policies are designed so that they can be translated into actions. We have carried out work to forecast the likely impacts of these actions, and this has provided further justification to the full policy framework. The following are actions of a strategic nature that derive directly from our policies. Additional actions are presented in detail in the implementation plan and annual delivery programmes.
To support business growth in SCR, we will improve interurban connectivity by strengthening rail links to London, Manchester, Leeds and Nottingham on the Midland Main Line, East Coast Main Line and Trans Pennine routes. To facilitate employment opportunities we will also create new links to major regeneration areas, for example in East Doncaster, the Dearne Valley, Rossington, Waverley, the Lower Don Valley, Markham Vale and Junctions 36-37 of the M1.
Opening up opportunities for economic growth results in additional car trips and potentially increased levels of congestion. Enhanced activity on our transport networks is a welcome sign of economic vitality but might also give rise to levels of congestion that would thwart the efforts to make our area prosper.
A significant improvement to the performance of our networks will therefore be achieved via active traffic management on the motorways and the use of intelligent traffic control systems in both our road and rail networks. A boost to the capacity and reliability of these networks will be achieved through contingency planning and real-time event handling. As part of the effort to relieve congestion hotspots, we will also embark on a series of targeted improvements on routes such as the A57, A61 and Junction 34 on the M1.
There is clear evidence that the likely impact of population growth over the lifespan of the strategy, coupled with a considerable rise in car ownership, would be greater than the mitigating effect of these interventions. Extensive work to provide a choice between car and other modes of travel, especially for short-distance trips, would therefore be required in order to tackle further increase in congestion, loss of productive time, air pollution and high carbon emissions.
We will give people more travel options using a range of public transport enhancements, including the introduction of additional train and tram vehicles, improved links between Barnsley and Doncaster, the “tram-train” project between Sheffield and Rotherham, improved access to the redevelopment area around the Robin Hood Airport, and Park and Ride schemes on selected corridors.
We will also design pedestrian-friendly streets and footpaths, create a continuous cycling network, support car clubs and car sharing schemes, and make information about all these travel options easier to find and use. We will take action to make a wiser use of energy through assisting drivers in becoming more fuel-efficient, enforcing speed limits and encouraging the use of less polluting vehicles.
Our analysis indicates that even when all the measures listed above are combined, their joint effect is still not large enough to prevent the natural evolution of congestion and the associated risks to SCR’s economy and environment. For our actions to become truly effective, we will seek to influence land use planning processes so that the location of new development reduces the need to travel long distances. This will allow people to undertake most of their activities in central places, such as Barnsley’s Accessibility Improvement Zone, which are convenient for the users of all transport modes.
Our approach to traffic management in urban centres will acknowledge the importance of parking provision to local businesses, and the vulnerability of local economies to restricted access by car. Nevertheless, we will remain alert to increasing congestion in these centres, and will consider applying measures to reduce congestion over time.
There is strong evidence that the success of these actions depends on our ability to apply them consistently and jointly as a combined package. By introducing improvements to all travel modes, better management of our networks and an integrated spatial planning approach, transport will play a central role in helping SCR to thrive and flourish.
Sheffield City Region tRanSpoRt StRategy, 2011-2026 v
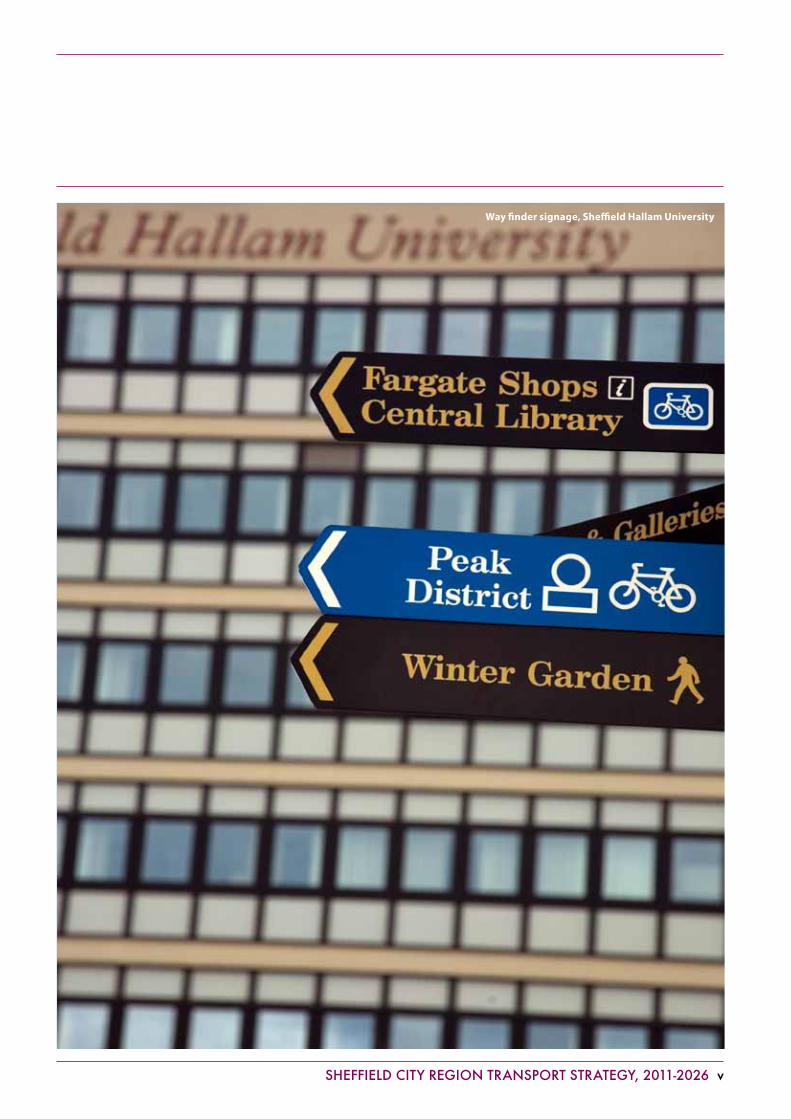
Way finder signage, Sheffield Hallam University
vi Sheffield City Region tRanSpoRt StRategy, 2011-2026
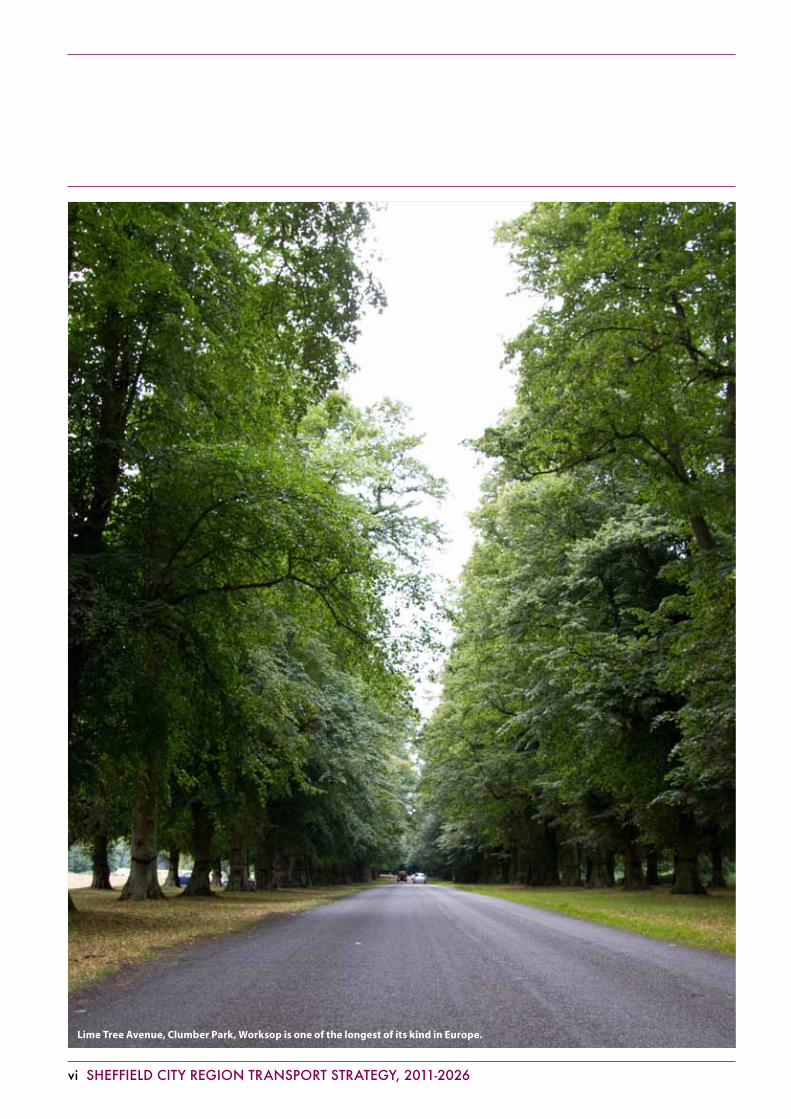
Lime Tree Avenue, Clumber Park, Worksop is one of the longest of its kind in Europe.
Sheffield City Region tRanSpoRt StRategy, 2011-2026 vii
1. intrOductiOnThis strategy ........................................................................................ 1Partnership .......................................................................................... 2Structure ............................................................................................... 4
2. Our VisiOnPast, present and future .................................................................. 5The Role of Transport ....................................................................... 8Cross-Cutting Topics ...................................................................... 10Our Achievements .......................................................................... 11
3. the eVidenceIntroduction ...................................................................................... 13Our Networks ................................................................................... 15Patterns of Travel ............................................................................. 17Our Challenges ................................................................................. 21Travel by car .......................................................................................22Travel by train and tram ................................................................ 27Travel by bus ..................................................................................... 33Walking and cycling .......................................................................38
4. suppOrting ecOnOmic grOwthIntroduction ...................................................................................... 43Improving Connectivity ................................................................44Supporting Regeneration ............................................................ 53Linking People to Jobs .................................................................. 62Conclusion .........................................................................................65
5. enhancing sOcial inclusiOn and healthIntroduction ......................................................................................69Local public transport ...................................................................69Travel for recreation and tourism .............................................. 74Conclusion ......................................................................................... 75
6. reducing emissiOnsIntroduction ......................................................................................77Vehicle efficiency ............................................................................. 78Informed travel choices ................................................................ 79Energy use and generation .........................................................82Air quality ...........................................................................................83Conclusion .........................................................................................84
7. maximising safety Introduction ......................................................................................85Safer Roads ........................................................................................85Public transport safety .................................................................. 87Conclusion .........................................................................................88
8. OutcOmes and mOnitOringIntroduction ......................................................................................89Outcomes ...........................................................................................89Monitoring .........................................................................................90
glOssary................................................................................................................94
ContentS
The maps shown in this document are reproduced from Ordnance Survey material with the permission of Ordnance Survey on behalf of the Controller of Her Majesty’s Stationery Office © Crown Copyright. Unauthorised reproduction infringes Crown copyright and may lead to prosecution or civil proceedings. SYPTE 100030252 2010


Sheffield City Region tRanSpoRt StRategy, 2011-2026 1
this strategy
1.1. Sheffield City Region (SCR) is an area comprising the whole of South Yorkshire, parts of Derbyshire and Nottinghamshire, and the Peak District National Park. This document presents the Transport Strategy for SCR for the next 15 years.
1.2. Good transport is a key feature of a vibrant area where people want to live, work, study and do business. A transport system that offers people and businesses a choice of quick, reliable and integrated connections is vital for SCR’s prosperity.
1.3. Building on its strong industrial legacy, SCR has recently gone through an impressive transformation into a centre of excellence in a number of sectors, including creative and digital media, logistics, advanced manufacturing and engineering. In parallel, SCR’s authorities have been striving to tackle unemployment by raising skill levels and attracting inward investment. As a result, SCR experienced significant growth over the last decade, and continuously reduced its level of unemployment from above 9% in the late 1990’s to less than 3% from 2004 to 20071.
1.4. Yet, the recent economic recession across the UK has brought this economic growth to a halt, and the gap between unemployment in SCR and the national average has begun to grow again2. SCR does do not want to lose what has been gained over a decade of recovery and wise investment. This Transport Strategy aims to build on this recent success to resume SCR’s transformation and assist in continuing its growth.
1.5. Figure 1.1 presents the nine districts in SCR. SCR was defined this way because there is clear evidence that these nine districts function together as a joint and coherent economic area3. This is supported by Figure 1.2, which shows a breakdown of the destinations of commuting trips in SCR by district. Almost 90% of commuting trips of SCR residents are within the SCR boundaries.
1. intRoduCtion
0 2010
Kilometers
Doncaster
Sheffield Rotherham
Barnsley
Chesterfield
Bassetlaw
Bolsover
Derbyshire Dales
N.E.Derbyshire
Figure 1.1 The Sheffield City Region
Figure 1.2 Destination of commuting trips in Sheffield City Region by district
1 Sheffield City Region, (2010), Strategic Economic Assessment, page 312 Sheffield City Region, (2010), Strategic Economic Assessment, page 323 ARUP, (2010), Sheffield City Region DaSTS Connectivity Study

2 Sheffield City Region tRanSpoRt StRategy, 2011-2026
1.6. The SCR Transport Strategy is the first part of the Third Local Transport Plan (LTP3) for South Yorkshire. The second part of the LTP3 is an implementation plan, which we present in a separate document. While the strategy specifies our key priorities at a high level, the implementation plan describes in more detail how we will turn the strategy into reality in the first few years of its delivery. The plan is also underpinned by annual delivery programmes. This hierarchy is illustrated in Figure 1.3.
1.7. Our LTP3 also includes a series of documents that summarise a large body of evidence collected during the development of the strategy. These documents form an appendix to the strategy, and are available to view on the SCR and South Yorkshire websites, www.sheffieldcityregion.org.uk and www.southyorks.gov.uk.
partnership
1.8. The way decisions about local issues are made in England is going through a major change. New governance structures that were originally introduced in the Local Transport Act (2008) are further enhanced by the current government’s ‘localism’ agenda. Strategic transport planning in South Yorkshire is led by its Integrated Transport Authority (ITA), and the new Local Enterprise Partnership (LEP) will now be involved in aspects of transport planning related to the development and growth of the entire SCR.
1.9. Alongside the ITA and LEP, a whole range of bodies in SCR is continuously engaged in transport issues, including the district councils, community representatives, local services and businesses, rail and bus operators and more. This strategy has been developed through continuous partnership working, involving all these parties as well as the general public. Figure 1.4 shows how the process of developing this strategy involved our different partners.
Transport Strategy
Implementation Plans
Delivery Programmes
The Arcade, Barnsley
Figure 1.3 Sheffield City Region Transport Strategy hierarchy

Sheffield City Region tRanSpoRt StRategy, 2011-2026 3
1.10. It is important to note that SCR does not form a single administrative authority; South Yorkshire, Derbyshire and Nottinghamshire have the responsibility to fund improvements to their respective transport systems. Transport improvements in the SCR districts that lie outside South Yorkshire are also covered in the strategies of their respective counties. There is therefore a degree of geographical overlap between these different strategies, but we have worked together with partners in Derbyshire and Nottinghamshire to ensure that the strategies are consistent with each other.
1.11. Unlike the Transport Strategy, which covers the broad SCR based on its economic functionality, separate implementation plans are prepared for South Yorkshire, Derbyshire and Nottinghamshire. Again, authorities across these areas work in partnership to ensure consistency between these plans in cases where priorities are shared.
1.12. Due to its strong economic links to West Yorkshire, Barnsley also forms part of the Leeds City Region, and is therefore also covered by the Leeds City Region Transport Strategy. Nevertheless, as one of the four South Yorkshire districts, Barnsley’s transport priorities are fully addressed in the SCR strategy presented here and the SY implementation plan.
Sheffield City Region
South Yorkshire
Derbyshire
Nottinghamshire
Key to Activities
Barnsley
Doncaster
SY LTP2
Sheff
ield
City
Decis
ion
made
tohave
LTP
3fo
rS
outh
York
shir
e
Overlapping Strategies
North Nottinghamshire LTP3
Derbyshire LTP3
2011
/12
Delivery
Pro
gra
mm
e
Dra
ft2011
/12
-2014/1
5
Dra
ftS
trate
gy
Rotherham
Sheffield
Chesterfield
DerbyshireDales
NE Derbyshire
Bassetlaw
Bolsover
Fin
al2011
/12
-2014/1
5
Fin
al
Sta
kehold
er
Imple
menta
tion
Pla
n
Imple
menta
tion
Pla
n
Regio
n
SC
RTra
nsport
Str
ate
gy
Leeds City Region Transport StrategyLeeds City Region
Futu
reIm
ple
menta
tion
Pla
ns
and
Delivery
Pro
gra
mm
es
esta
blishes
functional
Peak District National Park Management Plan
Str
ate
gic
Envir
onm
enta
l
Assessm
ent
Yo
uAre H
ere
requir
ed
by
law
form
ed
econom
icare
a
EvidenceBase
LEPformed
consultation
Nort
hern
Way
Stu
dy
Publicconsultation S
trate
gy
Rath
er
than
SY
Figure 1.4 Sheffield City Region Transport Strategy development process

4 Sheffield City Region tRanSpoRt StRategy, 2011-2026
1.13. Other important partnerships have been formed with our neighbouring areas, either formally or informally, as illustrated in Figure 1.5. Cross-boundary working with our neighbours in West Yorkshire, Greater Manchester and the Humber is particularly focused on rail improvements, integrated ticketing and joint lobbying for closing the economic gap between the North and the South.
structure
1.14. We begin setting out the strategy in chapter 2 by outlining the vision partners have for SCR and the role of transport in contributing to this. We then set out the goals for transport that stem from the vision.
1.15. Chapter 3 summarises the substantial amount of evidence we have gathered on the challenges facing SCR from a transport perspective, linking them directly to our goals. This includes analysis of our transport networks, issues they face now and problems they are expected to experience in the future.
1.16. Chapters 4 to 7 form the core of the strategy. They are organised around the goals presented in Chapter 2. For each goal, we present a series of policies which we have designed in order to address the challenges discussed in Chapter 3.
1.17. Chapter 8 then outlines how we will monitor the delivery of the strategy.
We collaborate on:* Rail improvements* SCR Transport StrategyWe collaborate on:
* Rail improvements* SCR Transport Strategy
We collaborate on freight and logistics
Hull and HumberCity Region
Nottinghamshire Derbyshire
Manchester City Region
Leeds City Region
Peak DistrictNational Park
Sheffield City Region
We collaborate on:* Rail improvements* Bus reforms
We collaborate on:* Rail improvements* Integrated public transport ticketing* Travel information
Figure 1.5 Sheffield City Region partnerships with neighbouring areas

Sheffield City Region tRanSpoRt StRategy, 2011-2026 5
past, present and future
2.1. SCR is an area of a strong local culture, and it takes great pride both in its past and in its present. It has a history at the very forefront of the UK industrial and entrepreneurial development, and a tradition of specialism in steel production, manufacturing and mineral mining. The brand identification ‘’Made in Sheffield’’ is known worldwide as a symbol of product quality and manufacturing excellence.
2.2. Technological changes, global economic processes and political trends in the 1970’s and 1980’s have seen the area losing 170,000 jobs in the steel production, traditional manufacturing and mineral extraction industries4. However, from the 1990’s SCR has been determinedly building on its history and tradition when adapting itself to the changing markets.
2.3. SCR has recently demonstrated impressive growth in advanced production of metals and precision engineering5. Rotherham, for example, has been establishing its reputation as a centre of 21-century manufacturing technologies6, and is home to plants producing steel for Renault Formula One, Airbus and other first-rate clients. The Advanced Manufacturing Park in Rotherham has attracted 31 major companies, including Rolls Royce and Castings Technology International.
2.4. Alongside this, SCR has developed new enterprises based on creativity, innovation, IT services and digital media development; prominent examples are the Digital Media Centre in Barnsley and the Tapton Park Innovation Centre in Chesterfield. As a result, SCR is developing particular capabilities in the areas of e-learning, games development, semiconductor design, automation and industrial process monitoring7.
2.5. Another sector in which SCR has grown in strength is logistics and warehousing. Doncaster hosts major distribution centres for retailers such as Next, Tesco, Ikea, Amazon and many others; other logistics centres have developed around Chesterfield and Worksop. Activity in additional highly-specialised sectors, such as training in aircraft maintenance, has commenced around the Robin Hood Airport.
2.6. The success of different business sectors has led SCR to grow, over the last decade, faster than the national average8, with a rise in its population, in the number of employees, in its gross value added (GVA) output and in its productivity.
2.7. The recovery of SCR is evident not only in the modernisation of its business sectors but also in its efforts to regenerate and redevelop its built environment. SCR districts have been continuing to enhance the attractiveness of their centres and provide a range of leisure opportunities. In Doncaster, for example, this continued transformation is manifested by a modern shopping centre combined with a transport interchange, and a new community stadium.
2.8. Universities in SCR have developed a strong business orientation, with a range of close collaborations with partners in the local industries. They have made SCR become well-known for its vigorous student life, and gave it one of the highest post-university retention rates in the UK9.
The Peace Gardens, Sheffield
2. ouR viSion
4 Sheffield City Region, (2010), Strategic Economic Assessment, page 255 Sheffield City Region, (2010), Strategic Economic Assessment, page 686 Department of Trade and Industry, (2001) Business Clusters in the UK - A First Assessment7 http://www.creativesheffield.co.uk/ (last accessed 01st Dec 2010)8 Sheffield City Region, (2010), Strategic Economic Assessment, page 259 http://www.shu.ac.uk/university/campuses.html (last accessed 01 Dec 2010)
6 Sheffield City Region tRanSpoRt StRategy, 2011-2026
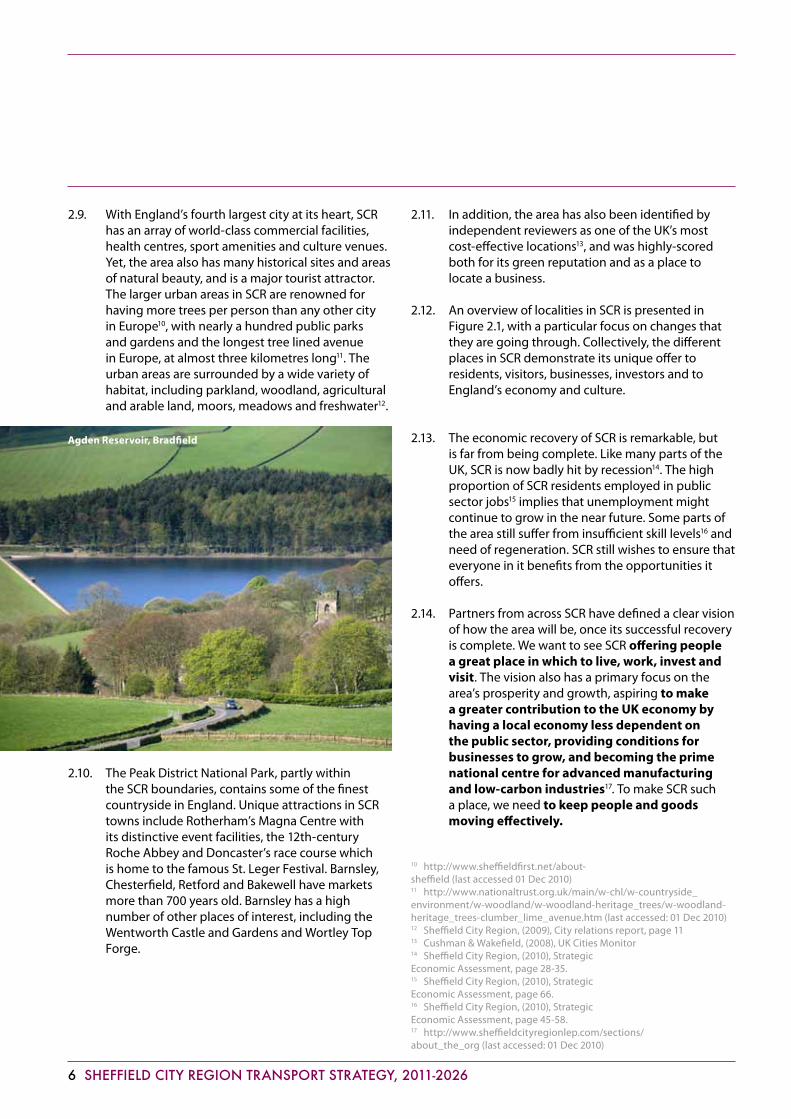
2.9. With England’s fourth largest city at its heart, SCR has an array of world-class commercial facilities, health centres, sport amenities and culture venues. Yet, the area also has many historical sites and areas of natural beauty, and is a major tourist attractor. The larger urban areas in SCR are renowned for having more trees per person than any other city in Europe10, with nearly a hundred public parks and gardens and the longest tree lined avenue in Europe, at almost three kilometres long11. The urban areas are surrounded by a wide variety of habitat, including parkland, woodland, agricultural and arable land, moors, meadows and freshwater12.
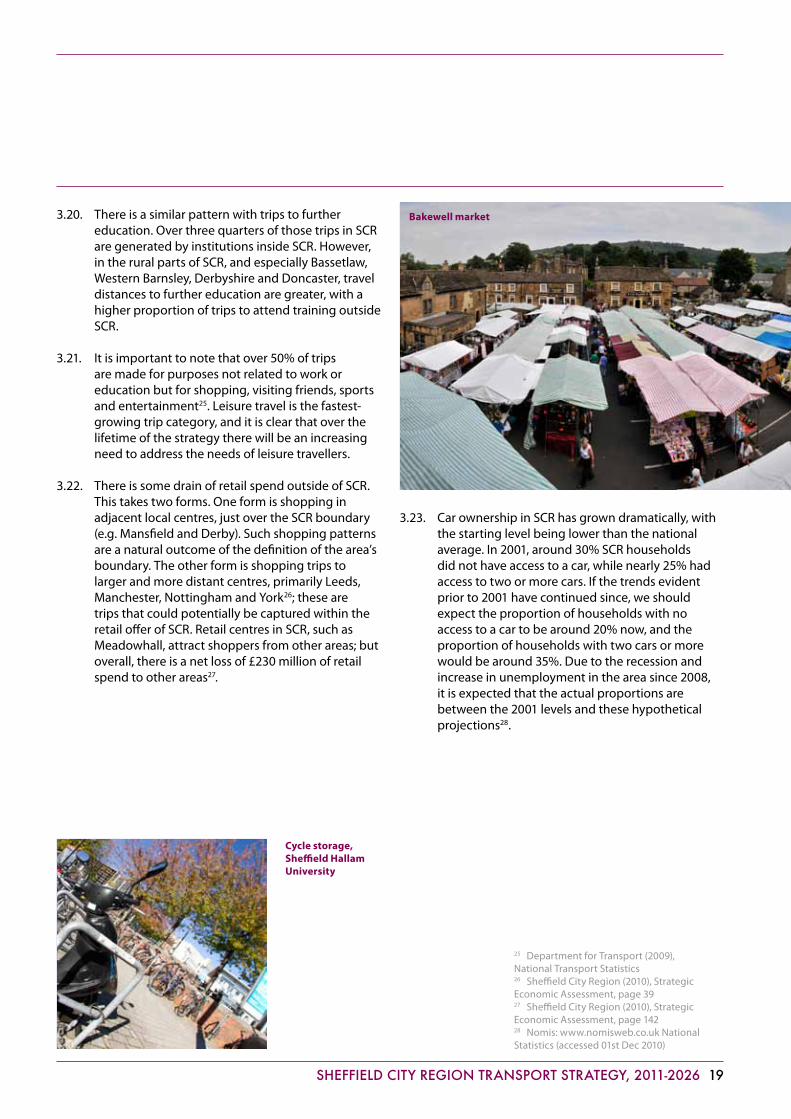
2.10. The Peak District National Park, partly within the SCR boundaries, contains some of the finest countryside in England. Unique attractions in SCR towns include Rotherham’s Magna Centre with its distinctive event facilities, the 12th-century Roche Abbey and Doncaster’s race course which is home to the famous St. Leger Festival. Barnsley, Chesterfield, Retford and Bakewell have markets more than 700 years old. Barnsley has a high number of other places of interest, including the Wentworth Castle and Gardens and Wortley Top Forge.
2.11. In addition, the area has also been identified by independent reviewers as one of the UK’s most cost-effective locations13, and was highly-scored both for its green reputation and as a place to locate a business.
2.12. An overview of localities in SCR is presented in Figure 2.1, with a particular focus on changes that they are going through. Collectively, the different places in SCR demonstrate its unique offer to residents, visitors, businesses, investors and to England’s economy and culture.
2.13. The economic recovery of SCR is remarkable, but is far from being complete. Like many parts of the UK, SCR is now badly hit by recession14. The high proportion of SCR residents employed in public sector jobs15 implies that unemployment might continue to grow in the near future. Some parts of the area still suffer from insufficient skill levels16 and need of regeneration. SCR still wishes to ensure that everyone in it benefits from the opportunities it offers.
2.14. Partners from across SCR have defined a clear vision of how the area will be, once its successful recovery is complete. We want to see SCR offering people a great place in which to live, work, invest and visit. The vision also has a primary focus on the area’s prosperity and growth, aspiring to make a greater contribution to the UK economy by having a local economy less dependent on the public sector, providing conditions for businesses to grow, and becoming the prime national centre for advanced manufacturing and low-carbon industries17. To make SCR such a place, we need to keep people and goods moving effectively.
Agden Reservoir, Bradfield
10 http://www.sheffieldfirst.net/about-sheffield (last accessed 01 Dec 2010)11 http://www.nationaltrust.org.uk/main/w-chl/w-countryside_environment/w-woodland/w-woodland-heritage_trees/w-woodland-heritage_trees-clumber_lime_avenue.htm (last accessed: 01 Dec 2010)12 Sheffield City Region, (2009), City relations report, page 1113 Cushman & Wakefield, (2008), UK Cities Monitor14 Sheffield City Region, (2010), Strategic Economic Assessment, page 28-35.15 Sheffield City Region, (2010), Strategic Economic Assessment, page 66.16 Sheffield City Region, (2010), Strategic Economic Assessment, page 45-58.17 http://www.sheffieldcityregionlep.com/sections/about_the_org (last accessed: 01 Dec 2010)

Sheffield City Region tRanSpoRt StRategy, 2011-2026 7
Barnsley
Rotherham
Chesterfield
Doncaster
Retford
DearneValley
Bakewell
Worksop
Sheffie ld
Peak DistrictNational Park
Matlock
Bolsover
Clay Cross
Ashbourne
Chesterfield: SCR’slargest town in the EastMidlands, anemployment centre witha high-quality urban coreand opportunities forfurther potential growthalong the A61 and in theStaveley area.
Worksop: a towndeveloping a diverseeconomic base, with anumber of key visitorattractions such asClumber Park andSherwood Forest.
There are a number of free-standing towns, villages andservice centres thatcontribute to the diversenature of the city region.Many of these places containlocal services and uniqueassets, such as ChatsworthHouse in Derbyshire, whichattracts over one millionvisitors per year.
W
Barnsley: a borough with strongeconomic links to both SCR andthe Leeds City Region, whichregenerates itself as a 21st-CenturyMarket Town and focuses onimproving skills and offering high-quality housing.
Lower Don Valley andWaverley: an importantemployment area, focusedon manufacturing, with anumber of sports andleisure complexes, and theMeadowhall retail centrewhich attracts 20 millionvisitors per year.
Sheffield: the 4th largestcity in England, and amajor centre ofengineering, creative anddigital industries, with awide variety of cultureand retail facilities.
SCR key facts
Rotherham: a boroughproud of its industrialheritage, which hasalready developedstrengths in neweconomic sectors, aspart of SCR’sregeneration.
Doncaster: a boroughwith a high-quality urbancentre, attractive retailopportunities andexcellent rail links, hometo the Robin Hood Airportwhich is a major assetboth as an internationalgateway and as an aero-related employment andtraining centre.
Retford: a townbenefiting from astrategic location on thenational railway networkand strong economiclinks to Nottingham,Lincoln and Newark.
The Dearne Valley: a formercoalmining area which is goingthrough a major transformation,providing an inspiring example toother areas through itsenvironmental vision.
Area 3500 squared km
Population 1.75 million
Employment 770,000
Gross Value Added £25 billion
Markham Vale andMeden Valley: an arearecently developedwith plans to establishitself as a majoremployment hub.
Photograph by DarylGodfrey
Peak District National Park: an important tourist attraction, offering some of the finest countryside in the country, while also being home to the town of Bakewell and some beautiful villages.
Bolsover: a former coalmining area which is now building on its location on the M1 to develop business parks and attract visitors to the Creswell Model Village, Bolsolver Castle and Creswell Crags.
Figure 2.1 Overview of places in the Sheffield City Region
Barnsley
Rotherham
Chesterfield
Doncaster
Retford
DearneValley
Bakewell
Worksop
Sheffie ld
Peak DistrictNational Park
Matlock
Bolsover
Clay Cross
Ashbourne
Chesterfield: SCR’slargest town in the EastMidlands, anemployment centre witha high-quality urban coreand opportunities forfurther potential growthalong the A61 and in theStaveley area.
Worksop: a towndeveloping a diverseeconomic base, with anumber of key visitorattractions such asClumber Park andSherwood Forest.
There are a number of free-standing towns, villages andservice centres thatcontribute to the diversenature of the city region.Many of these places containlocal services and uniqueassets, such as ChatsworthHouse in Derbyshire, whichattracts over one millionvisitors per year.
W
Barnsley: a borough with strongeconomic links to both SCR andthe Leeds City Region, whichregenerates itself as a 21st-CenturyMarket Town and focuses onimproving skills and offering high-quality housing.
Lower Don Valley andWaverley: an importantemployment area, focusedon manufacturing, with anumber of sports andleisure complexes, and theMeadowhall retail centrewhich attracts 20 millionvisitors per year.
Sheffield: the 4th largestcity in England, and amajor centre ofengineering, creative anddigital industries, with awide variety of cultureand retail facilities.
SCR key facts
Rotherham: a boroughproud of its industrialheritage, which hasalready developedstrengths in neweconomic sectors, aspart of SCR’sregeneration.
Doncaster: a boroughwith a high-quality urbancentre, attractive retailopportunities andexcellent rail links, hometo the Robin Hood Airportwhich is a major assetboth as an internationalgateway and as an aero-related employment andtraining centre.
Retford: a townbenefiting from astrategic location on thenational railway networkand strong economiclinks to Nottingham,Lincoln and Newark.
The Dearne Valley: a formercoalmining area which is goingthrough a major transformation,providing an inspiring example toother areas through itsenvironmental vision.
Area 3500 squared km
Population 1.75 million
Employment 770,000
Gross Value Added £25 billion
Markham Vale andMeden Valley: an arearecently developedwith plans to establishitself as a majoremployment hub.
Photograph by DarylGodfrey
Peak District National Park: an important tourist attraction, offering some of the finest countryside in the country, while also being home to the town of Bakewell and some beautiful villages.
Bolsover: a former coalmining area which is now building on its location on the M1 to develop business parks and attract visitors to the Creswell Model Village, Bolsolver Castle and Creswell Crags.

8 Sheffield City Region tRanSpoRt StRategy, 2011-2026
the rOle Of transpOrt
2.15. This strategy is about the role of transport in making this wider vision happen. SCR already has a comprehensive transport system, situated at the heart of England’s road and rail networks. Public transport has played an important role in the area’s history.
2.16. Yet, transport in SCR has to further improve in order to meet the needs of different types of travellers and businesses. Our transport system needs to help people get around easily and effectively, and enable them to become economically, socially and physically active if they wish to. Figure 2.2 illustrates some of the opportunities for transport improvements to lead SCR’s way into the future. The plans and ideas summarised in this figure are further explored later in this document.
2.17. Our vision for SCR, which we presented earlier, is the basis for our Transport Strategy. To design policies and interventions that will help us make this vision come true, we break it down into several separate elements, which are easier to associate with clear actions. We have defined four separate goals for the SCR transport system.
2.18. Our first and primary goal is for the transport system to support the economic growth of SCR. We see SCR becoming a magnet for investment and business relocation; this requires improved connectivity to local and national destinations by reducing congestion, unreliability and overcrowding. SCR is set for major regeneration and redevelopment; this calls for providing new transport links as well as improving townscape in some places. We are determined to enable everyone in SCR to enjoy the benefits of employment and education; this entails making such opportunities easily accessible to those seeking them.
2.19. Our second goal is for the transport system to enhance social inclusion and health. The transport system needs to ensure that people in all parts of SCR have access to a variety of activities, paying particular attention to those who cannot easily afford their travel, to people who do not have access to a car and to those with other special needs. Transport improvements are necessary to provide good access to medical, social and community services. People’s travel habits have a direct impact on their health, and we therefore intend to further encourage active means of travel so that people can remain fit for whatever activities they choose to take part in.
2.20. Our third goal is to reduce the emissions from vehicles, since they lead to air pollution and climate change. We mean to create a culture whereby people are happy to make sustainable travel choices and where economic prosperity goes hand-in-hand with carbon efficiency. We also intend to promote sustainability by establishing an integrated approach to transport and land use planning.
2.21. Our fourth goal is to make transport increasingly safe and secure, especially to those who are currently at a higher risk. People should become confident that they can use our transport networks free of harm and that their safety does not depend on which form of transport they use. This will have a direct impact on people’s wellbeing, but also a more indirect benefit in economic terms.
Worksop Market

Sheffield City Region tRanSpoRt StRategy, 2011-2026 9
Barnsley
Rotherham
Chesterfield
Doncaster
Retford
DearneValley
Bakewell
WorksopSheffield
M1A1
M180
Peak DistrictNational Park
A628
A628
Matlock
Bolsover
Clay Cross
M1
Ashbourne
Sustainable access tothe Peak District, incollaboration with theNational Park Authority,will create newconnections for its localresidents while alsoenabling everyone inSCR to use it forleisure and recreation,and boosting our touristindustry.
With improved publictransport along the mainradial corridors andredevelopment of sites atthe heart of the city,Sheffield will continue torenovate its centre as thecommercial and culturalcore of SCR.
Short-termsimprovements to theMidland Main Line,and the introduction ofHigh Speed Rail later,carefully integratedwith local busservices, will makeSCR feel closer toLondon and make it anattractive place forbusiness relocation.
Improved management ofhighways and motorways,through the use of advancedtechnology and the integrationof traffic control systems, willincrease their effective capacityand improve reliability.
Corridors from Chesterfield will benefit frommajor regeneration, including thedevelopment of employment, retail and sportfacilities along the A61 corridor, the RotherValley Integrated Transport Scheme and theChesterfield-Staveley Regeneration Route.This will be accompanied with improvementsto the integration of bus and rail services.
M62
SSSI data ©Natural England copyright 2010.
A1
Higher awareness of thebenefits of walking andcycling, when making ashort trip within town, willreduce congestion, protectthe environment, make ourstreets livelier and improvepeople's health.
KEY
0 2010
Kilometres
Passenger Rail LinesNational Road Network
Hilly areas (over 100m)Larger Sites of SpecialScientific Interest (SSSI)Peak District National Park
Urban Areas
Accessibility ImprovementZone
The Robin Hood Airport willexpand its services as SCR'sprimary internationalgateway. Easier access tothe airport by both road andpublic transport will open upopportunities fordevelopment in thesurrounding area.
Doncaster and Bassetlaw willexperience improvements on the EastCoast Main Line, including highercapacity and speed of services toLondon, York, Newcastle and Scotland.The area will also see the creation of anationally-significant freight andlogistics hub which would bring newemployment opportunities to the area.
W© Crown Copyright. All rights reserved SYPTE 100030252 2010
Connectivity along the Lower Don Valley will be strengthened by Bus Rapid Transit, serving Rotherham’s vibrant town centre. In Waverley and the Advanced Manufacturing Park we will demonstrate the principle of prioritising development adjacent to high-quality public transport corridors.
Improved passenger and freight links to neighbouring City Regions will strengthen our economy and create new business opportunities. Barnsley will enjoy its dual role inboth SCR and the Leeds City Region. Joint efforts by both City Regions will focus on investment in the Accessibility Improvement Zone, for example by developing housing around railway stations.
The Dearne Valley will benefit from superb environmental quality and high quality of life through the application of its eco-vision.
Figure 2.2 The role of transport in the Sheffield City Region

10 Sheffield City Region tRanSpoRt StRategy, 2011-2026
2.22. The four goals are summarised in Figure 2.3, alongside the need to keep people and goods moving effectively, which derives directly from our vision and is common to all goals. The four colours used in the figure can be followed throughout this document to track the discussion and development of each of the four goals.
Figure 2.3 Our goals
crOss-cutting tOpics
2.23. At the heart of this document we present a set of 26 policies, A to Z, which define the nature of the improvements we will introduce to our transport system over the coming 15 years. We split the policies into four sections that correspond to our four goals. To keep the structure of the strategy simple, each policy is associated with a single goal, but most policies also have clear links to the other goals.
2.24. When developing the policies, several topics repeatedly came up as crossing the boundaries between goals. Throughout the strategy we use these cross-cutting topics to highlight areas of overlap between our goals and to illustrate that the strategy is founded upon consistent principles. The four topics are presented below.
2.25. The first cross-cutting topic is the need to squeeze more from our existing assets. Pressure on budgets is increasing since public sources of funding are currently being cut, to reduce the UK national debt. In the first years of the lifespan of this strategy it will therefore be essential to ensure that what we already have is used efficiently, and to enable extracting more capacity from existing transport infrastructure. Our approach to the effective management of our assets is further described in the implementation plan.
2.26. A second cross-cutting topic is the need to ensure that our growth is sustainable. Economic growth is the primary goal of this strategy, and sustainability is explicitly covered by our goal to reduce emissions; but when prioritising transport interventions, there are sometimes conflicts between the economic and environmental agendas. We introduce the topic of sustainable growth so that throughout the strategy we can emphasize our choice of policies that combine the two goals, and thus achieve economic prosperity while maintaining a minimum impact on the environment over time.
2.27. A third cross-cutting topic is our desire to give people choice. To offer people and businesses in SCR a high quality of life, we need to provide them with a range of transport links and services to match their chosen lifestyle.
To support economic growth
To keep people and goods moving effectively
To reduce emissions
To enhance social inclusion
and health
To maximise safety
St George’s Minster from the waterfront, Doncaster

Sheffield City Region tRanSpoRt StRategy, 2011-2026 11
2.28. A fourth cross-cutting topic is our aspiration to encourage a cultural change. The analysis we present later shows that improved infrastructure is critical, but not sufficient, to achieve our goals. Through supporting a cultural change and a shift from traditional travel habits we can help our economy become more competitive and our society healthier.
2.29. The four topics are represented throughout this strategy using icons, as identified in Figure 2.4. The four icons can be followed throughout this document to track the discussion and development of each of the four topics.
Figure 2.4 Cross-Cutting Topics
Squeezing more from our existing assets
Ensuring our growth is sustainable
Giving people choice
Encouraging a cultural change
Our achieVements
2.30. This strategy builds on a strong track record of delivering successful improvements to our transport system over the last decade. We present some of our achievements in Figure 2.4.
2.31. The breakdown of these achievements by goal,
and the allocation of icons by topic, are clearly very simplified, since in practice there are many overlaps between them. However, we use this presentation to remind of the added value of our interventions.
Figure 2.4 Our achievements
Supporting Economic GrowthAn award-winning Sheffield Station and city gateway, re-opened in 2006, described as ‘world class’ in a recent Government review18.
A major package of improvements to Doncaster Main Line station and interchange, which is now included in the same list of ‘world class’ stations.
High quality public realm schemes in our urban centres, including the award-winning Streetpride in Rotherham and the Gold Route in Sheffield.
A new transport interchange for Barnsley in 2007, and work underway to transform Rotherham railway station.
The improvement of rail frequency to London (via Chesterfield) to a half-hourly service in 2009. This is a result of SCR partners working together to lobby for the improvement and to assemble a funding package with rail operators.
The Sheffield-Barnsley-Leeds fast rail service, launched in 2004, and the Nottingham- Sheffield-Barnsley-Leeds service, launched in 2008.
Barnsley has seen steady growth in bus patronage. In 2009/10, bus demand in Barnsley demonstrated a 3.6% annual growth.
Opening up the Dearne Valley regeneration area via a link road, as part of the Objective 1 programme; congestion hotspot schemes, key route officers and other management measures to improve network reliability.
Peel Holdings opened the Robin Hood Airport Doncaster-Sheffield Airport in April 2005, featuring the longest runway in the North, and carrying over 1m passengers in 2007.
Congestion relief measures on 18 key routes in South Yorkshire, having a steady effect in reducing journey times.
Dodworth Bypass, Cudworth and West Green Bypass, and Coalfields link road have all enhanced connectivity to employment sites and opened up opportunities for future development.
Junction 29a on the M1 was completed in 2008 and provided access to the Markham Vale regeneration area, which includes a business park to provide 5000 new jobs.
New road link between Grimethorpe and nearby job opportunities was one of the success drivers of regeneration in the village. Over 1000 jobs and homes were created. Grimthorpe’s regeneration and economic recovery have been acclaimed by the Homes and Community Agency (HCA) Awards 2010.
18 Department for Transport, (2009), Better Rail Stations, page 47 & 62

12 Sheffield City Region tRanSpoRt StRategy, 2011-2026
Enhancing Social Inclusion and Health The country’s first Statutory Quality Bus Partnerships between authorities and bus companies introduced in North Sheffield and now in Barnsley, leading to increased patronage and better buses.
New bus services to serve green spaces, and the use of accessibility criteria to prioritise the provision of public transport to key services.
Supported bus services where commercial services are withdrawn by operators.
Since 2006, over 9,000 year 5 and 6 schoolchildren throughout South Yorkshire received Bikeability cycle training to level 2 standards. This means they have the skills required to make a safe trip to school or leisure activities on quiet roads.
As per January 2010, a 66% increase in cycle use in Sheffield, based on a 2001 baseline, and a reduction in cycle accidents by 10% despite the increase in cycle use.
As per July 2010, approximately 20 Walking Buses are running in Sheffield, and 9 in Rotherham, providing safe walking access to schools.
Over 80% of our buses are now low-floor and accessible to all. Combined with our supported bus services, this has given much improved levels of transport accessibility for our citizens.
Reducing EmissionsThe levels of walking across the Sheffield city centre increased 21% between 2006 and 2009.
Investment in cycling lanes and signage, including 23 kilometres of national cycle network in Rotherham, alongside the Bike-It scheme in Doncaster and the Bike Boost scheme in Sheffield. These have led to a 43.1% increase in cycling levels across South Yorkshire from 2003/04.
Authorities across SCR have risen to the challenge of setting ambitious carbon targets and setting out carbon reduction delivery plans. Sheffield, for example, has committed to reducing carbon of 30% from 2005 to 2020.
The ECO Stars (Efficient and Cleaner Operations) scheme was launched in 2009 to educate professional drivers to be more aware of the environmental implications of their driving styles. The scheme now covers 19 member organisations, operating approximately 4,600 vehicles in the area. Other ongoing awareness programmes include Carbon Quids and Care4Air.
The move towards more environmentally friendly buses has led to more than 50% of the fleet operating services in South Yorkshire having engines which meet the requirements of Euro III or above.
The Sheffield City Council has been working continuously to promote the introduction of Low Carbon Vehicles (LCV). This has included a trial of 10 Compressed Natural Gas (CNG) vehicles with temporary fuelling stations, aiming to promote long-term use of LCVs and introduce permanent refuelling infrastructure.
Maximising SafetyStrong focus on tackling the worst collision hotspots first, leading to falling casualty rates. 2009 was all-time low record in this area, with a 28% decrease to 530 people Killed or Seriously Injured since the late 1990’s.
Many initiatives involving road safety education, training, and publicity. For example, the Theatre in Education programme, which explores various aspects of road safety, has reached nearly 6000 children in Doncaster, and over 4000 people have benefited from cycle training in 2009.
The number of KSI as a result of road traffic collisions in the Derbyshire districts of SCR has reduced to 37% below a 1995-98 baseline. The number of children KSI is 50% below this baseline.
Targeted improvements for major maintenance schemes, such as on Centenary Way in Rotherham.
Reported safety incidents on buses went down by 14% from 2008 to 2009.
Safety campaign has resulted in a 22% reduction in the number of incidents of shelter damage in Barnsley, Rotherham, Doncaster and Sheffield.
The Crucible Theatre, Sheffield

Sheffield City Region tRanSpoRt StRategy, 2011-2026 13
intrOductiOn
3.1. In the previous chapter we have defined our four goals for the transport system in SCR and presented some of the key achievements already made in meeting these goals. Transport in SCR does, however, still face many challenges, which we review in this chapter. Identifying the main challenges has played an important role in the process of agreeing how to tackle them.
3.2. We start this chapter by presenting the hierarchy of transport networks in SCR, including some definitions which we use later in the chapter when analysing the performance of these networks. We then discuss patterns of travel demand in SCR. At the core of this chapter we list issues currently faced by the transport system throughout SCR, as well as problems that we expected to see in the future if no action is taken to resolve these issues. We summarise this chapter by showing how the challenges align to the goals we have defined.
3.3. The discussion of current and future challenges is supported by several streams of analysis, collating evidence and forecasting. The entire analysis is presented in the appendices to this strategy; only main findings are brought here. All forecasting work mentioned in this strategy focuses on predictions and projections for 2026, at the end of the 15-year time horizon of our Third Local Transport Plan (LTP3).
3.4. Several different tools have been used for forecasting future problems. Some important parts of the analysis are based on our Urban Dynamic Model, which simulates the interactions between transport and land use in urban and rural areas, including the impact of the performance of the transport system on population and employment growth.
3.5. Another tool that had a critical role in shaping the strategy is our Strategic Transport Model, which is suited for comprehensive analysis of transport supply and demand in SCR, including detailed representation of highway and public transport networks.
3.6. The analysis we present here is primarily based on a combination of these two tools, but the strategy is also informed by a range of other analysis tools, including the Sheffield-Rotherham Transport Model and the local models developed in Doncaster and Barnsley.
3. the evidenCe
Barnsley town centre
14 Sheffield City Region tRanSpoRt StRategy, 2011-2026
BarnsleyDoncaster
Rotherham
Sheffield
Matlock
RetfordWorksop
Bakewell
Ashbourne
Chesterfield
A1
A1
M1
A6
M1
A57
A52
A50
A61
A57
A57
A19
A61
M18
M62
A623
A631
A515
A515
A617
A619
A633
A631
A628
A638
A628
A616
A630
A629
A635
A638M180
A6102 A1(M)
to Hull
to Derby
to Derby
to Selbyto Leeds
to London
to Grimsby
M1 to Leeds
to Manchester
to Nottingham
A1(M) to York A614 to Goole
to Huddersfield
to Stoke-on-Trent
A638 to WakefieldA637 to Huddersfield
This map is based upon Ordnance Survey material with the permission of Ordnance Survey on behalf of the Controllerof Her Majesty's Stationery Office © Crown copyright. Unauthorised reproduction infringes Crown copyright and may lead to prosecution or civil proceedings. SYPTE 100030252 2011
LTP3\Fig 3.1 Transport Network 121110
Key
SY County Boundary
Sheffield City Region
Rail
Freight
Passenger
Roads
'A' Road
Motorway
0 2010
Kilometres
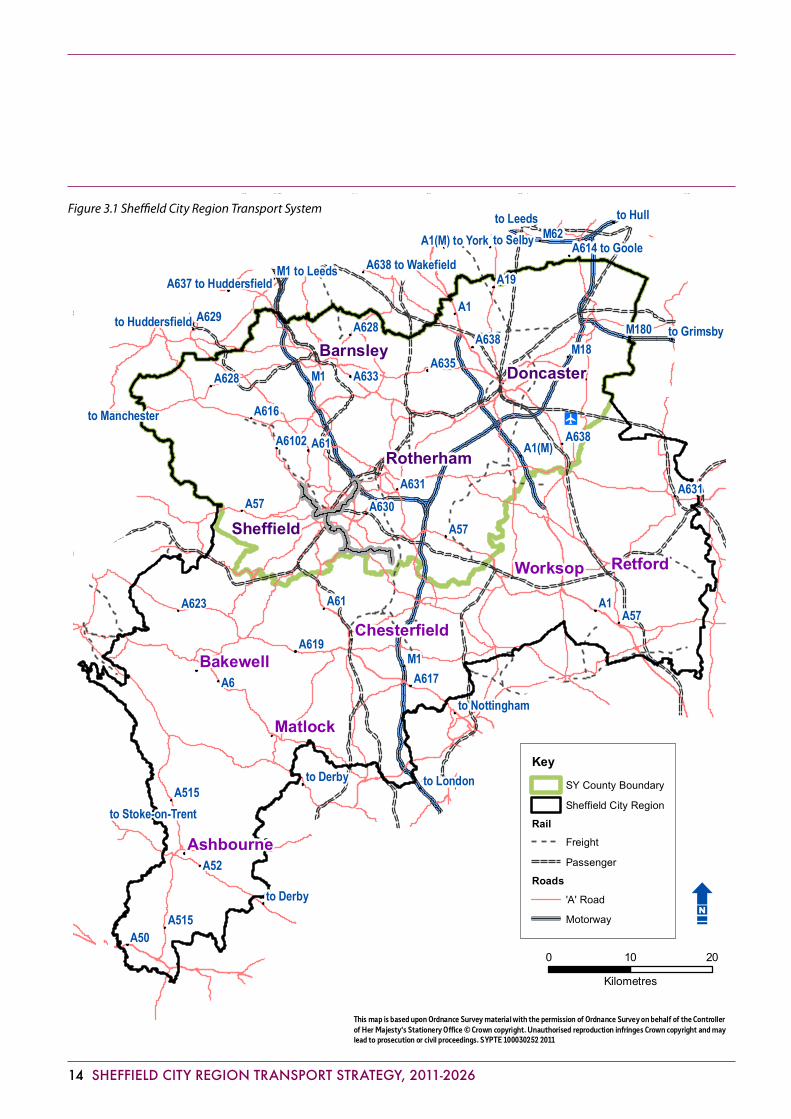
Figure 3.1 Sheffield City Region Transport System
Sheffield City Region tRanSpoRt StRategy, 2011-2026 15
Our netwOrks
3.7. An overview of the SCR transport system is presented in Figure 3.1. Every element of transport infrastructure in SCR forms part of a network. In this section we define a hierarchy of networks that will then be used to discuss separately the performance of each network. The hierarchy includes national, strategic and local networks19, as presented in Figure 3.2.
3.8. The national network includes the entire rail network in SCR, the motorways (M1, M18, M180, A1(M)) and trunk roads (A1, A616, A628). The rail network is managed by Network Rail and the motorway network is managed by the Highways Agency. SCR partners do not have a formal remit to manage those parts of the national network that pass through the area; our role is thus one of working with Network Rail and the Highways Agency to ensure this network meets the needs of SCR.
3.9. The strategic network is managed by SCR authorities, and includes either road or public transport routes that serve multiple purposes, providing critical linkages between urban centres and national networks.
3.10. The strategic road network (i.e. the road routes included in the strategic network) comprises about 12% of the roads in SCR in terms of total road length20, but a much larger proportion in terms of traffic levels. The strategic road network contains those roads where it is most important to manage traffic in order to reduce congestion and improve efficiency. It also includes routes where freight traffic is encouraged and strategic diversion routes, agreed with the Highways Agency for periods when the trunk routes are temporarily closed.
3.11. The strategic public transport network (i.e. the public transport routes included in the strategic network) contains the full tram network and a selection of high-frequency bus services, also known as ‘key bus routes’. The routes in this network often share the same corridors defined above as the strategic road network.
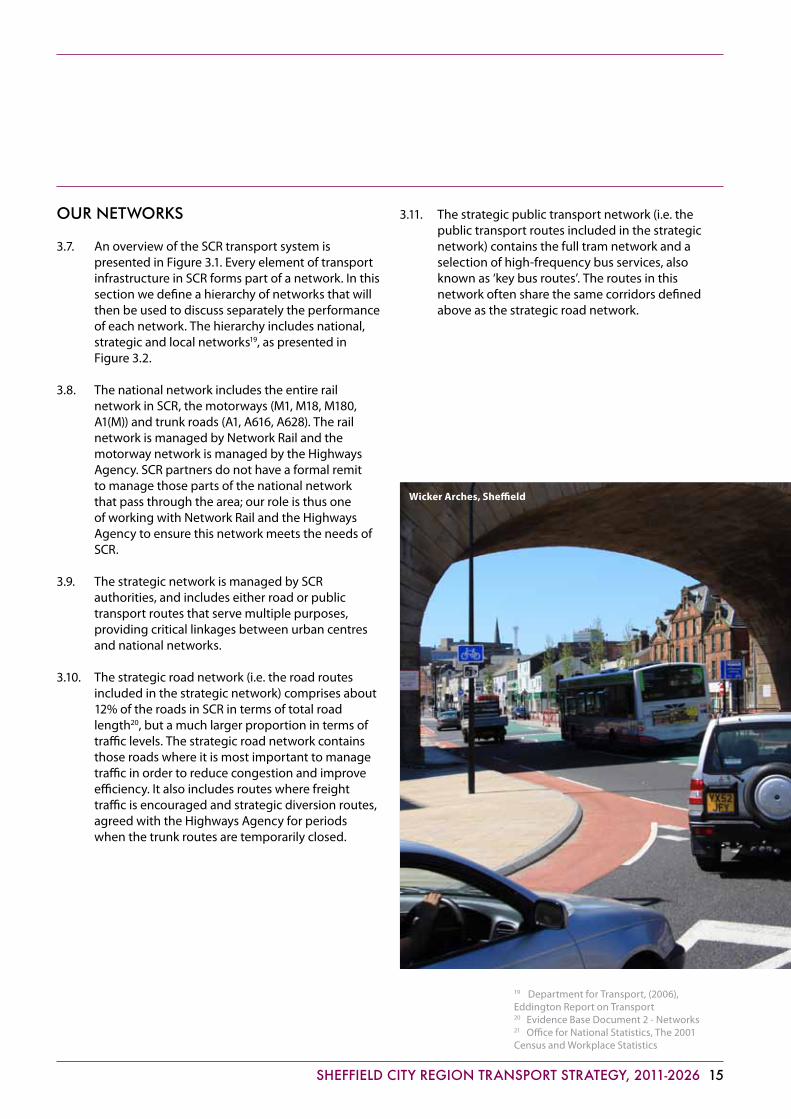
Wicker Arches, Sheffield
19 Department for Transport, (2006), Eddington Report on Transport20 Evidence Base Document 2 - Networks21 Office for National Statistics, The 2001 Census and Workplace Statistics

16 Sheffield City Region tRanSpoRt StRategy, 2011-2026
Robin Hood Airport
Key
Sheffield City Region Boundary
National Network (Road)
National Network (Rail)
Strategic Network (Road)
Strategic Network (Supertram)
'A' Road
LTP3\SCR Key Rte Strategic Network280710
This map is based upon Ordnance Survey material with the permission of Ordnance Survey on behalf of the Controllerof Her Majesty's Stationery Office © Crown copyright. Unauthorised reproduction infringes Crown copyright and may lead to prosecution or civil proceedings. SYPTE 100030252 2010
LTP3\SCRRail gauge 170210 V2
To Wakefield
To Leeds
To Manchester
To Manchester
Doncaster
Sheffield
Rotherham
Barnsley
Chesterfield
Worksop
To Huddersfield
To Grimsby
To Hull & Humber Ports
To Gainsborough
Matlock
Bakewell
Retford
To Newark on Trent
To Nottingham
To Derby
To the South &South East
To York
0 2010
Kilometres
To Lincoln
To Nottingham
3.12. A typical example of a route that belongs to the strategic network due to the multi-purpose nature of its usage is the A61. It is the main commuting route for traffic from Chesterfield, southern Sheffield suburbs and Barnsley into Sheffield; it is the main route from Barnsley to Wakefield and Leeds; it also links retail areas and recreational spaces, and is used by some key bus routes.
3.13. The local network comprises the majority of the road distance in SCR (c. 88%), but much less of its total traffic. This network includes some local bus routes, residential streets and local through routes.
Figure 3.2 Sheffield City Region Transport Networks Hierarchy

Sheffield City Region tRanSpoRt StRategy, 2011-2026 17
patterns Of traVel
3.14. Travel to work patterns in SCR can be analysed from the last two censuses and some complementary sources21. As already presented in chapter 1, over 90% of workers in SCR commute within SCR boundaries. Of the workers who live in SCR, about 70% work within their own district boundaries and 19% commute to other SCR districts. Residents of Bolsover and North East Derbyshire are more likely than elsewhere in SCR to work outside their own district.
3.15. The number of commuting trips in SCR increased by 10% between 1991 and 2001. The average trip distance for all journey types has increased, too, from 10 kilometres in 1995-97 to around 11 kilometres in 2008. Similarly, the average commuting distance was close to 14 kilometres in 20022.
3.16. Evidence suggests that spatial patterns of travel in SCR are increasingly complex and scattered, and no short list of key origin-destination flows can depict the majority of trips. For example, there are about 245,000 journeys to work in Sheffield each day, 85% of which originating within the Sheffield District, but only about 30% have a destination in the city centre23. Although the centre is the largest single destination, which places demands on key radial corridors, the pattern of travel demand is complicated by orbital trips and through trips.
3.17. Commuting flows between SCR districts are displayed in Figure 3.3, and commuting flows from SCR to neighbouring areas are presented in Figure 3.4. Both figures show information based on 2001 Census data.
3.18. Within SCR, the strongest relationship in travel between districts is between Rotherham and Sheffield, with over 33,000 movements each day. As can be seen in Figure 3.3, Sheffield attracts about twice as many trips compared to any other SCR locality, whereas the flows between other districts are more balanced. This suggests a strong relationship between the size of the urban centres and the number of trips attracted to it.
3.19. SCR is a net exporter of labour. As can be seen in Figure 3.4, West Yorkshire has the highest number of commuting trips from SCR (circa 25,000 per day), double the number of commuters in the opposite direction (circa 12,000). Wakefield is the largest provider of employment, followed by Leeds24.
Rotherham town centre
22 Department for Transport (2009), The 2009 National Transport Statistics23 Sheffield City Region Partners (2010), Sheffield City Region DaSTS Connectivity Study Baseline, page 2524 Evidence Base Document 1 - Demographic, Economic and Spatial Overview

18 Sheffield City Region tRanSpoRt StRategy, 2011-2026
1023
42
37
35
22
56
22
12
21
33
31
94
10 3
20
21
Doncaster
Sheffield
Barnsley
Rotherham
Derbyshire Dales
Bassetlaw
Bolsover
Chesterfield
NE Derbyshire
W0 2010
Kilometres
© Crown copyright. All rights reserved SYPTE 100030252
Figure 3.3 Travel to work movements within Sheffield City Region (in thousands)
Sheffield City Region tRanSpoRt StRategy, 2011-2026 19
3.20. There is a similar pattern with trips to further education. Over three quarters of those trips in SCR are generated by institutions inside SCR. However, in the rural parts of SCR, and especially Bassetlaw, Western Barnsley, Derbyshire and Doncaster, travel distances to further education are greater, with a higher proportion of trips to attend training outside SCR.
3.21. It is important to note that over 50% of trips are made for purposes not related to work or education but for shopping, visiting friends, sports and entertainment25. Leisure travel is the fastest-growing trip category, and it is clear that over the lifetime of the strategy there will be an increasing need to address the needs of leisure travellers.
3.22. There is some drain of retail spend outside of SCR. This takes two forms. One form is shopping in adjacent local centres, just over the SCR boundary (e.g. Mansfield and Derby). Such shopping patterns are a natural outcome of the definition of the area’s boundary. The other form is shopping trips to larger and more distant centres, primarily Leeds, Manchester, Nottingham and York26; these are trips that could potentially be captured within the retail offer of SCR. Retail centres in SCR, such as Meadowhall, attract shoppers from other areas; but overall, there is a net loss of £230 million of retail spend to other areas27.
3.23. Car ownership in SCR has grown dramatically, with the starting level being lower than the national average. In 2001, around 30% SCR households did not have access to a car, while nearly 25% had access to two or more cars. If the trends evident prior to 2001 have continued since, we should expect the proportion of households with no access to a car to be around 20% now, and the proportion of households with two cars or more would be around 35%. Due to the recession and increase in unemployment in the area since 2008, it is expected that the actual proportions are between the 2001 levels and these hypothetical projections28.
Bakewell market
Cycle storage, Sheffield Hallam University
25 Department for Transport (2009), National Transport Statistics26 Sheffield City Region (2010), Strategic Economic Assessment, page 3927 Sheffield City Region (2010), Strategic Economic Assessment, page 14228 Nomis: www.nomisweb.co.uk National Statistics (accessed 01st Dec 2010)

20 Sheffield City Region tRanSpoRt StRategy, 2011-2026
0 2512.5
Kilometers
14
SCR Travel Pattern in out 251110
42
20
2512
22
1114
913
33
21
22
22
GreaterManchester
NorthYorkshire
East Riding of Yorkshire
Lincolnshire
WestYorkshire
Nottinghamshire(outside SCR)
Derbyshire(outside SCR)
Derbyshire(outside
SCR)Cheshire
Staffordshire
North Lincolnshire
WThis map is based upon Ordnance Survey material with the permission of Ordnance Survey on behalf of the Controllerof Her Majesty's Stationery O�ce © Crown copyright. Unauthorised reproduction infringes Crown copyright and may lead to prosecution or civil proceedings. SYPTE 100030252 2010
0 2512.5
Kilometres
OutboundInbound
Key
CountiesSheffield City Region
Movements in thousands ('000)
Figure 3.4 Travel to work movements to and from Sheffield City Region (in thousands)

Sheffield City Region tRanSpoRt StRategy, 2011-2026 21
3.24. Car ownership would not in itself be a problem if it were not clearly linked to car use. The total distance travelled (in vehicle-kilometres) in SCR has been rising year on year until 2008, with an annual growth of some 10.4%, against a national average of 8%. However, this information masks substantial variation between parts of SCR, from a 5.6% annual growth in Sheffield to 15.1% in Doncaster29. The rate of growth in the total travelled distance has been slowing in recent years alongside the economic recession across the UK30.
3.25. Mode share patterns in SCR are similar to other metropolitan areas, with some two thirds of commuting trips made by car, motorcycle or taxi. Public transport accounts for about 13% of commuting trips, although this is higher in the larger urban areas: 21% in Sheffield, rising to 33% for the journeys entering the city centre31.
3.26. Cycling or walking to work comprise about 11.5% of trips throughout SCR. The proportion is highest in the more rural parts of SCR, such as Bassetlaw and Derbyshire Dales32.
3.27. For international travel, available data demonstrates that SCR residents use the London, Manchester, East Midlands, Leeds-Bradford and Robin Hood airports. The number of passengers at the Robin Hood Airport rose from the opening in 2005 to 2007, although this has been followed by a drop in passenger numbers in 2008 and 200933.
3.28. Freight survey data shows that within SCR, freight tonnes lifted are greatest in Doncaster, Sheffield and Rotherham, with Sheffield’s freight movements the largest in SCR (circa 15 billion kilometres per annum). It is estimated that there are some 50,000 lorry movements to SCR each day, with a further 5,000 movements passing through SCR daily34.
Our challenges
3.29. This section contains a review of features of our networks and challenges they face, broken down into four sections by the mode of transport. To skip this review, and move directly to a summary of the challenges our strategy aims to address, turn to page 42.
The A628 between the Sheffield and Manchester City Regions
29 Sheffield City Region (2010), Strategic Economic Assessment, page 8130 Evidence Base Document 1 - Demographic, Economic and Spatial Overview31 Sheffield City Region Partners (2010), Sheffield City Region DaSTS Connectivity Study Baseline, page 2932 Sheffield City Region, (2010), Strategic Economic Assessment. page 7633 Sheffield City Region, (2010), Strategic Economic Assessment page 8334 Department for Transport (2009), Continuing Survey of Road Goods Transport

22 Sheffield City Region tRanSpoRt StRategy, 2011-2026
traVel by car National, strategic and local networks
Current challenges
This section focuses on challenges faced by road users in SCR, including cars, lorries, taxis and so on. SCR enjoys a central location on the national motorway network, with links to the M1, A1 (M), M18 and M180. Trans Pennine road links are provided by the A57 Snake Pass and the A616 / A628 Woodhead Pass. However, its central location also means that SCR is exposed to congestion and emissions caused by through traffic. Locations particularly prone to congestion are on the M1 between junctions 31-32, 34-35 and 35a-36.
The strategic road network within SCR is generally mature and comprehensive. A need for new strategic links is focused in areas of redevelopment and regeneration.
Figure 3.5 Delays on strategic roads
Important routes into and out of the larger centres in SCR suffer from severe congestion. This includes the following:
• A61intoSheffield(fromBarnsleyandChesterfield)
• A621fromDore• A57intoSheffield• A628intoBarnsley• A633andA630intoRotherham• A61toWakefield• A638andA630intoDoncaster.
During peak periods there are extensive delays on most radial routes, such as stretches of the A616. Places where through traffic joins local commuting flows experience delays. Figure 3.5 shows seconds of delay per kilometre during the morning peak on some of SCR’s busiest roads.
Travel times at peak periods can be over 30% greater than off peak35.
The total distance travelled by cars in SCR increased by 4.1% between 2003 and 2008, compared to a national increase in same period of 3.8% .36
A18 / A638 / A630 Doncaster Ring Road
A57 – Rivelin to Sheffield
A6135 – Mosborough to Sheffield
A61 – Mapplewell to Barnsley
A6178 – Rotherham to Sheffield
A6135 – Hoyland to Sheffield
A630 / A18 – Doncaster to Rotherham
A629 / A6109 – Rotherham to Sheffield
A6102/A61/B6086 – Sheffield Outer Ring Road
A628 / A61 / A635 – Barnsley Ring Road
A61 / A621 – Low Edges to Sheffield
A61 – Sheffield Inner Ring Road
0 10 20 30 40 50 60 70
A57 / A618 / A6178 – Aston to Rotherham
A631 / A6021 – Bawtry to Rotherham
A630 / A57 – Brinsworth to Sheffield
A61 – Tankersley to Sheffield
A6102 / B6079 – Stocksbridge to Sheffield
A621 / B6081 / B6388 – Totley to Sheffield
A633 / A6022 – Wath‐upon‐Dearne and Mexborough to Rotherham
A638 / A18 – Bawtry to Doncaster
A625 – Dore to Sheffield
A635 / A633 / A630 – Barnsley to Doncaster
A18 / A638 / A630 – Doncaster Ring Road
Average Route Delays (seconds / KM)

Sheffield City Region tRanSpoRt StRategy, 2011-2026 23
Vulnerability to diverted traffic from the M1 to the SCR strategic network is apparent in Sheffield, Rotherham, Chesterfield and Barnsley. Similar issues occur in Doncaster, if the A1(M) and the M18 are congested, closed due to works or experience other incidents.
Public satisfaction surveys showed that under 40% of users are satisfied with highway condition across SCR37. Further market research38 revealed that 80% of respondents felt that the major priorities for improvement were to tackle traffic congestion and also to improve the condition of roads and pavements.
Maintenance is currently prioritised in line with available funding, taking into account the increasing traffic volumes, wear and tear, and the importance of strategic routes. This ultimately leaves limited funding available for the local network, resulting in a worsening condition.
Poor network resilience is evident in cases of extreme weather, such as snow, floods, heat and drought39. For example, the 2007 floods caused £10m of additional damage to the Sheffield road network. The contingency process required in case of road closure, either weather-related or other, requires stronger coordination.
High levels of carbon emissions are generated around the centre of Sheffield and around the strategic road networks. There are also high carbon emissions along the national roads crossing SCR, particularly the M1, A1(M) and M18, where SCR authorities have no direct control for mitigation40. Motorways account for some 47% of Doncaster’s CO2 transport emissions, 40% of Rotherham’s and 30% of Barnsley’s41. Each district has its own reduction targets. For example, the Sheffield City Strategy 42 has targets of carbon 30% below 2010 levels by 2020, 60% below by 2050.
The number of traffic collisions in South Yorkshire reduced from 6,665 in 2000 to 5,439 in 2009. The number of Killed or Seriously Injured reduced from 696 in 2,000 to 530 in 2009. However, there is a clear disparity between different parts of SCR, whereby children living in the most deprived areas are four times more likely to be involved in a road traffic collision than children in the least deprived areas43.
There is an increase in motorcycle casualties as a proportion of the whole44, and an increase in the proportion of young people among those involved in collisions. The casualty data identifies that young drivers are over-represented as they have been involved in over a quarter of all reported collisions.
Future challenges
Forecasts by our Strategic Transport Model indicate a growth in highway demand throughout SCR. Highway demand is expected to grow by 495,000 trips per day by 2026 (from 3,821,500 in 2007). The projected rise in trips is highest in Sheffield (152,000 additional highway trips per day), followed by Rotherham (73,000 trips), Barnsley (69,000 trips) and Doncaster (55,000 trips). The expected growth in the wider SCR districts is relatively low, with the highest rise of 30,000 trips in Chesterfield and Bolsover. These are presented in Figure 3.6 as a percentage increase compared to the highway demand in 2007.
Parkway, Sheffield
35 Trafficmaster data36 Ibid37 National Highways & Transport Network, The 2009 Public Satisfaction Survey 38 IPSOS MORI, The 2008 People, Perceptions and Place Survey39 Department for Environment, Food & Rural Affairs, (2010), The Costs of the Summer 2007 Floods in England40 Passenger Transport Executive Group, (2010), Carbon Pathways for Transport in the City Regions41 Ibid.42 Sheffield First Partnership, (2007), City Strategy43 Evidence Base Document 8, Maximising Safety44 South Yorkshire, (2009), Collision and Casualty Statistics

24 Sheffield City Region tRanSpoRt StRategy, 2011-2026
The growth of highway demand is expected to cause a significant increase in congestion. Figure 3.7 shows that without intervention, by 2026 most of our network will be severely congested. The national road network will suffer the most, e.g. around the M1 junctions 29, 31, 32, 33, 34, 35a, 37, 39 and some sections of the M18. The A616 junctions around the A61 and B6088 will experience considerable delays, and so will the M18 junctions 1 to 4 and the A1(M) junctions 35 and 38. On the strategic road network, severe delays are envisaged on the radial corridors into urban centres, including the following:
• SectionsoftheA638andA630passingthroughDoncaster
• A61• A628andA635intoBarnsley• A631intoRotherham• A57andA621intoSheffield.
Our Urban Dynamic Model predicts an increase of around 12% in the total vehicle kilometres travelled across SCR due to further dispersal of land use patterns. The average trip length will grow in Derbyshire Dales by 17%; in Bassetlaw, Doncaster and Bolsover by 15%; in Sheffield by 9% and in Chesterfield by 7%.
Bassetlaw
Doncaster
Derbyshire Dales
Sheffield
Barnsley
Rotherham
N E Derbyshire
BolsoverChesterfield
This map is based upon Ordnance Survey material with the permission of Ordnance Survey on behalf of the Controllerof Her Majesty's Stationery Office © Crown copyright. Unauthorised reproduction infringes Crown copyright and may lead to prosecution or civil proceedings. SYPTE 100030252 2010
LTP3\Modelling\Base & Core Trip vehicle flows 251110
Growth in public transport and highway trips from the 2007 Base to 2026 Core Scenario levels
0 2010
Kilometres
Highway TripsPublic transport Trips
Key
Districts
14%
1%
9% 9%
13%
15%
15%
22%
11%
10%
22% 8%
14% 3%
14%
2%12% 3%
Figure 3.6 Growth in travel demand,
2007 to 2026

Sheffield City Region tRanSpoRt StRategy, 2011-2026 25
M1
Bassetlaw
Doncaster
Derbyshire Dales
Sheffield
Barnsley
Rotherham
Bolsover
N E Derbyshire
Chesterfield
M18
A1
A616
A50
A1(M)
M1
M180
A38Key
Reduction in Delay0% to 50% Increase50% to 100% Increase100% to 200% IncreaseMore than 200% IncreaseNational Network (Road)Strategic Network (Road)'A' Road
This map is based upon Ordnance Survey material with the permission of Ordnance Survey on behalf of the Controllerof Her Majesty's Stationery Office © Crown copyright. Unauthorised reproduction infringes Crown copyright and may lead to prosecution or civil proceedings. SYPTE 100030252 2010
LTP3\ModellingJunc Delays Base & Core 251110
Junc Delays - Base and Core Scenario 251110
0 2010
Kilometres
Figure 3.7 Change in delay due to highway congestion without further intervention, 2007 to 2026
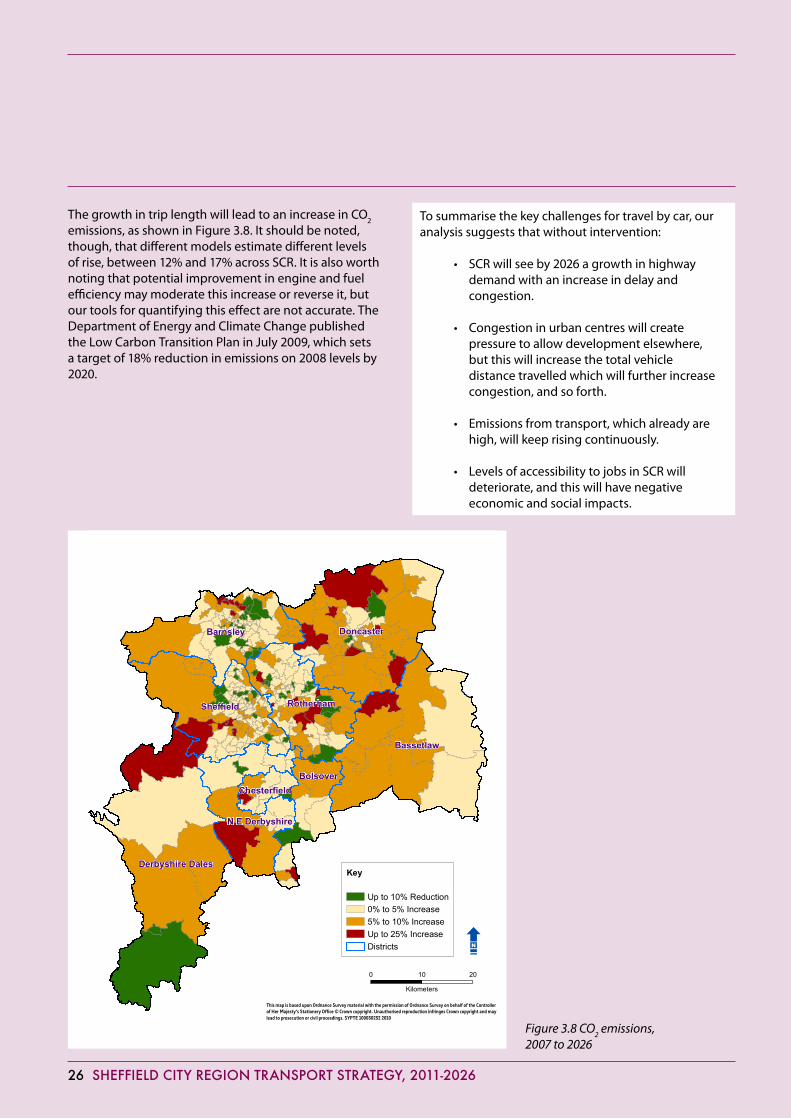
26 Sheffield City Region tRanSpoRt StRategy, 2011-2026
The growth in trip length will lead to an increase in CO2 emissions, as shown in Figure 3.8. It should be noted, though, that different models estimate different levels of rise, between 12% and 17% across SCR. It is also worth noting that potential improvement in engine and fuel efficiency may moderate this increase or reverse it, but our tools for quantifying this effect are not accurate. The Department of Energy and Climate Change published the Low Carbon Transition Plan in July 2009, which sets a target of 18% reduction in emissions on 2008 levels by 2020.
To summarise the key challenges for travel by car, our analysis suggests that without intervention:
• SCRwillseeby2026agrowthinhighwaydemand with an increase in delay and congestion.
• Congestioninurbancentreswillcreatepressure to allow development elsewhere, but this will increase the total vehicle distance travelled which will further increase congestion, and so forth.
• Emissionsfromtransport,whichalreadyarehigh, will keep rising continuously.
• LevelsofaccessibilitytojobsinSCRwilldeteriorate, and this will have negative economic and social impacts.
Bassetlaw
Doncaster
Derbyshire Dales
Sheffield
Barnsley
Rotherham
N E Derbyshire
BolsoverChesterfield
Key
Up to 10% Reduction0% to 5% Increase5% to 10% IncreaseUp to 25% IncreaseDistricts
This map is based upon Ordnance Survey material with the permission of Ordnance Survey on behalf of the Controllerof Her Majesty's Stationery Office © Crown copyright. Unauthorised reproduction infringes Crown copyright and may lead to prosecution or civil proceedings. SYPTE 100030252 2010
LTP3\Modelling\CO2 levels 251110
CO2 levels v2
0 2010
Kilometers
Figure 3.8 CO2 emissions, 2007 to 2026

Sheffield City Region tRanSpoRt StRategy, 2011-2026 27
traVel by train and tram National and strategic networks
Current challenges
SCR is served by some of the most important routes on the national rail network, including the Midland Main Line, East Coast Main Line and Trans Pennine services. These connect it efficiently to most large cities in Britain.
Nevertheless, the SCR rail network progressively saw the closure of passenger rail lines between Doncaster and Barnsley, the Woodhead route through the Pennines, and some capacity reduction on services to the South.
Limited capacity and track restrictions in some locations, such as the Swinton Junction and Holmes Chord in Rotherham, cause major delays which spread on to other routes45.
Other clear gaps in the SCR rail network are Rotherham station not being on the main line between Leeds and Sheffield; some centres, such as Bolsover, having no rail link; and some poor external links, e.g. between Barnsley and Manchester.
Rail patronage has continued to grow from around 4 million passenger trips in 1998 to 8 million passenger trips in 2010. This growth has occurred despite the recession which has recently caused demand to fall on other travel modes.
Overcrowding on rail services is continuously increasing as the demand for rail rises while train capacity fails to keep pace. Practically all rail lines in SCR now see passengers standing during peak periods. Particularly crowded routes include the services from Leeds via Swinton, Rotherham, Dronfield, Chesterfield and the Hope Valley46.
There is evidence of poor rail line speeds, compared to the average speeds enjoyed by other City Regions. The Midland Main Line from Sheffield to London has an average line speed of 78 mph, compared to 86mph on the route from Manchester to London. Doncaster enjoys a high average line speed to London via the East Coast Main Line, but a limited stopping service pattern. The average line speed from Sheffield to Manchester is only 35mph, while to Leeds and Nottingham it is 40mph. These slow speeds hamper rail being seen as a competitive alternative to the car. Evidence suggests47 48, that SCR’s economic growth is constrained by the lack of competitive rail links to Manchester, Leeds and London.
SCR’s links to overseas opportunities are weakened by the slow connections to Manchester Airport, the lack of rail service to Robin Hood Airport, and the indirect link to East Midlands Airport.
Platform 2, Sheffield station
45 Network Rail, (2009), Yorkshire and Humber Route Utilisation Strategy46 Evidence Base Document 5 - Supporting Economic Growth47 Arup, (2010), The Case for High Speed Rail to Leeds and Sheffield City Regions48 Sheffield City Region, (2009), City Relationships
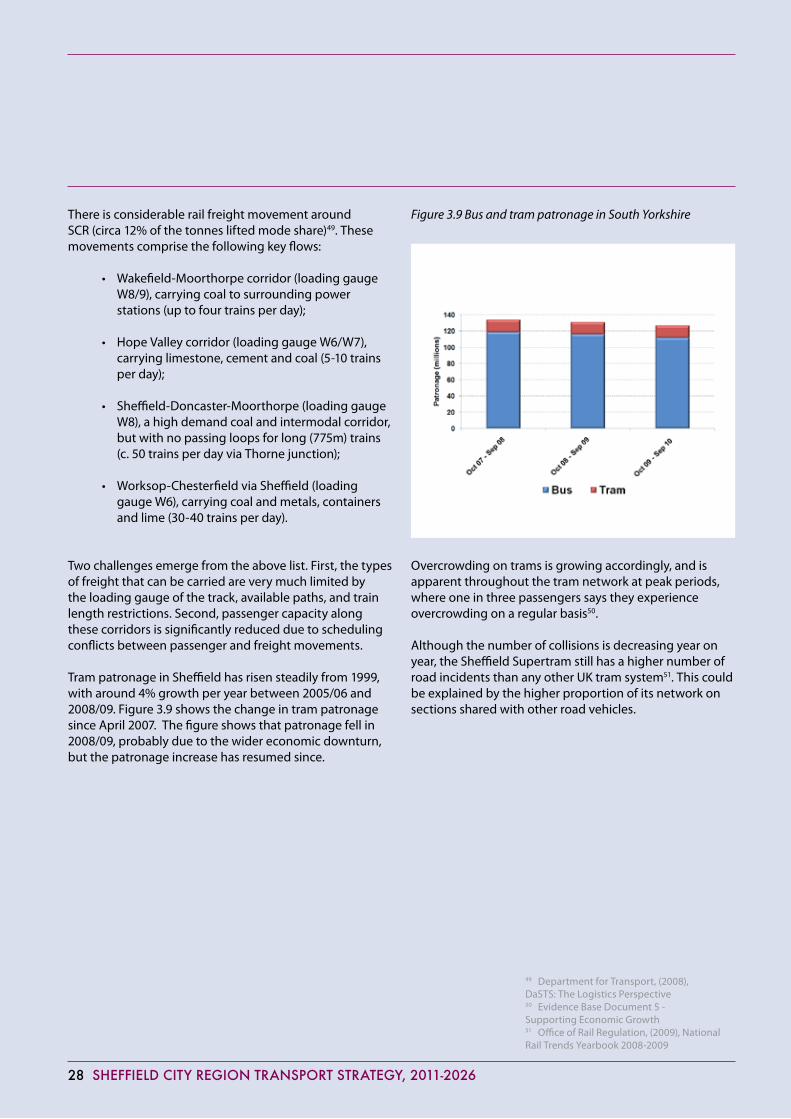
28 Sheffield City Region tRanSpoRt StRategy, 2011-2026
There is considerable rail freight movement around SCR (circa 12% of the tonnes lifted mode share)49. These movements comprise the following key flows:
• Wakefield-Moorthorpecorridor(loadinggaugeW8/9), carrying coal to surrounding power stations (up to four trains per day);
• HopeValleycorridor(loadinggaugeW6/W7),carrying limestone, cement and coal (5-10 trains per day);
• Sheffield-Doncaster-Moorthorpe(loadinggaugeW8), a high demand coal and intermodal corridor, but with no passing loops for long (775m) trains (c. 50 trains per day via Thorne junction);
• Worksop-ChesterfieldviaSheffield(loadinggauge W6), carrying coal and metals, containers and lime (30-40 trains per day).
Two challenges emerge from the above list. First, the types of freight that can be carried are very much limited by the loading gauge of the track, available paths, and train length restrictions. Second, passenger capacity along these corridors is significantly reduced due to scheduling conflicts between passenger and freight movements.
Tram patronage in Sheffield has risen steadily from 1999, with around 4% growth per year between 2005/06 and 2008/09. Figure 3.9 shows the change in tram patronage since April 2007. The figure shows that patronage fell in 2008/09, probably due to the wider economic downturn, but the patronage increase has resumed since.
Figure 3.9 Bus and tram patronage in South Yorkshire
Overcrowding on trams is growing accordingly, and is apparent throughout the tram network at peak periods, where one in three passengers says they experience overcrowding on a regular basis50.
Although the number of collisions is decreasing year on year, the Sheffield Supertram still has a higher number of road incidents than any other UK tram system51. This could be explained by the higher proportion of its network on sections shared with other road vehicles.
49 Department for Transport, (2008), DaSTS: The Logistics Perspective50 Evidence Base Document 5 - Supporting Economic Growth51 Office of Rail Regulation, (2009), National Rail Trends Yearbook 2008-2009

Sheffield City Region tRanSpoRt StRategy, 2011-2026 29
Future challenges
Based on our Strategic Transport Model, Figure 3.6 shows that public transport demand is expected to grow, with the higher increase in the larger urban areas, and much lower growth in rural areas.
The increase in public transport demand is broken down into individual modes at key stations in Figure 3.10. The highest expected rise in rail passengers is at the Sheffield station, while other stations see low growth. In Rotherham, a slight drop in the number of passengers is projected.
Sheffield Station has sufficient capacity to deal with the amount of additional services to be operated until 2019. It is possible that the frequency of peak services required after 2019 will not be possible to accommodate without an upgrade of the station.
Figure 3.10 Public transport demand by mode, 2007 to 2026
Pedestrian bridge, Barnsley Interchange
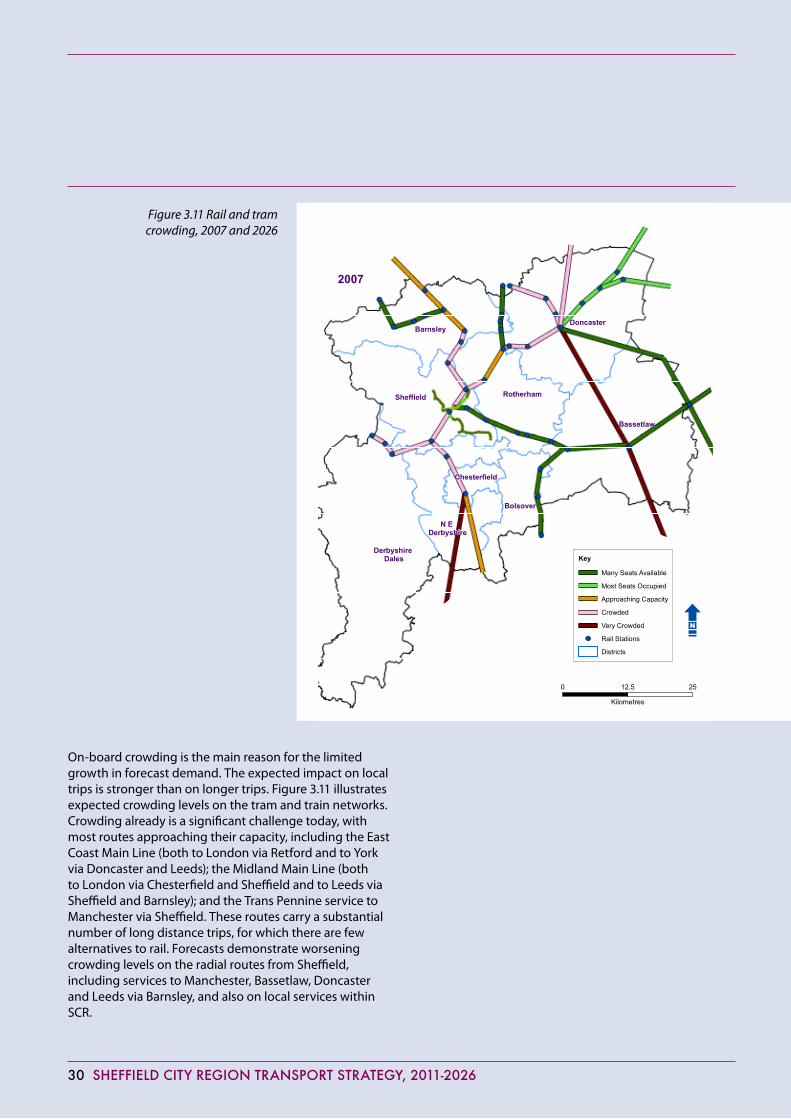
30 Sheffield City Region tRanSpoRt StRategy, 2011-2026
On-board crowding is the main reason for the limited growth in forecast demand. The expected impact on local trips is stronger than on longer trips. Figure 3.11 illustrates expected crowding levels on the tram and train networks. Crowding already is a significant challenge today, with most routes approaching their capacity, including the East Coast Main Line (both to London via Retford and to York via Doncaster and Leeds); the Midland Main Line (both to London via Chesterfield and Sheffield and to Leeds via Sheffield and Barnsley); and the Trans Pennine service to Manchester via Sheffield. These routes carry a substantial number of long distance trips, for which there are few alternatives to rail. Forecasts demonstrate worsening crowding levels on the radial routes from Sheffield, including services to Manchester, Bassetlaw, Doncaster and Leeds via Barnsley, and also on local services within SCR.
Bassetlaw
Doncaster
Derbyshire Dales
Sheffield
Barnsley
Rotherham
N E Derbyshire
Bolsover
Chesterfield
This map is based upon Ordnance Survey material with the permission of Ordnance Survey on behalf of the Controllerof Her Majesty's Stationery Office © Crown copyright. Unauthorised reproduction infringes Crown copyright and may lead to prosecution or civil proceedings. SYPTE 100030252 2010
LTP3\Modelling\Train Tram crowding 251110
2007
0 2512.5
Kilometres
Key
Many Seats Available
Most Seats Occupied
Approaching Capacity
Crowded
Very Crowded
Rail Stations
Districts
Figure 3.11 Rail and tram crowding, 2007 and 2026

Sheffield City Region tRanSpoRt StRategy, 2011-2026 31
Figure 3.12 illustrates the number of jobs accessible by public transport at a journey time no longer than 30 minutes. In rural areas this indicator is at a relatively low level already, and therefore differences are mainly found in urban centres. It can be observed that this number is expected to reduce significantly by 2026, due to congestion and overcrowding.
Bassetlaw
Doncaster
Derbyshire Dales
Sheffield
Barnsley
Rotherham
N E Derbyshire
Bolsover
Chesterfield
This map is based upon Ordnance Survey material with the permission of Ordnance Survey on behalf of the Controllerof Her Majesty's Stationery Office © Crown copyright. Unauthorised reproduction infringes Crown copyright and may lead to prosecution or civil proceedings. SYPTE 100030252 2010
LTP3\Modelling\Train Tram crowding 251110
2026
0 2512.5
Kilometres
To summarise the key challenges for travel by train and tram, our analysis suggests that without intervention:
• Overcrowdingwillseverelyaffectconnectivitywithin, to and from SCR.
• Thiswillreducepeople’sabilitytoeasilyaccess jobs and will therefore have a negative impact on their quality of life and on the area’s economic recovery.
• Morepeoplewilltravelbycar,asrailandtramoptions will not been seen as competitive alternatives.
• Thiswillhavenegativeimpactsonairqualityand will not help mitigate climate change.
© Crown copyright. All rights reserved SYPTE 100030252 2010

32 Sheffield City Region tRanSpoRt StRategy, 2011-2026
Bassetlaw
Doncaster
Derbyshire Dales
Sheffield
Barnsley
Rotherham
N E Derbyshire
BolsoverChesterfield
Key
Reduction greater than 2000Reduction between 1500 and 2000Reduction between 1000 and 1500 Reduction between 500 and 1000Reduction up to 500Increase up to 500Districts
This map is based upon Ordnance Survey material with the permission of Ordnance Survey on behalf of the Controllerof Her Majesty's Stationery Office © Crown copyright. Unauthorised reproduction infringes Crown copyright and may lead to prosecution or civil proceedings. SYPTE 100030252 2010
LTP3\Modelling\Accessibility - Jobs 251110
Accessibility - Employment
0 2010
Kilometres
Figure 3.12 Accessible jobs within 30 minutes public transport journeys, 2007 to 2026
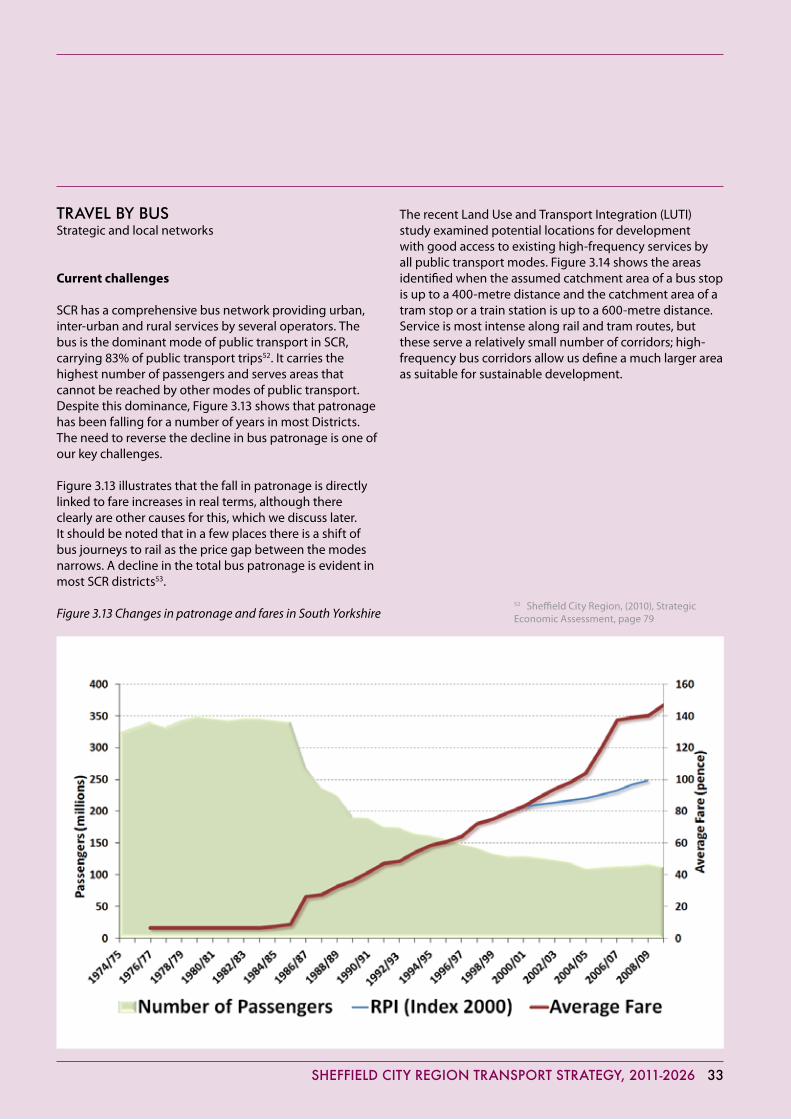
Sheffield City Region tRanSpoRt StRategy, 2011-2026 33
traVel by bus Strategic and local networks
Current challenges
SCR has a comprehensive bus network providing urban, inter-urban and rural services by several operators. The bus is the dominant mode of public transport in SCR, carrying 83% of public transport trips52. It carries the highest number of passengers and serves areas that cannot be reached by other modes of public transport. Despite this dominance, Figure 3.13 shows that patronage has been falling for a number of years in most Districts. The need to reverse the decline in bus patronage is one of our key challenges.
Figure 3.13 illustrates that the fall in patronage is directly linked to fare increases in real terms, although there clearly are other causes for this, which we discuss later. It should be noted that in a few places there is a shift of bus journeys to rail as the price gap between the modes narrows. A decline in the total bus patronage is evident in most SCR districts53.
Figure 3.13 Changes in patronage and fares in South Yorkshire
The recent Land Use and Transport Integration (LUTI) study examined potential locations for development with good access to existing high-frequency services by all public transport modes. Figure 3.14 shows the areas identified when the assumed catchment area of a bus stop is up to a 400-metre distance and the catchment area of a tram stop or a train station is up to a 600-metre distance. Service is most intense along rail and tram routes, but these serve a relatively small number of corridors; high-frequency bus corridors allow us define a much larger area as suitable for sustainable development.
52 Sheffield City Region, (2010), Strategic Economic Assessment, page 79

34 Sheffield City Region tRanSpoRt StRategy, 2011-2026
LTP3\Accessibilty routes 2010 171210
Key
Rail StationsPassenger RailTram StopsTram Network6+ Buses per Hour Network4+ Buses per Hour Network2+ Buses per Hour NetworkAreas with Good Accessibility'A' Road
Doncaster
Sheffield
Rotherham
Barnsley
Chesterfield
Worksop
Matlock
Bakewell
Retford
Accessibility within SCR
0 2512.5
Kilometres© Crown copyright. All rights reserved SYPTE 100030252 2010
Figure 3.14 Accessibility by public transport

Sheffield City Region tRanSpoRt StRategy, 2011-2026 35
Unlike the rail and tram networks, overcrowding is not common on the bus network, although specific services, especially on the A61 corridor, are often overcrowded54.
There has been a considerable improvement in the proportion of buses leaving on time, from 58.3% in 2005/6 to 68.2% in 2008/9. Despite this, bus reliability and punctuality are continuously mentioned by passengers as a key area for improvement, and cause dissatisfaction55.
For inter-urban travel, average bus speeds are generally half of rail speeds: the average railway speed is 33 kilometres per hour, whereas the average bus speed is 15 kilometres per hour56.
Buses tend to get caught in congestion pinch-points on important routes, and their travel times have worsened since 2006 by over 20%57. Corridors where bus journey times are worsening due to congestion include the following58:
• BarnsleytoPenistone• BarnsleytoChapeltown• RotherhamtoDoncaster(A630,includingBalby
Road)• RotherhamtoBarnsley(A633)• AttercliffeRoadinSheffield• BrightsideLaneviatheM1Junction34• SheafValleyinSheffield(A621-CrossScythes,
A61-Low Edges).
A further challenge is the steady reduction in service frequencies by the bus operators, manifested by a continuous decline in mileage run59. In some cases, entire services have been withdrawn. This is a particular issue on the Barnsley-Dearne-Doncaster, Doncaster-Worksop and Sheffield-Matlock corridors. A reduction in the level of service provided often leads to reduced patronage, which leads to further service reductions and so forth. Figure 3.15 shows the decline in the mileage run across all bus operators. The figure also highlights that there is significant fluctuation in the mileage run, which poses difficulties when attempting to brand buses as a stable and attractive travel option. Note that the reasons for these changes are complex and not covered within the scope of this review.
Figure 3.15 Decline in bus mileage 2005 to 2010 in South Yorkshire
53 Evidence Base Document 1 - Demographic, Economic and Spatial Overview54 Sheffield City Region, (2010), DaSTS Connectivity Study Baseline, page 2955 Passenger Focus, (2010), Bus Passenger Priorities for Improvement56 Evidence Base Document 1 - Demographic, Economic and Spatial Overview57 South Yorkshire Public Transport Board, The Bus KPI Report April 201058 Ibid59 Evidence Base Document 2 - Networks, Demographic and Economic overview

36 Sheffield City Region tRanSpoRt StRategy, 2011-2026
The reduction in the number of services that can be operated commercially affects those who are most dependent on bus services, and increases the need for subsidised services. Pressure on subsidy budgets is increasing accordingly.
Bus services currently provide limited access to areas of natural beauty in SCR, and as a result, those without access to a car cannot often use them for leisure activities. The lack of such bus services to these areas also thwarts attempts to develop sustainable tourism as a key sector in SCR’s economic growth60.
Passenger surveys61 reveal that there is a high perception of safety at interchanges. However, levels of safety and security on board the bus or while waiting at a bus stop are seen as lower. Surveys frequently show a concern of anti-social behaviour on board buses. Figure 3.16 presents the results of a survey in South Yorkshire on people’s experience of crime and anti-social behaviour. The figure also shows the point in a person’s journey where an incident has tended to occur.
Figure 3.16 Incident survey results in South Yorkshire
60 Natural England, (2008), Good practice in sustainable leisure travel: Twenty case studies61 South Yorkshire Passenger Transport Executive (2009), Customer Satisfaction Survey

Sheffield City Region tRanSpoRt StRategy, 2011-2026 37
Future challenges
Figure 3.6 shows that public transport patronage is expected to increase over the next 15 years. However, this increase is mainly due to natural population growth, and is lower than the increase in highway demand. Figure 3.10 presents the expected demand split by public transport mode at key stations. It illustrates that the rise in bus demand is low in comparison with the increase in rail and tram demand.
Forecasts by our Strategic Transport Model suggest that highway congestion will have a direct impact on bus travel times. Congestion will cause a significant reduction in bus speeds and there will generally be a decline in the ease of access to jobs and other activities. Figure 3.12, discussed earlier, shows how accessibility to workplaces in SCR is expected to change by 2026. While for rail and tram corridors the decline is a result of the inability to board overcrowded vehicles, the impact on jobs accessible by bus is due to an increase in highway congestion.
To summarise the key challenges for travel by bus, our analysis suggests that without intervention:
• Busspeedswilldecreaseduetohighwaycongestion.
• Theriseinhighwaydemandwillovershadowthe growth in bus patronage.
• Fewerjobswillbeaccessiblebypublictransport.
• Busservicecutswillcausedecliningpatronage, and this will continuously lead to further service cuts.
• Pressureonsubsidybudgetswillincrease,asfewer services will remain commercially viable.
• Thosewithoutaccesstocarwillbetheonesmost affected, and this will form a barrier to our attempts to enhance social inclusion.
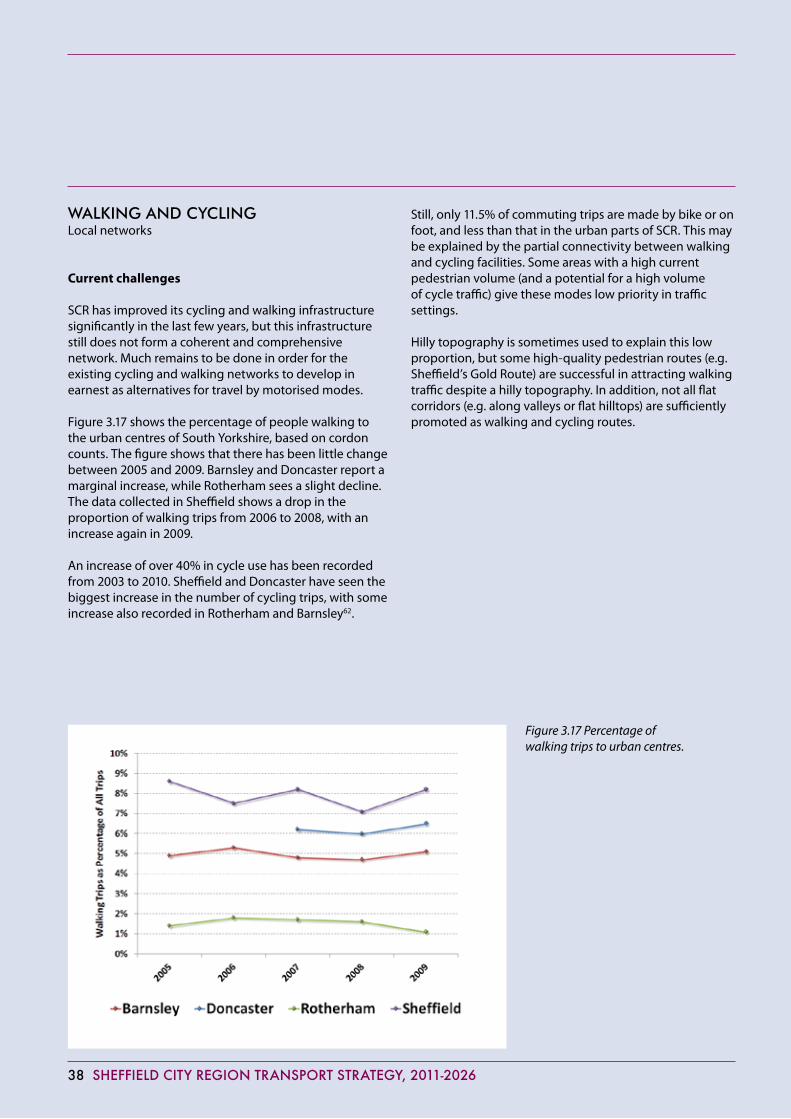
38 Sheffield City Region tRanSpoRt StRategy, 2011-2026
walking and cycling Local networks
Current challenges
SCR has improved its cycling and walking infrastructure significantly in the last few years, but this infrastructure still does not form a coherent and comprehensive network. Much remains to be done in order for the existing cycling and walking networks to develop in earnest as alternatives for travel by motorised modes.
Figure 3.17 shows the percentage of people walking to the urban centres of South Yorkshire, based on cordon counts. The figure shows that there has been little change between 2005 and 2009. Barnsley and Doncaster report a marginal increase, while Rotherham sees a slight decline. The data collected in Sheffield shows a drop in the proportion of walking trips from 2006 to 2008, with an increase again in 2009.
An increase of over 40% in cycle use has been recorded from 2003 to 2010. Sheffield and Doncaster have seen the biggest increase in the number of cycling trips, with some increase also recorded in Rotherham and Barnsley62.
Still, only 11.5% of commuting trips are made by bike or on foot, and less than that in the urban parts of SCR. This may be explained by the partial connectivity between walking and cycling facilities. Some areas with a high current pedestrian volume (and a potential for a high volume of cycle traffic) give these modes low priority in traffic settings.
Hilly topography is sometimes used to explain this low proportion, but some high-quality pedestrian routes (e.g. Sheffield’s Gold Route) are successful in attracting walking traffic despite a hilly topography. In addition, not all flat corridors (e.g. along valleys or flat hilltops) are sufficiently promoted as walking and cycling routes.
Figure 3.17 Percentage of walking trips to urban centres.

Sheffield City Region tRanSpoRt StRategy, 2011-2026 39
About a half of all trips to work in SCR are less than 8 kilometres in length63. Many of these trips could therefore be potentially suitable for walking or cycling. The proportion of commuters travelling different distances is presented in figure 3.18.
South Yorkshire is in the bottom quartile of the list ranking UK administrative areas in terms of the proportion of the population engaged in active recreation or moderate sport. Only 16% of SCR’s residents take part in three sessions of moderate exercise per week, lasting for at least 30 minutes64.
The proportion of primary school children in Year 6 considered obese is significantly above the national average (14.3%). Between 2006/7 and 2008/09, child obesity figures have worsened in Sheffield (from 14.8% to 18.7%) and in Doncaster (from 18% to 19.4%)65. In Barnsley, analysis of the National Centre for Social Research (NatCen) shows a significantly higher prevalence of obesity than the national average, and the proportion of the population with diseases related to obesity is more than 20% higher than the national average66.
A particular need for a coherent and comprehensive network of walking and cycling routes has been identified in the Dearne Valley, linked to its eco-vision67.
10km to less than 20km
20km to less than 30km
30km to less than 40km
40km to less than 60km
60km and over
0% 5% 10% 15% 20% 25%
Less than 2km
2km to less than 5km
5km to less than 10km
10km to less than 20km
Percentage Person Trips
Figure 3.18 Travel distance to work in SCR
62 South Yorkshire Passenger Transport Executive, (2006), Sheffield Cycling Action Plan 2006-201163 Office of National Statistics, (2001), Census64 Sport England, The 2009 Active People Survey65 South Yorkshire Transport Plan, (2010), Strategic Environmental Assessment, page 3766 http://www.barnsley.gov.uk/jsna-technical-document-201067 http://www.sheffieldcityregion.org.uk/dearne-valley-eco-vision (last accessed: 01 Dec 2010)

40 Sheffield City Region tRanSpoRt StRategy, 2011-2026
The discussion of walking and cycling infrastructure also relates to the need to ensure that designated walking paths in rural areas are usable, without major physical barriers. In addition, there are places in SCR where currently the only access to walk and cycle paths in the countryside is by car.
Despite the success in reducing the number of cycle casualties, the percentage of cyclists involved in collisions as a proportion of all casualties has increased, i.e. the improvement for cyclists is smaller than the improvement for other modes68. Figure 3.19 shows the change in the proportion of collisions by mode.
Way finder signage, Sheffield
40%
50%
60%
70%
80%
90%
100%
all K
illed
or Se
riou
sly Injured
0%
10%
20%
30%
Percen
tage of O
vera
Pedestrian Cycle Motorcycle Car Other
Figure 3.19 Proportion of KSI by mode in South Yorkshire
68 South Yorkshire Casualty Reduction Partnership, (2009), Collision and Casualty Statistics

Sheffield City Region tRanSpoRt StRategy, 2011-2026 41
Future challenges
Available forecasting techniques cannot adequately predict future trends related to active travel. It is clear that a further shift of journeys from motorised modes to walking and cycling depends on the provision of suitable infrastructure and on a broader cultural change, whereby the benefits of active travel are well-acknowledged by the public.
The expected increase in road traffic is likely to have a detrimental effect on the safety and comfort of pedestrians and cyclists. These would be exposed to greater risks and also to deterioration in air quality. There is a risk that this enhanced exposure would thwart the desirable cultural change discussed above.
To summarise the key challenges for walking and cycling, our analysis suggests that without intervention:
• Therewillbeafurtherdeclineinthelevelofphysical activity by SCR residents.
• PeopleinSCRwillremainlessfitandhealthy,compared to other parts of the country.
• Thiswillgohand-in-handwiththeincreaseincar use and its impacts on the quality of life in SCR.
• AllthesewouldnothelpinestablishingSCR’sreputation as an attractive area and will have a knock-on effect on our economy.
Cycle parking, Doncaster station

42 Sheffield City Region tRanSpoRt StRategy, 2011-2026
3.30. The identification of challenges in this review sorts them by transport mode, but our work to identify solutions breaks the challenges down according to our four goals. Figure 3.20 presents a summary of the challenges discussed earlier, aligned to the four goals. For simplicity, the table associates each challenge to the goal it is most related to, although many of the challenges are clearly linked to multiple goals.
3.31. These challenges set the scene for our strategy. The following chapters present our A to Z policies, designed to overcome these challenges.
Figure 3.20 A summary of the challenges we aim to address
Levels of congestion are increasing throughout SCR
Important public transport routes suffer from unreliability and overcrowding
Public transport only attracts a low proportion of commuters
Connections to other cities and international gateways are not sufficiently frequent and fast
Some development takes place in locations that are only easily accessible by car
A large number of jobs can only be conveniently accessed by car
Pressure on budgets to subsidise bus services is increasing
Some important development sites will not come forward without investment in infrastructure
Specific links between towns require improvement
The performance of our networks is sensitive to incidents and bad weather
The public realm needs to be improved in some urban centres
Road and pavement maintenance has been identified as requiring improvement
Public transport links do not sufficiently contribute to social inclusion of all communities
Access to the natural environment in some places is only possible by car
Poor journey experience and customer satisfaction are contributing to a reduction in public transport patronage
There is an increase in obesity and other lifestyle-related health issues
Emissions of carbon and other pollutants are continuously increasing, particularly on the national and strategic networks
Development in locations that depend on travel by car is preventing a reduction in emissions
Action to reduce emissions and encourage the use of low-carbon vehicles is not widespread
The walking and cycling infrastructure does not attract a high proportion of travellers even where travel distances are short
The number of travellers killed or seriously injured in traffic collisions is still high
Motorcyclists, cyclists and residents of deprived communities remain at a higher risk than other road users
Negative perceptions of personal safety form an obstacle to increasing the use of public transport

Sheffield City Region tRanSpoRt StRategy, 2011-2026 43
intrOductiOn
4.1. This chapter focuses on our primary goal, to support SCR’s economic growth. As explained when we first introduced our goals, the prosperity of our area depends on its ability to attract investment and open up a range of business opportunities.
4.2. This is the first in four chapters that cover our full set of policies, A to Z. These four chapters form the main part of this strategy. The complete set of policies from A to Z covers our approach for tackling the challenges and meeting the goals we presented earlier.
4.3. The policies in this chapter elaborate on the role of transport in facilitating this. We present the policies in three sections:
• Improvingconnectivity;• Supportingregeneration;• Linkingpeopletojobs.
4.4. In this chapter there is a particular role for the SCR Local Enterprise Partnership (LEP). The LEP is a partnership, chaired by a private sector leader, involving SCR districts (Barnsley, Bassetlaw, Chesterfield, Doncaster, North East Derbyshire, Rotherham and Sheffield), local businesses and universities. The local authorities of Bolsover and Derbyshire Dales, and the Peak District National Park Authority, are associate members of the LEP. The county councils of Derbyshire and Nottinghamshire work closely with it on matters of mutual interest.
4.5. The LEP was created to provide strategic leadership in setting out the area’s economic priorities and infrastructure requirements, and to encourage increased private sector investment and job creation. Through this partnership we will lead the promotion and delivery of the policies described here, to unlock the growth potential of SCR.
4.6. It is important to note that within this chapter, we do not attach weights or levels of importance to different policies; neither do we present them in any particular order.
4.7. Some of the evidence to support this chapter, similar to the previous chapter, is based on extensive forecasting work we have undertaken using the Urban Dynamic Model and the Strategic Transport Model. Further detail on these models, the testing work we carried out and the full outputs are included in the appendices.
4. SuppoRtingeConomiC gRowth
Magna, Rotherham

44 Sheffield City Region tRanSpoRt StRategy, 2011-2026
imprOVing cOnnectiVity
4.8. Connectivity between different locations is the ability to move from one to the other without hindrance. Good connectivity is essential for a thriving economy because it allows an efficient use of resources and expands the catchment areas of firms and businesses. Improving connectivity in SCR is therefore needed to enhance business efficiency and productivity.
4.9. The policies in this section describe the types of connectivity improvements which we see as most important to secure our economic growth.
Figure 4.1 International gateways
International connectivity
4.10. International connectivity is important for logistics, business and leisure travel. International travel to and from SCR is made through several airports, ports and stations, which are identified in Figure 4.1. Surface access to and from these gateways is often not within our direct control, but we do have clear aspirations for the ease of access and the quality of the respective transport links.
4.11. Most international connections for business and leisure are made by air. Rapid and convenient access to airports makes existing business activity more productive and also facilitates new opportunities for business links, leisure travel and freight movement.
4.12. The Robin Hood Airport Doncaster-Sheffield is the only airport within SCR, and is being developed as an engineering and aero-industry centre, with some 3,000 jobs in its business plan. The airport forms an important hub for firms directly or indirectly related to aerospace, and its success is seen by SCR as a key priority69.
4.13. At present, surface access to the Robin Hood Airport is substandard compared to other airports of similar size. There is no direct rail link to the airport and no link from the M18. We wish to improve access to the airport from all major towns in SCR, to support both the service provided to the area by the airport terminal itself and the growth of business and employment opportunities in the airport area.
Donca
ster Sheffield
Hu
mber Ports
M
anchester
Eas
t Midlands
London
Leed
s Bradford
69 Sheffield City Region, (2006), Development Programme
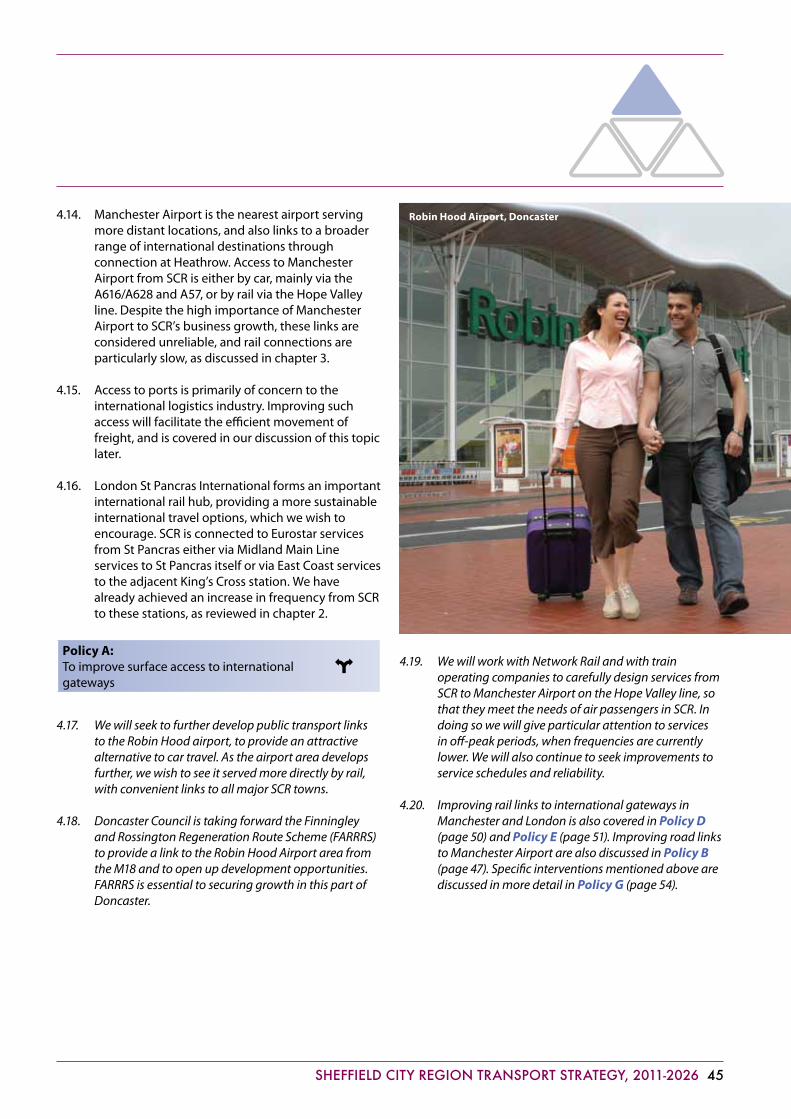
Sheffield City Region tRanSpoRt StRategy, 2011-2026 45
4.14. Manchester Airport is the nearest airport serving more distant locations, and also links to a broader range of international destinations through connection at Heathrow. Access to Manchester Airport from SCR is either by car, mainly via the A616/A628 and A57, or by rail via the Hope Valley line. Despite the high importance of Manchester Airport to SCR’s business growth, these links are considered unreliable, and rail connections are particularly slow, as discussed in chapter 3.
4.15. Access to ports is primarily of concern to the international logistics industry. Improving such access will facilitate the efficient movement of freight, and is covered in our discussion of this topic later.
4.16. London St Pancras International forms an important
international rail hub, providing a more sustainable international travel options, which we wish to encourage. SCR is connected to Eurostar services from St Pancras either via Midland Main Line services to St Pancras itself or via East Coast services to the adjacent King’s Cross station. We have already achieved an increase in frequency from SCR to these stations, as reviewed in chapter 2.
Policy A:To improve surface access to international gateways
4.17. We will seek to further develop public transport links to the Robin Hood airport, to provide an attractive alternative to car travel. As the airport area develops further, we wish to see it served more directly by rail, with convenient links to all major SCR towns.
4.18. Doncaster Council is taking forward the Finningley and Rossington Regeneration Route Scheme (FARRRS) to provide a link to the Robin Hood Airport area from the M18 and to open up development opportunities. FARRRS is essential to securing growth in this part of Doncaster.
4.19. We will work with Network Rail and with train operating companies to carefully design services from SCR to Manchester Airport on the Hope Valley line, so that they meet the needs of air passengers in SCR. In doing so we will give particular attention to services in off-peak periods, when frequencies are currently lower. We will also continue to seek improvements to service schedules and reliability.
4.20. Improving rail links to international gateways in Manchester and London is also covered in Policy D (page 50) and Policy E (page 51). Improving road links to Manchester Airport are also discussed in Policy B (page 47). Specific interventions mentioned above are discussed in more detail in Policy G (page 54).
Robin Hood Airport, Doncaster

46 Sheffield City Region tRanSpoRt StRategy, 2011-2026
The national road network
4.21. In chapter 3 we presented the hierarchy of networks serving SCR. At the top of the hierarchy is the national road network. The roads included in the national network carry very large numbers of trips through and within SCR, and it is therefore critical to keep this network operating reliably, efficiently and safely.
4.22. We have examined the impacts of the continuous growth in car travel on the network. Our analysis indicates that failure to mitigate against the congestion and pollution resulting from these trips will have a detrimental impact on our economy. This is supported by research from the ‘Delivering a Sustainable Transport System’ studies70 which indicates that by 2035, predicted congestion on the M1 will lead to wider economic costs equivalent to a 1% loss of SCR productivity per worker.
4.23. This study also suggests that physical expansion of the network, by either adding new highways or widening existing ones, would lead to increased demand and therefore may not alleviate congestion. This supports the topic of having to ensure we make the most efficient use of existing infrastructure, before making major investment in new assets.
4.24. The need to squeeze more capacity from the existing network has been recently confirmed to be a key expectation of the business community from our strategy71. It has been stressed that investment in new infrastructure should be made if there is demonstrable evidence supporting the need, and if this is further established through consultation with partners and stakeholders.
4.25. The view that new highway infrastructure should not be seen as the principal way of providing additional capacity has also been supported by stakeholders outside the business community, who highlighted the linkage between this topic and the need to protect sensitive locations, such as the Peak District National Park.
4.26. Our approach is therefore to support the Highways Agency in its work to reduce demand and focus on improving the reliability of the network. A reliable network is one where a similar journey takes about the same time on different days, and where any disruptions are rapidly dealt with. In an unreliable network, travellers need to allow extra time to ensure that they do not arrive too late, and this results in lost productive time, even if the there are no delays. We see the improvement of the reliability of the network being achieved by embarking on active traffic management and by seeking to achieve transfer of highway users on to other travel modes.
4.27. The reliability of the national road network also greatly depends on its ability to return to normal operation after traffic collisions and adverse weather conditions. Extreme weather has become more common in the last few years, possibly as a result of a climate change. Mitigation of such change is discussed later in the strategy, but it is also important that we adapt our networks to the possible impacts of floods, gale force wind, snow and heat. Effective adaptation to the changing climate requires that we continuously learn the lessons from each disruptive event.
4.28. Our approach is also in favour of prioritising road space for essential activities, such as freight distribution, and for those who use road space more efficiently, such as buses, coaches, bicycles and high occupancy cars.
70 MVA Consultancy, Department for Transport, (2010), National Networks Study Programme - Corridor 10 Study71 Yorkshire & Humber Chambers of Commerce, (2010), Reconnecting Yorkshire and Humber

Sheffield City Region tRanSpoRt StRategy, 2011-2026 47
Policy B:To improve the reliability and resilience of the national road network using a range of management measures
4.29. This policy is to be implemented in collaboration with the Highways Agency. We will continue to work closely with them on a range of issues, including prioritising between alternative motorway improvements, introducing traffic management measures and establishing diversion routes.
4.30. We will help the Highways Agency make the national network more resilient to shocks and minimise the disruption after incidents through integration with SCR’s own traffic management systems. We will continue our joint work to prevent disruption due to ice and snow, and contribute to contingency planning to ensure that the network is kept operational at all times.
4.31. We will also continue to work with the Highways Agency and Government to improve the effective capacity of the M1, A1(M) and M18. We will also seek to ensure that plans are in place to keep the A616/A628 open during extreme weather events. This is critical, for example, to ensuring uninterrupted connectivity to Manchester Airport, as discussed earlier.
4.32. Highway management at the SCR is discussed in Policy L (page 64). Priority for freight and public transport is also discussed in Policy C (page 48) and Policy N (page 71), respectively. The need to properly justify major investments is a topic that we raise again in our discussion of Policy F (page 52).
Part of the national network
48 Sheffield City Region tRanSpoRt StRategy, 2011-2026
Freight and logistics
4.33. SCR has a growing logistics sector. We are keen to support the growth of this sector and of the value-added business linked to it. The need to effectively manage the use of the national road network also relates to a range of freight connectivity issues.
4.34. We want our partners to regularly examine rail-based and water-based alternatives to road freight. We wish to encourage a dialogue between relevant players in the freight industry, to promote efficient use of available infrastructure.
4.35. This may also include further development of freight consolidation facilities, where this is supported by a robust business case, to reduce part loads and empty running.
4.36. Doncaster forms the heart of the SCR logistics sector, with distribution centres and warehousing already central to its economy. Measures included within this policy will further enhance the role of this sector in Doncaster.
Policy C: To promote efficient and sustainable means of freight distribution, while growing SCR’s logistics sector
4.37. We will work with the freight industry across all modes of transport and link proposed solutions with new business opportunities for SCR’s logistics sector. This includes, for example, ensuring that efficient links exist to sea ports, as highlighted earlier.
4.38. In those cases where we encourage the transfer of bulk road-based freight to rail, we wish to promote the introduction of rail-road distribution centres. A prominent example is the proposed Inland Port in Doncaster, which is of national significance. Associated with these centres are some 1,500-3,000 additional jobs72 for the Doncaster local economy. Other opportunities will be supported, especially where they facilitate the reinstatement or extension of rail links, for example the Cudworth Line in the Barnsley area.
4.39. Road transport will remain dominant in our logistics sector even if the share taken by other modes rises. We will therefore work with the sector to help improve its efficiency and utilisation through policies such as Heavy Goods Vehicle (HGV) management, vehicle restrictions and lorry parking. We will provide travel information and signage that will aid effective operations and journey planning.
4.40. We will also ensure that future developments serving freight and distribution activities are located in suitable locations, through proactive and integrated land use planning. In some cases a suitable location would be adjacent to the rail network and in some other cases this would be close to the national and strategic road networks, or in a location based on minimising the total distance to both networks. We return to this issue in Policy I (page 58).
4.41. We will establish a freight working group, led by the industry and supported by the LEP, with representation from large and small operators. The group will work on a range of matters including eco-driving initiatives, local access to the national and strategic networks, maintenance and network management.
If we are successful in making these improvements, SCR will feel closer to other cities in England and abroad. Easier travel to national and international destinations will open up new opportunities for leisure and business. This will help our area become a prosperous economic hub and will grow SCR’s logistics sector.
72 Doncaster Metropolitan Borough Council, Finningley and Rossington Regeneration Route Scheme Business Case Report

Sheffield City Region tRanSpoRt StRategy, 2011-2026 49
Rail connectivity
4.42. Evidence from the national corridor studies73
demonstrates that significant improvements to business connectivity are only possible via rail. SCR can benefit noticeably from improving rail service patterns, frequency and journey times to key destinations.
4.43. SCR authorities do not have a formal remit to design and improve rail services in the area, but we have already seen that collaboration and lobbying with Network Rail, the Department for Transport (DfT) and train operating companies can lead to significant service improvements. We will continue our efforts to influence rail investment decisions, to ensure that these bodies include in their plans rail interventions that are essential to improving SCR’s connectivity.
Figure 4.2 Public transport passenger flows, 2026
4.44. When rail infrastructure is limited, there are sometimes conflicts between local and intercity services. Improving speeds on certain services can reduce the efficiency of others. In the immediate term, we will work to ensure that the resolution of any such conflicts matches SCR’s priorities. In parallel, we will keep presenting our strong case for rail capacity enhancements which can be delivered without heavy infrastructure work, since such work would take many years to implement.
4.45. A recent independent study74 has examined the economic benefits of different planned improvements to the rail network. The report examines how rail improvements can opens up new markets, help increase competition and widen labour markets. One of the assessments presented in the report demonstrates that over 375,000 people in SCR could benefit from higher wages if rail infrastructure improves. Another example presented in the study illustrates that a 13-minute time saving to an inter-urban rail connection can have a present value of £21.5 million.
73 Department for Transport, (2010), National Networks Study Programme - Corridor 10 Study74 Centre for Cities, (2010), On Track: Why Rail Matters
50 Sheffield City Region tRanSpoRt StRategy, 2011-2026
4.46. Our analysis using the Urban Dynamic Model suggests that improved rail services could directly contribute to an increase in SCR’s productivity, including around 900 additional jobs. Rail improvements as part of a combined package of incentives to support the area’s recovery could have a larger impact.
4.47. Figure 4.2 shows the increase in public transport trips in 2026 in the four largest urban centres in SCR, forecast by the Strategic Transport Model. For each of the locations, the leftmost bar presents the demand without intervention and the second bar from the left presents the demand following a package of rail improvements. We return to the two other bars later. It can generally be seen that the increase in public transport demand is a welcome sign of enhanced economic activity.
4.48. Fast and reliable rail services are essential, but they are not sufficient if access to railway stations is inefficient. From a local perspective it is important that getting to and from our gateway stations is easy to passengers anywhere in SCR. Improving feeding bus services to stations, enabling convenient pedestrian access and providing facilities for cyclists will all ensure that obstacles to rail use are removed.
Policy D: To improve rail services and access to stations, focusing on interventions that can be delivered in the short term
4.49. We will work with Network Rail to improve rail services to London and to our neighbouring City Regions: Manchester, Leeds and Nottingham. Improvements that we will strongly support include:
• JourneytimeandcapacityimprovementsontheHopeValley line to Manchester.
• Electrificationandjourneytimeimprovementsonthe Midland Main Line (MML) between Sheffield and Barnsley, and from both of these to London and Leeds.
• Thepromisedjourneytimeandcapacityimprovements to the East Coast Main Line (ECML), including links to the south (London) and the north (York, Newcastle and Scotland).
• JourneytimeandcapacityimprovementsforSwintonJunctionandHolmesChord.
4.50. To achieve these we will work closely with the Leeds City Region and with partners in the East Midlands. The Northern Rail and Trans Pennine Express franchises are due to be renewed in 2013, and we see this as an opportunity to lobby for service improvements.
4.51. We will ensure that our local public transport network is designed to provide efficient access to SCR rail stations. We will continue to improve the quality and availability of passenger information and other travel planning facilities, as further discussed in Policy N (page 71). We will continue our work to improve the urban environment surrounding railway stations, including cycling and pedestrian infrastructure, as further discussed in Policy H (page 57) and Policy S (page 79).
4.52. There are other rail connectivity aspirations within SCR that need further examination, and some long-term ambitions for restoring unused rail lines, which are not seen as feasible at present. We will support proposals to protect these lines for potential future use.
High speed rail
4.53. The discussion of the national rail network relates directly to the High Speed Rail (HSR) proposal by the national government, which could support a transformation of the economy of the North. Government announced in October 2010 that a Y-shaped HSR network, with connections between the West Midlands and Leeds via South Yorkshire, would deliver the greatest benefit to the national economy.

Sheffield City Region tRanSpoRt StRategy, 2011-2026 51
4.54. Our own analysis has quantified the benefit from a Y-shaped HSR network to SCR and to the North. By providing a new rapid link between Sheffield and London, Leeds, Derby, Nottingham and Leicester, the HSR network would enhance connectivity to an additional 6.7 million people and 3 million jobs. This would deliver an estimated £60 billion of benefits according to the traditional evaluation approach. In addition, it would imply a further £2.3 billion in wider benefits, i.e. improvements to business productivity and to the labour market75.
4.55. Despite the government’s announcement and recent progress made, the HSR proposal will need to go through various other phases of approval and development before it is approved. The plan as a whole, and the Y-shaped network in particular, will come under scrutiny by those who do not see the economic recovery of areas east of the Pennines as a high priority.
4.56. It is essential that SCR’s long-term plans consider the potential impacts of HSR on its economy. Long-term planning also includes identifying opportunities to improve access from across SCR to future HSR stations, as discussed earlier. This will ensure that the benefits are shared by all parts of SCR.
Policy E: To ensure SCR is served by High Speed Rail
4.57. We will continue our work with other City Regions, including Leeds City Region, to demonstrate the high economic benefits of the eastern arm of the high speed network.
4.58. We will work with the Government as they seek to determine the optimal location of the HSR station in SCR, and will highlight the advantages and disadvantages of different alternatives. We will attach high importance to the design of efficient access to the selected station location by rail, bus, bike, car and on foot. We will not let our work to promote HSR come at the expense of other rail services, as set out in Policy D (page 50), to serve localities throughout SCR.
Strategic connectivity
4.59. Policies A to E focus on national and international links, to bring SCR closer to other cities and regions. Equally important is the strategic network within SCR (as defined in chapter 3), which connects key urban centres and plays an important role in its economy. SCR has a comprehensive, fully-functional strategic network, but there are specific gaps which we concentrate on here.
4.60. There is a need to better integrate the labour markets of Sheffield and Rotherham by improving connections between the two centres, tackling the severance caused by the M1. Some limitations of current connectivity between the centres of Barnsley, Rotherham and Doncaster present an additional obstacle to SCR realising its full economic potential.
4.61. Access to the growing opportunities in the Dearne Valley is also limited from all these centres, and is critical for the re-branding of the area as a role model of sustainable economic recovery.
Engineers working at Sheffield rail station75 Arup, (2010), The Case for High Speed Rail to Leeds and Sheffield City Regions

52 Sheffield City Region tRanSpoRt StRategy, 2011-2026
4.62. As outlined previously, we wish to strike a balance between the construction of new infrastructure and our attempts to use existing assets more efficiently. Building new links requires funds that could potentially be spent in other ways, and this obliges us to be rigorous when examining the case for each proposed intervention.
4.63. Nevertheless, evidence suggests that improving internal travel-to-work links within the main centres can give rise to substantial benefits76, especially if such improvements are coordinated with strategies for improving skills and with private sector business initiatives.
Policy F:To improve connectivity between major settlements
4.64. We will progress carefully-selected infrastructure schemes to bridge, through sustainable means, connectivity gaps between the principal towns in SCR77.
4.65. We will strongly pursue the cutting edge proposal for a “tram-train” scheme between Sheffield and Rotherham. The scheme will expand the existing tram network by enabling tram access to the existing rail network, and will thus facilitate tram services currently terminating at Meadowhall to continue towards Rotherham.
4.66. We will examine proposals to improve connectivity between Barnsley, Rotherham and Doncaster and to provide better access to the Dearne Valley. These proposals are still to be developed in detail. As set out earlier, there are long-term aspirations to link Barnsley and Doncaster by better public transport.
4.67. Buses are likely to remain the main mode linking between the main centres in SCR. We will continue the Key Routes programme to provide attractive and competitive bus services between centres. We will also continue to examine the case for the INTEGR8 scheme which focuses on improvements to corridors linking the South Yorkshire districts to each other. The scheme includes four Park and Ride sites in Sheffield and Doncaster.
4.68. There are initiatives to supplement inter-urban rail services, either within SCR or between SCR towns and large cities elsewhere, with high-quality coach services. Where coach operators introduce such services, providing travellers with new means of quick and sustainable travel, we will strongly support this.
4.69. Some of our prioritised bus routes have an important role in serving regeneration areas, including Bus Rapid Transit schemes which are further discussed in Policy G (page 54); in providing people access to workplace, as further discussed in Policy K (page 62) ; and in enhancing social inclusion, as further discussed in Policy N (page 71).
4.70. Investment priorities are dynamic, and can change over time as circumstances change and evolve. The need for intervention will be monitored continuously, to identify emerging needs and changing priorities, as we also discuss in chapter 8.
If we are successful in making these improvements, it will make your rail journey to London and other cities quicker, with more services to choose from. In addition, it will become easier for you to travel by bus, tram or train between the main centres in SCR. This will give you more choice of places to work, study, shop or visit.
76 Department for Transport, (2006), Eddington Report on Transport77 Work Foundation, (2009), City Relationships: Economic Linkages in Northern City Regions

Sheffield City Region tRanSpoRt StRategy, 2011-2026 53
suppOrting regeneratiOn
4.71. Transport is often a factor supporting the regeneration of sites or communities where a need for renewal has been identified. It can have a key role in their transformation and assist in attracting investment to create new businesses and workplaces. But insufficient connectivity and other transport-related issues can also sometimes constrain the feasibility of regeneration initiatives.
4.72. The policies in this section focus on how we will ensure that the SCR transport system supports regeneration and new development while mitigating some negative side effects that rapid growth may have. A common thread through all policies in this section is the need for transport improvements and other interventions in the built environment to be aligned with each other.
Opening up employment growth
4.73. To achieve substantial economic growth, it is essential for SCR to facilitate the creation of a large number of new jobs, focused on the private sector. SCR partners have defined through their Local Development Frameworks and planning processes a clear list of locations where we would like to see new employment opportunities created.
4.74. Transport is a key factor in determining whether potential sites are suitable for development. Unless there are efficient and sustainable means of transport serving a site, development is ‘locked’ and cannot move forward. The list of sites where we wish to concentrate our employment growth must therefore be accompanied by a list of transport interventions to ‘unlock’ this growth. Both lists, and priorities within each list, are refined and agreed through working with the LEP, ITA and local authorities.
Rotherham Interchange

54 Sheffield City Region tRanSpoRt StRategy, 2011-2026
4.75. There is a strong link between initiatives to generate new jobs and plans to regenerate deprived areas. Many of the plans for new employment sites in SCR aim to assist in the revitalisation of disadvantaged communities, who suffered the most from the decline of local industries such as mineral mining.
4.76. This link between employment growth and regeneration may cause tensions between our policies, because such initiatives often wish to support remote communities which are not situated close to key corridors. Since employment growth in these communities is central to our vision, it has to be acknowledged that the way to achieve this may be different to our way of achieving other goals. It may require investment in new road links, which in some other cases would be avoided due to environmental or other impacts. We will need to continuously manage the fine balance between this policy, Policy I (page 68) and Policy K (page 62).
4.77. The current reductions in public spending pose a significant risk that funding will not be available in the near future for major transport interventions. Nevertheless, the key position of these interventions in this strategy remains, since they are fundamental to our growth plans. We are exploring innovative means of funding and financing for these interventions, involving both the public and private sectors.
Policy G: To deliver interventions required for development and regeneration
4.78. We will support development and regeneration of sites at key locations including the Lower Don Valley, Waverley, East Doncaster and Barnsley. To open up development opportunities in these sites, we will promote the following schemes:
• WhiteRoseWay. Dualling the A6182 road between the M18 and Doncaster will provide the additional capacity necessary for the development of retail, leisure and housing.
• FinningleyandRossingtonRegenerationRouteScheme(FARRRS). This scheme will provide a catalyst for growth in these areas, with opportunities for extensive business development around the Robin Hood Airport.
• BusRapidTransit(BRT)‘South’. The scheme will link Waverley to Rotherham and Sheffield and include a Park and Ride facility.
• BRT‘North’. The scheme will connect development sites in the Lower Don Valley with the centres of Rotherham and Sheffield.
• A61PenistoneRoadSmartRoute. The upgrade of the A61 corridor into Sheffield will support the regeneration of the Upper Don Valley. The scheme forms a key phase of the Sheffield City Centre Regeneration Strategy.
• Waverleylinkroad. This is a new connection to link the Advanced Manufacturing Park and surrounding area to Sheffield and Rotherham centres and the M1.
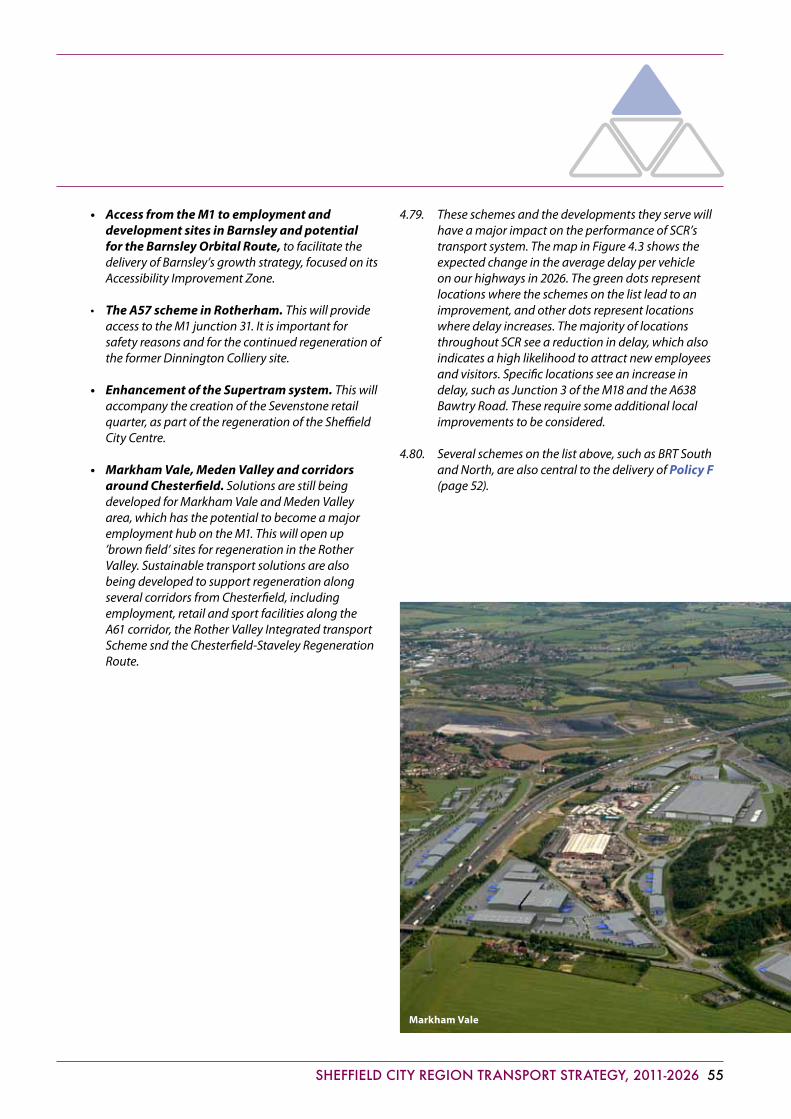
Sheffield City Region tRanSpoRt StRategy, 2011-2026 55
• AccessfromtheM1toemploymentanddevelopmentsitesinBarnsleyandpotentialfortheBarnsleyOrbitalRoute, to facilitate the delivery of Barnsley’s growth strategy, focused on its Accessibility Improvement Zone.
• TheA57schemeinRotherham. This will provide access to the M1 junction 31. It is important for safety reasons and for the continued regeneration of the former Dinnington Colliery site.
• EnhancementoftheSupertramsystem. This will accompany the creation of the Sevenstone retail quarter, as part of the regeneration of the Sheffield City Centre.
• MarkhamVale,MedenValleyandcorridorsaroundChesterfield. Solutions are still being developed for Markham Vale and Meden Valley area, which has the potential to become a major employment hub on the M1. This will open up ’brown field’ sites for regeneration in the Rother Valley. Sustainable transport solutions are also being developed to support regeneration along several corridors from Chesterfield, including employment, retail and sport facilities along the A61 corridor, the Rother Valley Integrated transport Scheme snd the Chesterfield-Staveley Regeneration Route.
4.79. These schemes and the developments they serve will have a major impact on the performance of SCR’s transport system. The map in Figure 4.3 shows the expected change in the average delay per vehicle on our highways in 2026. The green dots represent locations where the schemes on the list lead to an improvement, and other dots represent locations where delay increases. The majority of locations throughout SCR see a reduction in delay, which also indicates a high likelihood to attract new employees and visitors. Specific locations see an increase in delay,suchasJunction3oftheM18andtheA638Bawtry Road. These require some additional local improvements to be considered.
4.80. Several schemes on the list above, such as BRT South and North, are also central to the delivery of Policy F (page 52).
Markham Vale
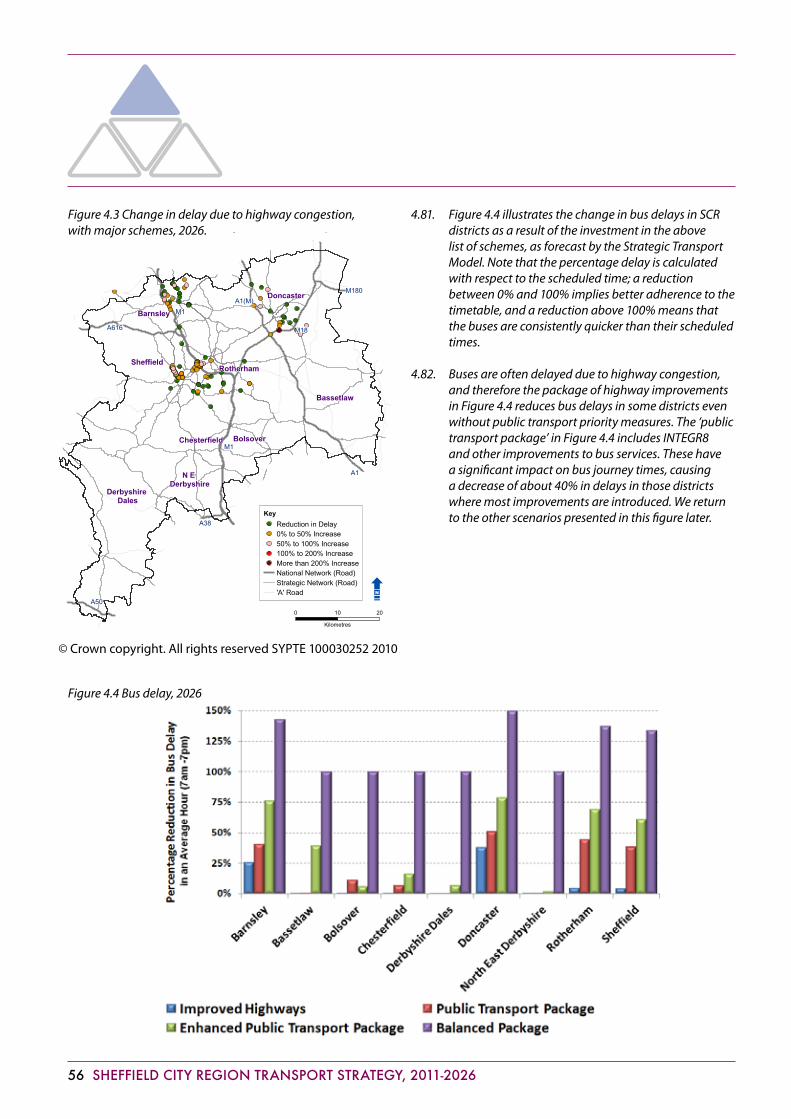
56 Sheffield City Region tRanSpoRt StRategy, 2011-2026
4.81. Figure 4.4 illustrates the change in bus delays in SCR districts as a result of the investment in the above list of schemes, as forecast by the Strategic Transport Model. Note that the percentage delay is calculated with respect to the scheduled time; a reduction between 0% and 100% implies better adherence to the timetable, and a reduction above 100% means that the buses are consistently quicker than their scheduled times.
4.82. Buses are often delayed due to highway congestion, and therefore the package of highway improvements in Figure 4.4 reduces bus delays in some districts even without public transport priority measures. The ‘public transport package’ in Figure 4.4 includes INTEGR8 and other improvements to bus services. These have a significant impact on bus journey times, causing a decrease of about 40% in delays in those districts where most improvements are introduced. We return to the other scenarios presented in this figure later.
M1
Bassetlaw
Doncaster
Derbyshire Dales
Sheffield
Barnsley
Rotherham
Bolsover
N E Derbyshire
Chesterfield
M18
A1
A616
A50
A1(M)
M1
M180
A38Key
Reduction in Delay0% to 50% Increase50% to 100% Increase100% to 200% IncreaseMore than 200% IncreaseNational Network (Road)Strategic Network (Road)'A' Road
This map is based upon Ordnance Survey material with the permission of Ordnance Survey on behalf of the Controllerof Her Majesty's Stationery Office © Crown copyright. Unauthorised reproduction infringes Crown copyright and may lead to prosecution or civil proceedings. SYPTE 100030252 2010
LTP3\Modelling\Delay comparisons 251110
Junc Delays - Test and Core Scenario 251110
0 2010
Kilometres
Figure 4.4 Bus delay, 2026
Figure 4.3 Change in delay due to highway congestion, with major schemes, 2026.
© Crown copyright. All rights reserved SYPTE 100030252 2010

Sheffield City Region tRanSpoRt StRategy, 2011-2026 57
The urban environment
4.83. Our strategy seeks to play a role in making the urban environment surrounding our networks more attractive. Lively urban centres, and particularly those which host vibrant culture and leisure activity, are also more capable of attracting inward investment and job creation. Considerable success in creating attractive public places has already been made around the Sheffield railway station and ‘Gold Route’, around the Barnsley Interchange and at the pedestrianised area in central Doncaster.
4.84. SCR must continue to offer a high quality of life to its residents and those who wish to visit or invest here. It is therefore important to expand the success of public realm projects from selected locations on to other residential and industrial parts of SCR.
4.85. The need to make decisions about the desired characteristics of streets and local centres provides opportunities for us to take forward the Government’s ‘localism’ and ‘Big Society’78
challenges. We want to proactively seek opportunities to give the public the power to be more involved in local decisions.
Policy H: To develop high-quality public places
4.86. We will continue to work with partners and with the public to design improvements to streetscape and the urban environment. Key examples include the following:
• Improvingaccessibilityandstreetscapebetweentherailway station and town centre in Rotherham, and promoting a more vibrant environment through encouraging retail.
• ImprovingtheshoppingenvironmentinChesterfieldthrough the Town Centre Masterplan.
• Encouragingtheintroductionofinterventionstoimprove public places in the Dearne Valley as part of the eco-vision initiative.
• ImprovingthepublicrealminBarnsleytolinkthetransport interchange, market and surrounding area.
4.87. Interventions to develop attractive public places will often be linked to the following activities:
• Theprotectionandenhancementofheritagesites,to be delivered in consultation with English Heritage.
• Theprotectionandenhancementofgreenspace and public rights of way, such as riverside footpaths, especially where they provide alternative opportunities for active travel.
• Theuseofgreenspacetoalleviatefloodsandenhance biodiversity.
• Treeplanting,whichhasbothaestheticandenvironmental advantages.
4.88. Integral parts of the design of any improvement to the urban environment are safety considerations (see Policy Y, page 87 and Policy Z, page 87), environmental considerations (see PolicyV, page 83) and our aspiration to encourage walking and cycling (see Policy S, page 79).
If we are successful in supporting development and regeneration, new high-quality transport links will attract new businesses to the area, and new jobs will be created where it was previously difficult to travel. SCR will become renowned for its superb urban environment and particularly for its welcoming employment centres.
78 http://www.thebigsociety.co.uk (last accessed: 02 Dec 2010)

58 Sheffield City Region tRanSpoRt StRategy, 2011-2026
Transport and land use
4.89. Our analysis gives clear evidence79 that improving connectivity through building new infrastructure alone is not sufficient to achieve our goals. The more we grow and prosper, the higher the risk of increased car use, congestion and pollution. To secure long-term gains we therefore need to ensure that SCR’s spatial development is aligned with its capability to accommodate its own growth.
4.90. The most effective way for an area to experience growth without bearing consequences such as congestion and an increase in emissions is through prioritising development in areas that already have the capacity to contain this growth. Controlled growth along existing transport corridors and near transport interchanges can make SCR denser, with more intense activity in central locations. Such growth layout reduces the need to travel long distances, and as a result, it reduces traffic and further encourages travel by walking and cycling.
4.91. Concentrated growth also enables public transport operators to offer attractive high-frequency routes, serving high levels of demand at clearly-defined locations. It therefore also intensifies business activity in these locations and generates agglomeration benefits.
4.92. This long-established planning concept80, which became formal guidance in the 1990’s, also encourages the mixture of specific combinations of land uses in adjacent sites or in the same site. Mixing housing, office and light retail developments reduces the length and duration of commuting or shopping trips, and reduces traffic, especially during peak periods.
4.93. Figure 4.2, presented earlier, shows public transport passenger flows in the larger urban centres in SCR, based on our Strategic Transport Model. The figure implicitly represents more general trends of reduction in congestion and acceleration in economic activity. The figure shows that the better results are achieved by combining public transport improvements with a condensed land use pattern, concentrated along key corridors, as represented in the ‘balanced package’ set of results.
4.94. It should be noted that the ‘balanced package’ in Figure 4.2 is based on a certain land use pattern, oriented towards public transport corridors, but more drastic forms of this pattern are possible, with stricter adherence to the same principles. Such stricter scenarios are likely to lead to a bigger impact than that shown.
Policy I: To focus new development along key public transport corridors and in places adjacent to existing shops and services
Sheffield Business Park
79 Evidence Base Document 3 - Forecasting80 Department for Communities and Local Government, (2001), Planning Policy Guidance 13: Transport

Sheffield City Region tRanSpoRt StRategy, 2011-2026 59
4.95. A proactive approach to coordinating land use and transport is critical to the success of our strategy. Figure 3.14 in chapter 3 identifies areas where accessibility by existing public transport services is considered high. A major study we have recently undertaken81 divided sites for potential future development into categories based on their location on this map.
4.96. We will ensure that proximity to the public transport network, as reflected in this form of accessibility mapping, is at the heart of the process whereby locations of new development are approved, favouring ‘sustainable sites’, i.e. those sites which are highly accessible by public transport, by bike or on foot.
4.97. Along existing public transport corridors, and near stations, interchanges, shops and offices, we will work to strengthen those types of land use which are missing to complete a balanced land use mix. Such a mix can give people the choice to live, work, shop and undertake leisure activities without having to travel a long distance.
4.98. Barnsley has defined an Accessibility Improvement Zone which covers the core urban part of the borough, and it focuses its future development plans within this zone. Outside the urban core area, new housing is developed at sites adjacent to railway stations, such as Wombwell, Elsecar and Darton, adhering to the principles of transit-oriented development.
4.99. It should be noted that the policy to integrate transport planning and land use planning also means we should ensure the capacity on the selected corridors is sufficient. Services along these key corridors should be enhanced to accommodate the increase in demand, as we discuss in Policy F (page 52), Policy G (page 54), Policy K (page 62) and Policy N (page 71).
4.100. Working with public transport operators, local planners and developers, we will examine ways of integrating the design of future developments with the design of public transport, footpaths and cycle routes serving them. We will work with developers to ensure that residents and employees have access to information on sustainable travel options; this is further discussed in PolicyT (page 81).
4.101. The provision of options to reduce the need to travel a long distance relates to initiatives to facilitate working without travelling. This is enabled either through introducing flexible working patterns and home working, or with the use of technology. Technological substitutes to commute and business travel include the general use of the internet and specific applications for teleconferencing. Such options are becoming increasingly viable thanks to advances in broadband capacity, and SCR has a lead in this market through the Digital Region82 initiative. We welcome such initiatives, and will regularly monitor their impacts and the readiness of the market to adopt such work patterns more widely.
4.102. In some cases, locating new development close to the existing network will reduce the need for car parking on site. There is an aspiration to promote car-free housing developments in the Dearne Valley, to encourage a modal shift away from the private car. This aspiration is fully consistent with this policy.
Local rail service
81 South Yorkshire Passenger Transport Executive, Land Use and Transport Integration Project82 http://www.digitalregion.co.uk (last accessed 02nd Dec 2010)

60 Sheffield City Region tRanSpoRt StRategy, 2011-2026
Controlling congestion
4.103. Congestion is a cause for a loss of productive work time, carbon emissions, air pollution and noise, and can therefore put at risk our efforts to brand SCR as an attractive area. A successful delivery of our strategy will ensure that people in SCR willingly make travel choices that do not increase congestion.
4.104. Still, we wish to avoid a ‘rebound effect’ whereby car users who chose alternative modes of travel are replaced by new car users, who wish to benefit from the improved traffic conditions but in fact cause the poor conditions to persist.
4.105. Parking restraints and pricing, workplace parking levies, reallocation of road space and road user charging are demand management measures applied in different places to reduce private car use in urban centres. Some of these are also applied in SCR, although at a relatively moderate level. There is clear evidence that stricter demand management is often highly effective, but there is also clear evidence that it causes some travellers to prefer travel to places where such measures are not applied.
4.106. SCR partners have agreed that stringent demand management measures are not a viable option to implement in the current economic climate, when the area strives to reduce unemployment and attract visitors, shoppers and investors. Forecasts from our Urban Dynamic Model83 have confirmed that strict demand management measures may slow down the area’s economic recovery and cause a shift of employment and commerce to neighbouring areas.
4.107. Nevertheless, in the longer term it is still clear that avoidance of any means of demand management will bring the levels of congestion back to their previous levels and above, and cause SCR to lose benefits gained from the application of other policies. To illustrate this, Figure 4.4 shows that the most significant reduction in delay (for buses but also for other highway users which are not presented) is achieved through a ‘balanced package’. In addition to the schemes listed in Policy G (page 54) and substantial public transport improvements, this package includes measures to control the total level of highway demand.
4.108. Our policy is therefore to remain alert to changes in traffic levels, emissions and to the pace of SCR’s economic recovery, and to adopt a phased approach to the application of demand management policies. In the short term it is likely that no such measures will be taken; this will be reassessed periodically.
Policy J: To apply parking policies to promote efficient car use, while remaining sensitive to the vulnerability of urban economies
Rotherham town centre
83 Evidence Base Document 3 - Forecasting

Sheffield City Region tRanSpoRt StRategy, 2011-2026 61
4.109. It is likely that future demand management will take the form of parking policies, as they provide sufficient flexibility to adjust the price and geographical scope to the desired magnitude of impact. For example, if high levels of traffic during peak periods are deemed the main issue to address, applying different tariffs for short-stay and long-stay parking can ensure that public transport becomes a more competitive travel option for commuters, while travellers using their cars for other purposes are less affected.
4.110. The key consideration guiding the delivery of this policy is the need to exercise great sensitivity to phasing and timing. Some of our analytical tools, including the Sheffield and Rotherham Transport Model, have been developed with particular attention to the ability to study the impact of parking policies. Careful forecasting and scenario testing, as well as some market research, will therefore precede the application of any demand management measures, to ensure that their likely impacts are consistent with our goal of supporting SCR’s economic growth.
If we are successful in delivering these policies, new shops, houses and offices will be built in places that everyone can access easily. More people will have an option to live and work in a central location, and their trip to work or to the shops will be much shorter than it is today.
Doncaster Park and Ride
Alhambra Shopping Centre,
Barnsley
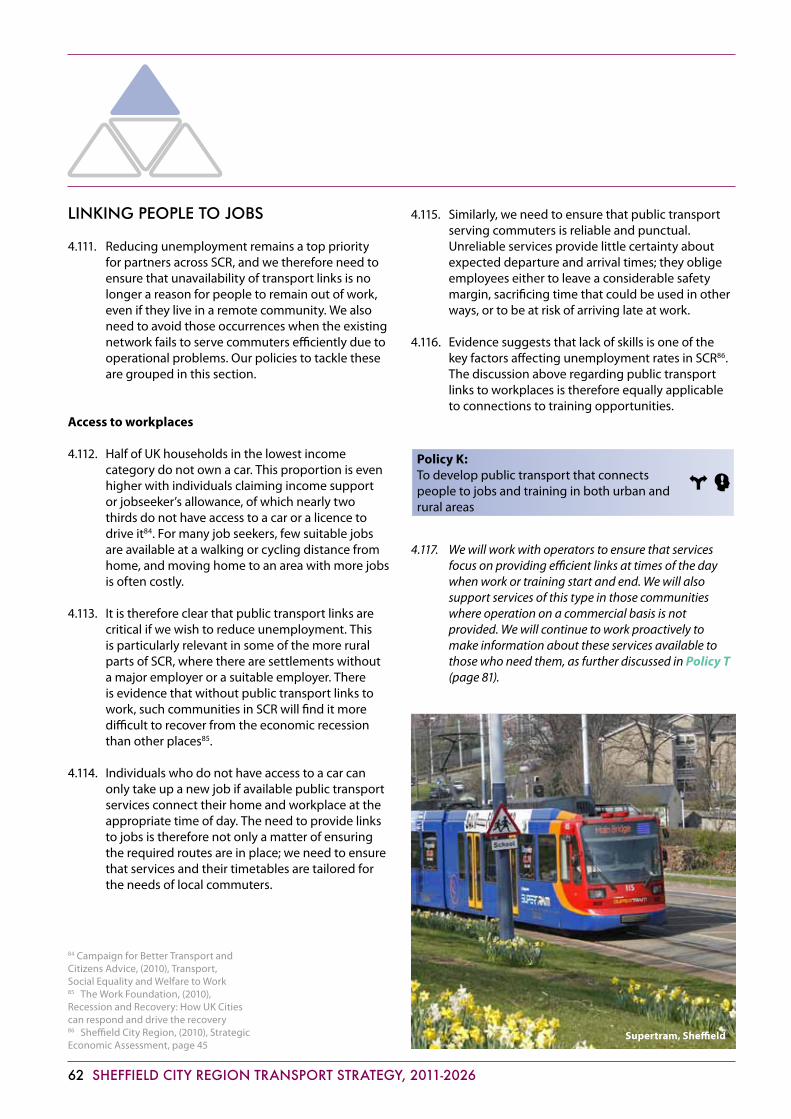
62 Sheffield City Region tRanSpoRt StRategy, 2011-2026
linking peOple tO JObs
4.111. Reducing unemployment remains a top priority for partners across SCR, and we therefore need to ensure that unavailability of transport links is no longer a reason for people to remain out of work, even if they live in a remote community. We also need to avoid those occurrences when the existing network fails to serve commuters efficiently due to operational problems. Our policies to tackle these are grouped in this section.
Access to workplaces
4.112. Half of UK households in the lowest income category do not own a car. This proportion is even higher with individuals claiming income support or jobseeker’s allowance, of which nearly two thirds do not have access to a car or a licence to drive it84. For many job seekers, few suitable jobs are available at a walking or cycling distance from home, and moving home to an area with more jobs is often costly.
4.113. It is therefore clear that public transport links are critical if we wish to reduce unemployment. This is particularly relevant in some of the more rural parts of SCR, where there are settlements without a major employer or a suitable employer. There is evidence that without public transport links to work, such communities in SCR will find it more difficult to recover from the economic recession than other places85.
4.114. Individuals who do not have access to a car can only take up a new job if available public transport services connect their home and workplace at the appropriate time of day. The need to provide links to jobs is therefore not only a matter of ensuring the required routes are in place; we need to ensure that services and their timetables are tailored for the needs of local commuters.
4.115. Similarly, we need to ensure that public transport serving commuters is reliable and punctual. Unreliable services provide little certainty about expected departure and arrival times; they oblige employees either to leave a considerable safety margin, sacrificing time that could be used in other ways, or to be at risk of arriving late at work.
4.116. Evidence suggests that lack of skills is one of the key factors affecting unemployment rates in SCR86. The discussion above regarding public transport links to workplaces is therefore equally applicable to connections to training opportunities.
Policy K:To develop public transport that connects people to jobs and training in both urban and rural areas
4.117. We will work with operators to ensure that services focus on providing efficient links at times of the day when work or training start and end. We will also support services of this type in those communities where operation on a commercial basis is not provided. We will continue to work proactively to make information about these services available to those who need them, as further discussed inPolicyT (page 81).
Supertram, Sheffield
84 Campaign for Better Transport and Citizens Advice, (2010), Transport, Social Equality and Welfare to Work85 The Work Foundation, (2010), Recession and Recovery: How UK Cities can respond and drive the recovery 86 Sheffield City Region, (2010), Strategic Economic Assessment, page 45

Sheffield City Region tRanSpoRt StRategy, 2011-2026 63
4.118. We will also continue to tailor innovative solutions for specific needs and promote the use of bespoke forms of travel, such as car clubs, car sharing, provision of scooters (“Wheels to Work”), community transport and demand-responsive routes.
4.119. Policy I (page 58), which supports the location of new development in easily-accessible locations, will play an important role, in the longer term, in expanding the range of job opportunities available to most SCR residents.
4.120. While the discussion above focuses on those travellers who have no access to a car, we also wish to encourage those with a car to consider commuting by public transport. The provision of public transport for a wider range of purposes is covered later in Policy N (page 71).
4.121. Policy N also elaborates on the work currently undertaken in parts of SCR to examine alternative approaches to ensuring high standards of public transport services, either through voluntary agreements with operators or by introducing franchised services as part of a Quality Contract Scheme.
4.122. Specific schemes which would facilitate the provision of rapid and reliable public transport access to workplaces are described under other policies. This includes rail schemes in Policy D (page 50); INTEGR8 and inter-urban links in Policy F (page 52); and BRT schemes in Policy G (page 54).
4.123. Analysis using our Strategic Transport Model suggests that a package of all local public transport schemes currently being developed by SCR partners, focused on efficient links for commuters, can lead to a significant improvement in the level of service, and associated economic benefits. This is presented as the “public transport package” in Figure 4.4.
4.124. The “enhanced public transport package” in the same figure also includes BRT North and South, major elements of the INTEGR8 programme, improved tram services, “tram-train” between Sheffield and Rotherham and improved public transport between Barnsley and Doncaster. The enhanced package reduces bus delays by up to 80%. This is also an indirect indicator for its positive influence on other road users and for its broader economic impacts.
If we are successful in improving access to jobs, jobseekers will have more options to choose from even if they do not drive. Better public transport connections to work places will also appeal to others, which will prefer to leave their car at home.
Doncaster town centre

64 Sheffield City Region tRanSpoRt StRategy, 2011-2026
Traffic management
4.125. We have already discussed, in Policy B (page 47), the negative impacts of the lack of reliability and resilience on the national network. We have described how we will work with the Highways Agency to tackle these. Reliability and resilience are also critical for users of the strategic road network, which is owned and operated by SCR authorities.
4.126. Fluctuations of travel times due to varying traffic conditions, delays due to incidents, and closures or diversions due to weather conditions are all costly and inefficient. The time spent in such events comes at the expense of personal leisure time in the case of commuters, and at the expense of more productive activities in the case of business travellers. Those directly affected include car users and passengers on buses and coaches.
4.127. Network reliability and resilience can be improved using real-time traffic control, and the use of new technology is central to this policy. There is a continuous development of enhanced systems for managing and monitoring traffic, providing real-time traveller information based on cellular and GPS technologies, and communicating with emergency services87. We are keen to place SCR at a leading edge in the area of using such technologies to improve network performance.
4.128. It is also critical that we develop detailed contingency plans to keep our networks operational at all times, with different scenarios considered for different cases of extreme weather, collisions, terrorist attack and other types of network failure.
Policy L:To reduce the amount of productive time lost on the strategic road network and improve its resilience and reliability
4.129. A major part of SCR has already invested in traffic management infrastructure and intelligent traffic control, through the South Yorkshire Integrated Transport System programme, SYITS . We will expand and enhance systems to improve the way existing capacity is utilised and to provide information to travellers in all stages of their journey, so that they can make informed travel decisions either in advance or in real time.
4.130. We will ensure that new interventions and future maintenance make the strategic network better capable of coping with greater fluctuation in weather as a result of climate change, including periods of snowfall, ice, strong winds and flooding.
4.131. We will develop route-specific contingency plans, identifying approaches for minimising disruption to public transport vehicles, freight and other road users. The contingency plans will also specify procedures for coordination between agencies at times of disruption and local routes that can be used for freight in cases of road closure on the strategic network.
4.132. Our strategic network covers the whole of SCR and straddlesadministrativeboundaries.Jointworkingbetween authorities in these areas on network operations, and especially facilitating coordination of real-time control, is still in its early days. We will continue to work together to make work procedures more efficient, for the benefits of road users anywhere in SCR.
Real-time information display
87 Parliament Office of Science and Technology, (2009), Intelligent Transport Systems
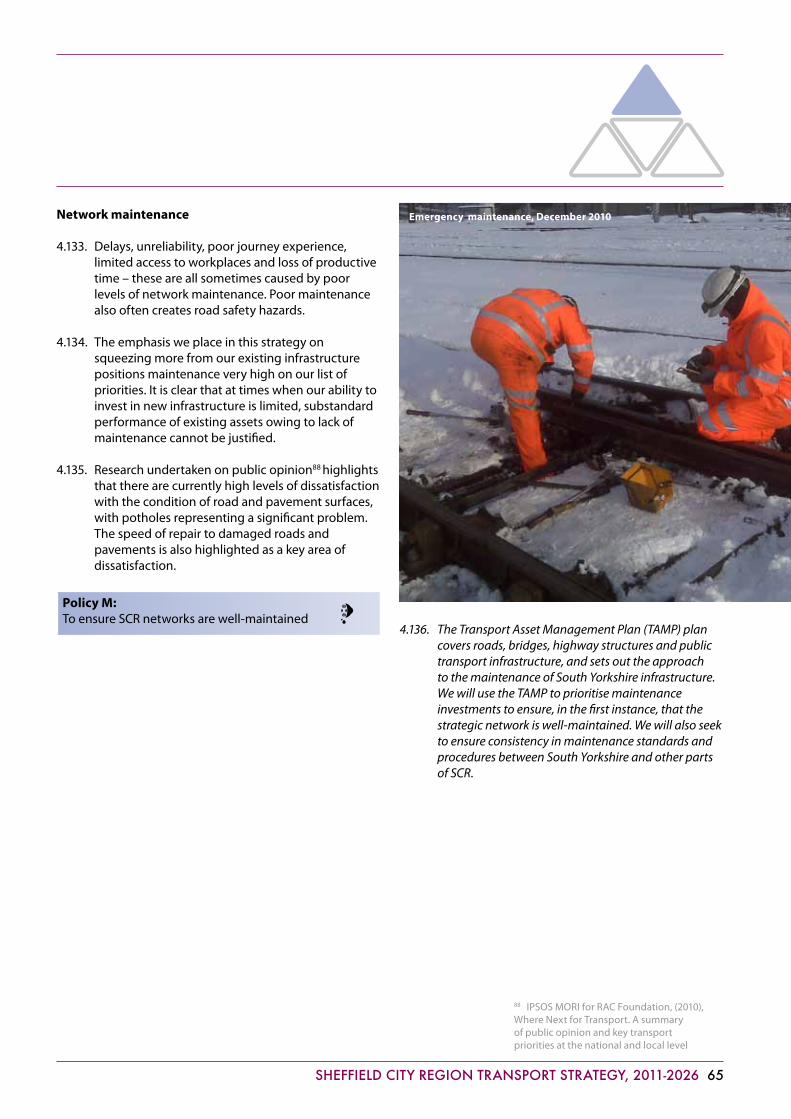
Sheffield City Region tRanSpoRt StRategy, 2011-2026 65
Network maintenance
4.133. Delays, unreliability, poor journey experience, limited access to workplaces and loss of productive time – these are all sometimes caused by poor levels of network maintenance. Poor maintenance also often creates road safety hazards.
4.134. The emphasis we place in this strategy on squeezing more from our existing infrastructure positions maintenance very high on our list of priorities. It is clear that at times when our ability to invest in new infrastructure is limited, substandard performance of existing assets owing to lack of maintenance cannot be justified.
4.135. Research undertaken on public opinion88 highlights that there are currently high levels of dissatisfaction with the condition of road and pavement surfaces, with potholes representing a significant problem. The speed of repair to damaged roads and pavements is also highlighted as a key area of dissatisfaction.
Policy M:To ensure SCR networks are well-maintained
4.136. The Transport Asset Management Plan (TAMP) plan covers roads, bridges, highway structures and public transport infrastructure, and sets out the approach to the maintenance of South Yorkshire infrastructure. We will use the TAMP to prioritise maintenance investments to ensure, in the first instance, that the strategic network is well-maintained. We will also seek to ensure consistency in maintenance standards and procedures between South Yorkshire and other parts of SCR.
Emergency maintenance, December 2010
88 IPSOS MORI for RAC Foundation, (2010), Where Next for Transport. A summary of public opinion and key transport priorities at the national and local level
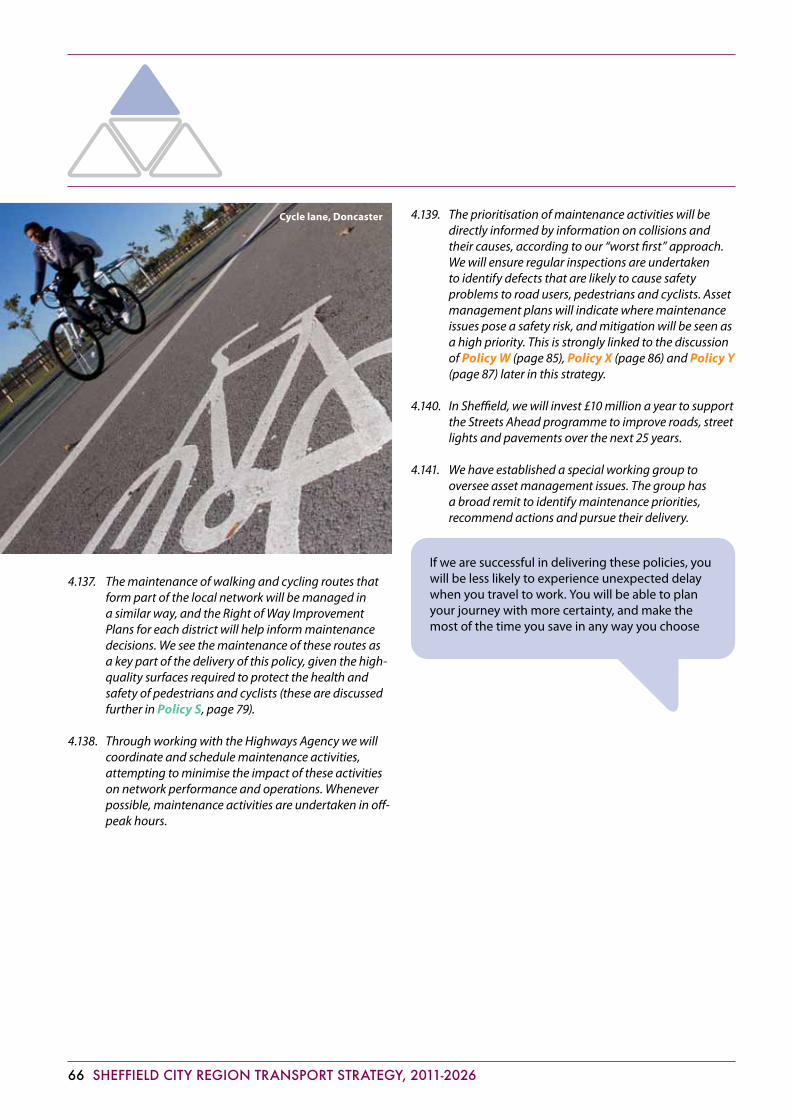
66 Sheffield City Region tRanSpoRt StRategy, 2011-2026
4.137. The maintenance of walking and cycling routes that form part of the local network will be managed in a similar way, and the Right of Way Improvement Plans for each district will help inform maintenance decisions. We see the maintenance of these routes as a key part of the delivery of this policy, given the high-quality surfaces required to protect the health and safety of pedestrians and cyclists (these are discussed further in Policy S, page 79).
4.138. Through working with the Highways Agency we will coordinate and schedule maintenance activities, attempting to minimise the impact of these activities on network performance and operations. Whenever possible, maintenance activities are undertaken in off-peak hours.
4.139. The prioritisation of maintenance activities will be directly informed by information on collisions and their causes, according to our “worst first” approach. We will ensure regular inspections are undertaken to identify defects that are likely to cause safety problems to road users, pedestrians and cyclists. Asset management plans will indicate where maintenance issues pose a safety risk, and mitigation will be seen as a high priority. This is strongly linked to the discussion of PolicyW (page 85), Policy X (page 86) and Policy Y (page 87) later in this strategy.
4.140. In Sheffield, we will invest £10 million a year to support the Streets Ahead programme to improve roads, street lights and pavements over the next 25 years.
4.141. We have established a special working group to oversee asset management issues. The group has a broad remit to identify maintenance priorities, recommend actions and pursue their delivery.
If we are successful in delivering these policies, you will be less likely to experience unexpected delay when you travel to work. You will be able to plan your journey with more certainty, and make the most of the time you save in any way you choose
Cycle lane, Doncaster
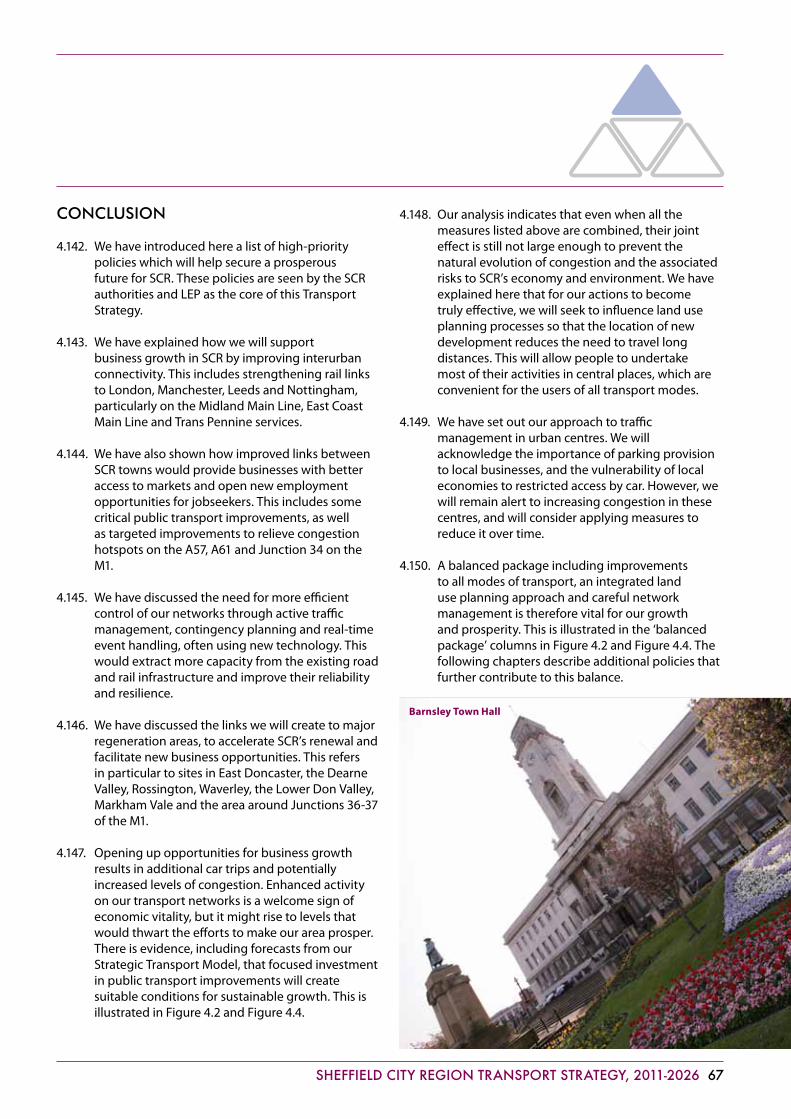
Sheffield City Region tRanSpoRt StRategy, 2011-2026 67
cOnclusiOn
4.142. We have introduced here a list of high-priority policies which will help secure a prosperous future for SCR. These policies are seen by the SCR authorities and LEP as the core of this Transport Strategy.
4.143. We have explained how we will support business growth in SCR by improving interurban connectivity. This includes strengthening rail links to London, Manchester, Leeds and Nottingham, particularly on the Midland Main Line, East Coast Main Line and Trans Pennine services.
4.144. We have also shown how improved links between SCR towns would provide businesses with better access to markets and open new employment opportunities for jobseekers. This includes some critical public transport improvements, as well as targeted improvements to relieve congestion hotspots on the A57, A61 and Junction 34 on the M1.
4.145. We have discussed the need for more efficient control of our networks through active traffic management, contingency planning and real-time event handling, often using new technology. This would extract more capacity from the existing road and rail infrastructure and improve their reliability and resilience.
4.146. We have discussed the links we will create to major regeneration areas, to accelerate SCR’s renewal and facilitate new business opportunities. This refers in particular to sites in East Doncaster, the Dearne Valley, Rossington, Waverley, the Lower Don Valley, Markham Vale and the area around Junctions 36-37 of the M1.
4.147. Opening up opportunities for business growth results in additional car trips and potentially increased levels of congestion. Enhanced activity on our transport networks is a welcome sign of economic vitality, but it might rise to levels that would thwart the efforts to make our area prosper. There is evidence, including forecasts from our Strategic Transport Model, that focused investment in public transport improvements will create suitable conditions for sustainable growth. This is illustrated in Figure 4.2 and Figure 4.4.
4.148. Our analysis indicates that even when all the measures listed above are combined, their joint effect is still not large enough to prevent the natural evolution of congestion and the associated risks to SCR’s economy and environment. We have explained here that for our actions to become truly effective, we will seek to influence land use planning processes so that the location of new development reduces the need to travel long distances. This will allow people to undertake most of their activities in central places, which are convenient for the users of all transport modes.
4.149. We have set out our approach to traffic management in urban centres. We will acknowledge the importance of parking provision to local businesses, and the vulnerability of local economies to restricted access by car. However, we will remain alert to increasing congestion in these centres, and will consider applying measures to reduce it over time.
4.150. A balanced package including improvements to all modes of transport, an integrated land use planning approach and careful network management is therefore vital for our growth and prosperity. This is illustrated in the ‘balanced package’ columns in Figure 4.2 and Figure 4.4. The following chapters describe additional policies that further contribute to this balance.
Barnsley Town Hall
68 Sheffield City Region tRanSpoRt StRategy, 2011-2026
The ‘Ox Stones’, Sheffield
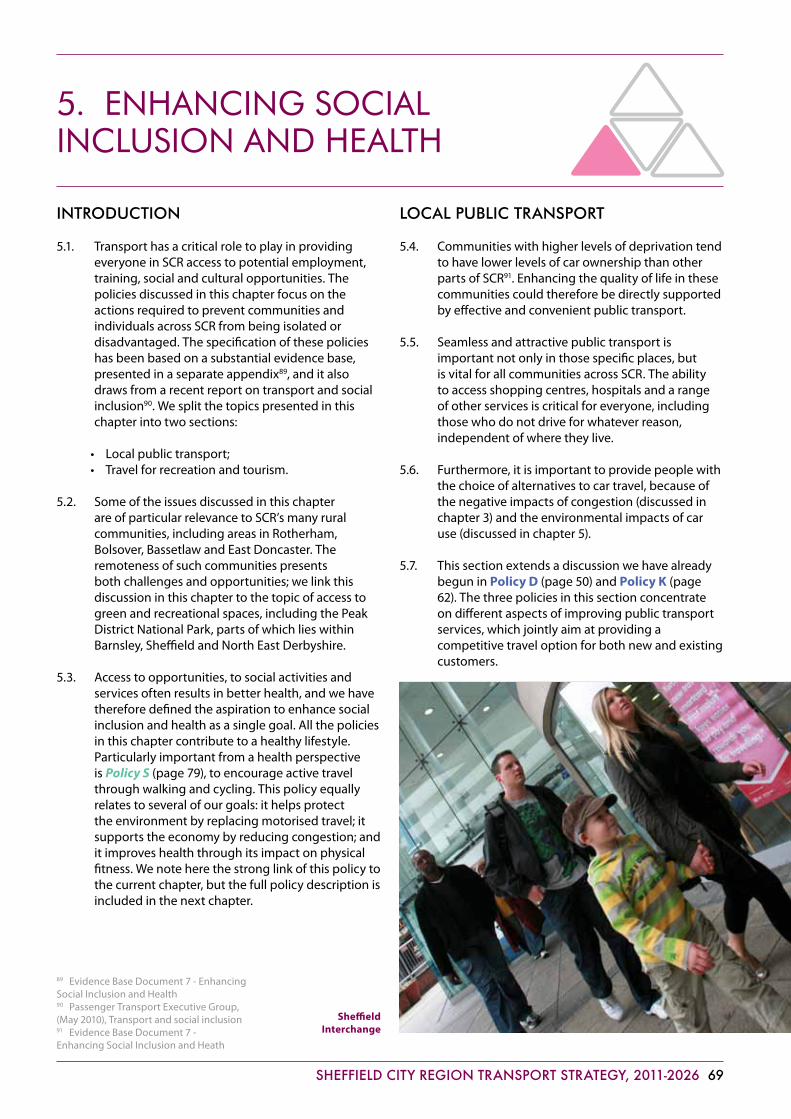
Sheffield City Region tRanSpoRt StRategy, 2011-2026 69
5. enhanCing SoCial inCluSion and health
intrOductiOn
5.1. Transport has a critical role to play in providing everyone in SCR access to potential employment, training, social and cultural opportunities. The policies discussed in this chapter focus on the actions required to prevent communities and individuals across SCR from being isolated or disadvantaged. The specification of these policies has been based on a substantial evidence base, presented in a separate appendix89, and it also draws from a recent report on transport and social inclusion90. We split the topics presented in this chapter into two sections:
• Localpublictransport;• Travelforrecreationandtourism.
5.2. Some of the issues discussed in this chapter are of particular relevance to SCR’s many rural communities, including areas in Rotherham, Bolsover, Bassetlaw and East Doncaster. The remoteness of such communities presents both challenges and opportunities; we link this discussion in this chapter to the topic of access to green and recreational spaces, including the Peak District National Park, parts of which lies within Barnsley, Sheffield and North East Derbyshire.
5.3. Access to opportunities, to social activities and services often results in better health, and we have therefore defined the aspiration to enhance social inclusion and health as a single goal. All the policies in this chapter contribute to a healthy lifestyle. Particularly important from a health perspective is Policy S (page 79), to encourage active travel through walking and cycling. This policy equally relates to several of our goals: it helps protect the environment by replacing motorised travel; it supports the economy by reducing congestion; and it improves health through its impact on physical fitness. We note here the strong link of this policy to the current chapter, but the full policy description is included in the next chapter.
lOcal public transpOrt
5.4. Communities with higher levels of deprivation tend to have lower levels of car ownership than other parts of SCR91. Enhancing the quality of life in these communities could therefore be directly supported by effective and convenient public transport.
5.5. Seamless and attractive public transport is important not only in those specific places, but is vital for all communities across SCR. The ability to access shopping centres, hospitals and a range of other services is critical for everyone, including those who do not drive for whatever reason, independent of where they live.
5.6. Furthermore, it is important to provide people with the choice of alternatives to car travel, because of the negative impacts of congestion (discussed in chapter 3) and the environmental impacts of car use (discussed in chapter 5).
5.7. This section extends a discussion we have already begun in Policy D (page 50) and Policy K (page 62). The three policies in this section concentrate on different aspects of improving public transport services, which jointly aim at providing a competitive travel option for both new and existing customers.
Sheffield Interchange
89 Evidence Base Document 7 - Enhancing Social Inclusion and Health90 Passenger Transport Executive Group, (May 2010), Transport and social inclusion91 Evidence Base Document 7 - Enhancing Social Inclusion and Heath

70 Sheffield City Region tRanSpoRt StRategy, 2011-2026
Quality of service
5.8. To develop our local public transport into people’s preferred travel mode we need to ensure it consistently provides a high level of service in terms of its coverage, frequency, speed, reliability and convenience. The most fundamental requirement from the public transport network is that its geographical coverage matches the origins and destinations of people’s trips, offering them service where they need to go from and to.
5.9. Public transport services need to offer an efficient use of time, and one of the main ways of reducing their journey times is through the introduction of priority measures, including dedicated bus lanes and prioritised signal settings for buses and trams.
5.10. Priority measures for public transport vehicles also improve their reliability and punctuality. The last decade has seen a wave of studies and publications, repeatedly confirming that the reliability of public transport services is critical from a passenger’s perspective92 93 94. Measures for improving public transport reliability are also included in our South Yorkshire Intelligent Transport System programme, SYITS, presented in chapter 4.
5.11. For public transport to offer a competitive travel option, a critical feature is the quality of integration between different modes and services. Careful scheduling of transfers between routes, convenient interchange facilities, and ticketing arrangements designed with passengers’ convenience in mind – these can all make a substantial difference to the way the service is perceived by existing passengers and potential new ones95.
5.12. The need to access different activities by public transport implies that a high level of integration is required between the public transport network and these activities, and not only between routes or operators. Such integration can be achieved through coordination of the patterns of service and hours of operation with hospitals, universities and shopping centres.
5.13. As part of Policy I (page 58) we have described the need to concentrate new development along corridors which already are well-served by public transport. It should be noted that this also means we should ensure that passenger capacity on the selected corridors is sufficient to accommodate this growth. Implementation of all the measures discussed here as targeted interventions, along the corridors identified as suitable for high growth, is essential for the success of Policy I.
5.14. Park and Ride (P&R) facilities have an important role in a package of public transport improvements. P&R is an effective solution on corridors with high travel demand, especially for those travelling to SCR’s larger urban areas from its suburban or rural parts. P&R combines the use of a car, motorcycle or bike in the area where the public transport network is sparse with the use of a ‘shuttle’ service on the urban part of the journey. If designed well, it can therefore combine a high level of convenience with the benefits of reducing the number of vehicles on the radial urban corridors.
Customer service, Doncaster Park & Ride
92 Department for Transport, (2007), Model to Assess Public Transport Reliability93 University of Leeds, Institute for Transport Studies (2007), The Cost of Bus Reliability94 South Yorkshire Passenger Transport Executive (2010), Customer Satisfaction Surveys95 Department for Transport, (2009), The Future of Urban Transport
Sheffield City Region tRanSpoRt StRategy, 2011-2026 71
5.15. The quality of our public transport offer also depends on a range of ‘soft’ measures such as a comfortable internal design of buses, trams and trains, and the waiting environment at stops, stations and interchanges. There is evidence for the importance of these factors in influencing travel choices96. We presented earlier our recent successes in upgrading interchanges, stations and fleets; similar work continues across SCR.
5.16. Choices made by travellers are influenced by the information they have available when planning their journey. We focus another policy, Policy T (page 81), on the need to assist travellers in SCR to make their travel arrangements; but we stress here the importance of the continuous provision of information to public transport passengers. Such information is required at all stages of a journey, i.e. at home before the journey, at a stop on the street, in a station or an interchange, and on board a vehicle. Information is required in a range of formats, to suit a range of individual needs.
5.17. In the discussion of a diversified package of alternatives to car travel, or for those without a car, we also recognise the role of taxi and private hire services. These offer a high level of flexibility, including coverage of areas with low frequency of scheduled services, and reduce the need for city centre parking. They are particularly useful as a service for passengers making one-way trips, for those travelling with luggage, and for late night or early morning travel.
Policy N:To develop user-friendly public transport, covering all parts of SCR, with high quality of integration between different modes
5.18. We will provide measures of bus priority, particularly during peak periods, such as the Bus Key Routes programme and the Bus Rapid Transit schemes presented in Policy G (page 54), and work to develop similar solutions on additional corridors. We will continue to explore the case for extending our tram network.
5.19. We will also continue to examine the case for P&R schemes, including the INTEGR8 programme, introduced in Policy F (page 52). As part of this programme we are currently investigating potential combinations of high-quality bus corridors and P&R locations. In Doncaster, work is being undertaken to consider a P&R site in the north-east and another site in the south, to complement two existing sites which link the town centre with the A638. In Sheffield, four tram-based P&R sites are currently operated, and bus-based P&R is being considered in the south and the north of the city. Other plans are being developed to expand the use of P&R along rail and tram routes where this is feasible and beneficial.
5.20. We will improve the integration between public transport services through developing multi-modal, customer-friendly ticketing solutions. This includes working with West Yorkshire to build on the ‘Yorcard’ smartcard initiative. We will also work with neighbouring City Regions to improve cross-boundary fare arrangements. This is particularly important in Barnsley, which forms part of SCR and the Leeds City Region.
5.21. We will continue to invest in our interchanges and stations through redesigning and redecorating, improving easy access, renewing facilities and ensuring that a wide range of services for customers is available. Similarly, we will invest in bus and tram stops, to ensure they are attractive, comfortable and safe.
5.22. We will continue our dialogue with the health, education and retail sectors, to ensure that public transport links to major trip attractors are tailored for customer needs. We will aim to provide public transport links not only to the nearest facilities but to the most relevant for specific communities and individuals.
96 Department for Transport, (2009), Door-to-door by public transport

72 Sheffield City Region tRanSpoRt StRategy, 2011-2026
5.23. We will continue to provide passenger information and operate information centres, serving passengers at all stages of their journey. We will continue to explore the use of new technology for the provision of passenger information. We will also work with West Yorkshire to further develop the Real Time and Get There Sooner initiatives.
5.24. We will work more closely with the private hire industry, to ensure that their services match the needs of travellers from different communities in SCR, and to integrate their services in our information systems. We will examine a wider range of flexible and demand-responsive travel options in order to provide more cost-effective public transport to those that most need it.
5.25. We are working in partnership with bus operators to improve the bus services and their quality, as outlined above. The Local Transport Act 2008 also allows a franchise-based alternative to the partnership approach, through a Quality Contract Scheme. Such a scheme would see SCR authorities taking a more direct control over the design and the operation of bus routes, including full specification of the bus network, fares and vehicles.
5.26. Analysis undertaken for different parts of SCR indicates that different solutions are suitable for different places. We will examine options with the bus operators, and will select the mechanism that delivers the best possible bus services for our passengers.
Accessibility
5.27. We discussed earlier the level of accessibility by public transport to different places and activities. Here we discuss more specifically the ability to board the public transport vehicle itself, or alight from it, without physical difficulty. This ability is critical for travellers with special physical needs and learning difficulties. Accommodating the needs of these travellers is both a legal requirement and a social obligation.
Policy O:To ensure that our public transport network is accessible to all
5.28. The tram system is already fully accessible. Platforms at tram stops facilitate level boarding into the low-floor section of the tram, and feature tactile paving to indicate the position of the doors. Trams have a dedicated wheelchair bay which can be also used for buggies. We will continue to negotiate the provision of similar levels of accessibility by train and bus operators, especially for Community Transport services97, and will ensure that accessibility considerations are reflected in our tendered services criteria98.
Community transport, Sheffield
97 Disability Discrimination Act 1995 (amended 2005) and subsequent regulations98 The Service Subsidy Agreements (Tendering) (England) (Amendment) Regulations 2004 No. 609

Sheffield City Region tRanSpoRt StRategy, 2011-2026 73
5.29. Our transport interchanges and railway stations are fully accessible and facilitate independent travel for people with most known types of disabilities. We will continue to explore ways to assist passengers with different physical needs in accessing all public transport facilities, through measures such as dropped or raised kerbs, tactile paving, access ramps, relevant way-finding signage and others.
5.30. The provision of information for travellers with different abilities is closely related to our efforts to improve accessibility, since it allows more people to travel independently. Bus stops with Real Time Information already are fitted with REACT technology to enable visually-impaired passengers to receive audible messages with expected bus times. Trials are planned to test systems for providing audio-visual ‘next stop’ messages on bus services.
5.31. All trams already operate audio-visual announcements on board, and there is an aspiration to introduce such announcements and real-time information displays at tram stops in the future. On-board information provided to rail passengers varies by route and by operator, and we will continue to highlight the need for improvements in our work with the train operating companies.
5.32. We will also strive to provide flexible and ‘on-demand’ transport services for those who have difficulties to access scheduled transport services. This is complemented by alternative solutions, such as mobile libraries.
Affordability
5.33. The above discussion of those who need public transport the most links directly to those who may not be easily able to afford their travel, such as elderly travellers and jobseekers. We must ensure that public transport is affordable for those who depend on it.
5.34. In the bus, rail and tram industries, this is in the hands of the private operators, but we will work in partnership with them and lobby to help keep fares at an affordable level99.
Policy P:To work with operators to keep fares affordable, especially for travellers in need
5.35. In some specific areas, we already fund (or allocate funding for) various schemes to reduce the cost of public transport travel to some users. The most prominent example is the English National Concession Travel Scheme (ENCTS), which provides free public transport travel for pensioners. We extend the standard scheme to include our tram network and local rail services. We also fund reduced fares for younger passengers.
5.36. We will ensure that concessions are used where they are most effective. We will lobby and work with Government, to ensure that funding is sufficient to deliver the levels of service required for travellers in SCR.
5.37. We will also continue to work with partners to overcome administrative boundaries to fare and ticketing arrangements, as discussed in Policy N (page 71).
99 Passenger Transport Executive Group, (2010), Transport & Social Inclusion: Have we made the connections in our cities? Page 28
If we are successful in supporting local public transport, the same opportunities will be available to everyone, whether or not they have access to a car. Your convenience when using public transport will not depend on where you live, what work you do or how physically fit you are.
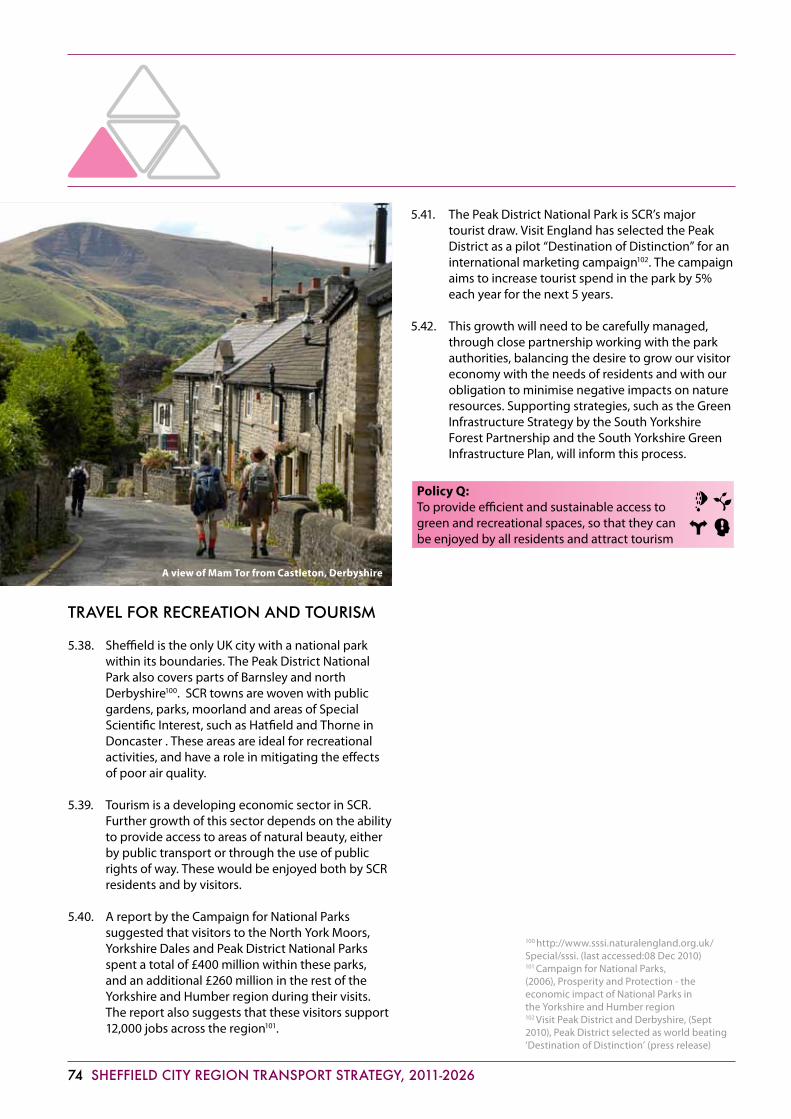
74 Sheffield City Region tRanSpoRt StRategy, 2011-2026
traVel fOr recreatiOn and tOurism
5.38. Sheffield is the only UK city with a national park within its boundaries. The Peak District National Park also covers parts of Barnsley and north Derbyshire100. SCR towns are woven with public gardens, parks, moorland and areas of Special Scientific Interest, such as Hatfield and Thorne in Doncaster . These areas are ideal for recreational activities, and have a role in mitigating the effects of poor air quality.
5.39. Tourism is a developing economic sector in SCR. Further growth of this sector depends on the ability to provide access to areas of natural beauty, either by public transport or through the use of public rights of way. These would be enjoyed both by SCR residents and by visitors.
5.40. A report by the Campaign for National Parks suggested that visitors to the North York Moors, Yorkshire Dales and Peak District National Parks spent a total of £400 million within these parks, and an additional £260 million in the rest of the Yorkshire and Humber region during their visits. The report also suggests that these visitors support 12,000 jobs across the region101.
5.41. The Peak District National Park is SCR’s major tourist draw. Visit England has selected the Peak District as a pilot “Destination of Distinction” for an international marketing campaign102. The campaign aims to increase tourist spend in the park by 5% each year for the next 5 years.
5.42. This growth will need to be carefully managed, through close partnership working with the park authorities, balancing the desire to grow our visitor economy with the needs of residents and with our obligation to minimise negative impacts on nature resources. Supporting strategies, such as the Green Infrastructure Strategy by the South Yorkshire Forest Partnership and the South Yorkshire Green Infrastructure Plan, will inform this process.
Policy Q:To provide efficient and sustainable access to green and recreational spaces, so that they can be enjoyed by all residents and attract tourism
A view of Mam Tor from Castleton, Derbyshire
100 http://www.sssi.naturalengland.org.uk/Special/sssi. (last accessed:08 Dec 2010)101 Campaign for National Parks, (2006), Prosperity and Protection - the economic impact of National Parks in the Yorkshire and Humber region102 Visit Peak District and Derbyshire, (Sept 2010), Peak District selected as world beating ‘Destination of Distinction’ (press release)

Sheffield City Region tRanSpoRt StRategy, 2011-2026 75
5.43. We will ensure that access to green and recreational spaces is provided by sustainable means. To deliver this we will seek to provide public transport services to these areas, either through work with the operators or in other ways. We will support access to parks by coach, when local and environmental considerations deem this appropriate.
5.44. Clearer way-finding, travel planning for residents and visitors, and maintenance of walk and cycle paths will lead to an increase in the number of visitors arriving at these spaces by bike or on foot. Over time, we aspire to link public rights of way into a coherent and accessible network of urban and rural paths. This relates directly to PolicyM (page 65), Policy S (page 79) and PolicyT (page 81).
5.45. The need to carefully balance the positive and negative impacts of tourism applies to the Peak District, Clumber Park, other parks and all heritage sites in SCR.
5.46 The need to balance our development and growth ambitions and the need to look after natural resources and assets is also discussed in the Habitats Regulations Assessment. This assessment (for the South Yorkshire districts) has been prepared in parallel to this strategy, and is published simultaneously. In accordance with the Habitats Regulations Assessment it is highlighted here that the polices specified in this strategy do not provide backing to plan or projects that have significant effects on Sites of Importance for nature Conservation. All plans or projects that stem from our Transport Strategy will need to comply with the requirements of the Habitats Regulation in term of their impact on such sites.
cOnclusiOn
5.47. In this chapter we have introduced policies aimed to help residents from throughout SCR access the services they need and participate in a wide range of cultural and social activities.
5.48. In chapter 4 we presented several policies to ensure that our networks perform efficiently for the benefit of those accessing services and activities by car. Still, many SCR residents rely on public transport services, and the policies presented here demonstrate the key role that public transport improvements play in SCR’s future.
5.49. Making our public transport system attractive, affordable, accessible and easy for everyone to use would assist in meeting our social goals, but would also help deliver positive economic and environmental outcomes. We will endeavour to achieve a significant change to our public transport and reverse the decline in bus patronage, identified in chapter 3, either through voluntary agreements with operators or, in Sheffield and South Rotherham, through the possible introduction of a Quality Contract Scheme.
5.50. We have presented a range of solutions we will pursue, to meet the needs or residents in both rural and urban areas. We have stressed the specific roles of Park and Ride and community transport. We have considered here other alternatives to car travel, which would serve similar goals. We elaborate further on these in the next chapter.
If we are successful in facilitating travel for recreation and tourism, it will become easy for everyone to access our parks and heritage sites, and you will spend more time on leisure activities. This will also attract more visitors and help grow SCR’s tourist industry.

76 Sheffield City Region tRanSpoRt StRategy, 2011-2026
Sheffield city centre

Sheffield City Region tRanSpoRt StRategy, 2011-2026 77
intrOductiOn
6.1. Our goal of reducing emissions from vehicles relates to two different types of challenges. First, emission of carbon dioxide contributes to the greenhouse effect which is widely believed to be a cause of climate change103. Second, emission of other gases causes air pollution, and there is compelling evidence that this causes damage to people’s health104. Both types of emissions put at risk the sustainability of SCR’s growth.
6.2. Under the Climate Change Act 2008, ambitious national targets were set to reduce carbon emissions by at least 80% below 1990 levels by 2050. This general aspiration is also supported by the current government. SCR wants to play a full role in tackling this challenge.
6.3. The main contributor to emissions from transport is trunk road traffic105, and the highest emissions in SCR are recorded near the motorways; the districts most badly hit are Rotherham and Bolsover106. In chapter 4 we have already touched upon the impact of these emissions when discussing the resilience of our networks to the changing weather conditions. While Policy B (page 47) and Policy L (page 64) related to adaptation to climate change, we focus here on mitigating the change.
6.4. Since both carbon emissions and air pollution are outcomes of current patterns of highway travel, some of the actions identified to mitigate them are similar. Some of the policies we have already presented will contribute to this goal. Emissions rise with the increase of the total distance travelled by all vehicles, and therefore a reduction in the number of vehicles on our roads will generally tend to support the development of a more sustainable transport system. This links the matters discussed in this chapter directly to all policies supporting the improvement of public transport services.
6.5. Policy I (page 58), in particular, aims to reduce
the total distance travelled by locating new development close to existing services and public transport corridors. This policy is explicitly informed by environmental considerations.
6.6. We have collated much evidence to support the identification of these actions107, and have developed our policies from published work on reducing emissions108 109. The policies presented in this chapter seek to reduce both types of emission either by means of technology advances or through increasing awareness and encouraging a cultural change. We present these policies under four sections:
• Vehicleefficiency;• Informedtravelchoices;• Energyuseandgeneration;• Airquality.
6.7. Note that a full Strategic Environmental Assessment (SEA) has been prepared in parallel to this strategy. The SEA examines our entire strategy from an environmental perspective, and includes further detail and additional analysis on some of the issues discussed here. There is full coordination between these two strategy documents: the topics presented here are fully reflected in the SEA, and vice versa.
6.8. Wherever possible, we have informed the development of policies with forecasting. Our Urban Dynamic Model and Strategic Transport Model, introduced earlier in this document, were both used also to examine the environmental aspects of policies and interventions. However, the ability to capture the full environmental impacts of policies in transport models is limited, and we will need to augment the model outputs with other sources of evidence. We do bring some model-based evidence in this chapter, but we also need to continue our investigation of the magnitude of reduction in emissions that can be achieved by applying the full range of policies presented here.
6. ReduCing emiSSionS
103 HM Treasury, (2006), Stern Review: The Economics of Climate Change104 House of Commons Environmental Audit Committee, (2010), Air Quality105 Sheffield City Region, (2010), Connectivity Study Baseline Report, page 37-39106 Evidence Base Document 7 - Reducing Emissions107 Ibid108 Passenger Transport Executive Group, (2009), Carbon Footprinting of Policies, Programmes and Projects109 http://www.lowemissionstrategies.org/ (last accessed: 07 Dec2010)
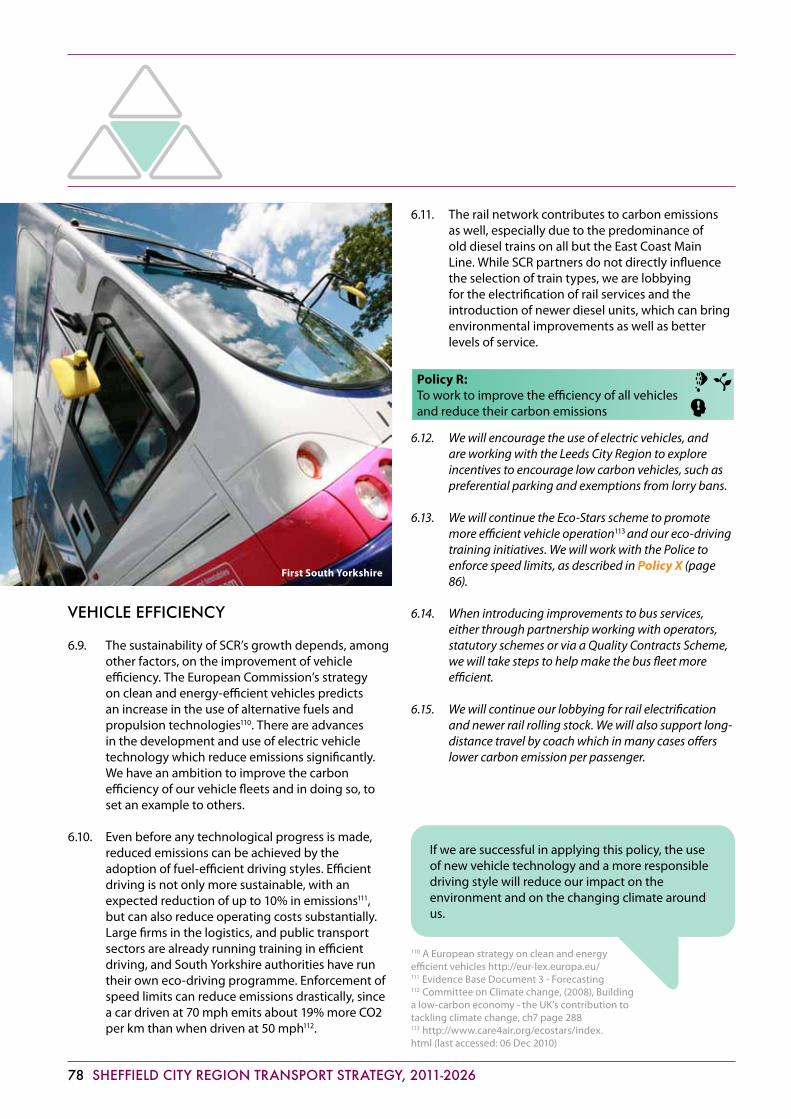
78 Sheffield City Region tRanSpoRt StRategy, 2011-2026
Vehicle efficiency
6.9. The sustainability of SCR’s growth depends, among other factors, on the improvement of vehicle efficiency. The European Commission’s strategy on clean and energy-efficient vehicles predicts an increase in the use of alternative fuels and propulsion technologies110. There are advances in the development and use of electric vehicle technology which reduce emissions significantly. We have an ambition to improve the carbon efficiency of our vehicle fleets and in doing so, to set an example to others.
6.10. Even before any technological progress is made, reduced emissions can be achieved by the adoption of fuel-efficient driving styles. Efficient driving is not only more sustainable, with an expected reduction of up to 10% in emissions111, but can also reduce operating costs substantially. Large firms in the logistics, and public transport sectors are already running training in efficient driving, and South Yorkshire authorities have run their own eco-driving programme. Enforcement of speed limits can reduce emissions drastically, since a car driven at 70 mph emits about 19% more CO2 per km than when driven at 50 mph112.
6.11. The rail network contributes to carbon emissions as well, especially due to the predominance of old diesel trains on all but the East Coast Main Line. While SCR partners do not directly influence the selection of train types, we are lobbying for the electrification of rail services and the introduction of newer diesel units, which can bring environmental improvements as well as better levels of service.
Policy R:To work to improve the efficiency of all vehicles and reduce their carbon emissions
6.12. We will encourage the use of electric vehicles, and are working with the Leeds City Region to explore incentives to encourage low carbon vehicles, such as preferential parking and exemptions from lorry bans.
6.13. We will continue the Eco-Stars scheme to promote more efficient vehicle operation113 and our eco-driving training initiatives. We will work with the Police to enforce speed limits, as described in Policy X (page 86).
6.14. When introducing improvements to bus services, either through partnership working with operators, statutory schemes or via a Quality Contracts Scheme, we will take steps to help make the bus fleet more efficient.
6.15. We will continue our lobbying for rail electrification and newer rail rolling stock. We will also support long-distance travel by coach which in many cases offers lower carbon emission per passenger.
If we are successful in applying this policy, the use of new vehicle technology and a more responsible driving style will reduce our impact on the environment and on the changing climate around us.
First South Yorkshire
110 A European strategy on clean and energy efficient vehicles http://eur-lex.europa.eu/111 Evidence Base Document 3 - Forecasting112 Committee on Climate change, (2008), Building a low-carbon economy - the UK’s contribution to tackling climate change, ch7 page 288113 http://www.care4air.org/ecostars/index.html (last accessed: 06 Dec 2010)

Sheffield City Region tRanSpoRt StRategy, 2011-2026 79
infOrmed traVel chOices
6.16. The way we travel and the choices we make are part of our culture. We recognise that we can reap many benefits by supporting a change towards a culture where people are aware of the impact of the way they travel on their surroundings and on themselves. In this section we group two policies that aim to encourage such cultural change.
Active travel
6.17. Walking and cycling are forms of active travel, which can be seen as an alternative to motorised travel. We presented in chapter 3 the proportion of SCR commuters travelling different distances, and showed that a very large proportion of these journeys are short enough to be suitable for walking or cycling.
6.18. There are many sources of evidence for the environmental benefit from a reduction in the number of car trips114. A comparison between different UK cities demonstrates that an increase in the proportion of cycle trips in SCR from 2% to 15% is feasible and would lead to a substantial reduction in emissions115.
6.19. In chapter 5 we have already mentioned the multiple benefits from active travel. There is an abundance of evidence on the positive impact of an active lifestyle of people’s health116. Active travel also helps to create vibrant, bustling town centres and public places, as discussed in Policy H (page 57), and would be linked to a boost in retail and leisure activities.
6.20. There are recent studies that illustrate the high economic returns and good value for money in investments in walk and cycle infrastructure117.
6.21. The hilly topography in parts of SCR is sometimes raised as a difficulty in promoting active travel. However, a high proportion of walk and cycle trips is observed in some hilly areas outside SCR, through the use of paths along rivers, canals and flat hilltops118.
6.22. For the use of bikes to become convenient and widespread, some investment is required in additional facilities such as cycle parking or storage in urban centres, shopping centres, interchanges and stations.
114 Passenger Transport Executive Group, (2010), Carbon Pathways for Transport in the City Regions115 Department for Transport, (2010), Sustainable Travel Towns Initiative - evaluation 116 Cabinet Office, (2009), Analysis of Urban Transport117 Sustrans, (2005), Economic Appraisal of local walking and cycling routes118 Sheffield City Council, (2006), Sheffield Cycling Action Plan
Cycle parking at Sheffield rail station
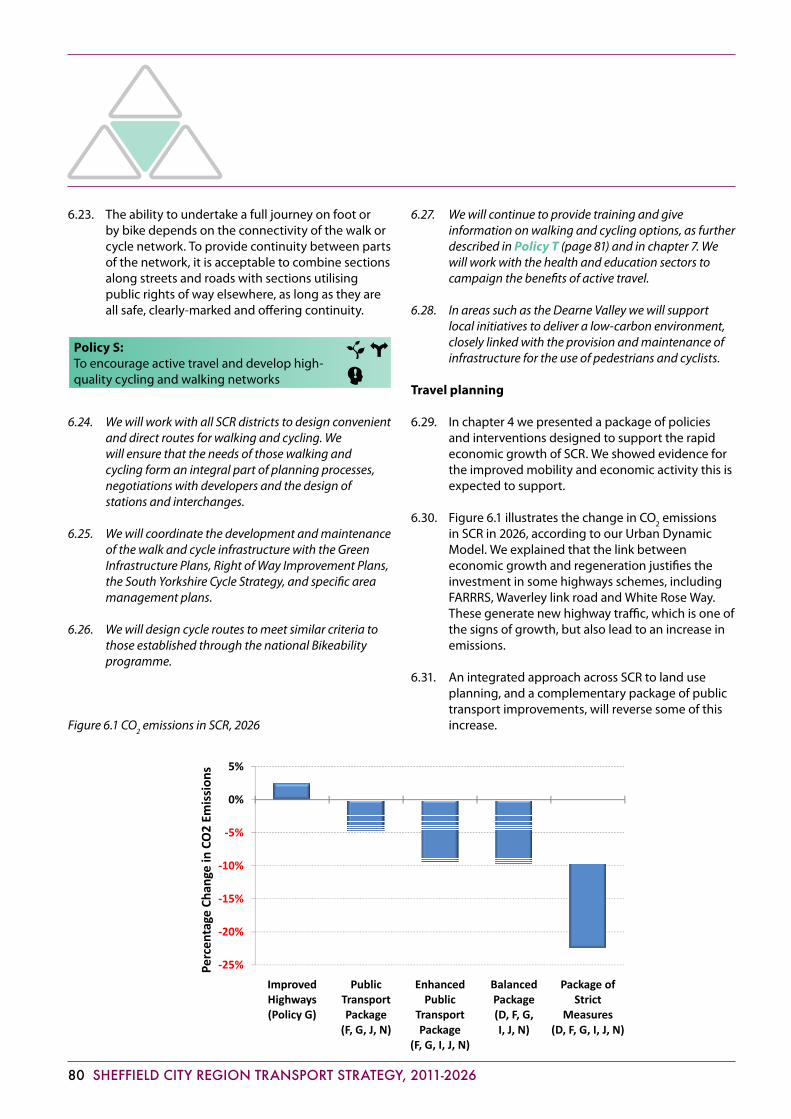
80 Sheffield City Region tRanSpoRt StRategy, 2011-2026
6.23. The ability to undertake a full journey on foot or by bike depends on the connectivity of the walk or cycle network. To provide continuity between parts of the network, it is acceptable to combine sections along streets and roads with sections utilising public rights of way elsewhere, as long as they are all safe, clearly-marked and offering continuity.
Policy S:To encourage active travel and develop high-quality cycling and walking networks
6.24. We will work with all SCR districts to design convenient and direct routes for walking and cycling. We will ensure that the needs of those walking and cycling form an integral part of planning processes, negotiations with developers and the design of stations and interchanges.
6.25. We will coordinate the development and maintenance of the walk and cycle infrastructure with the Green Infrastructure Plans, Right of Way Improvement Plans, the South Yorkshire Cycle Strategy, and specific area management plans.
6.26. We will design cycle routes to meet similar criteria to those established through the national Bikeability programme.
Figure 6.1 CO2 emissions in SCR, 2026
6.27. We will continue to provide training and give information on walking and cycling options, as further described in PolicyT(page 81) and in chapter 7. We will work with the health and education sectors to campaign the benefits of active travel.
6.28. In areas such as the Dearne Valley we will support local initiatives to deliver a low-carbon environment, closely linked with the provision and maintenance of infrastructure for the use of pedestrians and cyclists.
Travel planning
6.29. In chapter 4 we presented a package of policies and interventions designed to support the rapid economic growth of SCR. We showed evidence for the improved mobility and economic activity this is expected to support.
6.30. Figure 6.1 illustrates the change in CO2 emissions in SCR in 2026, according to our Urban Dynamic Model. We explained that the link between economic growth and regeneration justifies the investment in some highways schemes, including FARRRS, Waverley link road and White Rose Way. These generate new highway traffic, which is one of the signs of growth, but also lead to an increase in emissions.
6.31. An integrated approach across SCR to land use planning, and a complementary package of public transport improvements, will reverse some of this increase.
‐10%
‐5%
0%
5%
hang
e in CO2 Em
ission
s
‐25%
‐20%
‐15%
Improved Highways (Policy G)
Public Transport Package (F, G, J, N)
Enhanced Public
Transport Package
(F, G, I, J, N)
Balanced Package (D, F, G, I, J, N)
Package of Strict
Measures (D, F, G, I, J, N)
Percen
tage Ch

Sheffield City Region tRanSpoRt StRategy, 2011-2026 81
6.32. The scenario in the rightmost column, where the reduction in emissions is more significant, includes very strict measures of traffic calming and demand management. As we explained in chapter 4, we believe that the application of such measures will become relevant over time, but it is not considered feasible in the short term.
6.33. The conclusion from this analysis is that the policies and interventions described in chapter 4, while critical for our growth and prosperity, are not sufficient to make this growth sustainable. The additional measures we need to take in order to jointly meet all our goals are part of the attempt to encourage a wider cultural change, as discussed above. We wish to create a culture where people are more aware of the impacts of their travel choices.
6.34. To support this change, we want to provide individuals and business with sufficient information on available alternatives, so that they can make informed choices. Evidence has shown that the dissemination of information through “Smarter Choices” initiatives can provide very good value for money, support business growth and enhance access to opportunities119.
Policy TTo provide information and travel advice for the users of all modes of transport, so that they can make informed travel choices
6.35. We will work with businesses, schools, hospitals and key organisations to offer them and their staff assistance in planning their personal or business travel. We will provide detailed information on public transport options, walking routes and cycling facilities, tailored for their specific needs and preferences.
6.36. To plan the effective provision of personalised travel planning we will build on our sustainable travel city proposals120. Our personalised travel planning initiatives will highlight incentives for people to change the way they travel by trying out alternatives. The range of alternatives to be covered is wide; where appropriate it would include options such as homeworking (already discussed in Policy I, page 58), car sharing schemes, and so on.
6.37. We will continue working with West Yorkshire (and potentially other partners) to further promote and develop our Real Time and Get there Sooner initiatives. We will promote events such as ‘Car Free Friday’ in partnership with major employers and initiatives such as an ‘In Town without My Car’ day, which will link in with European Mobility week.
If we are successful in applying these policies, people will become more aware of a range of travel options which can improve their own wellbeing and also protect the environment. We will have attractive routes for walking and cycling which you will enjoy using as an alternative to short car trips.
Business and community travel adviser
119 Goodwin. P, (2010), Evidence submitted to the Select Committee Inquiry: Transport and the Economy120 Sheffield First Partnership, (2009), Sustainable Travel City Bid
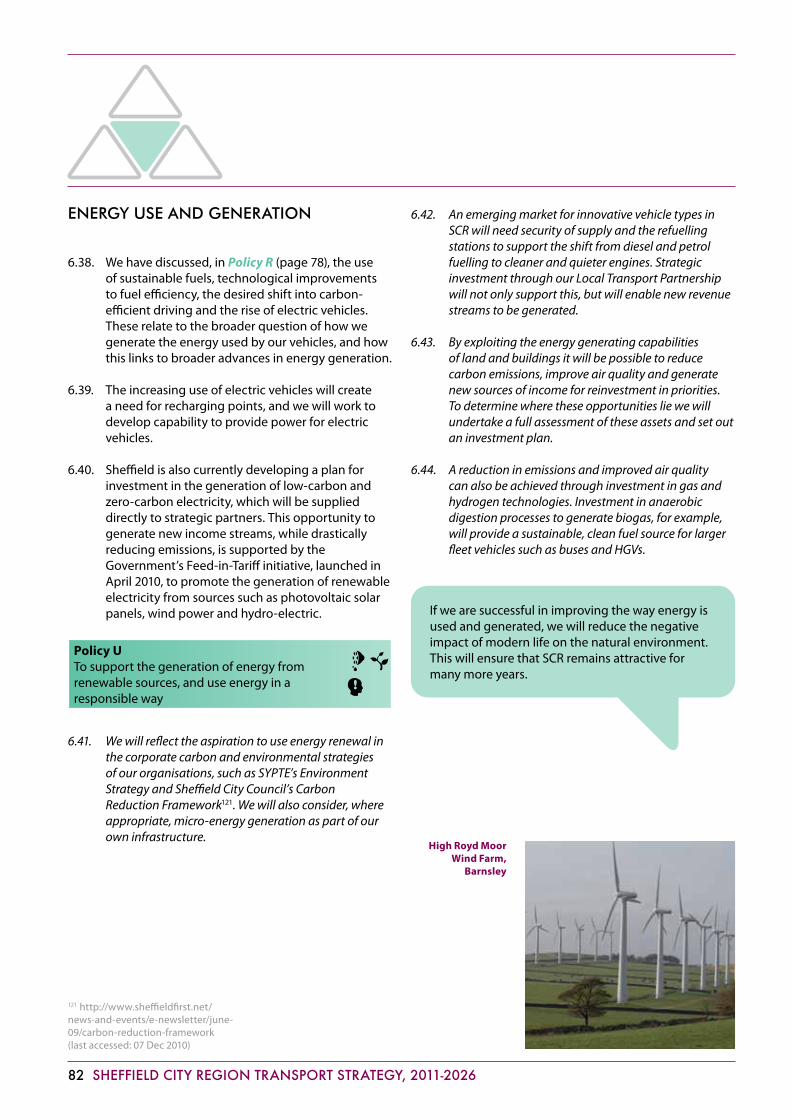
82 Sheffield City Region tRanSpoRt StRategy, 2011-2026
energy use and generatiOn
6.38. We have discussed, in PolicyR (page 78), the use of sustainable fuels, technological improvements to fuel efficiency, the desired shift into carbon-efficient driving and the rise of electric vehicles. These relate to the broader question of how we generate the energy used by our vehicles, and how this links to broader advances in energy generation.
6.39. The increasing use of electric vehicles will create a need for recharging points, and we will work to develop capability to provide power for electric vehicles.
6.40. Sheffield is also currently developing a plan for investment in the generation of low-carbon and zero-carbon electricity, which will be supplied directly to strategic partners. This opportunity to generate new income streams, while drastically reducing emissions, is supported by the Government’s Feed-in-Tariff initiative, launched in April 2010, to promote the generation of renewable electricity from sources such as photovoltaic solar panels, wind power and hydro-electric.
Policy UTo support the generation of energy from renewable sources, and use energy in a responsible way
6.41. We will reflect the aspiration to use energy renewal in the corporate carbon and environmental strategies of our organisations, such as SYPTE’s Environment Strategy and Sheffield City Council’s Carbon Reduction Framework121. We will also consider, where appropriate, micro-energy generation as part of our own infrastructure.
6.42. An emerging market for innovative vehicle types in SCR will need security of supply and the refuelling stations to support the shift from diesel and petrol fuelling to cleaner and quieter engines. Strategic investment through our Local Transport Partnership will not only support this, but will enable new revenue streams to be generated.
6.43. By exploiting the energy generating capabilities of land and buildings it will be possible to reduce carbon emissions, improve air quality and generate new sources of income for reinvestment in priorities. To determine where these opportunities lie we will undertake a full assessment of these assets and set out an investment plan.
6.44. A reduction in emissions and improved air quality can also be achieved through investment in gas and hydrogen technologies. Investment in anaerobic digestion processes to generate biogas, for example, will provide a sustainable, clean fuel source for larger fleet vehicles such as buses and HGVs.
If we are successful in improving the way energy is used and generated, we will reduce the negative impact of modern life on the natural environment. This will ensure that SCR remains attractive for many more years.
High Royd Moor Wind Farm,
Barnsley
121 http://www.sheffieldfirst.net/news-and-events/e-newsletter/june-09/carbon-reduction-framework (last accessed: 07 Dec 2010)
Sheffield City Region tRanSpoRt StRategy, 2011-2026 83
air quality
6.45. Air quality and noise have impacts on our health and wellbeing, and also have a substantial economic cost. A Cabinet Office report122 has recently estimated the national cost of poor air quality at £4.5 to £10.6 billon per annum. The DEFRA report on low emission strategies123
emphasises the serious health impacts and costs of poor air quality. It is suggested this may contribute to 50,000 premature deaths per year in the UK, more than passive smoking, traffic collisions or obesity.
6.46. A recent House of Commons report124 identifies the central role of local authorities improving air quality. The report recommends that Central Government must raise the profile of air quality and ensure that the issue is given sufficient attention across all areas of local authority responsibility, not just within their environmental departments.
6.47. Air Quality Management Areas (AQMAs) in SCR comprise the entire urban area of Sheffield, and main strategic network routes into the other South Yorkshire towns, especially along the Don Valley and the M1125. Along the M1 a particularly high level of NOx emissions is reported126. In the Sheffield urban area there are very high levels of PM10127. The statutory duty for Local Authorities, when dealing with AQMAs, is to manage local air quality and to ensure that it is brought down to a safe limit.
Policy V:To improve air quality, especially in designated AQMA areas
6.48. Much of the air quality impacts are caused by the national network routes in SCR. We will work with the Highways Agency to mitigate these as far as possible, in particular through the management of vehicle flow to reduce stop-start conditions which can exacerbate emissions. This links to Policy B (page 47).
6.49. On our strategic and local networks, we will manage traffic flow in a similar way, but also seek to accelerate the take-up of cleaner bus and lorry engines.
6.50. We will work with partners to maximise the use of tree planting and urban greening. In addition to the aesthetic benefits of tree planting, this can contribute to improving air quality, reducing noise, flood alleviation, carbon capture and reducing the visual impact of transport.
6.51. Local authorities have a duty to produce Noise Action Plans under the Environmental Noise Regulations, 2006. We note here the importance of monitoring noise pollution across SCR and taking actions to mitigate it, where any noise issue is identified. Such action is already being taken in a number of locations in SCR, such as Bawtry Road in Wickersley, Rotherham. In this strategy, Policy K (page 62), Policy N (page 71), Policy S (page 79), PolicyT (page 81) and Policy V (page 83) are likely to reduce noise pollution and therefore support Noise Action Plans.
If we are successful in improving air quality, you will enjoy the health and wellbeing benefits of a community with less pollution.
122 Cabinet Office, (2009), Analysis of Urban Transport, page 22123 Department for Environment, Food and Rural Affairs, (2010), Low Emissions Strategies124 House of Commons Environment Audit Committee, (2010), Air Quality125 Evidence Base Document 7 - Reducing Emission126 Ibid127 Ibid

84 Sheffield City Region tRanSpoRt StRategy, 2011-2026
cOnclusiOn
6.52. In this chapter we have identified a set of policies aimed at reducing emissions and thus mitigating climate change and improving air quality. Policy measures identified here make use of new, carbon-efficient technology; but we have also stressed the need for a cultural change, whereby people are better informed about the positive and negative impacts of different travel choices, encouraging them to make sustainable travel choices.
6.53. The need for such cultural change is supported by evidence from our forecasting work, showing that our economic growth may also limit the expected reduction in emissions. We have stressed the importance of combining key policies such as integrated land use planning and substantial public transport investment. We do, however, need to continue investigating the likely impacts of the policies presented here on emissions of carbon and other pollutants, because forecasting tools of environmental outcomes are limited.
6.54. We have stressed that multiple benefits from increasing the proportion of trips made by bike or on foot, including environmental, economic and health-related benefits. We have also discussed the possible benefits from an initiative to general low-carbon energy which would not only reduce emissions but constitute a new source of income, to be potentially used for other transport improvements.
Your Next Bus advert, Rotherham
Walkers in the Peak District

Sheffield City Region tRanSpoRt StRategy, 2011-2026 85
7. maximiSing Safety
intrOductiOn
7.1. In chapter 2 we presented some of our key achievements in improving the safety of those using SCR’s transport system. Casualty numbers have declined over the past decade, but our goal remains to continuously prevent traffic collisions and reduce safety risks, as we are committed to the personal security, health, wellbeing and quality of life of all users of our transport infrastructure.
7.2. In this chapter we present the policies aimed at improving safety and security, broken down into two sections:
• Saferroads;• Publictransportsafety.
7.3. Our strategy for reducing casualties on our roads is described in greater detail in a separate document128, which is fully coordinated with this strategy.
7.4. There are strong links between road safety and many of the policies presented earlier in this strategy. The occurrence of traffic collisions rises with the total travelled distance, and therefore the safety agenda is supported by any of our policies to encourage the use of public transport or to reduce the need to travel long distances.
safer rOads
7.5. Most transport-related safety incidents take place on the road. In this section we present policies which seek to continuously make our roads safer, combining several approaches including engineering, education and enforcement.
Road casualties
7.6. Maintaining a steady trend of decline in the number of road casualties will support SCR’s reputation as an attractive area and will reduce the associated burden on road traffic, health services, emergency services and on our wider economy. It will also reduce the emotional strain experienced by victims of traffic collisions, their families and friends.
7.7. We use a Worst First approach for setting our list of priorities for targeted engineering interventions and physical highway improvements. The locations with the highest casualty rates are given precedence, irrespective of which district they are in and whether the location is urban or rural.
7.8. Physical improvements of road infrastructure are complemented by training, education and marketing, to raise the awareness of a safe driving style and of common safety risks. These are targeted at the drivers of private vehicles and at others who may affect their driving behaviour, for example with relation to alcohol consumption before driving. Education and marketing campaigns are also targeted at professional drivers of lorries, buses, coaches and trams, since all these share road space with other users.
Policy W:To encourage safer road use and reduce casualties on our roads
128 South Yorkshire Casualty Reduction Partnership, (2010), South Yorkshire Safer Roads and Casualty Reduction Strategy www.southyorks.gov.uk/

86 Sheffield City Region tRanSpoRt StRategy, 2011-2026
7.9. Our efforts to reduce casualties are managed by our Safer Roads Partnership, which includes delegates from transport authorities, the Highways Agency, health trusts, universities and the Police. The partnership continues to promote targeted engineering schemes, develop our practice of collision analysis and monitoring, and raise the awareness of road safety issues by professional and non-professional drivers. The partnership produces an annual Collision and Casualty Statistics report and lobbies for funding for road safety schemes.
7.10. Safer roads and facilities require high quality of maintenance. We will continue working with partners to develop maintenance programmes that support road safety. We will integrate the principles of Safer Roads into individual districts Highways Asset Management Plans (HAMP), and will link maintenance standards with casualties in the South Yorkshire Transport Asset Management Plan (TAMP).
7.11. Our work to improve asset maintenance is further discussed in Policy M (page 65). Training and education to encourage safer road use are also linked to our discussion of travel planning in Policy T (page 81).
Enforcement
7.12. Speed enforcement is a core part of our safer roads strategy, and we are determined to keep driving speeds within legal and safe limits. Our achievements in reducing road casualties have already demonstrated the benefits of partnership working, and in this policy we particularly highlight the importance of continued work with the Police to ensure that traffic laws are effectively enforced.
Policy X:To work with the Police to enforce road traffic laws
7.13. We will continue to develop and operate the South Yorkshire Safety Camera Initiative, which enhances our ability to systematically identify drivers breaching speed limits. In the first instance, we will aim to educate drivers to improve standards rather than penalise them. We will also continue the referral of drivers to speed awareness courses and the national driver improvement scheme.
7.14. We will continue to develop 20mph zones, 20mph streets and Shared Spaces, linking these plans to related community initiatives. We will take targeted enforcement action in these areas.
7.15. Following the decriminalisation of certain traffic offences, the responsibility for some enforcement activity now rests with individual districts. We will therefore ensure that civil enforcement is targeted at the free and safe movement of traffic and also where parked vehicles cause a danger to other road users, for example outside schools.
Howard Street, Sheffield
Customer service, Barnsley Interchange

Sheffield City Region tRanSpoRt StRategy, 2011-2026 87
Vulnerable users
7.16. In chapter 3 we presented evidence showing that specific users of our transport system are more likely to be the victims of traffic collisions than others. We have analysed the vulnerability of different user types based on incident location, the mode of transport used and the age of the user.
7.17. Children in deprived communities remain at higher risk than others. While the overall child fatalities and injuries in SCR have recently fallen, a child living in a deprived area (i.e. an area in the lowest 10% based on the Index of Multiple Deprivation) is four times more likely to be involved in a traffic collision than a child living in an affluent area (based on the top 10% of this index).
7.18. Cyclists and motorcyclists are still involved in more accidents than their respective share of the general traffic. Pedal cycle casualties rose in 2009; casualties of both pedal cycle and powered two-wheeler users are above the 1994-98 baseline. In addition, as shown in chapter 3, the Sheffield Supertram has more collisions with other street users than other tram systems in the UK129.
7.19. The number of pedestrians killed or seriously injured has been falling recently, but above 55% of these are people over the age of 50130.
Policy Y:To focus safety efforts on vulnerable groups
7.20. Our actions include identification tasks and mitigation tasks. Both will be based on the Worst First principle.
7.21. The identification of the most vulnerable users will involve regularly examining which demographic and socio-economic groups have the worst safety statistics. We will undertake safety audits to investigate the problems faced by these groups, and will prioritise intervening where this can make the biggest impact.
7.22. Identification tasks also involve further improving our capability to evaluate, using advanced analytical tools, the effectiveness of different types of safety interventions.
7.23. The mitigation of the disparity in safety statistics between different user groups will focus on education, training programmes and provision of information. We will continue engaging with school travel plans, encouraging Walking Buses and promoting seat belt wearing. This is strongly related to the details provided in Policy S (page 79) and PolicyT (page 81).
public transpOrt safety
7.24. We presented earlier a considerable reduction in the occurrence of anti-social behavioural on public transport, at stops and at stations. Even when the actual risk to be a victim of such behaviour is low, negative perception can form a barrier to public transport usage.
7.25. Surveys among public transport users and non-users reveal that concerns about public transport safety relate mainly to unstaffed stations and to bus stops after dark.
Policy Z:To improve safety and the perception of safety on public transport
If we are successful in creating safer roads, you will be less likely to be involved in an accident. You and other people will be more aware of how to behave on the road in order to minimise any safety risk.
129 Office of Rail Regulation, (2009), National Rail Trends Yearbook130 South Yorkshire Casualty Reduction Partnership, (2009), South Yorkshire Collision & Casualty Statistics 2009
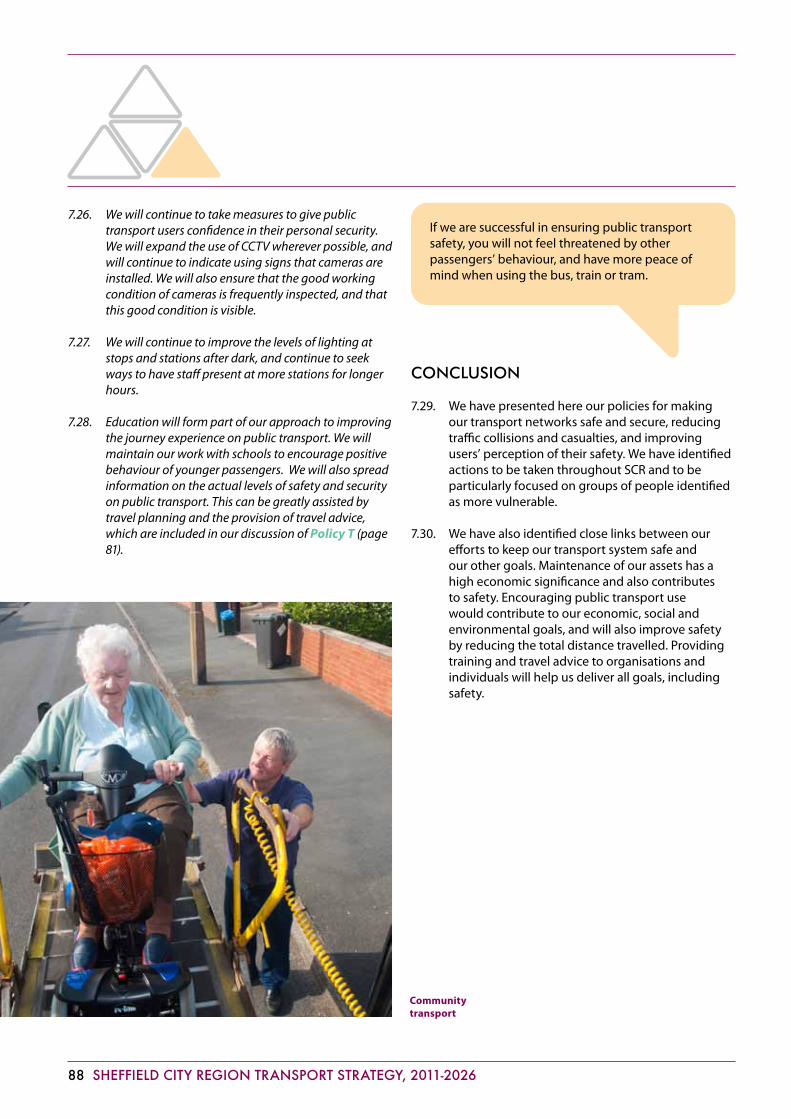
88 Sheffield City Region tRanSpoRt StRategy, 2011-2026
7.26. We will continue to take measures to give public transport users confidence in their personal security. We will expand the use of CCTV wherever possible, and will continue to indicate using signs that cameras are installed. We will also ensure that the good working condition of cameras is frequently inspected, and that this good condition is visible.
7.27. We will continue to improve the levels of lighting at stops and stations after dark, and continue to seek ways to have staff present at more stations for longer hours.
7.28. Education will form part of our approach to improving the journey experience on public transport. We will maintain our work with schools to encourage positive behaviour of younger passengers. We will also spread information on the actual levels of safety and security on public transport. This can be greatly assisted by travel planning and the provision of travel advice, which are included in our discussion of PolicyT (page 81).
cOnclusiOn
7.29. We have presented here our policies for making our transport networks safe and secure, reducing traffic collisions and casualties, and improving users’ perception of their safety. We have identified actions to be taken throughout SCR and to be particularly focused on groups of people identified as more vulnerable.
7.30. We have also identified close links between our efforts to keep our transport system safe and our other goals. Maintenance of our assets has a high economic significance and also contributes to safety. Encouraging public transport use would contribute to our economic, social and environmental goals, and will also improve safety by reducing the total distance travelled. Providing training and travel advice to organisations and individuals will help us deliver all goals, including safety.
If we are successful in ensuring public transport safety, you will not feel threatened by other passengers’ behaviour, and have more peace of mind when using the bus, train or tram.
Community transport

Sheffield City Region tRanSpoRt StRategy, 2011-2026 89
intrOductiOn
8.1. The implementation of this strategy will span a 15-year period. In this chapter we summarise the key outcomes that we expect to achieve over this period and explain how we will check whether the actual outcomes are satisfactory.
8.2. Seeing the entire strategy as a single framework is critical to its successful delivery. The different policies we have presented complement each other and do not work in isolation. We therefore refer to the outcomes of packages of policies rather than the impacts of specific interventions.
8.3. When examining the effect of our policies we note again that these policies were put in place in order to meet a clearly-defined set of goals. The goals go beyond the technicalities and operational aspects of transport, and we therefore look both at outcomes within the transport system and at wider economic, social and environmental impacts.
OutcOmes
8.4. Figure 8.1 summarises the desired outcomes of the strategy. We use the same triangle as the one presented in chapter 2, where our four goals where first introduced. Similar to our discussion of challenges, achievements and policies, we see here again that many possible outcomes of our policies will contribute jointly to more than one goal.
8. outComeS and monitoRing
Businessrelocation to
SCR
Successful localbusiness initiatives
Higher productivity ofexisting businesses and
workers
Higher skill levels
Higher employment rates
Shorter commuting distances
More reliable journey times
Higher share of public transport trips
Increase in SCR’s Gross Value Added
Reduction in illness and death caused by pollution
More people walking and cycling, with widerimpacts on personal wellbeing and
street vibrancy
Reduction in carbon emissions
Enhanced activity in SCR’stourist industry
Sale of regeneratedenergy becoming asource of funding
for transportimprovements
Lowerobesitylevels
Fewer isolatedcommunities
Higher skill levels incommunities where they are
currently low
More people able to access servicesand meet their social needs
Reduced expenditure on medical treatmentand sick leave
Larger proportion of people’s time spent onleisure activities
Fewerpeople killedor seriously
injured on SCR’sroads
More uniform levels of safetyacross different communities
A particular reduction in accidentrates for cyclists, motorcyclists and
pedestrians
Improved satisfaction of personal security onpublic transport, stops and stations
Figure 8.1 Desired outcomes of this strategy

90 Sheffield City Region tRanSpoRt StRategy, 2011-2026
mOnitOring
8.5. As we take actions to deliver the strategy, it is important that we measure our performance. We have defined a broad list of indicators that will be used to monitor our progress. These are presented in Figure 8.2. The table specifies which policies each indicator is relevant for, and also whether we would like to see the indicator increasing or reducing. In time, we will set specific targets for key indicators.
8.6. It can be observed that many of the indicators look at wider outcomes related to our four goals, while some specific indicators concentrate more strongly on value for money. The combination of measures of both types will ensure that the performance assessment helps us continuously refine the way we make investment decisions.
8.7. The ability to undertake successful monitoring depends on the availability of data, which is in itself a major challenge, as the cost of data collections is high. Monitoring should be ideally based on data that can be broken down into categories in different ways. For example, it should be possible to look separately at the outcomes in each district, on each route, and for different types of journeys or types of people. Effective monitoring is also done frequently so that we can analyse trends as they occur.
8.8. Due to the cost implications, we will be developing pragmatic monitoring practices. In some cases we will undertake our own data collection, while in other cases we will rely on data from external sources and on information published by national authorities. Data sources which we are likely to use are cordon surveys, traffic counts, satisfaction surveys, journey time data from traffic control systems, public transport timetables and information provided by public transport operators.
8.9. For some of the desired outcomes of the strategy, it is likely that we will not be able to undertake accurate, quantitative monitoring. In those cases we will use qualitative measures of the progress made, while continuing to develop more precise monitoring techniques for the longer term.
8.10. The practice of monitoring the delivery of our strategy is discussed in further detail in the implementation plan. The implementation plan also defines more specific targets for some indicators.

Sheffield City Region tRanSpoRt StRategy, 2011-2026 91
Figure 8.2 Performance indicators
Indicator Type Relevant policies
Aspiration
GVA Quantitative Entire strategy
Employment Quantitative Entire strategy
Skills Quantitative Entire strategy
Deprivation Quantitative Entire strategy
Public transport subsidy per kilometre or passenger
Quantitative Entire strategy
Proportion of schemes delivering expected benefits or better
Quantitative Entire strategy
Cost of network maintenance
Quantitative M
Public transport patronage and modal share
Quantitative D E F K I J N OP Z
Public transport satisfaction
Quantitative D E F K I J N OP Z
Public transport punctuality, reliability and journey times
Quantitative D E F K I J N OP Z
Walk / cycle modal shares
Quantitative H ST
Footfall counts in public places and town centres
Quantitative H
Amount of goods carried
Quantitative ABCL
Health: life expectancy Quantitative MQ RSTUV WXYZ
Health: obesity amongst young people
Quantitative MQSTWXY Z
Passenger flows to airports
Quantitative A
Need of maintenance Quantitative M
Accessibility to a range of places using public transport
Quantitative KNOQ
CO2 emissions Quantitative C K N RSTUV
Other emissions Quantitative C K N RSTUV
Safety: KSI Quantitative MT WXY
Safety: KSI amongst young people
Quantitative MT WXY
Safety: KSI of cyclists, motorcyclists and pedestrians
Quantitative ST Y
Safety: KSI in deprived neighbourhoods
Quantitative T Y
Safety: the number of slight injuries
Quantitative WXY
Satisfaction with public transport affordability
Quantitative N P
Network performance at times of extreme weather
Qualitative B L
Progress in delivering HSR
Qualitative E
Progress in delivering connectivity to redevelopment areas
Qualitative G
Progress in improving townscape and landscape
Qualitative H
Progress in contingency planning
Qualitative L
Strategy fit of development locations
Qualitative I
Strategy fit of parking policies
Qualitative J
Progress with delivering infrastructure for walking/cycling
Qualitative S
Progress with delivering travel planning and advice
Qualitative T
Progress in improving vehicle efficiency
Qualitative R
Progress in enabling energy renewal
Qualitative U
Progress in safety campaigns and training
Qualitative W
Progress in enforcement Qualitative X

92 Sheffield City Region tRanSpoRt StRategy, 2011-2026

Sheffield City Region tRanSpoRt StRategy, 2011-2026 93

94 Sheffield City Region tRanSpoRt StRategy, 2011-2026
Accessibility - The ability to arrive to or from a place conveniently.
Active Travel - Travel by either walking or cycling, avoiding the use of motorised vehicles.
Air Quality Management Areas - Places where it was identified that air pollution is very high.
AQMA - See: Air Quality Management Areas.
Assets - Transport infrastructure.
Bikeability - A measure of whether a cycling route is suitable for a safe use.
Bike Boost - A cycle promotion campaign to encourage people to cycle to work.
Bike-it - A cycle promotion campaign designed to encourage children to cycle to school.
BMBC - Barnsley Metropolitan Borough Council.
BRT - See: Bus Rapid Transit
Bus Rapid Transit - Using buses to provide a faster, more efficient service than an ordinary bus line. Often this is achieved by making improvements to existing infrastructure, vehicles and scheduling.
Carbon Quids - An initiative designed to encourage people to reduce their carbon emissions.
Care4air - An organisation that aims to raise awareness of the importance of air quality.
Challenge - Something we want to achieve, but requires a serious effort.
Climate Change - A change in temperature and weather conditions which may be the result of pollution.
Commuting - Travelling to or from work.
Congestion - The condition on a road when there are many cars, low speeds and queuing.
Connectivity - The quality of any means of transport between places.
County - A region marked off for administrative purposes, usually containing several districts, such as South Yorkshire.
DaSTS - See: Delivering a Sustainable Transport System .
Delivering a Sustainable Transport System - A programme of studies introduced by the previous Government to identify transport needs.
Development - The construction of new buildings or infrastructure.
Distance Travelled - A measure which we calculate by adding together the lengths of all journeys made by anyone who travels in the area. This gives us an indication of the overall amount of travelling people make.
District - A region marked off for administrative purposes, usually containing a single city or major town, such as Barnsley, Doncaster, Rotherham or Chesterfield.
DMBC - Doncaster Metropolitan Borough Council.
Eco-driving - A way of driving that is aimed at reducing fuel consumption, greenhouse gas emissions and accidents.
Eco Stars - A scheme designed to encourage operators of lorries, buses and coaches to reduce the emissions of their vehicles.
Eco-vision - A strategy for a specific area, combining its plans for regeneration and sustainability, such as the Dearne Valley eco-vision.
Economic Growth - An increase in the quantity of goods and services produced, which indicates that are becoming wealthier.
Employment Growth - An increase in the number of jobs and employed people within an area.
Equality of Opportunities - When our society is fair in the way it treats people, no matter where they live, how much they earn and so on. This is also related to social inclusion.
FARRRS - Finningley and Rossington Regeneration Route Scheme.
gloSSaRy

Sheffield City Region tRanSpoRt StRategy, 2011-2026 95
Forecasting - The work we do in an attempt to understand how people will travel in the future, after we make various changes to the transport system. Forecasting involves the use of different statistical and economic techniques.
Green Spaces - Places such as parks, open spaces, playing fields, woodlands, allotments and private gardens.
Greenhouse Gas Emissions - Gases like carbon dioxide, methane and nitrous oxide, which are extracted from cars, factories and industrial processes. They cause air pollution and contribute to global warming.
Global Warming - An increase in temperature caused by air pollution.
Gross Value Added - An economic indicator which measures the value of goods and services produced. An increase in Gross Value Added is a sign of economic growth.
GVA - See: Gross Value Added
Highways Agency - An agency that is responsible for maintaining and improving the motorways and trunk roads in England.
Implementation Plan - A document that explains how it is intended to turn the strategy into reality.
Infrastructure - The physical parts of the transport system, like roads, stations, stops or tracks.
Inter-urban - Connecting between urban areas, towns and cities.
Intervention - Something that is done to change a situation. Some interventions include work on infrastructure, for example by building new rail or improving a road. Other interventions change the provision of services, for example by starting a new bus route or changing prices.
Killed or Seriously Injured - A category used to group the most severe accidents for statistical purposes.
KSI - See: Killed or Seriously Injured
Land Use - A term that describes the type of buildings or activities that the authorities expect to see in a specific place. Typical types of land use are residential, commercial or industrial.
Land Use Planning - The work done by authorities to decide how they would like the land in different places to be used. The authorities often only allow specific types of land use in specific locations.
Land Use and Transport Integration - A study we undertook to identify sustainable locations for building new houses, offices and shops.
Loading Gauge - The standard height and width of freight trains, determined to ensure that they can pass through bridges a tunnels and be safe.
Local Network - The part of the network that includes the local bus routes, residential streets and local through routes.
LTP2 - See: Local Transport Plan 2.
LTP3 - See: Local Transport Plan 3.
Local Transport Plan 2 - The statutory document that contains the Transport Strategy for 2006-2011 which is replaced by this strategy and its implementation plan.
Local Transport Plan 3 - A statutory document that contains the Transport Strategy for the years 2011- 2026 and an implementation plan for a shorter period.
Localism - Describes a political idea which focuses on local, rather than central, decision making.
Lost Productive Time - Time that could be used to work or do something enjoyable, but is taken up by something else, for example being delayed in traffic.
LUTI - See: Land Use and Transport Integration.
Metropolitan County - A county where most people live in cities or towns, for example the metropolitan county of South Yorkshire.
Modal Share - The proportion of people who travel using a specific mode (like car, bus or train) or group of modes (like public transport).
National Network - The part of the network that includes the entire rail network in the City Region, the Motorways and Trunk Road Network (M1, M18, M180, A616, A628, A1(M)). Authorities in the City Region do not have direct control over these networks.

96 Sheffield City Region tRanSpoRt StRategy, 2011-2026
Network - The entire infrastructure and the transport services using it.
Operator - A company that provides bus, train or tram services.
Overcrowding - The condition on-board a bus, tram or train when there is a very large number of passengers, with a high density of people standing.
Passenger Transport Executive - Public organisation that provide, plan, procure and promote public transport large in conurbations. See for example under South Yorkshire Passenger Transport Executive.
Patronage - The number of people using public transport.
Policy - A specific set of actions which we state we want to make in order to overcome a challenge. Different policies can be parts of an overall strategy.
PTE - See: Passenger Transport Executive.
Public Consultation - The process of presenting our work to the public and asking them to tell us their opinions of it.
Quality Contracts - A contractual agreement between the a transport authority and the operators under which the operator is to provide specified services. Quality Contracts give the authority more powers to design public transport services in their area as they see fit, compared to a Statutory Quality Partnership. Currently such contracts are not used anywhere in England outside London.
Radial Route - Any parts of the network that starts in an urban centre and provides access to areas outside of the centre
Regeneration - Development work which is done in order to improve areas in poor condition.
Reliability - When travel times are more or less the same every time you make the same journey. A good level of reliability improves people’s confidence that they can arrive on time.
Resilience - The ability of a road or a railway to continue functioning properly, not being sensitive to weather or other conditions.
RHADS - Robin Hood Airport Doncaster-Sheffield.
RMBC - Rotherham Metropolitan Borough Council.
SCC - Sheffield City Council.
SEA - See: Strategic Environmental Assessment.
Sheffield City Region - The area where a large number of people travel often to Sheffield or to its neighbouring towns. This area includes the whole metropolitan county of South Yorkshire, as well as parts of Nottinghamshire and Derbyshire.
Social Exclusion - When specific groups of people cannot take part in activities that other people can, for example because the place they live in has poor transport services.
Social Inclusion - When everyone has opportunities to work, shop, enjoy cultural activities and so on, no matter where they live.
South Yorkshire - A metropolitan county consisting of four metropolitan boroughs: Barnsley, Doncaster, Rotherham, and the city of Sheffield.
South Yorkshire Integrated Transport Authority - Consists of 12 members drawn from the elected members of local authorities in Barnsley, Doncaster, Rotherham and Sheffield. The Authority has various legal responsibilities. Its most important one is to co-ordinate and promote the use of public transport in South Yorkshire.
South Yorkshire Passenger Transport Executive - An organisation whose role is to encourage the maximum use of public transport throughout South Yorkshire and to promote growth of the public transport network. It is accountable to the elected South Yorkshire Integrated Transport Authority.
Stakeholders - Anyone who has an interest in our work, such as councils, passenger groups or bus operators.
Stakeholder Consultation - The process of presenting our work to stakeholders in order to take their opinions into account.
Statutory - Required by law.
Statutory Quality Partnership - A legal agreement between a transport authority and transport operators to deliver an agreed level of service.
Sheffield City Region tRanSpoRt StRategy, 2011-2026 97
Strategic Environmental Assessment - The work done to incorporate environmental considerations into policies, plans and programmes. It is also the title of the document that is being produced in parallel to this strategy as summarises this work.
Strategic Network - The part of the network that includes the routes providing critical linkages between urban centres in the Sheffield City Region and national networks.
Strategic Transport Model - A forecasting method that has been used to examine the impact of the policies in this Transport Strategy.
Strategy - A plan of action designed to achieve particular goals.
Sustainability - When our towns, communities and transport system can work in a stable way for many years, without causing pollution or other damage.
Sustainable Locations - Places that people can travel to without compromising sustainability, using modes of transport that cause less congestion and pollution.
SYITA - See: South Yorkshire Integrated Transport Authority.
SYPTE - See: South Yorkshire Passenger Transport Executive.
The Transport System - Anything that we use to travel, including the roads and transport infrastructure, vehicles (buses, trains, trams), public transport services, and the way they are operated and maintained.
Tonnes Lifted - The total weight of goods moved by freight.
Traffic Management - A process of actively improving the flow of vehicles in the transport system using a range of measures.
Tram-Train - A type of public transport service, using vehicles that can move on both tram tracks and railways.
Urban Dynamic Model - A forecasting method which we use to analyse how transport and land use influence each other. It is also used to analyse when people and businesses decide to move from one place to another.
Vehicle Kms - A measure of the distance travelled by vehicles in kilometres.
Walking Bus - A form of transport for schoolchildren who are chaperoned by adults to walk to school in a group.

98 Sheffield City Region tRanSpoRt StRategy, 2011-2026

Sheffield City Region tRanSpoRt StRategy, 2011-2026 99

100 Sheffield City Region tRanSpoRt StRategy, 2011-2026