shear wave splitting in refracted waves returned from the...
TRANSCRIPT

JOURNAL OF GEOPHYSICAL RESEARCH, VOL. 99, NO. B8, PAGES 15,783-15,797, AUGUST 10, 1994
Shear wave splitting in refracted waves ceturned froin the upper mantle transition zone beneath northern Australia
C. Tong, O. Gudmundsson, and B. L. N. Kennett Research School of Earth Sciences, AustrMian National University, Canberra
Abstract. The broadband recording site at Warramunga (WRA) in the Northern Territory of Australia provides good coverage of seismic wave propagation through the upper mantle for sources in the earthquake belt through Indonesia and New Guinea. $ waves recorded on the radial ($V) and tangential (SH) components are of comparable quality because the hard-rock recording site minimizes the influence of coupling to P on the radial component. Refracted $ waves from the upper- mantle transition zone show a clear advance of $H wave arrivals compared with $V. Eleven polarization analyses of waves returned from the transition zone yield an average time shift of 2.3 s with the fast direction scattered about the transverse direction. Nine polarization measurements of waves returned from the top of the lower mantle yield an average time shift of 1.7 s, again with the fast direction near the transverse. No appreciable time differences are observed between the radial and transverse polarizations for paths refracted within the lithospheric lid. Because the observations of shear wave splitting in waves passing through the low-velocity zone, '•he transition zone, and the top of the lower mantle are not coherent in their absolute polarization, the cause cannot lie in azimuthal anisotropy at shallow depths under the WRA station. The most plausible exph•nation is transverse isotropy in shear within the low-velocity zone under the unusually thick mantle "lid" under Australia. A possible contribution may come from anisotrol•y in •-olivine at the top of the upper mantle transition zone. Transverse isotropy in the 200-kin-thick layer below the lithosphere down to the transition zone with a 1% faster shear wave speeds for horizontal polarization compared with vertical polarization will explain the splitting data. For this asthenospheric region the level of anisotropy is quite reasonable and the polarization is consistent with lateral flow. The geometry of the available paths for waves propagating within the mmltle lid i• not sufficient to place constraints on the anisotropic properties of this heterogeneous a,nd low-loss region.
Introduction
Most seismic body wave studies of upper mantle structure have been based on the analysis of t' wave arrivals on vertical component instruments or on the use of $H waves recorded on a component trmisverse to the path froxn the source. Such natural polarization is not easy to find and has limited the extent of $ body wave studies of the upper mantle. Very little work has been done with $V wave records from the radial com-
ponent because the waveforms are usually complicated due to coupling between the $V arrivals and P waves in the shallow structure near the receiver.
The Proterozoic rocks of the Tennant Creek inlier in
the Northern Territory of Australia lie at an appropri- ate distance range to investigate upper mantle struc-
Copyright 1994 by the American Geophysical Union.
Paper number 94JB00460. 0148-0227/94/94JB00460 $05.00
ture using sources in the major earthquake belt run- ning through Indonesia and New Guinea (Figure 1). The granites of the Warramungu group provide excel- lent recording sites with high-velocity material at or very near the surface. Drilling at the site indicates that the weathered layer is less than 30 m thick or much thinner than one wavelength of the waves we record on the WRA broadband instrument. The presence of high P wave velocities at the surface (around 6 km/s) minimizes the contamination of the $V wave field. In
consequence, it is possible to exploit $V recordi•gs on both the radial and vertical components of broadband instruments.
A three-component set of broadband seisn•oxneters (Guralp CMG-3) has been operated since 1988 at the Warramunga array (WRA) in the Northern Territory of Australia, 35 km to the southeast of the small mining town of Tennant Creek. The site is installed o•t granite and has yielded very good data for both P and $ waves propagating through the upper mantle transition zone. Kennett et al. [1994] have presented record sections for
15,783

15,784 TONG ET AL.: SHEAR WAVE SPLITTING IN 'rHE UPPER MANTLE
A
-lO
-2o
1 O0 110 120 130 140 150 160 170
longitude (degrees E)
Figure 1. The locations of the events used in the analysis of shear wave splitting, and the Warramunga array (WRA) broadband instrument in the Northern Territory of Australia. A distinction is made between events in the Indonesian region (open circles) and New Guinea and Solomon Islands region (solid circles).
P, $V and $H propagation and have illustrated the value of the broadband recording by deriving both S and P velocity models from the same set of events. The $V and SH wave record sections are very consistent in their general features, but when they are exami]•ed in detail, a perceptible time advance may be observed for many of the $H wave arrivals relative to their SV wave counterparts.
The object of this paper is to quantify the extent of shear wave splitting for these $ waves refracte(l back from the upper mantle and to attempt to determine the location and orientation of the anisotropy which induces the splitting. The geometry of S wave propagation in the present study is very different from that employed in measurements of shear wave splitting for phases such as $KS [Silver and Chan, 1991; Vinnik eta!. 1992] or ScS [Fukao, 1984]. In such work the S waves are traveling close to vertical, and the resulting splitting represents the cumulative effect of the structure between the core
mantle boundary and the surface. For the reft'acted waves through the upper mantle transition zone, con- sidered here, the propagation paths are near horizontal. Only in the passage through the uppermost mantle (the mantle "lid") are the propagation paths close to vertical and more comparable to the usual SKS configuration. The geometry of the propagation paths (see Figure 2) enables us to put direct constraints on the likely loca- tion of anisotropy.
Anisotropy in the Earth's Mantle
Evidence for anisotropy of varied geometry in Earth's mantle continues to grow. In general, such anisotropy
would need to be described by 21 elastic moduli, 1)ut the available configurations for seismic observations have tended to limit the class of models which have been
considered in the upper mantle. In particular, because S body wave studies have focused on waves traveling close to vertical, attention has been concentrated on the variation of the S wave speeds for different polarizations in the horizontal plane.
Transverse isotropy is a situation where there is cylin- drical symmetry in the wave velocity about an axis but where the wave velocity along this symmetry axis dif- fers from the wave velocity in the perpendicular plane. In seismological usage this term has often been applied to a w•rtical symmetry axis, and then there will be a difference between the elastic wave speeds of vertically and horizontally polarized waves. The term azin•uthal anisotropy is also often used in a restricted sense to re- fer to observations of a directional dependence of the seismic wave speeds on the angle of propagation in a horizo]•tal plane.
Anisotropy can occur in a much more complicated fashion than these simple configurations and giw•s rise to a complex dependence on orientation. However, since these simplified models form the basis of most previous interpretation, we will use them to guide our discussion.
Two manifestations of anisotropy in seismic data have been recognized for some time. First, Pn ve- locities from refraction profiles in the oceea•s revealed in the 1960s a directional dependence consistent with 5% azimuthal anisotropy in compressional velocity in the subcrustal oceanic lithosphere [Hess, 1964: Raitt et al., 1969; Shearer and Orcutt, 1986]. Sindlar ob- servations have subsequently been made in continental

TONG ET AL.: SHEAR WAVE SPLITTING IN THE UPPER MANTLE 15,785
Shear velocity (krn/s) Distance (degree)
3 4 5 6 7 0 2 4 6 8 10 12 14 16 18 20 22 24
210 210 .......................................
410 410
o
660 660
Q = 1300 lower mantle
Figure 2. The shear velocity structure under northern Australia and a schematic drawing of ray paths in this study and their relation to the main structural units of the upper mantle.
settings [Fuchs, 1983; Hearn, 1984]. Second, the dis- crepancy between the dispersion characteristics of Love and Rayleigh waves along comparable paths was rec- ognize(t in the early 1960s [Anderson, 1961] and was modeled in terms of a transversely isotropic shear ve- locity structure with the vertical polarization a few per- cent slower than the horizontal polarizations in a signif- icant volume near the top of the mantle [e.g., Yu and Mitchell, 1979; Journet and Joberr, [1982]. Dziewonski and Anderson [1981] estimate the difference between the wave speeds for vertically and horizontally polar- ized shear waves, needed to reconcile Love wave and Rayleigh wave (lispersion, as 2-3% in the top 200 km of the mantle in their global preliminary reference Earth model (PREM). Regan and Anderson [1984] found re- gionalized models for age provinces in the oceans with varied degrees of anisotropy which could be confined to the asthcnosphcrc in the oceans. L•v•que and Cara [1985] used dispersion data for both fundamental and higher modes from events along the Tonga-Kcrmadcc trench recorded in North America to obtain transversely isotropic models for the Pacific Ocean on one hand and North America on the other. Their models require hori- zontally polarized shear waves to remain faster than ver- tically polarized shear waves by about 1% to depths ex- ceeding 400 km under North America. In their oceanic model, anisotropy persists through the lithosphere and the asthcnosphcre and into the transition zone at a higher level than beneath the North American conti- nent. Nishimura and Forsyth [1989] reach a similar conclusion from a more extensive path coverage of the Pacific Ocean. However, it should be noted that the depth resolution attainable in such surface wave stud- its is limited, particularly at greater depths.
Measurements of shear wave birefringence or splitting of near vertically traveling body waves (S, ScS, SKS) have revealed azimuthal anisotropy in the back arc
wedge of subduction zones [Ando et al., 1983; Fukao, 1984; Bowman and Ando 1987] and under the con- tincnts [Vinnik et al., 1984; Silver and Chan, 1991; Vinnik et al., 1992]. The time separation of the two split waves at continental sites is generally a.round 1 s which would imply anisotropy of the order of 3% if it were to be evenly distributed throughout a 150-kin- thick lithosphere. The total set of stations for which $K$-splitting measurements have been made gives cov- erage of most continents with concentrations of observa- tions in Europe and North America. The $KS-splitting results reveal some interesting geometrical pa•tcn•s and a general correlation with surface tectonics [Vinnik et al., 1992]. But it should be recalled that the splitting observations themselves include no direct inforn•ation
on the localization of anisotropy in depth. The last decade has also seen surface wave ton•ogra-
phy attempt to map the lateral variation of anisotropy [see e.g., Montagner and Tanimoto, 1991]. Natal et al., [1986] found a correlation of regions with a fast verti- cal polarization with the locations of mid-ocean ridges. Tanimoto and Anderson [1984] found a high degree of correlation between their map of the orientation of az- imuthal anisotropy with the lateral flow pattern pre- dicted at the relevant depth by Hager and O'Connell [1979]. Both of these results have been interpreted in terms of crystal alignment in the mantle, particularly of fcrromagncsium silicates such as olivine, induced by flow at high temperature.
It is now clear that at least parts of the upper man- tle are significantly anisotropic and that this anisotropy can have a significant effect on wave propagatimt in di- verse ways. For simple models of anisotropy the ef- fects on travel times (Pn), phase velocities (surface waves), and shear wave splitting are well understood. Recent developments in wave theory in anisotropic me- dia demonstrate that gradients in anisotropic proper-

15,786 TONG ET AL.: SHEAR WAVE SPLITTING IN THE UPPER MANTLE
ties can cause significant distortion of seismic waveforms through coupling of the split shear waves [Thomson et al., 1992]. Further, ray bending through anisotropic regions can result in complex multipathing. Elaborate analysis involving forward waveform modeling will be necessary to handle the full range of complexity induced by anisotropy.
Most experiments sensitive to anisotropy have lim- ited directional resolution. Observations of shear wave
splitting for $K$ waves represent the integrate([ effect of the differences in the S wave speeds through the re- gion of anisotropy, for the two orthogonal polarizations in a near-horizontal plane, and provide no depth res- olution. Love and Rayleigh waves taken together do potentially provide three-dimensional directional reso- lution, but strong trade-offs exist with lateral hetero- geneity [Anderson and Dziewonski, 1982].
Measurements of shear wave splitting in more com- plicated geometries than the SKS geometry sho•fid be explored, since they can provide some of the three- dimensional directional coverage needed to resolve the full anisotropy of the mantle, although such measure- ments are admittedly difficult. This is what we attem- pt to do in the present study. We are motivated by observations of seismograms for shear waves refracted through the upper mantle which display a •imc separa- tion between the onsets of SV and $H waves.
We have to acknowledge the difficulty posed for mea- surements of shear wave splitting arising from possible contamination by phase conversions, which can give rise to precursors to the true shear wave. Such conversions are much more likely to occur on the radial component given l.hat to zeroth order Earth is a spherically sym- metric body. Thus, when shear waves on the radial component appear to be advanced in relation to shear waves on the transverse component, scattering must be considered as a potential cause. In this study virtually all the observations are of earlier shear waves on the
transw•.rse component or a fast polarization near the transw.•rse direction.
Data Selection and Analysis Procedure
The events used for shear wave splitting analysis were extract;ed from the broadband records at the WRA site
as part of a study designed to determine the P and $ ve- locity structures with depth beneath the northern Aus- tralian region [Kennett et al., 1994]. The events span the distance range from 12 ø to 30 ø from the Indonesian and New Guinea earthquake belt. Shallow events with body wave magnitudes between 4.9 and 5.5 have been selected for which there is good signal strength for S compared to the P wave coda. With this type of event we try to secure as simple a waveform as possible and also minimize the influence of subduction zone struc- tures near the source.
For epicentral distances out to 2100 km, the onsets of the $V and SH waveforms show high frequencies (greater than I Hz) associated with arrivals propagat- ing within a thick lid extending to 210 km depth. At
larger distances the onset of S, representing waves re- fracted back from beneath the 410- or 660-km discon-
tinuities, has a much lower-frequency content (0.25-0.3 Hz). Such intermediate-period arrivals also characterize the S waves returned from the 410- and 660-kin discon-
tinuities at shorter distances. The frequency differences have been interpreted by Gudmundsson et al. [1994] in terms of a zone of enhanced attenuation below 210 km and above the 410-km transition.
In all we have looked at about 120 seismograms which satisfy the above selection criteria, recorded at WRA between December 1989 through May 1992. In many cases, no shear waves are discernible from the P wave coda. In other cases the signal-to-noise ratio is not suf- ficient to obtain a reliable measurement of shear wave
splitting. In the end we have 29 useful events from which we obtain 34 measurements of splitting associ- ated with different phase branches. The geographical configuration of the WRA recording station and the epicenters of the earthquakes which provide useful shear wave splitting measurements are displayed in Figure 1; the hypocenters of the events are also presented in Ta- ble 1. The turning points in the mantle correspond- ing to these propagation paths lie mostly beneath the northern margin of the Australian continent. Studies of both short period arrivals [Dey et al., 1993] and broad- band records [Kennett et al., 1994] have indicated the presence of regional variations in mantle structure un- der Northern Australia, and so we have divided the source region into two parts: (1) along the Flores Arc, Indonesia, with propagation under northwestern Aus- tralia, and (2) in New Guinea, with paths to the NNE of the array. The events in each class are identified by open or solid symbols in Figure 1.
In the course of the work on the P and $ wave ve-
locity structure in the upper mantle beneath northern Australia record sections for both the radial ($V) and transw.•rse ($H) components of $ were constructed [see Kennett et al., 1994] and it became clear that there was a systematic advance of SH wave onsets compared with the SV onsets, for arrivals from the transition zone at distam:es beyond 2100 km. In Figure 2, we illustrate the nature of the $ velocity profile which has been pro- posed for the northern Australian region [Kennett et al., 1994]; a fast and rather thick mantle lid extends to 210 kin.
The impression of SH advance gained from the record sections was confirmed by careful hand picking carried out independently by at least two people for each eve- nt. However, for the high-frequency onsets which have propagated through the mantle lid there was no dis- cernible pattern of earlier $H waves, but tile correla- tion of arrivals on the different components was much poorer than for the arrivals from greater depth.
In order to improve the quantitative measures of she- ar wave splitting, we have undertaken a correlation analysis for arrivals associated with each of the major classes of propagation path through tile mantle. For each event, a set of time windows is selected to span the expected time for the arrivals for different classes of propagation path, derived from interpretation of corn-

TONG ET AL.: SHEAR WAVE SPLITTING IN THE UPPER. MANTLE 15,787
Table 1. Hypocenters and Magnitudes of Events for Which Shear Wave Splitting Was Successfully Measured
Event Date Origin Time, UT Latitude, deg Longitude, deg Depth, km Magnitude
I Jan. 5 1990 10 10:21.80 -8.800 106.442 29.0 5.3 2 Feb. 2 1990 07 58:14.07 -10.233 110.290 45.8 5.8 3 Feb. 9 1990 21 33:40.39 -9.886 119.050 41.7 4.6 4 Feb. 10 1990 13 12:14.20 -5.263 151.271 10.0 5.3 5 Feb. 10 1990 13 58:07.95 -10.506 120.304 33.0 4.6 6 Feb. 26 1990 18 13:59.80 -9.577 149.798 33.0 5.2 7 March 3 1990 17 11:39.72 -5.561 129.633 33.7 5.1
8 April 4 1990 19 51:48.95 -4.738 151.645 31.2 4.9 9 April 13 1990 22 46:55.32 -6.638 130.513 17.7 5.2 10 April 25 1990 15 32:21.70 -7.077 150.112 23.0 5.4 11 May 7 1990 14 52:51.60 -9.648 155.537 25.0 5.1 12 May 15 1990 20 35:34.60 -7.797 129.467 57.0 4.8 13 May 21 1990 13 24:36.60 -8.137 109.043 28.0 5.5 14 June I 1990 04 45:49.85 -5.119 147.722 33.0 5.4 15 June 6 1990 15 04:50.90 -6.422 131.240 62.0 5.0
16 July 17 1990 22 05:55.02 -7.746 128.893 33.0 4.7 17 Sept. 29 1990 11 16:10.90 -8.701 122.385 33.0 5.0 18 Oct. 18 1990 03 06:52.30 -7.348 129.279 48.0 5.3 19 Dec. 16 1990 20 19:48.10 -6.002 142.167 33.0 5.4
20 May 17 1991 06 37:47.00 -9.941 119.780 21.0 5.2 21 May 7 1991 17 07:04.00 -7.954 124.716 30.0 5.3 22 Sept. 26 1991 09 14:50.40 -9.283 158.620 26.0 5.2 23 Oct. 7 1991 19 56:21.10 -10.553 117.161 50.0 5.2 24 Dec. 27 1991 17 14:30.70 -9.093 157.840 33.0 5.2 25 Dec. 28 1991 03 40:31.40 -6.424 150.840 24.0 5.4 26 Dec. 28 1991 11 05:20.30 -6.325 150.189 33.0 5.4 27 Jan. 24 1992 12 09:24.10 -9.402 148.795 33.0 5.4 28 March 29 1992 15 12:30.60 -10.161 119.063 33.0 5.2 29 March 30 1992 13 42:19.10 -8.307 114.752 33.0 5.2
posite record sections using all available records for both SV and SH arrivals [Kennett et al., 1994]. The process is illustrated in Figure 3a for an event in the Flores Arc at 17.25ø; the two time windows used for the analysis of the seismogram in Figure 3a correspond to $ wave propagation in the mantle "lid" extending down to 210 km and to the arrivals from the mantle transition zone
below 410 km depth. The seismogram has been filtered with a band pass from 0.05 to 0.5 Hz using a causal, four-pole, Butterworth filter in order to remove some of the incoherent, high-frequency, scattered energy associ- ated with the lithospheric arrivals. Figure 3b illustrates an event south of Java at 29.18 ø where the time win-
dow corresponds to waves turned at the top of the lower mantle, in this case, Earth has acted as a suitable band- pass filter.
The widths of the time windows used for subseque- nt analysis are chosen so that they span approximately four periods in the waveform. As a result, these time windows include the possible interference between the waves reflected from or refracted beneath the 410- and 660-kin discontinuities. Differences between the wave- forms of the SV and SH waves could therefore arise
from a different distribution of energy between the re- flected and refracted arrivals. However, the takeoff gles for the reflected and refracted waves are w.•ry close
and synthetic calculations confirm that it is difficult to induce much difference in the excitation of the two
branches unless the propagation path leaves the source close to a node in the radiation pattern. The general consistency of the splitting results obtained from the analysis of many different events argues against a major influence from this cause, but it could •nake a signific- ant contribution to the scatter in the these results. The
most complex zone of pentuplication in upper mantle arrival:•, near 23.5 ø, is not sampled by our observations.
The phase velocity of the different classes of arrivals ranges from 4.6 km/s for the lithospheric arrivals, to 5.4-5.7 km/s for the refraction from beneath the 410 km transition and to 6.3-6.6 km/s for the waves that turn at the top of the lower mantle beneath the 660-km discontinuity. The arrivals in the 210 and 410 windows are therefore propagating at phase speeds less than the high P wave speed at the surface, and in consequence, the $V component will undergo phase shifts in its inter- action with the free surface and also to a lesser extent
with the Moho and any crustal discontinuities. The induced phase lags for SV waves are small but mean that the expected polarization pattern in the horizon- tal plane for arrivals in the 210 and 410 windows is not purely linear. We have avoided near-surface P wave conversion problems, with the hard rock recording site,

15,788 TONG ET AL.: SHEAR WAVE SPLITTING IN THE UPPER MANTLE
210
event 20
I
410 : I
,, ,, ' Z
•••'•...,• R
T , V • •! 17.2
0 15 30 45 60 75
three time windows selected in Figure 3. The top left panel in each figure displays the selected time window for the horizontal components of the seismogram after rotation to a radial/transverse coordinate system. The correlation calculations are carried out over the central
portion of the window as indicated by the triangles. As we have noted above, the propagation direction for most of the S arrivals from the upper mantle deviates significantly from the vertical and so the SV component will be affected by the free surface of Earth.
Jepsen and Kennett [1990] and Kennett [1991] have developed a procedure for correcting three-cmnponent seismograms for the influence of the free surface, which has been successful for studies of regional wave prop- agation. This approach combines the vertical (Z) and radial(R) components of motion to construct an esti- mate of the incident SV amplitude reaching the sur- face. For a model with surface velocity •0 for S, the SV contribution for a plane wave of slowness p is given by
sv = Zppo + •(•-
b 660 ' I
•event 1 f•'•'••'9.•2 '"•T 0 15 30 45 60 75
Time (seconds)
Figure 3. Three-component shear wave records for a pair of events along the Indonesian Arc recorded at WRA. (a) Event 20 in Table i at a distance of 17.2 ø (b) Event I in Table I at a distance of 29.2 ø. The time windows used for polarization analysis of shear wave splitting are marked for both the "lid" arrivals (210) and the phases associated with the 410-kin transition (410) in Figure 3a and for phases turning under the 660-kin discontinuity (660) in Figure 3b. The traces in Figure 3a have been filtered with a band pass fi'om 0.05 to 0.5 'Hz.
at the expense of a more complex polarization pattern for $ waves.
For each of the selected time windows a correlation
analysis was performed following a similar procedure to that proposed by Bowman and Ando [1987]. This approach is demonstrated in Figures 4, 5, and 6 for the
where
q•o = (•/•o • - p•)•/• This transformation compensates for the amplification effects and the phase distortion introduced by the free surface by a simple linear combination of the vertical and radial components with real coefficients. Kennett [1991] has shown that the coefficients in the transforma- tion for SV waves are relatively slowly varying functions of the slowness p and the velocity of S waves at the free surface, so that the transformation is robust. For SH waves, the equivalent transformation is a simple ampli- tude scaling of the transverse (T) component
SH - 0.5T.
For each of the selected time windows on the seis-
mograms we have adopted the slowness p appropriate to the particular arrival and range based on the veloc- ity model presented in Figure 2. For arrivals within the 210 window the values for p have the small range from 0.206 to 0.214 s/km. Within the 410 window, p ranges from 0.16 to 0.18 s/km and for the 660 window from 0.14 to 0.15 s/km. We have then transformed the three-component seismograms into $V and $H traces using these simple linear combinations of components. The resulting S V and SH wave traces are illustrated in the top middle panel of Figures 4-6. Since the surface velocities are quite well known (•0 - 3.55 km/s for she- ar waves, a0 - 5.8 km/s for compressional waves), this transformation will remove most of the phase (tistor- tion associated with the interaction of SV waves with
the free surface. The correction is most significm•t, and hence uncertain, for the 210 window but will also be significant for the 410 window. A comparison with Fig- ure 1 of Kennett [1991] reveals the sensitivity of this transformation to the value of the slowness parameter, p. The relevant coefficients for reconstructing the in- coming SV wave (Vsz and VsR in Kennett's [1991] no- tation) are reasonably smooth functions of the slowness.

TONG ET AL.: SHEAR WAVE SPLITTING IN TIlE UPPER MANTLE 15,789
a b c
Tf
d
23O 238 246
SV Sl
SH S2
SH S2 l 230 238 246 23O 238 246
-4.0 -2.0 0.0 2.0 4.0
Correlation coefficient
1 .o o.o -1 .o
Time lag (seconds)
Figure 4. Correlation analysis to determine the tinhe advance and rerotation angle from the radial/transverse geometry for the "lid" arrivals in Figure 3a. (a)Vertical (Z), radial (R)and tangential (T) traces. (b) $V and $H traces incorporating compensation for the influence of the free surface. (c) Rotated and time-shifted traces for elemental shear waves for which the cross correlation is optimized. d) Correlation between orthogonal shear wave components as a function of time shift and rerotation angle; the cross indicates the maximum correlation found.
Only in the case of the scaling of the radial component for the 210 window (Vsn) is the uncertainty likely to exceed 10%. Thus this transformation is a robust one
and should yield an accurate result if the wave field is in fact characterized by a single incoming plane wave. The presence of coda from P waves obscures the trans- formation to some degree. A merit of the transforma- tion process is that information is used from both the vertical and radial components in assessing the d•arac- teristics of the S V waves. We should note that there
is no simple relation between the apparent polarization expressed by plotting these SV and SH traces on or- thogonal axes and the original polm-izations in the hor- izontal plane displayed in the top left panel of Figures 4-6. The length of the windows used in the plots is such that the simple model of a single slowness may not be adequate for arrivals at the extremities of the wi]tdow.
Once the transformation of the original three-compon- ent records for each time window into $H and $V traces
has been accomplished, we assume that the transformed
records can be represented by a simple •nodel for possi- ble shear wave splitting. We consider a superposition of two orthogonal shear waves rotated by an angle • from the SV/$H polarization reference, separated in time by •t
SV(t) = A cos el(t) + B sin ½f(t + •t).
SH(t) = Asin el(t) - B cos ½f(t +
The amplitudes of the two waves are assumed to be ar- bitrary, but the waveforms imposed by source processes are assumed to be identical. For each time window
the parameters ½ and •t are estimated using a cross- correlation scheme which is restricted to the central
portion of the time window (the portion used is indi- cated by the triangles in Figures 4-6). For a span of time offsets St from -4 s to +4 s and rerotation angles .½ between-90 ø and 90 ø we have decomposed the $V and $H traces into two contributions incorporating the rotation and time offset. We have then calculated the
cross-correlation between these two trace estimates of

15,790 TONG ET AL.: SHEAR WAVE SPLITTING IN THE UPPER, MANTLE
a b c
T 1 R
248 256 264
SV
SH
248 256 264
S2,
Sl
S2
248 256 264
d 9O
60
30
0
-30
-60
-9O -2.0 0.0 2.0 4.0
Correlation coefficient
1.0 0.0 -1.0
Time lag (seconds)
Figure 5. Correlation analysis to determine the time advance and rerotation angle from the radial/transverse geometry for the transition zone arrivals in Figure 3b. For explanation, see Figure 4.
the elemental shear waves (S1, S2) for each ½, 5t combi- nation and contoured the resulting correlation diagram. The combination of parameters which gave the largest positive or negative correlation was then adopted as the best estimate of the splitting parameters. This proce- dure was found to give a close correspondence between 5t and the time offsets estimated by visual analysis.
In the bottom panel of each of Figures 4-6, the con- toured correlation diagram corresponding to the se- lected time window is displayed. We recall that only the central part of the window indicated by the tri- angles is used in this analysis. Superimposed on each contour diagram is a cross indicating the combination of splitting parameters •b and 5t which yield the high- est correlation. The elemental shear wave traces (S1, S2) incorporating the rotation and time shift fi)r the optimal parameters are displayed in the top right panel in Figures 4-6. For the central portion of the window we would expect linear polarization and this has been achiewM quite well. Comparison of the splitting results in Figures 4-6 with the corresponding three-component seismograms of Figure 3 gives good visual confirmation of the choice of optimal splitting parameters.
It is worth noting that in the contoured correlation di- agrams of Figures 4-6 there is some degree of nonunique- ness because the rotation angle •b spans half a circle. A rotation by 90 ø is equivalent to interchanging the traces while changing the polarity of one. Thus, for each pos- itive correlation peak there is a corresponding negative correlation peak at a time shift reversed in sign and a 90 ø shift in rotation angle. In Figure 4 the peak cor- relation is found at q• = 65 ø, 5t = 0.3 s, but there is an equivalent negative peak at q• = -25 ø, 5t = -0.3s. It is only because the correlation is computed within a time window of finite length that this equivalence is not perfect for the computed correlation function.
Each of the correlation functions presented in Fig- ures 4-6 have a clear maximum at a correlation with
amplitude approaching 0.9. The widths of the correla- tion peaks vary considerably. The width along the time axis is in large part controlled by the dominant period of the waveforms. Taking the half width of the chosen correlation peak along the time axis as an uncertainty of the measurement of time shift, the value would be about 1 s for the 210 and 410 branches (Figures 4 and 5) and 1.5 s for the 660 branch (Figure 6). The next

TONG ET AL.: SHEAR WAVE SPLITTING IN THE UPPER MANTLE 15,791
a b c
d
314 330 346 314 330 346
S2,
Sl
314 330 346
0 i ..... ,i•i•!i:i:•?
-30
- i O0 '"'""' '!"""'i!•:½"" ""•ii½ii½ -4.0 -2.0 0.0 2.0 4.0
Correlation coefficient
1 .o o.o -1 .o %•:i .•::..•.•-.,:,•.-:::::::•:•:::::•:::::•:.::•:•:::•:•:•::_?•:--:---.- • •' •- ß - - -•:'.:-!•:::::::'-::--::::'..-:::::::::::::::--:.-::---:':--:--- -
Time lag (seconds)
Figure 6. Correlation analysis to determine the time advance and rerotation angle from the radial]transverse geometry for the upper mantle arrivals in Figure 3b. For explanation, see Figure 4.
most significant correlation peak is normally of oppo- site sign to that selected and corresponds to a skip of half a cycle. The width of the correlation peak along the angle-of-rotation axis is primarily controlled 1)y the rotation kernels, cos qb and sin qb as is evident from the fact that in general, the correlation function sI)ans one cycle in the interval from qb = -90 ø to qb = 90 ø. It is not obvious that we can translate the half width of
the correlation peak into an absolute measure of uncer- tainty in this case, but it is clear that the uncertainty in the determination of the optimal rotation angle is considerable, perhaps of the order of 4-20 ø .
It is difficult to develop a more satisfactory error anal- ysis for the estimates of the rotation angle and time shift, becduse each event and time window presents a different noise environment. During the time interval for which broadband data are available it has not proved possible to achieve duplication of propagation paths to provide further confirmation of the results.
The model which we have used as the basis of the
shear wave splitting estimation comprising two orthog- onal shear waves subjected to rotation and ti.mc shift
during passage through an anisotropic zone is admit- tedly simple, but the present data do not warrant a more complex interpretation.
Results
The results of the splitting analysis are summarized in Table 2 and Figure 7 for 34 time windows from 29 events, out of the 200 windows for which such analysis was attempted. A measurement from the correlation procedure was deemed useful when a clear arrival was seen in a seismogram filtered with a low pass below 0.5 Hz, the signal-to-noise ratio exceeded a value of 2.0, and correlation and polarization diagrams such as those pre- sented in Figures 4-6 were unambiguously interpretable (a maximum correlation peak with amplitude exceed- ing 0.8 and a linear polarization achieved throughout a significant portion of the main arrival).
In some cases, arrivals on the shallow "lid" branch contain little energy below 0.5 Hz above the P coda but display a high level of energy around i Hz where scattering effects destroy coherency between tht: three

15,792 TONG ET AL.: SHEAR WAVE SPLITTING IN THE UPPER MANTLE
Table 2. A Summary of the Results of Polarization and Splitting Measurements.
Event A, deg Jr, s •b, deg R branch
12 13.03 0.3 ...... 210 16 13.29 0.0 -25.0 0.89 210 18 13.51 -0.3 ...... 210
9 13.81 -0.5 ...... 210 15 13.85 -0.3 ...... 210 7 15.09 0.3 ...... 210
21 15.19 0.0 ...... 210 19 15.87 0.0 -15.0 0.89 210
17 16.13 -0.5 ...... 210
5 16.50 0.2 ...... 210
20 17.25 0.3 65.0 0.88 210 27 17.48 0.0 ...... 210
3 17.86 0.0 ...... 210
23 19.03 0.0 ...... 210
20 17.25 -2.0 -20.0 0.87 410 27 17.48 -1.3 10.0 0.86 410
28 17.69 -0.6 -10.0 0.88 410
23 19.03 -3.0 50.0 0.96 410
10 19.97 -0.9 60.0 0.92 410 26 20.53 -3.0 -15.0 0.97 410 25 20.95 -3.5 0.0 0.92 410
4 22.05 -1.9 -25.0 0.96 410 29 22.24 -1.6 30.0 0.83 410 *
11 22.88 -4.4 -15.0 0.94 410
24 25.20 -3.2 -15.0 0.95 410 6 18.15 -2.6 -35.0 0.94 660
14 19.71 -0.4 -40.0 0.93 660
29 22.24 -1.6 30.0 0.83 660 *
8 22.68 -0.9 5.0 0.94 660
2 25.10 -0.7 -20.0 0.94 660
24 25.20 -2.0 0.0 0.88 660
22 25.74 -0.3 -30.0 0.92 660
13 27.18 -3.3 30.0 0.86 660 i 29.18 -3.5 -30.0 0.89 660
A is epicentral distance in degrees, dt is the measured time shift, •b is the measured rotation angle of the slow polarization clockwise away from the radial direction, and R is the peak correlation for each measurement. Blank entries the polarization direction and correlation indicate where measurements were made directly from high-frequency seismograms without polarization analysis. * Two interferring arrivals cannot be separated while a good polarization measure- ment can still be made.
recorded components. In such cases polarization analy- sis was not undertaken. Instead, travel time picks were made from both the radial and vertical components for $V and the transverse components for $H whenever this could be achieved with reasonable accuracy. The time shift was then defined as the timing difference be- tween the onset of the $H wave and onset of the $V wave. Entries in Table 2 with blanks entered for the
rotation angle and the correlation coefficient represent measurements of this type. For those cases where corre- lation analysis could also be achieved, there was a close correspondence between the estimates of tirne shift by the two methods. For all the lid arrivals (210 branch) the time shift between the two S components is very
small. In all we have 14 measurements averaging 0.0 s, with a standard deviation of 0.3 s and no systematic trend with epicentral distance. Clearly, no resolvable anisotropic effect is seen here. This is at odds with tentative statements made by Goody [1991] and Dey et ai. [1993] about observations of timing differences be- tween $H and SV waves on this branch based on only a few observations. For such very small time offsets there is very little control on the angle of orientation of the anisotropy, and so the rotation angles for the lid arrivals are not used in the subsequent analysis.
For ghe deeper branches, in all but a few cases the fast polarization is within 30 ø from the transverse di- rection. Since the likely uncertainty of measurement

TONG ET AL' SHEAR WAVE SPLITTING IN THE UPPER. MANTLE 1:5,793
time shift 660 2 (secønds) • I • I 410
210
I I I ' ' I • • • • I , , I I I I = ' ' I 10 15 20 25 30
epicentral distance (degrees)
Figure 7. A summary of measurements of time shift as a function of epicentral distance and branch on the travel time curve.
is 4.20", deviations from a purely SH/SV splitting ge- ometry are not significant. The measurements of time delay 5t display a fair degree of scatter along each of the 410 and 660 branches. Eleven measurements from
arrivals returning from the transition zone (410 branch) have an average time shift of 2.3 s and a standm'd devia- tion of 1.2 s. Nine measurements from arrivals returned
from the top of the lower mantle (660 branch) have an average time offset of 1.7 s and a standard deviation of 1.2 s. We should note that the set of observations
along each branch are built up from a number of differ- ent ew•nts and mix data from the two source clusters
along the Indonesian arc and through New Guinea. Figure 7 summarizes the time shifts between the two
S waves from Table 2 in terms of the branch of the travel time curve, the epicentral distance and the geographic location of the source. As in Figure 1, open symbols are used to indicate events along the Indonesian arc, and solid symbols are used for events in New Guinea and the Solomon Islands. It is clear that a significant level of shear wave splitting is found for the 410 and 660 branches, while no discernible anisotropic effect is found on the shallow 210 branch. The results fi)r the 410 and 660 branches show a hint of a weak increase of
5t with epicentral distance. In each case a linear trend of d5t/dA = 0.1 s/deg is estimated by linear regression; with the extraction of the trend, the standard deviation of the scatter is reduced from 1.2 s to 1.1 s.
From this set of observations of $ waves returned
from the upper mantle we have a clear indication of an anisotropic effect through splitting of the different po- larizations of 5'. Even with a fairly favorable geometry of sources for the recording site at WRA we have only a limited data set available from the broad bmod in-
strument with patchy coverage of the major travel time branches. The limited data set helps to accentuate the scatter among the delay time measurements, which are carried out in the coda of other arrivals. The correlation
procedure used for the analysis has expected uncertain- ties of the order of 4-0.5- 1.0 s. However, we cannot
exclude the possibility of a half cycle skip producing a high and visually appealing correlation. A further contribution is possible from a modification of the ap- parent waveforms of the SH and $V waveforms due to differences in the excitation of interfering arrivals.
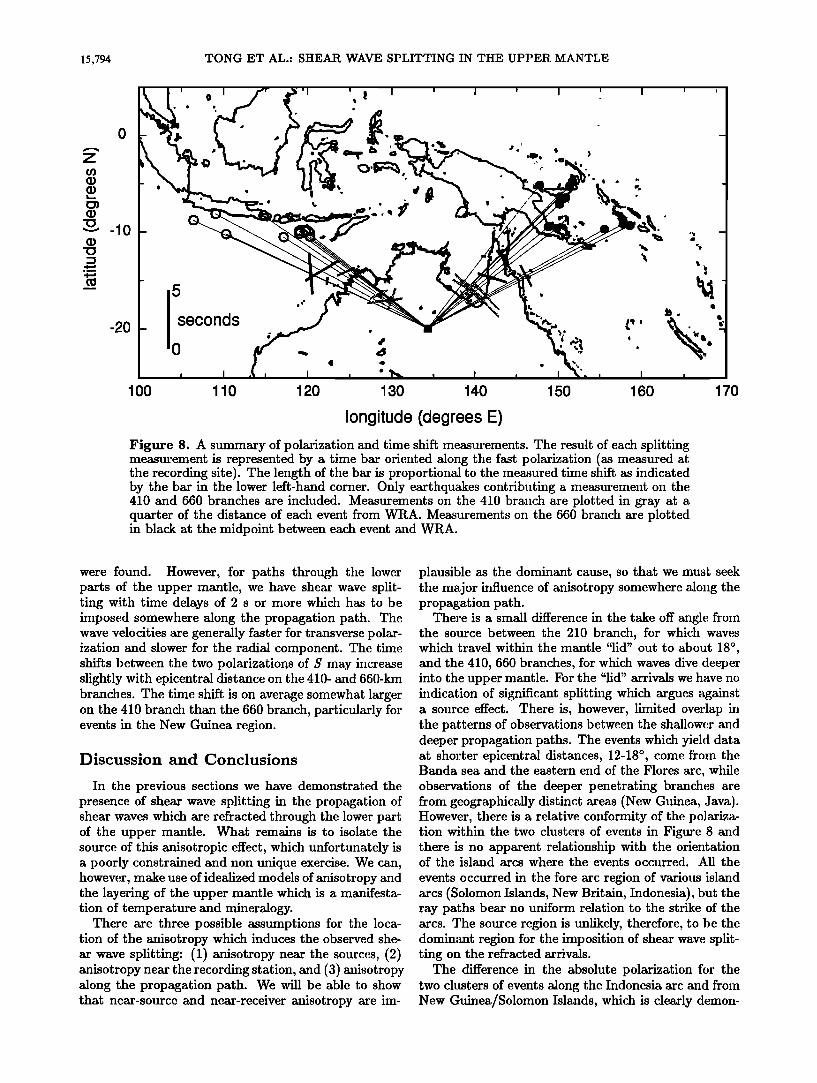
In Figure 8 we present a geographical summary of the results; we have only plotted those events for which a splitting measurement is available for either the 410 or the 660 branch. The events are connected to the WRA
recording site by a thin line to indicate the propagation path and the radial direction for each event. The shear wave splitting results are shown as oriented time bars. The length of each bar is proportional to St, and the bar is oriented along the inferred fast polarization direction. A scaling bar is shown for reference in the lower left of the figure. The splitting results for the 410 branch are plottee[ in grey at one third of the epicentral distance away from WRA. The corresponding results for tl•e 660 branch are plotted in black halfway along the ray. The positions of the time bars are chosen to separate the two classes of measurements in the figure and have no other significance since all of the measurements are made from recordings at the WRA site.
Figure 8 highlights the differences in the results for the two classes of events used (the Indonesian arc and New Guinea/Solomon Islands). The absolute polariza- tion is fairly consistent within each cluster but very diff- erent for the two clusters. The fast polarization is close to the transverse direction to each ray, particularly so for the cluster of events in New Guinea and the Solomon
Islands. The relative values for the time delays of the two branches are different in the two regions. The aver- age time delay is about the same on the 660 branch as on the 410 branch for the Indonesian events but varies
by almost a factor of 2 for the New Guinean events, where the splitting for the 410 branch has larger val- ues. Unfortunately, the number of observations on each branch from each cluster is still quite low.
In summary, no indications of anisotropic effe. cts on the propagation of shear waves within the mantle "lid"
15,794 TONG ET AL.' SHEAR WAVE SPLITTING IN THE UPPER MANTLE
-lO
-2o
5
seconds
'0
1 O0 110 120 130 140 150 160 170
longitude (degrees E)
Figure 8. A summary of polarization and time shift measurements. The result of each splitting measurement is represented by a time bar oriented along the fast polarization (as measured at the recording site). The length of the bar is proportional to the measured time shift as indicated by the bar in the lower left-hand corner. Only earthquakes contributing a measurement on the 410 and 660 branches are included. Measurements on the 410 bra•ch are plotted in gray at a quarter of the distance of each event from WRA. Measurements on the 660 branch are plotted in black at the midpoint between each event and WRA.
were found. However, for paths through the lower parts of the upper mantle, we have shear wave split- ting with time delays of 2 s or more which has to be imposed somewhere along the propagation path. The wave velocities are generally faster for transverse polar- ization and slower for the radial component. The time shifts 1)etween the two polarizations of S may increase slightly with epicentral distance on the 410- and 660-kin branches. The time shift is on average somewhat larger on the 410 branch than the 660 branch, particularly for events in the New Guinea region.
Discussion and Conclusions
In the previous sections we have demonstrated the presence of shear wave splitting in the propagation of shear waves which are refracted through the lower part of the upper mantle. What remains is to isolate the source of this anisotropic effect, which unfortunately is a poorly constrained and non unique exercise. We can, howew;r, make use of idealized models of anisotropy and the layering of the upper mantle which is a manifesta- tion of temperature and mineralogy.
There are three possible assumptions for the loca- tion of the anisotropy which induces the observed she- ar wave splitting: (1) anisotropy near the sources, (2) anisotropy near the recording station, and (3) anisotropy along the propagation path. We will be able to show that near-source and near-receiver anisotropy are im-
plausible as the dominant cause, so that we must seek the major influence of anisotropy somewhere along the propagation path.
There is a small difference in the take off angle froin the source between the 210 branch, for which waves which travel within the mantle "lid" out to about 18 ø , and the 410, 660 branches, for which waves dive deeper into the upper mantle. For the "lid" arrivals we have no indication of significant splitting which argues against a source effect. There is, however, limited overlap in the patterns of observations between the shallower and deeper propagation paths. The events which yiel(l data at shorter epicentral distances, 12-18 ø, come i¾om the Banda sea and the eastern end of the Flores arc, while observations of the deeper penetrating branches are from geographically distinct areas (New Guinea, Java). However, there is a relative conformity of the polariza- tion within the two clusters of events in Figure 8 and there is no apparent relationship with the orientation' of the island arcs where the events occurred. All the
events occurred in the fore arc region of various island arcs (Solomon Islands, New Britain, Indonesia), but the ray paths bear no uniform relation to the strike of the arcs. ]'he source region is unlikely, therefore, to 1)e the dominant region for the imposition of shear wave split- ting on the refracted arrivals.
The difference in the absolute polarization for the two clusters of events along the Indonesia arc and froin New Guinea/Solomon Islands, which is clearly demon-

TONG ET AL.: SHEAR WAVE SPLITTING IN THE UPPER. MANTLE 15,795
strated by Figure 8, cannot be consistent with a major near-receiver contribution to the shear wave splitting. Anisotropy in the upper lithosphere in the immediate vicinity of the WRA site is thus not a major contributor to the observed shear wave birefringence.
We therefore need to examine the influence of the
different aspects of the propagation path between the sources and the recording station at WRA. A shear wave traveling nearly vertically will be most sensitive to anisotropy in the horizontal plane, and similarly for a refracted wave traveling nearly horizontally in the up- per mantle the greatest sensitivity will be to the proper- ties in a vertical plane perpendicular to the propagation direction. Because of the nature of the refracted wave
paths (Figure 2) the influence of anisotropy will vary with different portions of the path.
We consider first the influence of the lithosphere. The absence of splitting for the mantle "lid" arrivals is in- compatible with a simple model of transverse isotropy with a vertical symmetry axis as is often used to recon- cile Love and Rayleigh wave dispersion along a partic- ular path. For transverse isotropy we would expect to acquir• shear wave splitting along the nearly horizon- tal part of the path due to the difference between the wave speeds for horizontal and vertical polarizations. The w•.ry thick lithosphere in northern Australia is a zone of low attenuation and intense scattering, and it is possible that heterogeneity may mask the influence of anisotropy. Unfortunately, the distribution of sources for which we can sample the lid zone at WRA allows no assessment of any azimuthal effects.
The paths of the refracted waves returned from (teeper in the upper mantle are at a significant angle to the ver- tical in the lithosphere (at least 45 ø ) and so will have path lengths of rather greater than 200 km within the lithosphere. We have pointed out above the difficulty of reconciling the polarization characteristics of the ar- rivals from the two different source clusters with a major effect near the receiver, but the substantial path lengths in the lithosphere could introduce some portion of the splitting.
The influence of the lithosphere will be rather dif- ferent for these refracted waves than for SK$ waves
traveling near vertically. There are only a limited num- ber of $K$ splitting observations available within Aus- tralia. The nearest station CTAO, in Queensland near the edge of the craton, has an $KS splitting of about i s with a polarization direction at an azimuth of 60 ø, and similar results are obtained for NWAO in West-
ern Australia and TAU in Tasmania [Vinnik et al. , 1992]. However, the station CAN in southernstern Aus- tralia is reported as having no perceptible splitting for $KS arrivals [Vinnik et al., 1989]. Despite the tectonic stability of Australia, there is considerable complexity in the assemblage of the craton and it is not easy to extrapolate the $KS results to WRA, but to achieve a delay time of about I s between the two shear wave components requires the presence of some azimuthal anisotropy which is normally associated with the up- per mantle[ e.g., Mainprice and Silver, 1993].
The most likely location for the imposition of the ma- jor component of shear wave splitting for the refracted waves from deep in the mantle is therefore from the por- tions of the paths well away from the endpoints. This leaves the segment in the asthenosphere and in the tran- sition zone or lower mantle.
The lack of significantly anisotropic minerals which are stable below a depth of about 480 km [Mainprice and Silver, 1993] constrains the region of likely aniso- tropy from below. Olivine is the most anisotropic of the most abundant minerals in the upper mantle and apparently the most ductile mineral, i.e., the mineral which most easily aligns with flow [Anderson, 1989]. Its anisotropy and alignments of its orientation are gener- ally believed to cause the azimuthal anisotropy which has been observed in Pn waves and vertical S, ScS, and $KS waves. It is also believed to be the main cause of
the anisotropy which manifests itself in the inconsis- tency between the isotropic models needed to match the dispersion of Love and Rayleigh waves [Anderson, 1989]. At or near the 410 discontinuity the low-pressure form of olivine is transformed into a spinel-like struc- ture, •-olivine. It is almost as anisotropic a mineral as the low pressure form of the mineral, a-olivine, but nothing is known about its petrofabrics [Mainprice and Silver, 1993]. The olivine content of the transition zone may be lower than nearer to the earth's surface [Duffy and Anderson, 1989]. Nevertheless, •-olivine must be conside,red a plausible source of seismic anisotropy in the mantle. Below a depth of about 480 km/•-olivine transforms into -/-spinel [e.g,. Ringwood, 1991] which is only slightly anisotropic [Anderson, 1989]. Thus the lower part of the transition zone is not a candi- date region for anisotropy. Mainprice and Silver [1993] estimate the maximum shear wave anisotropy of the main constituents of the lower mantle, perovskite and wustitc, to be around 10%. They point out, however, that little is known about the petrofabrics of these min- erals, and that indications are that deformation does not induce petrofabric [Karato and Li, 1992]. The lower mantle is thus a weak candidate for the anisotropy we are seeking.
The measured time delays between the two shear wave components for the 410 and 660 branches do not display a significant dependence on epicentral distance. It is unlikely that the splitting occurs in the region of turning for either branch because we would then ex- pect a dependence of the length of the turning segment. Mainprice and Silver [1993] argue against perceptible anisotropy in perovskite at the top of the lower man- tle. However, it is not trivial to rule out anisotropy in the/•--olivine regime at the top of the transition zone. In order to predict an observation where the time shift does not increase with epicentral distance on the 410 branch, the level of anisotropy would have to decrease sharply with depth. Allowing for a 70-km-thick layer at the top of the transition zone with a linearly decreasing level of anisotropy results in about 10% anisotropy at the top of the layer in order to satisfy the 1.7-s delay on the 660 branch. The maximum level of shear anisotropy

15,796 TONG ET AL.: SHEAR WAVE SPLITTING IN THE UPPER MANTLE
in /•--olivine is 14 % [Anderson, 1989] which assumes perfect. alignment in an aggregate of 100% /•-spinel and sampling of the maximal polarization. Ten percent anisot,'opy is therefore unreasonable. Anisotropy at the top of the transition zone cannot be the major con- tributor to our splitting measurements, although some contribution is possible.
We are then left with the depth interval between 210 and 410 km as the source region for the anisotropic ef- fect. We recall that this asthenospheric zone has slightly reduced shear velocity compared with the mantle lid and also enhanced attenuation of shear waves. Rays corresponding to arrivals on the 410 and 660 branches traverse this region at an angle of about 65 ø and 50 ø from the vertical, respectively. Thus the polarization of the SV waves is 65 ø and 50 ø from the horizontal. As- suming a simple variation of velocity with polarization angle from the horizontal, 8, of the form
v (0) = v0 (1 + a cos 20 + b cos 4•)
and u, fiform anisotropy with depth between 210 and 410 km, we can match the average time delay on the 410 and 660 branches by the choice of the parameters a and b. In order to match the observed behavior, we require a - 0.0036 and b - 0.0048 which would imply a maximum anisotropy of 1.4% between a horizontally polarized $H wave and an $V wave polarized at an angle of 50 ø from the horizontal. The model used is rather simple, but this result is indicative of the level of anisotropy needed in this asthenospheric region in or- der to explain our data. Because the propagation path in the asthenosphere is quite long, there is no need to invoke a high level of anisotropy to introduce the re- quired splitting. A difference in shear wave speeds for vertical and horizontal polarizations of around 1% is entirely feasible for plausible mineralogies in this zone. A higher level of anisotropy in a thinner layer is also possible. A model with transverse isotropy •n the as- thenosphere would be consistent with the observations from the two different source clusters.
We have been able to demonstrate the presence of clear shear wave splitting in refracted waves returned from the mantle transition zone and below. The ori- entation of the fast direction estimated from correla-
tion analysis lies close to the transverse direction to the propagation paths from the two clusters of earthquakes (Indonesian arc, New Guinea/Solomon Islands) which lie at the appropriate distances. The typical splitting in the shear wave times is about 1.7 s which can be ex-
plained by the presence of a transversely isotropic ma- terial in the asthenosphere with about a 1% difference between the wave speeds for horizontally and vertically polarized shear waves. Since this zone displays lowered shear wave speed and increased attenuation, it is likely to be hot and undergoing current deformation, perhaps associated with the northward drift of the Australian plate.
We do not need to invoke significant anisotropy in the lithosphere to match the splitting observations for refracted waves. However, for arrivals confined to the
lithosphere, the geometry of available sources does not place significant constraints on lithospheric properties. The level of anisotropy we have proposed for the as- thenosphere beneath northern Australia is much lower than the 2.5% anisotropy (of unspecified type) indicated by Gaherty and Jordan [1993] for paths to the station NWAO in western Australia. A modest anisotropy in the asthenosphere would not vitiate their suggestion that the Lehmann discontinuity (210 km deep in our region) marks a mechanical boundary.
Acknowledgments. The constructive criticism of the reviewers, Associate Editor, and members of the RSES Seis- inology Group were very helpful in preparing the revised version of this paper. I.J. Weekes assisted with the data extraction from the WRA tapes.
References
Anderson, D. L., Elastic wave propagation in layered aniso- tropic media, J. Geophys. Res.,66, 2953-2963, 1961.
Anderson, D. L., Theory of the Earth, 366 pp., Blackwell Scientific, Boston, Mass., 1989.
Anderson, D. L., and A.M. Dziewonski, Upper-mantle anisotropy: Evidence from free oscillations, Geophys. J. R. Astron. Soc.,69, 383-404, 1982.
Ando, M., Y. Ishikawa, and F. Yamazaki, Shear wave polar- ization-anisotropy in the upper mantle beneath Honshu, Japan, J. Geophys. Res.,88, 5850-5864, 1983.
Bowman, J. R., and M. Ando, Shear wave splitting in the upper-mantle wedge above the Tonga subduction zone, Geophys. J. R. Astron. Soc.,88, 25-42, 1987.
Dey, S.C., B.L.N. Kennett, J.R. Bowman, and A. Goody, Variations in the upper mantle velocity structure under northern Australia, Geophys. J. Int.,11J, 304-310, 1993.
Duffy, T., and D. L. Anderson, Seismic velocities in man- tle minerals and the mineralogy of the upper mantle, J. Geophys. Res.,9J, 1895-1912, 1989.
Dziewonski, A.M., and D. L. Anderson, Preliminary refer- ence Earth model, Phys. Earth Planet. Inter.,œ5, 297- 356, 1981.
Fuchs, K., Recently formed elastic anisotropy and petrolog- ical models for the continental, subcrustal lithosphere in southern Germany, Phys. Earth Planet. Inter.,31, 93-118, 1983.
Fukao, Y., ScS evidence for anisotropy in the Earth's man- tle, Nature, 309, 695-698, 1984.
Gaherty J.B., and T.H. Jordan, The nature of polarization anisotropy and the Lehmann discontinuity Eos Trans. A GU, 7• (43),Fall Meeting Supra., 432-433, 1993.
Goody A., Broad-band studies of the upper mantle beneath northern Australia, honours thesis, Aust. Natl. Univ., Canberra, 1991.
Gudmundsson O., B.L.N. Kennett, and A. Goody, Broad- band observations of upper mantle seismic phases in north- ern Australia and the attenuation structure in the upper mantle, Phys. Earth. Planet. Inter.,8J, in press, 1994.
Hager, B. B., and R. O'Connell, Kinematic models of large- scale flow in the Earth's mantle, J. Geophys. Res.,8J, 1031-1048, 1979.
Hearn, T., Pn travel times in southern California, .l. Geo- phys. Res.,89, 1843-1855, 1984.
Hess, H., Seismic anisotropy of the uppermost mantle under oceans, Nature, 203, 629, 1964.
Jepsen, D.C., and B.L.N. Kennett, Three component analy- sis of regional seismograms, Bull. SeismoI. Soc. Am.,80, 2032-.2052, 1990.

TONG ET AL.: SHEAR WAVE SPLITTING IN THE UPPER MANTLE 15,797
Journet, B., and N. Joberr, Variation with age of anisotropy under oceans, from great-circle surface waves, Geophys. Res. Left.,9, 179-181, 1982.
Karato, S., and P. Li, Diffusive creep in perovskite: Impli- cations for the rheology of the lower mantle, $cience,œ55, 1238--1240, 1992.
Kennett, B.L.N., The removal of free-surface interactions from three-component seismograms, Geophys. J. Int., 1 153-] 63, 1991.
Kenherr, B.L.N.. O. Gudmundsson, and C.Tong, The up- per mantle S and P velocity structure beneath northern Australia from broad-band observations, Phys. Earth Planet. lnter.,in press, 1994.
L•vf•que, J.-J., and M. Cara, Interpretation of multimode surface wave data: evidence for sub-lithospheric anisotropy, Geophys. J. R. Astron. Soc.,83, 753-773, 1985.
Mainprice, D. and P. G. Silver, Interpretation of SKS waves using samples from the subcontinental lithosphere, Phys. Earth Planet. Inter., 78, 257-280, 1993.
Montagner, J.-P., and T. Tanimoto, Global upper-mantle tomography of seismic velocities and anisotropy, J. Geo- phys. Res.,96, 20,337-20,351, 1991.
Natal, H.-C., I. Nakanishi, and D. L. Anderson, Measure- ments of mantle-wave velocities and inversion for lateral
heterogeneities and anisotropy, 3, Inversion, J. Geophys. Res.,91, 7261-7307, 1986.
Nishimura, C.E., and D.W. Forsyth, The anisotropic struc- ture of the upper mantle in the Pacific Ocean, Geophys. J. R. Astron. Soc.,96, 203-229, 1989.
Raitt, R. W., G. G. Shot, T. J. G. Francis, and G. B. Mor- ris, Anisotropy of the Pacific upper mantle, J. Geophys. Res.,7J, 3095-3109, 1969.
Regan, J., and D. L. Anderson, Anisotropic models of the upper mantle, Phys. Earth Planet. Inter.,35, 227-263, 1984.
Ringwood, A.E., Phase transformations and their bearing on the constitutuion and dynamics of the mantle, Geochirn. Gosmochirn. Acta, 55, 2083-2110, 1991.
Shearer, P.M., and J. Orcutt, Compressional and shear- wave anisotropy in the oceanic lithosphere, Geophys. J. R. Astron. Soc.,87, 967-1003, 1986.
Silver, P. G., and W. W. Chan, Shear wave splitting and subcontinental mantle deformation, J. Geophys. Res.,96, 16,429-16,454, 1991.
Tanimoto, T., and D. L. Anderson, Mapping convection in the mantle, Geophys. Res. Left.,11, 287-290, 1984.
Thomson, C. J., J.-M. Kendall, and W. S. Guest, Geomet- rical theory of shear-wave splitting: Corrections to ray theory for interference in isotropic/anisotropic transitions, Geophys. J. Int., 108, 339-363, 1992.
Vinnik. L. P., G. L. Kosarev, and L. I. Makeyeva, Anisotropy in the lithosphere from the observations of $KS and SKKS, Dokl. Acad. Nauk SSSR,œ78, 1335-1339, 1984.
Vinnik. L. P., V. Farra, and B. Romanowicz, Azimuthal anisotropy in the earth from observations of SK$ at GEO- SCOPE and NARS broad band stations, Bull. Seisrnol. Soc. Am.,79, 1542-1558, 1989.
Vinnik, L. P., L. I. Makeyeva, A. Milev, and A. Y. Usenko, Global patterns of azimuthal anisotropy and deformations in the continental mantle, Geophys. J. Int.,111, 433-447, 1992.
Yu, G. K., and B. J. Mitchell, Regionalized shear-velocity models of the Pacific upper mantle from observed Love- and Rayleigh-wave dispersion, Geophys. J. R. Astron. $oc.,57, 311-341, 1979.
O. Gudmundsson, B. L. N. Kennett, and C. Tong, Research School of Earth Sciences, Australian National University, Canberra ACT 0200, Australia. (e-mail: [email protected], [email protected], [email protected])
(Received September 2, 1993; r•viaed January 31, 1994; accepted February 14, 1994.)