shear strength of reinforced concrete beams subjected to blast
TRANSCRIPT

i
Shear Strength of Reinforced Concrete Beams subjected
to Blast Loading
Non-linear Dynamic Analysis
ABBAS ZANGENEH KAMALI
Master of Science Thesis Stockholm, Sweden 2012


Shear Strength of Reinforced Concrete Beams subjected to Blast Loading
Non-linear Dynamic Analysis
Abbas Zangeneh Kamali
August 2012 TRITA-BKN. Master Thesis 368, 2012 ISSN 1103-4297 ISRN KTH/BKN/EX-368-SE

©Abbas Zangeneh Kamali, 2012
Royal Institute of Technology (KTH) Department of Civil and Architectural Engineering Division of Structural Engineering and Bridges Stockholm, Sweden, 2012

i
Abstract
The experimental investigations performed on the behaviour of reinforce concrete
elements subjected to blast loading have revealed that the shear mechanisms and
ductility play important roles in the overall response and failure mode of such
structures.
The main aim of this master thesis is to study the possibility of using finite element
method as a tool for predicting the dynamic response of blast loaded reinforced
concrete beams and evaluation of their shear strength. In this study, the commercial
software, ABAQUS/Explicit has been used by implementing appropriate constitutive
material models in order to consider the material nonlinearity, stiffness degradation
and strain rate effects. The results of some blast loaded tested beams have been used
for verification and calibration of the model. As a secondary objective, the calibrated
model used to study the influence of some important factors on the shear strength of
reinforced concrete beams and investigate their effects on the failure mode. The results
used as a reference and compared with the calculations according to some design codes
for blast resistance design.
The results of the present research show that the implemented nonlinear finite element
model successfully simulates the dynamic responses including displacement/reaction
force time histories and induced damage patterns of blast tested beams with reasonable
accuracy.
The results of performed parametric study confirm that the ductility play important
role in the failure behaviour of studied beams. The numerical simulations show that
dynamic response of a soft element is more ductile than the stiffer one and the shear
forces are thereby limited. Thus, although a soft element fails by large deformations in

ii
flexure, a stiff element may experience a brittle shear failure mode for the same load
intensity.
The comparison between the results of numerical analysis and design codes calculation
show that the American approach in shear design of reinforced concrete elements
subjected to blast loading is relatively conservative, similar to static design approach
and do not consider the effect of ductility in the shear design procedure. On the
contrary, the procedure that Swedish guideline implemented somehow considers the
effect of ductility on the shear strength of reinforced concrete elements subjected to
impulsive loads.
Further research should involve the using the developed finite element model as a tool
in order to theoretically study the dynamic response of blast loaded reinforced concrete
elements and their failure modes. The results of numerical simulations can be used as a
reference to derive simplified computational methods for practical design purposes.
Keywords: Non-linear finite element analysis, Shear Strength, Reinforced Concrete,
Normal Strength Concrete, Blast loading, Explicit Dynamic analysis, Design codes

iii
Preface
The research work presented in this master thesis was carried out at the Division of
Structural Engineering and Bridges with collaboration with the Division of Concrete
Structures, Department of Civil and Architectural Engineering at the Royal Institute of
Technology (KTH). The thesis has been conducted under supervision of Adj.
Professors Costin Pacoste and Mikael Hallgren.
First, I would like to express my sincere appreciation to my supervisors, Professors
Mikael Hallgren and Costin Pacoste, for their guidance, encouragement and helpful
advice.
I would like also to thank Prof. Raid Karoumi for giving me the opportunity to work
on this subject and his supports during my studies. A special thanks to PhD student
Johan Magnusson for the proof-reading of the report and his valuable and supportive
comments and Dr. Richard Malm for his helpful advice regarding the numerical
modelling of concrete.
Last but not least, my deepest gratitude to my family, especially to my parents for
their supports and to my wife Roya for her patience and understandings.
Stockholm, August 2012
Abbas Zangeneh Kamali


v
Contents
Abstract ................................................................................................................... i
Preface ................................................................................................................... iii
1 Introduction ......................................................................................................... 1
1.1 Background ................................................................................................. 1
1.2 Aim and scope ............................................................................................. 2
1.3 Limitations .................................................................................................. 3
1.4 Outline of the thesis .................................................................................... 3
2 Air blast tests on RC beams ................................................................................. 5
2.1 Air blast loading .......................................................................................... 5
2.2 Experimental investigation .......................................................................... 8
3 Structural behaviour, analysis and design ............................................................. 11
3.1 Material behaviour at high strain rates ...................................................... 11
3.1.1 Properties of concrete at high strain rates ...................................... 11
3.1.2 Properties of reinforcing steel at high strain rates .......................... 14
3.2 Structural response of RC elements to blast loading .................................. 15
3.3 Dynamic analysis ...................................................................................... 17
3.3.1 The single-degree-of-freedom (SDOF) analysis .............................. 17
3.3.2 Dynamic reaction force .................................................................. 20
3.3.3 Numerical simulations ................................................................... 22
3.4 Design approaches for blast loaded RC beams ........................................... 23
3.4.1 US-army design approach (UFC, 2008) ......................................... 23
3.4.2 Swedish design approach (FKR, 2011) ........................................... 25
3.4.3 Comparison between design approaches ........................................ 29
4 FE Modelling of Dynamic Behaviour of Reinforced Concrete ................................ 31
4.1 Uniaxial behaviour of plain concrete .......................................................... 32
4.1.1 Uniaxial behaviour in compression................................................. 32
vi
4.1.2 Uniaxial behaviour in tension ........................................................ 35
4.2 Modelling of plain concrete ........................................................................ 36
4.2.1 Concrete Damaged Plasticity model .............................................. 36
4.3 Modelling of reinforcement ........................................................................ 44
4.3.1 Classic metal plasticity model ........................................................ 45
4.3.2 Johnson-Cook plasticity model ...................................................... 45
4.4 Explicit dynamic analysis .......................................................................... 46
4.4.1 Time increment size ....................................................................... 47
4.4.2 Damping ........................................................................................ 47
5 Verification of FE model ...................................................................................... 49
5.1 Description of FE-model ............................................................................ 49
5.2 Analysis of the tested beam: B40-D4 ......................................................... 52
5.2.1 Displacement time history ............................................................. 52
5.2.2 Reaction force time history ............................................................ 53
5.2.3 Crack pattern ................................................................................ 55
5.2.4 Influence of strain rate effect ......................................................... 56
5.2.5 Influence of dilation angle .............................................................. 57
5.2.6 Influence of damage parameters ..................................................... 59
5.3 Analysis of the tested beam: B40-D3 ......................................................... 61
5.3.1 Displacement time history ............................................................. 61
5.3.2 Reaction force time history ............................................................ 62
5.3.3 Crack pattern ................................................................................ 63
6 Shear strength analysis of blast loaded RC beams ................................................. 65
6.1 Effect of concrete property ........................................................................ 65
6.1.1 Ductility and failure mode ............................................................. 66
6.1.2 Reaction force and shear capacity .................................................. 68
6.1.3 Displacement ................................................................................. 68
6.2 Effect of Longitudinal reinforcement ratio ................................................. 70
6.2.1 Ductility and failure mode ............................................................. 71
6.2.2 Reaction force and shear capacity .................................................. 71
6.2.3 Displacement ................................................................................. 74
6.3 Effect of beam’s depth ............................................................................... 75
6.3.1 Ductility and failure mode ............................................................. 76
6.3.2 Reaction force and shear capacity .................................................. 77
6.3.3 Displacement ................................................................................. 79
vii
6.4 Effect of shear reinforcement ratio ............................................................. 80
7 Conclusions and further research ......................................................................... 83
7.1 Conclusions ............................................................................................... 83
7.1.1 Finite element analysis .................................................................. 83
7.1.2 Shear strength of air blast loaded RC beams .................................. 84
7.1.3 Design codes .................................................................................. 85
7.2 Further research ........................................................................................ 85
Bibliography ........................................................................................................... 87
A Input material properties curves ..................................................................... 91
B Approximation of pressure loads .................................................................... 93
C Convergence study ........................................................................................ 97
D Filtration of output curves ........................................................................... 101
E Detailed outputs of parametric study ........................................................... 103
F Static analysis ............................................................................................. 109


ix
List of Abbreviations
2D: Two-dimensional
3D: Three-dimensional
CDP: Concrete Damage Plasticity material model
DIF: Dynamic Increase Factor
FE: Finite Element
FEM: Finite Element Modelling
FKR: The Swedish fortification Agency design rules
FOI: The Swedish Defence Research Agency
HSC: High Strength Concrete
J&C: Johnson-Cook material model
NSC: Normal Strength Concrete
RC: Reinforced Concrete
SDOF: Single Degree of Freedom
UFC: Unified Facilities Criteria
US: United states
x
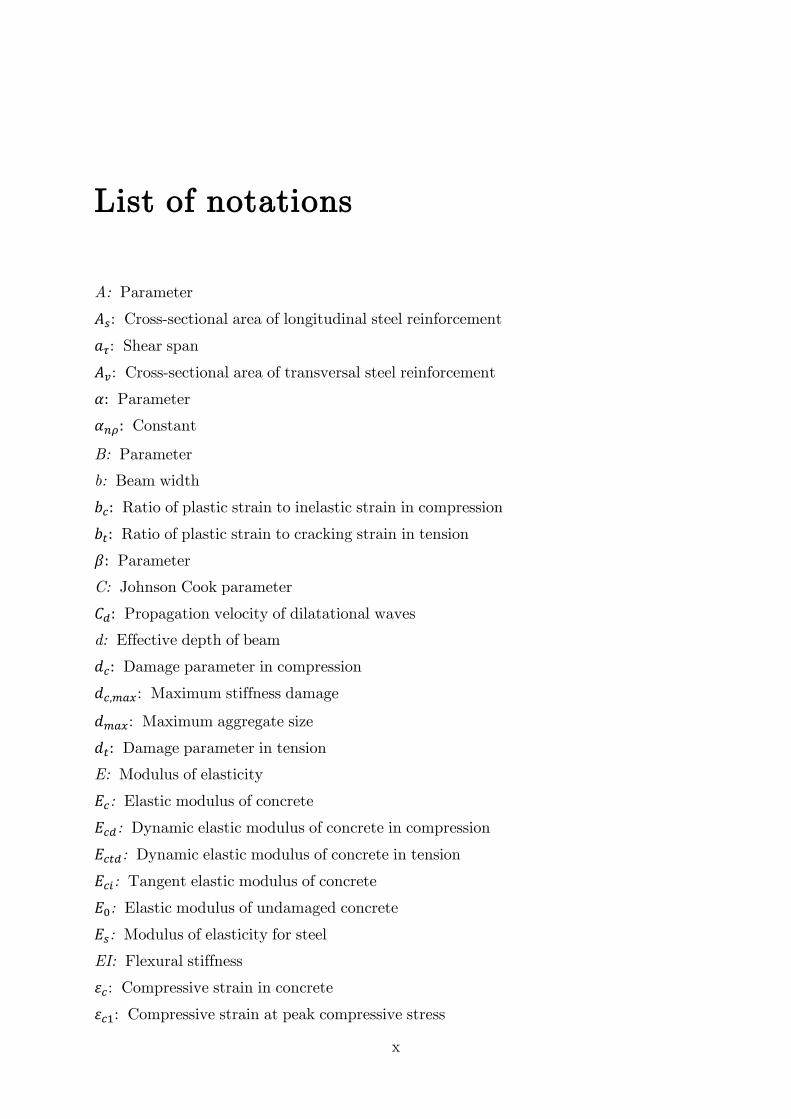
List of notations
A: Parameter
: Cross-sectional area of longitudinal steel reinforcement
: Shear span
: Cross-sectional area of transversal steel reinforcement
Parameter
Constant
B: Parameter
b: Beam width
Ratio of plastic strain to inelastic strain in compression
Ratio of plastic strain to cracking strain in tension
Parameter
C: Johnson Cook parameter
Propagation velocity of dilatational waves
d: Effective depth of beam
Damage parameter in compression
: Maximum stiffness damage
: Maximum aggregate size
Damage parameter in tension
E: Modulus of elasticity
: Elastic modulus of concrete
: Dynamic elastic modulus of concrete in compression
: Dynamic elastic modulus of concrete in tension
: Tangent elastic modulus of concrete
: Elastic modulus of undamaged concrete
: Modulus of elasticity for steel
EI: Flexural stiffness
: Compressive strain in concrete
: Compressive strain at peak compressive stress

xi
: Dynamic strain at peak compressive stress
: Compressive strain rate in concrete
: Tensile strain rate in concrete
: Strain rate in steel
: Quasi-static strain rate in steel
: Nominal strain form measurement
: Yield strain in steel
: Ultimate strain in steel
: Plastic strain
: Inelastic strain of concrete in compression
: Plastic strain of concrete in compression
: Cracking strain of concrete in tension
: Plastic strain of concrete in tension
: Compressive cube strength of concrete
: Splitting tensile strength of concrete
: Mean compressive strength of concrete
: Characteristic compressive strength of concrete
: Mean tensile strength of concrete
: Dynamic compressive strength of concrete
: Dynamic tensile strength of concrete
FF: Drucker-Prager yield function
: Design reaction force at each support
: Yield strength of steel
: Ultimate strength of steel
: Dynamic yield strength of steel
: Dynamic ultimate strength of steel
: Total reaction force capacity of the beam
: Total maximum reaction force of the beam
⁄ : Equibiaxial compressive yield stress to the uniaxial compressive yield stress
: Fracture energy of concrete
: Crushing fracture energy of concrete
G: Plastic flow rule function
Controlling parameter in compression softening of concrete
Parameter
xii
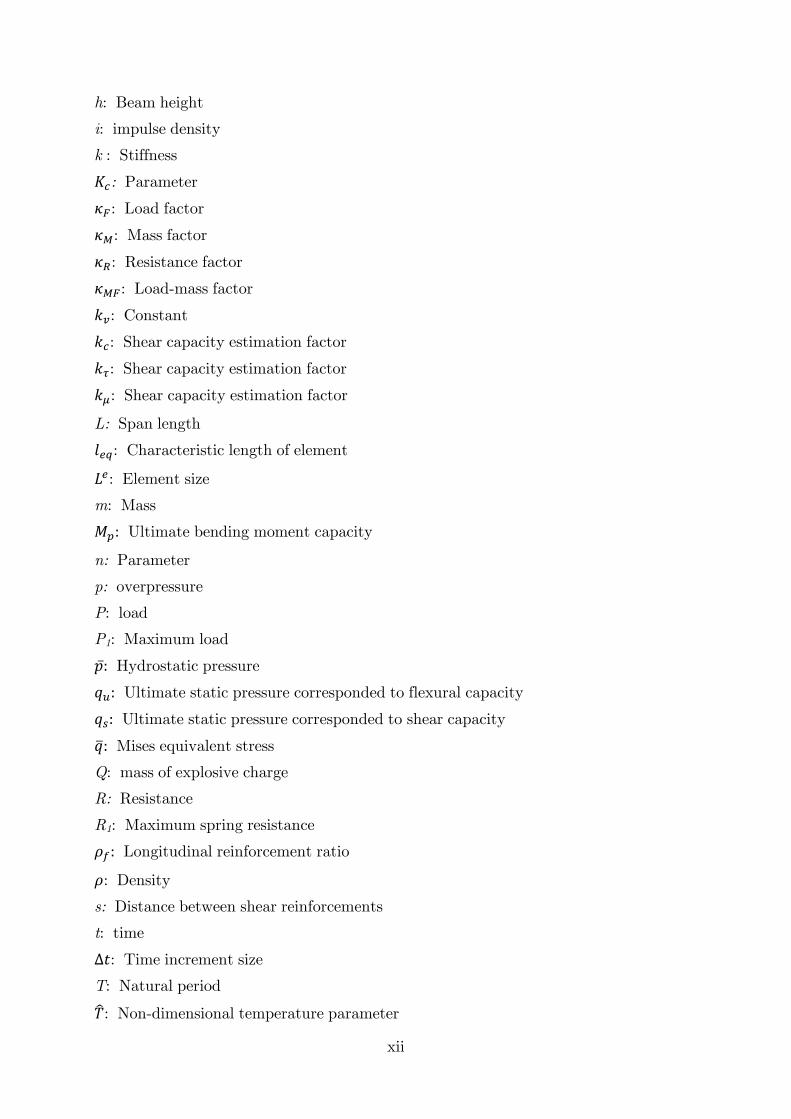
h: Beam height
i: impulse density
k : Stiffness
: Parameter
: Load factor
: Mass factor
: Resistance factor
: Load-mass factor
: Constant
: Shear capacity estimation factor
: Shear capacity estimation factor
: Shear capacity estimation factor
L: Span length
: Characteristic length of element
: Element size
m: Mass
Ultimate bending moment capacity
n: Parameter
p: overpressure
P: load
P1: Maximum load
Hydrostatic pressure
Ultimate static pressure corresponded to flexural capacity
Ultimate static pressure corresponded to shear capacity
Mises equivalent stress
Q: mass of explosive charge
R: Resistance
R1: Maximum spring resistance
Longitudinal reinforcement ratio
: Density
s: Distance between shear reinforcements
t: time
: Time increment size
T: Natural period
: Non-dimensional temperature parameter
xiii
: Duration of triangular pulse load
: Time at maximum elastic response
: Time at maximum response
u: Parameter
: Design shear force at critical section
: Shear capacity of concrete section
: Shear capacity of shear reinforcements
Maximum crack opening at zero tension
Crack opening
Plastic displacement in compressive softening
: Natural circular frequency
: Stiffness recovery factor in compression
: Stiffness recovery factor in tension
: Highest frequency of the system
: Distribution length of shear stirrups
: Constant
: Constant
: Displacement
Acceleration
: Maximum displacement
z: Protection level factor
: Compressive stress in concrete
: Tensile stress in concrete
: Nominal stress form measurement
: Stress
: Dynamic stress in steel
: Static stress in steel
: Maximum principal effective stress
: Dilation angle
: Eccentricity parameter
: Poisson ratio


1
Chapter 1
Introduction
1.1 Background
A wide range of reinforced concrete structures, from urban infrastructures and
buildings to industrial facilities and protective structures may be subjected to blast
loadings due to civilian accidents or from detonation of explosives. In recent decades,
due to the demand for higher safety against accidental explosions besides elevated
terrorism level, the blast-resistant design of RC structures has become a necessity.
To understand and predict the nonlinear dynamic behaviour of blast-loaded RC
structures and develop appropriate design methods, it is essential to combine
theoretical analyses and the results of well-organized experiments. The Swedish
Defence Research Agency (FOI) has been collaborating with the Royal Institute of
Technology (KTH) for many years, experimentally investigating the behaviour of RC
elements subjected to air blast loading; see Hallgren and Balazs (1999) and Magnusson
and Hallgren (2000, 2003). The experiments performed in this field have revealed that
the shear mechanisms and ductility play important roles in the overall response and
failure mode of blast loaded RC elements. The results also showed that the response of
a RC element under such impulsive loads is considerably different from static and
quasi-static loads.
Due to the complexity of theoretical study in this field, some simplified methods are
often used for practical design purposes. A well-known simplified approach converts
1.2. AIM AND SCOPE
2
the analysed structure to a SDOF system, considering only the deformed shape in the
first vibration mode (Quasi-static). Due to the severe simplifications, the application of
this method is limited to flexural response of simple structures such as beams and
slabs, Magnusson (2007). In addition, only the maximum displacement time history of
the critical point of analysed structure can be obtained by this method without any
information about the stress distribution in the rest of the structure, Saatci and
Vecchio (2009). Wees and Peters (1995) concluded that the prediction of the maximum
shear force at the supports by such simplified method may be very inaccurate for high
impulsive loads.
In order to overcome the limitations of simplified methods and theoretically study the
detailed structural responses, advanced numerical methods, such as the finite element
analysis can be helpful. This permits for detailed analyses of failure modes and stiffness
degradation as well as time history of strains and stresses in different parts of an
element, see Magnusson and Hansson (2005), Saatci and Vecchio (2009). Although,
such an approach allows the analysis of structures with various geometries and
different dynamic load cases, numerical modelling of dynamic response of reinforced
concrete, in particular shear mechanism is still a challenging topic for researchers.
Furthermore, it also produces major difficulties for practical design purposes when the
size of modelling and computation time is considered. Nevertheless, an efficient FE
model can be implemented , as an alternative of high cost experiments, to study the
effects of different factors such as concrete strength, amount and placement of
reinforcement, various geometry and boundary conditions on the response of blast
loaded RC elements. The results can be used as a reference for developing the design
guidelines and simplified methods for practical design purposes.
1.2 Aim and scope
The main aim of present research is to evaluate the use FE analysis for predicting the
shear strength of reinforced NSC beams subjected to air blast loading. In this study, a
nonlinear explicit FE model has been implemented to evaluate the load and deflection
capacity of reinforced concrete beams under blast loading as well as their failure
modes. An appropriate constitutive material model has been chosen to consider the
nonlinear behaviour of concrete and steel, stiffness degradation of concrete and strain
CHAPTER 1. INTRODUCTION
3
rate effects. For this purpose, the commercial FEM software, ABAQUS, has been used.
The results of air blast loaded beams, which were tested in an experimental study
conducted by Magnusson and Hallgren (2000), have been used for verification and
calibration of FE model.
A secondary objective of the thesis is to perform a parametric study on some important
design factors of RC beams and study their effects on the dynamic response of the
beams as well as their failure modes. Furthermore, the results have been compared
with the calculations according to some codes for blast resistance design. This can be
considered as a start point for future researches and developments of design codes in
the shear design of RC structures subjected to blast loading.
1.3 Limitations
In the present research, only the effect of air blast overpressures on the dynamic
response of structure has been studied. The influence of ground shock waves or
fragment impacts is not considered in the analysis.
In this report, only the overall dynamic response of RC beams subjected to far range
blast loading will be studied. The effects of close range blast loading that causes high
load concentrations and local failures such as direct spalling or punching shear are not
included.
Present research is also limited to the conventional reinforced normal strength
concrete. No studies will be done on the behaviour of high strength concrete elements
or other reinforcement types.
The studies are limited to simply supported beams and no analyses will be carried out
on another type of structures.
1.4 Outline of the thesis
The subjects of the following chapters are presented below to give an overview of the
report´s outline.
1.4. OUTLINE OF THE THESIS
4
The basic theory of blast wave formations is presented in chapter 2, followed by a
summary of experimental set-up and configuration of air blast test program on the RC
beams.
Chapter 3 covers a brief description about basic theories of reinforced concrete
behaviour at high rate loadings, structural response of concrete structures under
dynamic loading and corresponded analysis methods. In addition, the shear design
procedures of blast loaded RC elements based on common guidelines are described.
In the fourth chapter, principals of numerical modelling of reinforced concrete
structures are explained. A brief description about the features of commercial FEM
software, ABAQUS/Explicit including different constitutive material models and
basics of explicit dynamic analysis procedure is presented.
In chapter 5, details of FE model including geometry and mechanical properties of
materials are introduced. Furthermore, verification and calibration process of
implemented FE model according to experimental investigations will be presented.
Chapter 6 includes the results of modelling and discussions about the influence of
different parameters on the shear strength and failure mode of air blast loaded RC
beams. In addition, the results of FE analysis are compared to the calculations
according to different design codes.
In the last chapter, main conclusions of the research are presented and an outline for
future studies is recommended.
5
Chapter 2
Air blast tests on RC beams
Hallgren and Balazs (1999) and Magnusson and Hallgren (2000, 2003) have performed
air blast tests on several RC beams of varying strength and amounts of reinforcement
to study the effect of different parameters on the dynamic behaviour and failure modes
of blast-loaded RC beams. The investigations involve experiments on 38 beams were
air blast loaded in a shock tube and 11 beams were loaded statically for reference. The
results of these well-defined experimental investigations can be used as a reference for
verification and calibration of analytical studies.
In this chapter, a brief description about basics of blast phenomena and blast wave
formation is presented. In the following, the configuration of the aforementioned shock
tube tests, including the geometry of the tested beams and selected results is
summarised.
2.1 Air blast loading
The principal effects of explosion phenomena on a structure are blast overpressures,
fragments impacts and ground shock waves. Among them, the overall structural
response is usually governed by the blast overpressures, UFC (2008). In the present
research, only the effect of air blast overpressures on the dynamic response of
structures has been studied. According to UFC (2008), an explosion caused by a rapid
chemical reaction that proceed through the explosive material at a supersonic speed
and results to abrupt change in the surrounding air pressure, temperature and density.
2.1. AIR BLAST LOADING
6
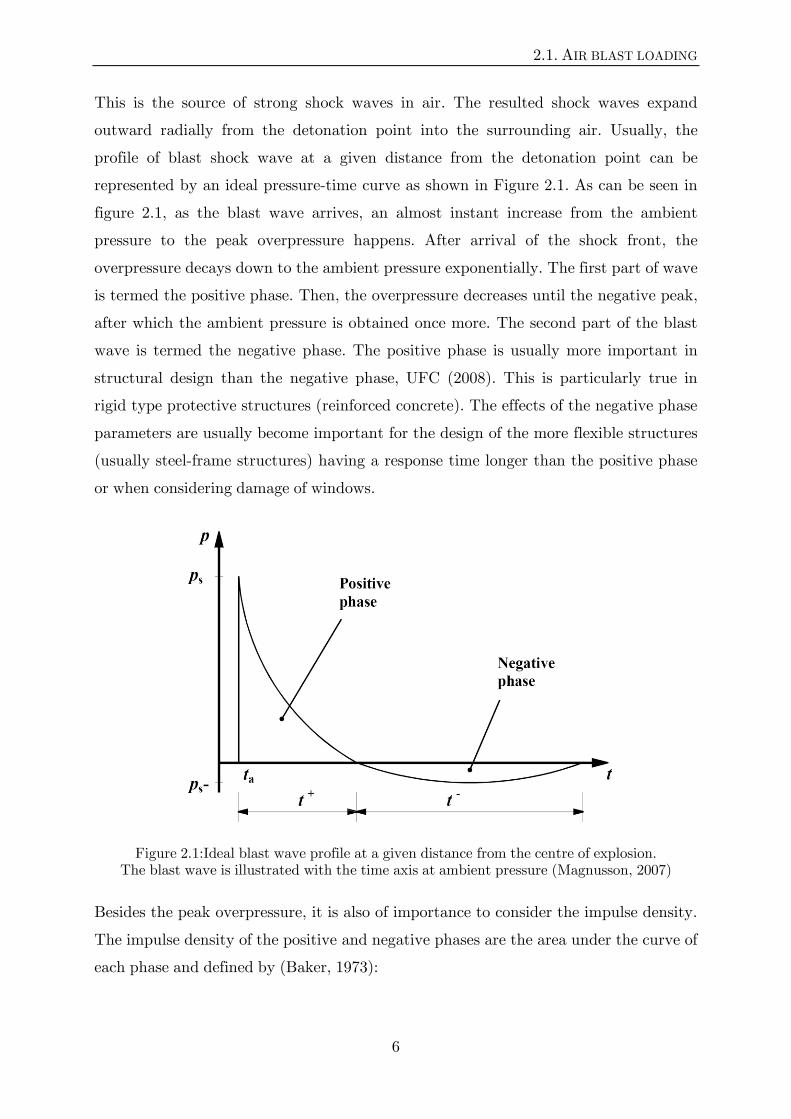
This is the source of strong shock waves in air. The resulted shock waves expand
outward radially from the detonation point into the surrounding air. Usually, the
profile of blast shock wave at a given distance from the detonation point can be
represented by an ideal pressure-time curve as shown in Figure 2.1. As can be seen in
figure 2.1, as the blast wave arrives, an almost instant increase from the ambient
pressure to the peak overpressure happens. After arrival of the shock front, the
overpressure decays down to the ambient pressure exponentially. The first part of wave
is termed the positive phase. Then, the overpressure decreases until the negative peak,
after which the ambient pressure is obtained once more. The second part of the blast
wave is termed the negative phase. The positive phase is usually more important in
structural design than the negative phase, UFC (2008). This is particularly true in
rigid type protective structures (reinforced concrete). The effects of the negative phase
parameters are usually become important for the design of the more flexible structures
(usually steel-frame structures) having a response time longer than the positive phase
or when considering damage of windows.
Figure 2.1:Ideal blast wave profile at a given distance from the centre of explosion. The blast wave is illustrated with the time axis at ambient pressure (Magnusson, 2007)
Besides the peak overpressure, it is also of importance to consider the impulse density.
The impulse density of the positive and negative phases are the area under the curve of
each phase and defined by (Baker, 1973):

CHAPTER 2. AIR BLAST TESTS ON RC BEAMS
7
∫ ( ) ( )
∫ ( ) ( )
where p denotes the overpressure. The time endpoints of the intervals are chosen as
referred to in Figure 2.1.
For practical design purposes, usually the positive part of blast wave profile is
simplified by a triangular pressure time curve. In this approximation, the equivalency
of respective impulse densities plays an important role; see Magnusson (2007).
In a free air blast, an idealised shock wave as shown in figure 2.1, propagated without
any disturbance. In practice, many effects will disturb the magnitude and properties of
a shock wave. When a shock wave strikes a solid surface, the wave is reflected and the
pressure, density and temperature are reinforced. Different aspects such as peak
pressure of incident blast wave and the angle between wave’s motion and the face of
the object affect the reflected shock wave; see UFC (2008). For example, an explosion
inside a tunnel will leads to blast waves with higher pressures, higher impulse densities
and longer durations compared to a free air blast case, because of complex blast wave
reflections against walls, roof and floor. For this reason, in order to generate blast loads
with relatively small amounts of explosive charges a shock tube, which can be
considered as a small tunnel, was used in the blast load tests of concrete beams, see
Magnusson and Hallgren (2000). The reflection phenomena can lead to a pressure up to
twenty times larger than the incident pressure value; see Mays and Smith (1995).
There are various empirical expressions for the values of peak pressure and duration
from a certain explosion at scaled distances. A full discussion and extensive charts for
predicting blast pressures and blast durations are given by Balazs (1998) and UFC
(2008).
Diffraction is another well-known phenomenon that can affects the shock waves’
properties, describes how a shock wave propagated around an object, e.g. a building.
For more detailed information, see UFC (2008) and Baker (1973).

2.2. EXPERIMENTAL INVESTIGATION
8
2.2 Experimental investigation
In the following a brief description of air blast tests and its results is presented. The
detailed information about the experimental investigation can be found in Magnusson
and Hallgren (2000, 2003). In figure 2.2 and 2.3 the experimental set up of shock tube
test and geometry, reinforcement and configuration of tested beams are shown. The air
blast was generated in a shock tube at FOI´s testing ground in Märsta, which is used
to simulate blast waves.
Figure 2.2: Experimental set up for air blast test, Magnusson and Hallgren (2000)
The set-up of the test and distance between the beam and explosive charge was
regulated in such a way that the beam can be considered as loaded by a plane wave
front. The instrumentation of these tests consisted of pressure gauges measuring the
reflected pressure, load cells at the supports, deflection gauges and an accelerometer at
mid-span of the beam. In order to keep the beam in place during the tests, the beams
were fixed to supports with bolts and nuts. Due to the relatively low flexural strength
of the bolts, the beams were considered as simply supported. In addition, the holes for
the bolts close to the beam ends were rectangular in order to enable movements and
rotations of beams; see further Magnusson and Hallgren (2000)
In this report, two of the normal strength concrete beams tested experimentally
referred to B40-D3 and B40-D4 in Magnusson and Hallgren (2000), have been selected
to calibrate and verified the implemented FE-model. Summary of dimensions,
reinforcement and material properties of selected tested beams are presented in table
2.1. The vertical shear reinforcement ratio and distance between stirrups has been
arranged in such a way that makes a shear critical member. The beam was loaded by a
transient uniform pressure induced by the detonation of explosive charge inside a shock
CHAPTER 2. AIR BLAST TESTS ON RC BEAMS
9
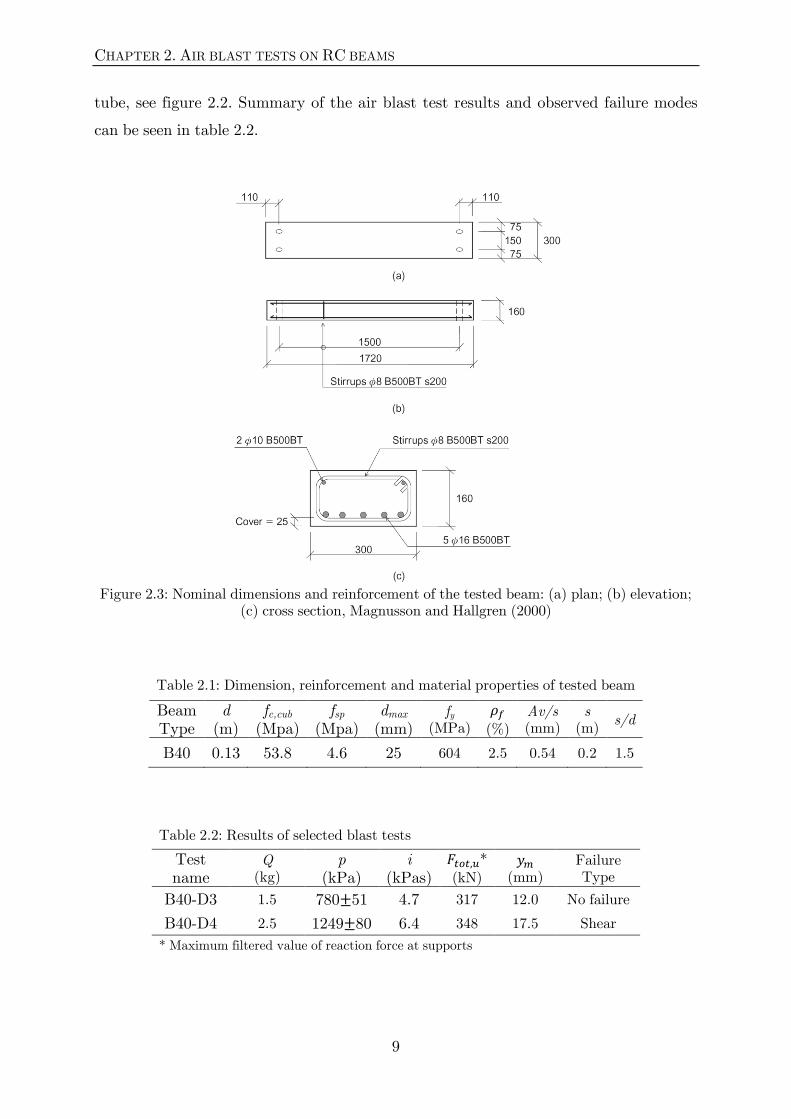
tube, see figure 2.2. Summary of the air blast test results and observed failure modes
can be seen in table 2.2.
Figure 2.3: Nominal dimensions and reinforcement of the tested beam: (a) plan; (b) elevation;
(c) cross section, Magnusson and Hallgren (2000)
Table 2.1: Dimension, reinforcement and material properties of tested beam
Beam Type
d (m)
fc,cub (Mpa)
fsp (Mpa)
dmax (mm)
fy (MPa)
(%)
Av/s (mm)
s (m)
s/d
B40 0.13 53.8 4.6 25 604 2.5 0.54 0.2 1.5
Table 2.2: Results of selected blast tests
Test name
Q (kg)
p (kPa)
i (kPas)
*
(kN)
(mm)
Failure Type
B40-D3 1.5 780 51 4.7 317 12.0 No failure
B40-D4 2.5 1249 80 6.4 348 17.5 Shear
* Maximum filtered value of reaction force at supports


11
Chapter 3
Structural behaviour, analysis and design
3.1 Material behaviour at high strain rates
RC structures subjected to blast/impact loading will respond by deforming over a
relatively short period of time and the strain rates in the concrete and reinforcement
reach magnitudes considerably higher than that of a statically loaded structure. For
example, the shock tube tests performed by Magnusson and Hallgren (2000) induced
strain rates around 1.0 s-1, while the ordinary static tests strain rate is located in the
range: 10-6-10-5 s-1. Such a high loading rate would change the mechanical properties of
objective structures and, therefore, the probable failure mode of various structural
elements. The strength of concrete and reinforcing steel in RC structures subjected to
blast loading can increase considerably due to strain rate effects.
3.1.1 Properties of concrete at high strain rates
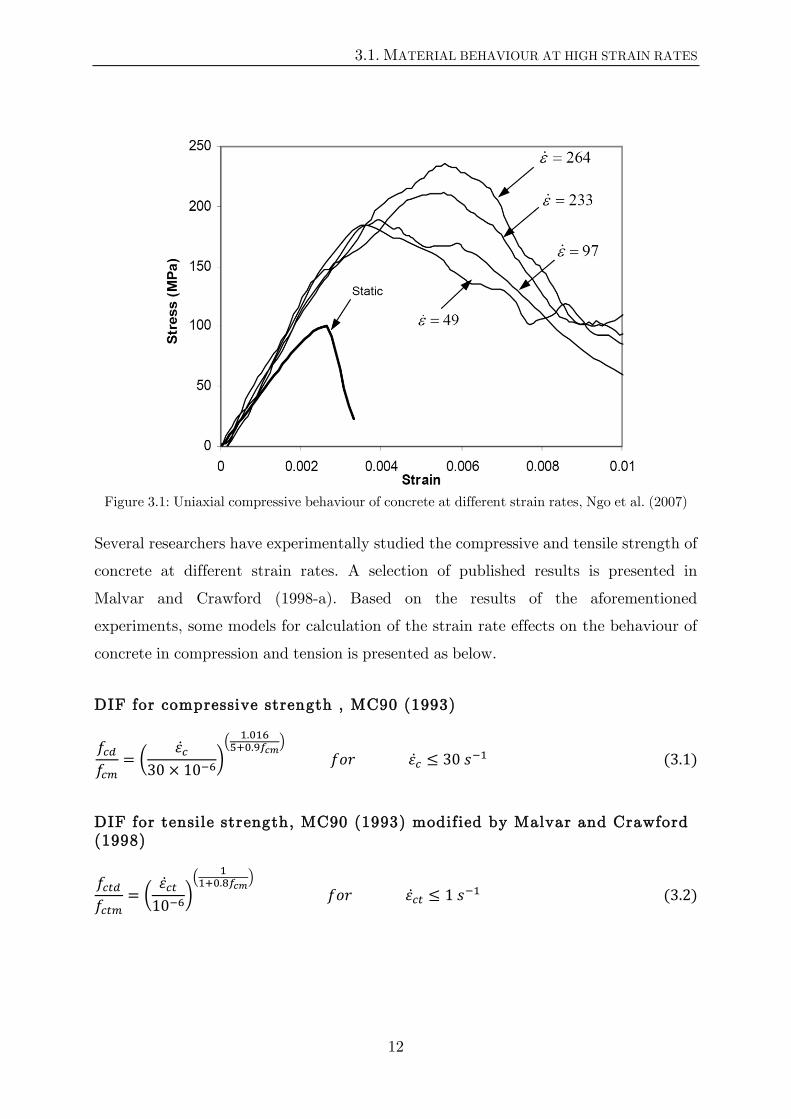
The mechanical properties of concrete under dynamic loading conditions can be quite
different from that under static loading. Both the strength and stiffness of concrete
that are sustained for a certain period of time under dynamic conditions may gain
values that are remarkably higher than the static condition, see figure 3.1.
3.1. MATERIAL BEHAVIOUR AT HIGH STRAIN RATES
12
Figure 3.1: Uniaxial compressive behaviour of concrete at different strain rates, Ngo et al. (2007)
Several researchers have experimentally studied the compressive and tensile strength of
concrete at different strain rates. A selection of published results is presented in
Malvar and Crawford (1998-a). Based on the results of the aforementioned
experiments, some models for calculation of the strain rate effects on the behaviour of
concrete in compression and tension is presented as below.
DIF for compressive strength , MC90 (1993)
(
)(
)
( )
DIF for tensile strength, MC90 (1993) modified by Malvar and Crawford (1998)
(
)(
)
( )
CHAPTER 3. STRUCTURAL BEHAVIOR, ANALYSIS AND DESIGN
13
DIF for elastic modulus, MC90 (1998)
(
)
( )
(
)
( )
DIF for peak compressive strain, MC90 (1998)
(
)
( )
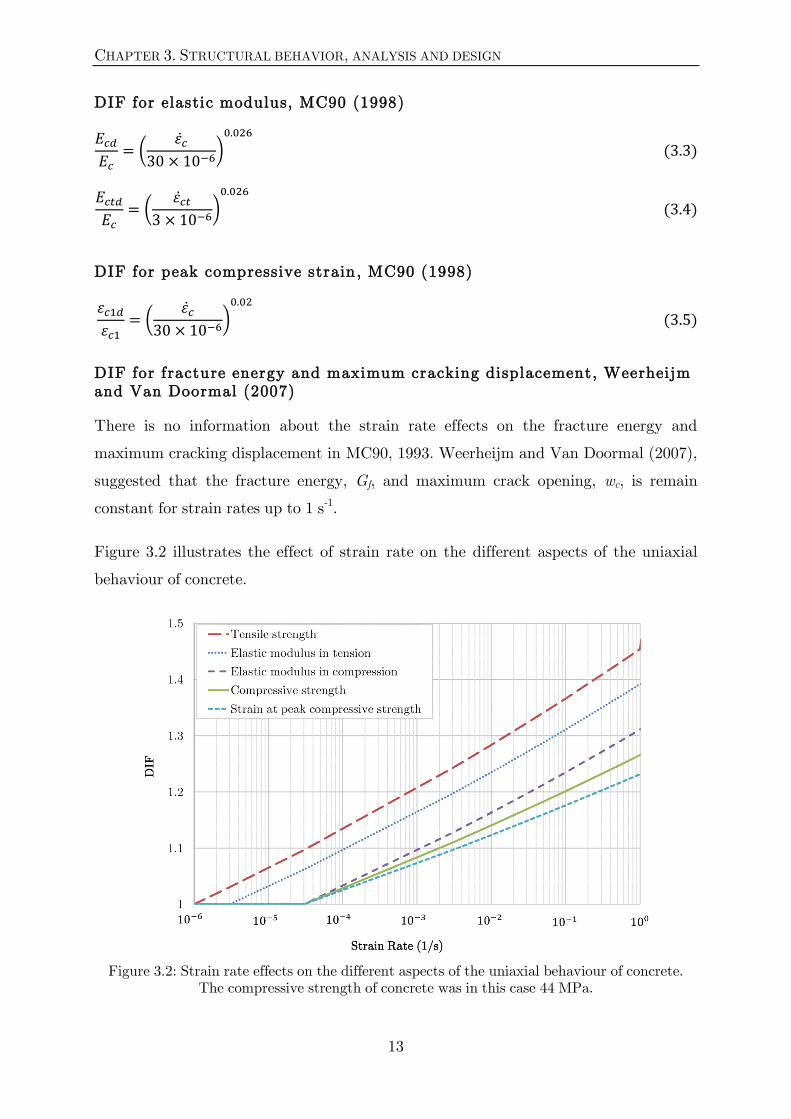
DIF for fracture energy and maximum cracking displacement, Weerheijm and Van Doormal (2007)
There is no information about the strain rate effects on the fracture energy and
maximum cracking displacement in MC90, 1993. Weerheijm and Van Doormal (2007),
suggested that the fracture energy, Gf, and maximum crack opening, wc, is remain
constant for strain rates up to 1 s-1.
Figure 3.2 illustrates the effect of strain rate on the different aspects of the uniaxial
behaviour of concrete.
Figure 3.2: Strain rate effects on the different aspects of the uniaxial behaviour of concrete. The compressive strength of concrete was in this case 44 MPa.
3.1. MATERIAL BEHAVIOUR AT HIGH STRAIN RATES
14
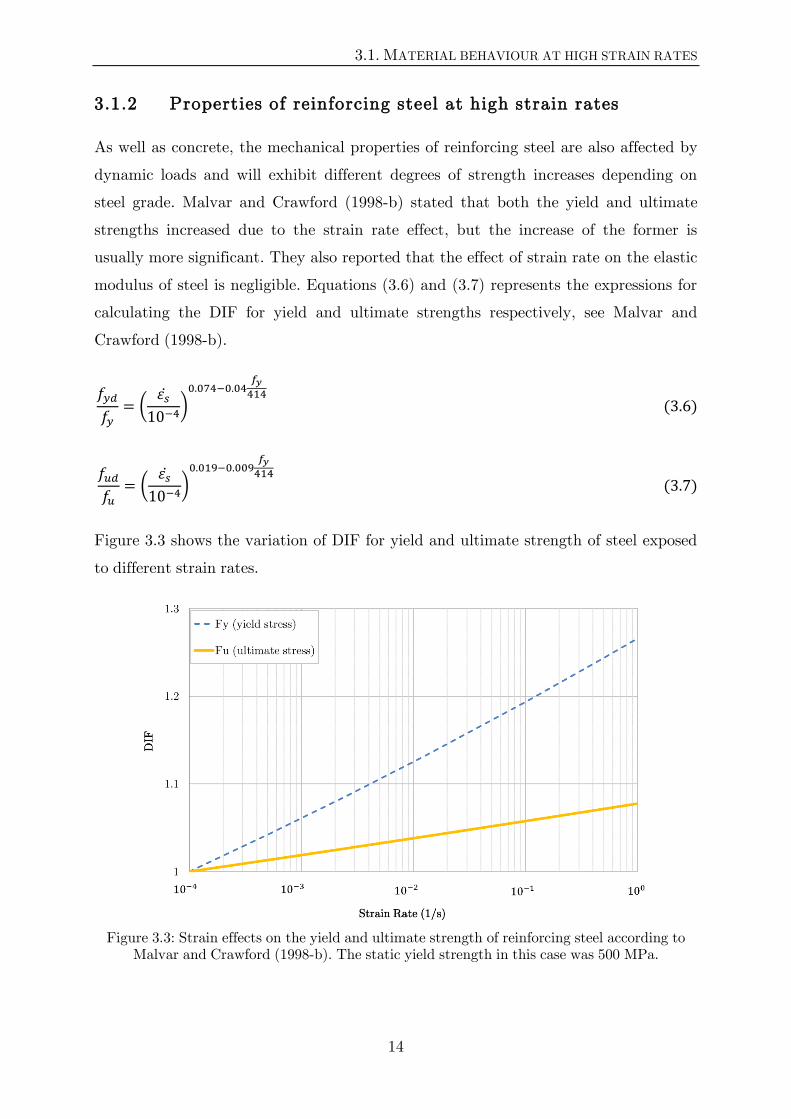
3.1.2 Properties of reinforcing steel at high strain rates
As well as concrete, the mechanical properties of reinforcing steel are also affected by
dynamic loads and will exhibit different degrees of strength increases depending on
steel grade. Malvar and Crawford (1998-b) stated that both the yield and ultimate
strengths increased due to the strain rate effect, but the increase of the former is
usually more significant. They also reported that the effect of strain rate on the elastic
modulus of steel is negligible. Equations (3.6) and (3.7) represents the expressions for
calculating the DIF for yield and ultimate strengths respectively, see Malvar and
Crawford (1998-b).
(
)
( )
(
)
( )
Figure 3.3 shows the variation of DIF for yield and ultimate strength of steel exposed
to different strain rates.
Figure 3.3: Strain effects on the yield and ultimate strength of reinforcing steel according to Malvar and Crawford (1998-b). The static yield strength in this case was 500 MPa.
CHAPTER 3. STRUCTURAL BEHAVIOR, ANALYSIS AND DESIGN
15
3.2 Structural response of RC elements to blast loading
The structural response of a RC element as well as its failure mode under blast loading
may change considerably from that under static or quasi-static loading, especially if
the duration of applied load is very shorter than the natural period of structure. In the
case of such impulsive loads, the overall response of structure is strongly affected by
stress waves propagation and motion-generated inertia forces, Zelinski (1984).
The experimental investigations that have been performed to study the behaviour of
RC elements subjected to blast loading revealed that the shear mechanism play
important role in the overall response of blast loaded RC elements; see Magnusson and
Hallgren (2000, 2003). They reported that a statically flexural-critical RC beam may
experiences an abrupt shear failure when subjected to blast loading. Ardila-Giraldo
(2010) also studied RC beams to blast load, which show similar results. Magnusson
(2007) stated that a suddenly applied dynamic load with large amplitude, which can
excite vibration modes of higher order than the first mode in the beam, introduces
large shear forces in the element. According to Ardila-Giraldo (2010), the deformed
shape of a beam in the initial phase of response to blast load is dominated by shear
deformations near the supports. This initial deformed shape is dramatically different
from the deformed shape under static load and results to extreme shear demand.
Magnusson and Hallgren (2000, 2003) also reported that the structural stiffness and
ductility has a great influence on the failure mode of blast loaded RC beams. That is to
say, where beams with different reinforcement ratios were exposed to blast load, only
beams with the low reinforcement ratio failed in flexure and the failure mode changed
from a ductile flexural failure to a brittle shear failure when the amount of
reinforcement was increased. Magnusson (2007) stated that a soft element responds by
deflecting more readily than the stiffer counterpart and the shear forces are thereby
limited. Hence, whereas a soft element fails by large deformations in flexure a stiff
element may fail in a brittle shear mode for the same load intensity. Consequently,
abrupt shear failures can be prevented by designing less stiff structural elements, which
thereby will respond in a ductile manner.
3.2. STRUCTURAL RESPONSE OF RC ELEMENTS TO BLAST LOADING
16
As it was discussed in section 3.1, structures subjected to blast loading experience
considerably higher strain rates compared to the situation with a static load. In such a
case, as the inertia effects and complex participation of vibration modes affect the
distribution and magnitude of internal forces, the resistance of structure is also
improved because of the strain rate effects on the materials’ strength. On the contrary,
this growth in the strength of materials will give rise to a stiffer element with a higher
flexural capacity, which may increase the probability of shear failure, Magnusson
(2007).
Several codes in the field of blast resistance design such as UFC (2008) and FKR
(2011), suggest that to be able to absorb a blast load the longitudinal reinforcement
ratio and its yield strength should be comparatively low. The structural elements
should be designed to allow for plastic deformations, thereby better utilising the energy
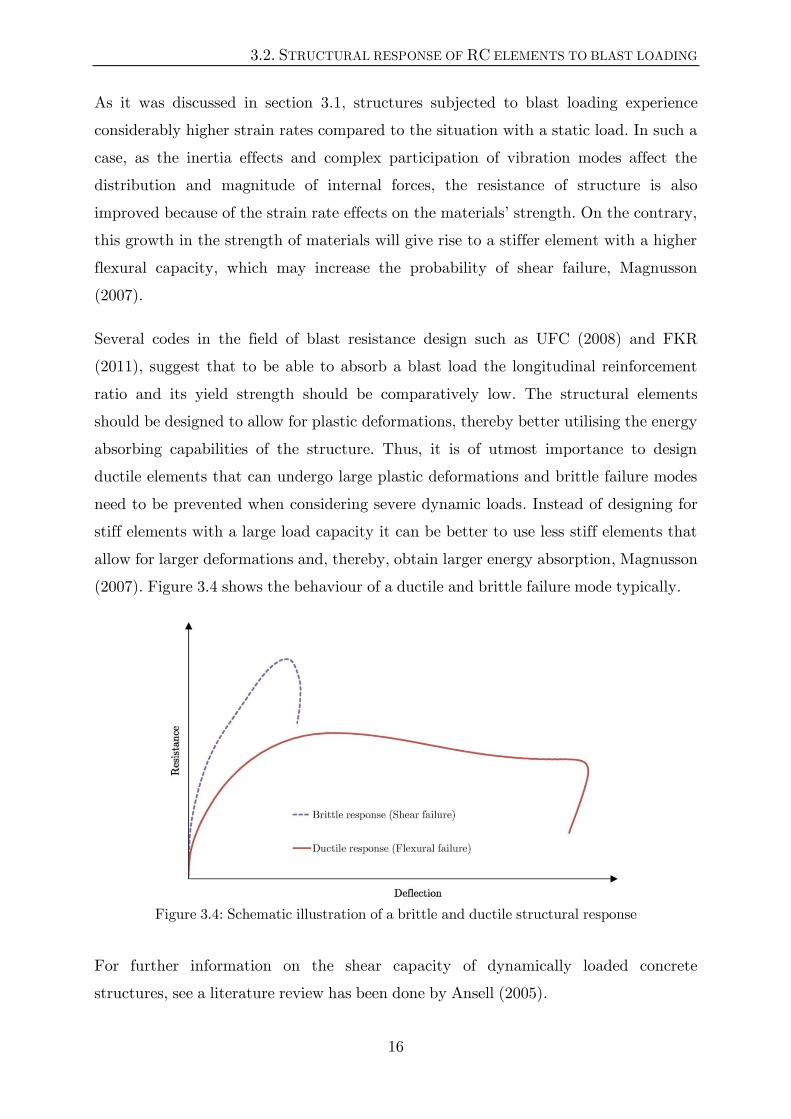
absorbing capabilities of the structure. Thus, it is of utmost importance to design
ductile elements that can undergo large plastic deformations and brittle failure modes
need to be prevented when considering severe dynamic loads. Instead of designing for
stiff elements with a large load capacity it can be better to use less stiff elements that
allow for larger deformations and, thereby, obtain larger energy absorption, Magnusson
(2007). Figure 3.4 shows the behaviour of a ductile and brittle failure mode typically.
Figure 3.4: Schematic illustration of a brittle and ductile structural response
For further information on the shear capacity of dynamically loaded concrete
structures, see a literature review has been done by Ansell (2005).
CHAPTER 3. STRUCTURAL BEHAVIOR, ANALYSIS AND DESIGN
17
3.3 Dynamic analysis
3.3.1 The single-degree-of-freedom (SDOF) analysis
Due to the complexity of theoretical study of the response of blast-loaded structures in
detail, some simplified methods are often used for practical design purposes. The
simple structures such as beams and slabs can be reduced to an equivalent single
degree of freedom (SDOF) system having similar behaviour as the real element, see
figure 3.5. The transformation factors, which are calculated based on a certain
deformed shape of target element, usually at its fundamental vibration mode, are used
to convert the analysed structure to an equivalent SDOF system.
In this section, a brief description about the main steps of this method and its
procedure is presented. A full discussion about the principals and background theory of
this method and extensive charts for predicting the response of blast loaded elements
are given by UFC (2008) and Biggs (1964).
Figure 3.5: Dynamically loaded beam idealized as a mass-spring system, Magnusson (2007)
According to UFC (2008), the transformation factors, which are used to convert a
uniformly loaded simply supported beam to an equivalent SDOF system, are shown in
table 3.1.
Table 3.1:Transformation factors for uniformly loaded simply supported beam, UFC(2008)
Range of Behaviour
Mass factor
Load factor
Resistance factor
Load-mass factor
Elastic 0.5 0.64 0.64 0.78
Plastic 0.33 0.5 0.5 0.66
Average 0.42 0.57 0.57 0.72
3.3. DYNAMIC ANALYSIS
18
According to the basic mechanics, the equivalent SDOF elastic stiffness of a simply
supported beam subjected to a uniformly distributed load can be calculated by eq.
(3.8)
( )
As a concrete beam responds to a dynamic load it deflects and progresses through
different stages before coming to rest. The beam stiffness varies considerably through
the different stages as schematically shown in Figure 3.6. State 1 represents the elastic
stage and state 2 represents a cracked beam, Magnusson (2007). UFC (2008) suggests
that an approximate expression of the flexural stiffness is used, which is based on the
average values of the uncracked and cracked sections as follows:
(
) ( )
Where is a factor that depends on amount and configuration of the reinforcement
and also the steel to concrete modulus of elasticity ratio, UFC (2008).
Figure 3.6: Schematic view of the reduction in stiffness at an increasing cracking of a reinforced concrete beam with a modified stiffness, from Magnusson (2007)
Thus, in the calculations the two states were substituted with a single modified
stiffness and the beam response was regarded as elastic up to deformations where the
plastic hinge forms. Since the system progresses through these different stages, the
response in each stage generally needs to be computed separately using the
transformation factors for each specific range, Magnusson (2007). However, Biggs
CHAPTER 3. STRUCTURAL BEHAVIOR, ANALYSIS AND DESIGN
19
(1964) suggests that if the response is expected to reach beyond the elastic range, an
average value of the transformation factors may be employed, see table 3.15.
The natural period and circular frequency of this equivalent SDOF system can be
calculated by
√
( )
The equation of motion of the equivalent SDOF undamped system subjected to an
applied force, ( ) is
( ) ( ) ( )
The closed solution of the equation of motion is possible only when the loading and the
resistance functions can be expressed in relatively simple mathematical terms, Biggs
(1964). In practical analysis, to consider the plastic deformations of the structure after
initial elastic response, the resistance function of the element can be simplified by an
elastic-perfectly plastic resistance function as shown in figure 3.7. As it was mentioned
in section 2.1, the air blast load on a structure can be approximated by a simple
triangle pulse load with reasonable accuracy, see Figure 3.7.
(a) (b)
Figure 3.7: (a) Simplified equivalent triangular load, (b) Linear elastic-perfectly plastic resistance function of SDOF system, from Magnusson (2007)
By using the simplified load and resistance functions as shown in figure 3.7, the eq.
(3.11) can be solved by using the Duhamel’s integral, Chopra (2007). Thus, the
3.3. DYNAMIC ANALYSIS
20
displacement time history of SDOF system up to the peak can be represents by
following equations.
The response in the elastic stage, ( ) is
( ( ))
( ( )
) ( )
The response in plastic range up to peak, ( ) is
( )
(
) ( )
( ) ( )
For practical design purposes, several diagrams have been developed for the maximum
response of SDOF systems subjected to different types of simple load functions and
with a bilinear elastic-perfectly plastic resistance function. One such chart is presented
in Figure 3.8 (Biggs, 1964). The ratio td/T and the internal resistance to applied load
ratio R1/P1 are sufficient for calculating the peak response.
For a simply supported beam, the ultimate static pressure load over the beam surface
is calculated based on ultimate moment capacity, , by eq. (3.14).
( )
The ultimate moment capacity can be calculated according to the corresponded design
code.
3.3.2 Dynamic reaction force
The parameters of the equivalent SDOF system were derived on the assumption that
the system has the same dynamic deflection as a certain point of the real element,
rather than the same force or stress characteristics, Biggs (1964). For this reason, the
dynamic reaction forces, which are calculated by the SDOF analysis, are not directly
comparable to those in the real structure and cannot be used for design purposes.
CHAPTER 3. STRUCTURAL BEHAVIOR, ANALYSIS AND DESIGN
21
Figure 3.8: Maximum response of elastic-perfectly plastic a SDOF system to a triangular load, from Biggs (1964)
Due to the importance of dynamic reaction forces in order to shear design of the
elements, estimation of the dynamic reaction forces may be obtained by considering
the dynamic equilibrium of the real element as shown in Figure 3.9 (Biggs, 1964). This
figure shows a simply supported beam subjected to a uniformly distributed dynamic
load. For a beam with evenly distributed mass the inertia has the same distribution as
the assumed deflected shape. When considering only half of the beam and taking the
moments about the resultant inertia force results in a relationship as follows (Biggs,
1964):
( ) ( ) ( ) ( )
As can be seen, the dynamic shear force is a function of both applied load and the
resistance of the beam. The constants and depend on the assumed deflected
shape of the beam, Biggs (1964).
3.3. DYNAMIC ANALYSIS
22
Figure 3.9: Determination of the dynamic support reactions for a simply supported beam
subjected to a uniformly distributed dynamic load, Biggs (1964)
3.3.3 Numerical simulations
Because of severe simplifications, the application of aforementioned simplified methods
is limited to dynamic analysis of simple structures such as beam and slabs. In addition,
only the maximum displacement time history of the critical point of analysed structure
can be obtained by this method without any information about the stress distribution
in the rest of structure. Because of the high dynamic conditions present in cases of
impulsive loading, the shear wave propagation, excitation of higher vibration modes
and geometry and inertia of the structure play important roles, Saatci and Vecchio
(2009). As these effects cannot be considered properly in the simplified methods, the
prediction of the maximum shear force at the supports may be very inaccurate for high
impulsive loads, Van Wees and Peters (1995) and Magnusson (2007).
In order to overcome the limitations of simplified methods and theoretically study the
detailed structural responses, advanced numerical methods, such as the finite element
analysis can be helpful. This permits for detailed analyses of failure modes and stiffness
degradation as well as time history of strains and stresses in different parts of an
element, see Magnusson and Hansson (2005), Saatci and Vecchio (2009). Although,
such an approach allows the analysis of structures with various geometries and
different dynamic load cases, numerical modelling of dynamic response of reinforced
concrete, in particular shear mechanism is still a challenging topic for researchers.
Furthermore, it also produces major difficulties for practical design purposes when the
size of modelling and computation time is considered.
In this research, a nonlinear explicit FE model has been implemented to evaluate the
load and deflection capacity of reinforced concrete beams under blast loading as well as

CHAPTER 3. STRUCTURAL BEHAVIOR, ANALYSIS AND DESIGN
23
their failure modes. For this purpose, the commercial FEM software,
ABAQUS/Explicit has been used, see chapter 4 and 5.
3.4 Design approaches for blast loaded RC beams
3.4.1 US-army design approach (UFC, 2008)
The concept of shear design approach suggested by UFC, (2008), is presented in this
section. The UFC’s approach considers the strain rate effects on the improved
resistance of the structure. The values of different DIF have been established for design
of members in the far design range is presented in table 3.2. As can be seen in this
table, the listed values of DIF for shear (diagonal tension and direct shear) and bond
are more conservative than for bending or compression. The reason is the need to
prevent brittle shear and bond failure due to account higher uncertainties in the design
process for shear and bond, UFC (2008).
Table 3.2: DIFs for design of RC members in the far design range, from UFC (2008)
Type of stress Reinforcement
Concrete Yield Ultimate
Bending 1.17 1.05 1.19
Diagonal tension 1.00 --- 1.00
Direct shear 1.10 1.00 1.10
Bond 1.17 1.05 1.00
Compression 1.10 --- 1.12
According to UFC (2008), the RC elements can be design for different levels of
damage. In this report, it is assumed that the concrete cover over the reinforcement of
the element remains intact after exposing to blast loading and equations corresponded
to this damage level are presented.
Ultimate moment capacity
The design static moment-absorbing capacity for a beam with only tensile
reinforcement is calculated as
3.4. DESIGN APPROACHES FOR BLAST LOADED RC BEAMS
24
(
) ( )
Ultimate equivalent static load carrying capacity of a simply supported beam is
determined according to eq. (3.14)
In this approach, the longitudinal reinforcement ratio must be limited to maximum
of 75 percent of balanced reinforcement ratio in order to avoid
the concrete crushing before the full development of plastic deformations.
Design reaction force
UFC (2008) suggests that the support shears can be reasonably estimated by
neglecting the applied load for short duration blast loads. Therefore, the ultimate
design reaction force can be assumed to be developed when the resistance reaches the
ultimate value. The maximum total reaction force of a blast-loaded beam can be
calculated based on eq. (3.17):
( )
where L and b are the length and width of a beam. is the equivalent static load.
The design reaction force at each support for a simply supported beam can be
calculated as
( )
Design value of shear force
Design value of shear force is assumed to act at distance from the support (due to the
arch effect) and calculated by eq. (3.19)
(
) ( )
Concrete shear capacity
The shear capacity of unreinforced concrete section, is determined as below
( √ ) √ ( )
CHAPTER 3. STRUCTURAL BEHAVIOR, ANALYSIS AND DESIGN
25
Shear reinforcement
If the shear force capacity is not sufficient, i.e. according to equations (3.19)
and (3.20), the shear reinforcement design is necessary. The required vertical shear
reinforcement ratio can then be calculated as
( )
where
( )
The maximum distance between shear reinforcements may not exceed 0.5d.
Reaction force capacity
Based on the dimensions of the concrete section and configuration of the existence
shear reinforcement, the maximum reaction force capacity of the element can be
calculated by combining the eqs. (3.18), (3.19) and (3.22).
(
) ( )
3.4.2 Swedish design approach (FKR, 2011)
In this section, the concepts of shear force design approach suggested by the Swedish
fortification Agency, Fortfikationsverket, (2011), is presented. In this approach, after
design of the element for flexural effect, the shear force capacity should be checked. In
this report only the, details of shear design approach is presented. The strain rate
effects are not considered in this approach.
Ultimate static load capacity
The design static moment-absorbing capacity is calculated as
( )
Equivalent static load carrying capacity of a simply supported beam is determined
according to eq. (3.14)
3.4. DESIGN APPROACHES FOR BLAST LOADED RC BEAMS
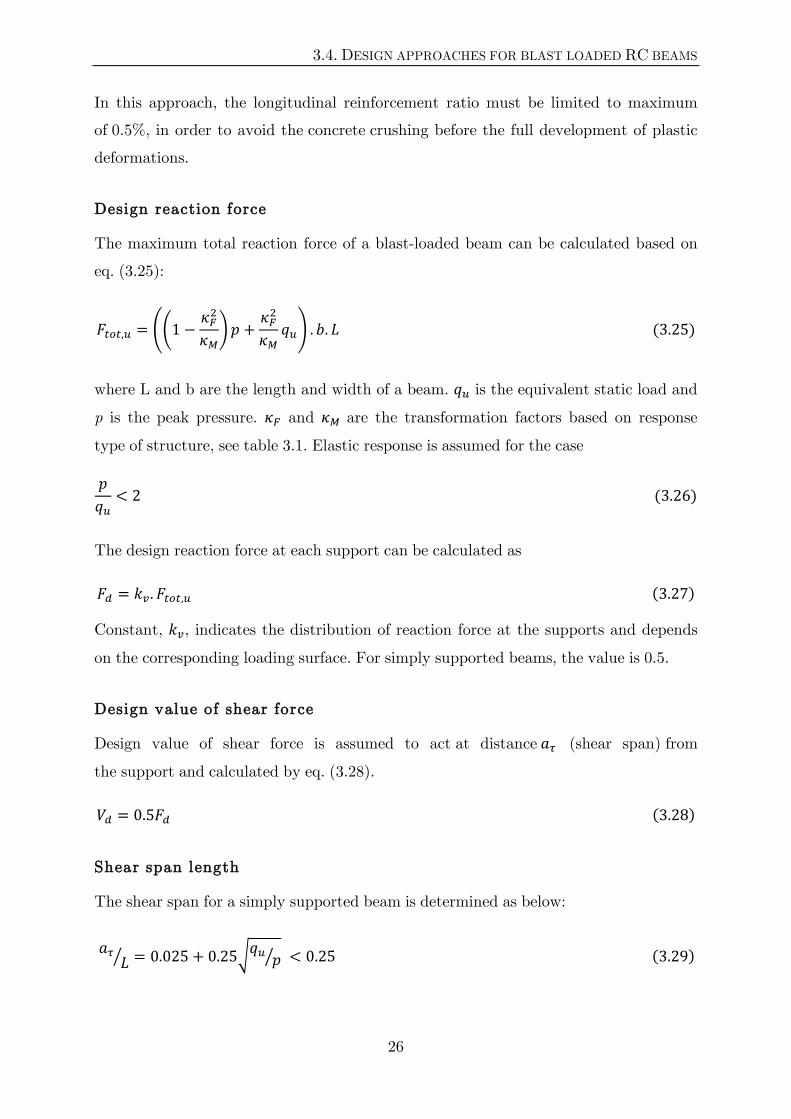
26
In this approach, the longitudinal reinforcement ratio must be limited to maximum
of 0.5%, in order to avoid the concrete crushing before the full development of plastic
deformations.
Design reaction force
The maximum total reaction force of a blast-loaded beam can be calculated based on
eq. (3.25):
((
)
) ( )
where L and b are the length and width of a beam. is the equivalent static load and
p is the peak pressure. and are the transformation factors based on response
type of structure, see table 3.1. Elastic response is assumed for the case
( )
The design reaction force at each support can be calculated as
( )
Constant, , indicates the distribution of reaction force at the supports and depends
on the corresponding loading surface. For simply supported beams, the value is 0.5.
Design value of shear force
Design value of shear force is assumed to act at distance (shear span) from
the support and calculated by eq. (3.28).
( )
Shear span length
The shear span for a simply supported beam is determined as below:
⁄ √ ⁄ ( )
CHAPTER 3. STRUCTURAL BEHAVIOR, ANALYSIS AND DESIGN
27
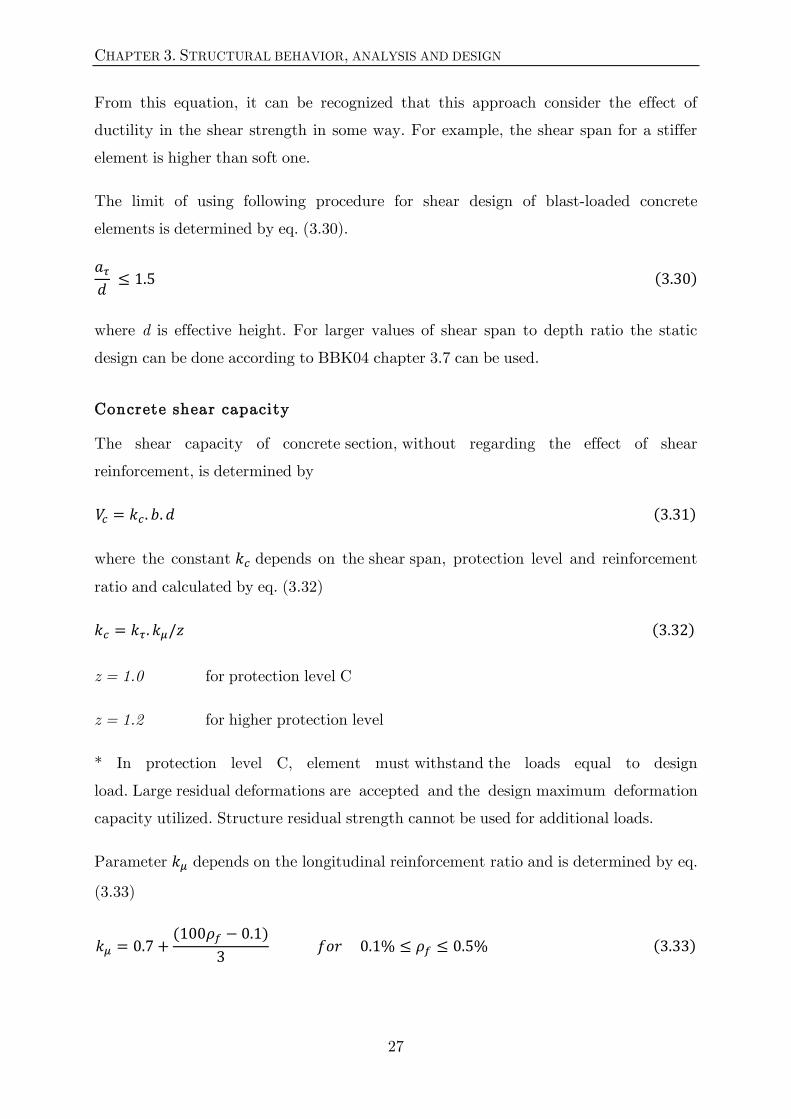
From this equation, it can be recognized that this approach consider the effect of
ductility in the shear strength in some way. For example, the shear span for a stiffer
element is higher than soft one.
The limit of using following procedure for shear design of blast-loaded concrete
elements is determined by eq. (3.30).
( )
where d is effective height. For larger values of shear span to depth ratio the static
design can be done according to BBK04 chapter 3.7 can be used.
Concrete shear capacity
The shear capacity of concrete section, without regarding the effect of shear
reinforcement, is determined by
( )
where the constant depends on the shear span, protection level and reinforcement
ratio and calculated by eq. (3.32)
( )
z = 1.0 for protection level C
z = 1.2 for higher protection level
* In protection level C, element must withstand the loads equal to design
load. Large residual deformations are accepted and the design maximum deformation
capacity utilized. Structure residual strength cannot be used for additional loads.
Parameter depends on the longitudinal reinforcement ratio and is determined by eq.
(3.33)
( )
( )
3.4. DESIGN APPROACHES FOR BLAST LOADED RC BEAMS
28
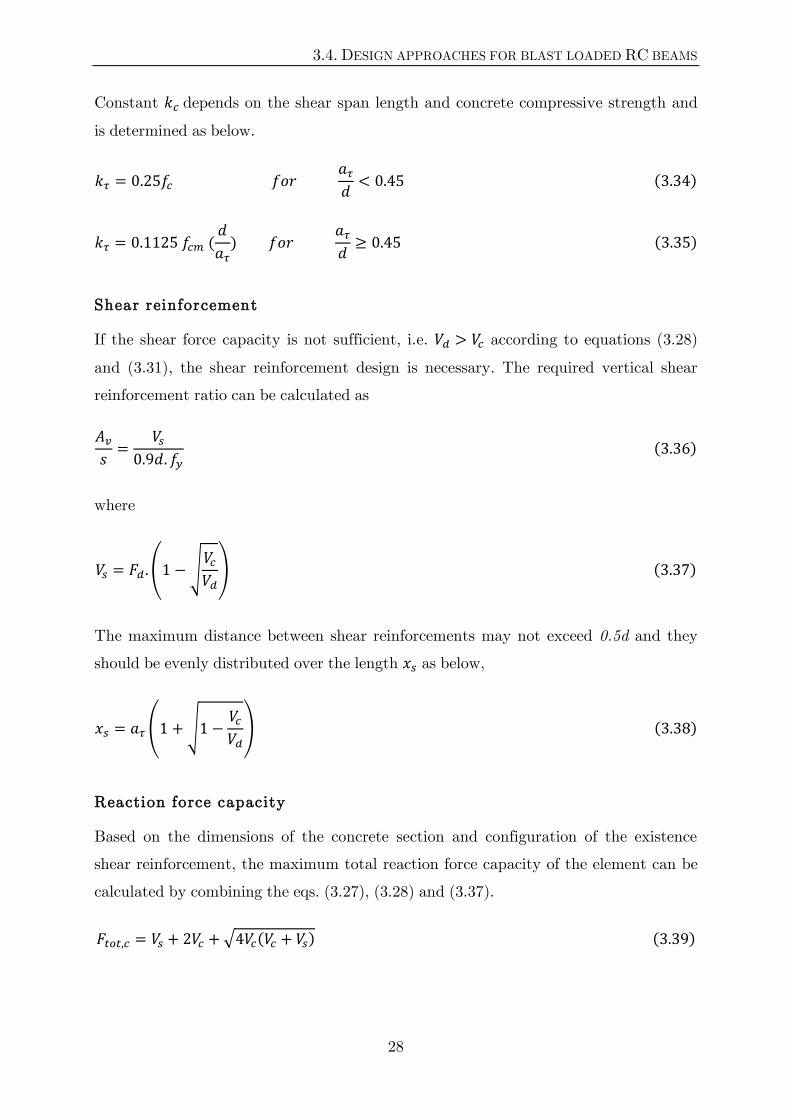
Constant depends on the shear span length and concrete compressive strength and
is determined as below.
( )
(
)
( )
Shear reinforcement
If the shear force capacity is not sufficient, i.e. according to equations (3.28)
and (3.31), the shear reinforcement design is necessary. The required vertical shear
reinforcement ratio can be calculated as
( )
where
( √
) ( )
The maximum distance between shear reinforcements may not exceed 0.5d and they
should be evenly distributed over the length as below,
( √
) ( )
Reaction force capacity
Based on the dimensions of the concrete section and configuration of the existence
shear reinforcement, the maximum total reaction force capacity of the element can be
calculated by combining the eqs. (3.27), (3.28) and (3.37).
√ ( ) ( )
CHAPTER 3. STRUCTURAL BEHAVIOR, ANALYSIS AND DESIGN
29
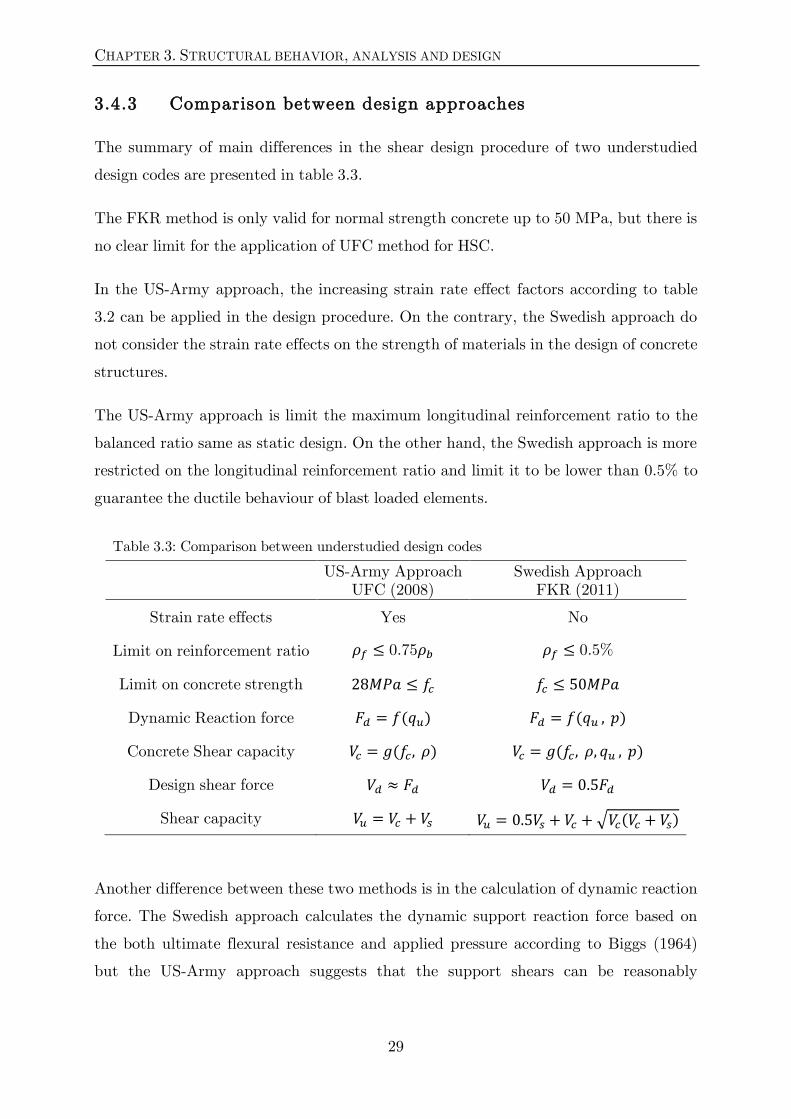
3.4.3 Comparison between design approaches
The summary of main differences in the shear design procedure of two understudied
design codes are presented in table 3.3.
The FKR method is only valid for normal strength concrete up to 50 MPa, but there is
no clear limit for the application of UFC method for HSC.
In the US-Army approach, the increasing strain rate effect factors according to table
3.2 can be applied in the design procedure. On the contrary, the Swedish approach do
not consider the strain rate effects on the strength of materials in the design of concrete
structures.
The US-Army approach is limit the maximum longitudinal reinforcement ratio to the
balanced ratio same as static design. On the other hand, the Swedish approach is more
restricted on the longitudinal reinforcement ratio and limit it to be lower than 0.5% to
guarantee the ductile behaviour of blast loaded elements.
Table 3.3: Comparison between understudied design codes
US-Army Approach
UFC (2008) Swedish Approach
FKR (2011)
Strain rate effects Yes No
Limit on reinforcement ratio 0.75 0.5%
Limit on concrete strength
Dynamic Reaction force ( ) ( )
Concrete Shear capacity ( ) ( )
Design shear force
Shear capacity √ ( )
Another difference between these two methods is in the calculation of dynamic reaction
force. The Swedish approach calculates the dynamic support reaction force based on
the both ultimate flexural resistance and applied pressure according to Biggs (1964)
but the US-Army approach suggests that the support shears can be reasonably
3.4. DESIGN APPROACHES FOR BLAST LOADED RC BEAMS
30
estimated by neglecting the applied load and only considering the ultimate flexural
resistance.
The shear capacity calculation of blast loaded elements in UFC method is similar to
quasi-static loaded structures. As can be seen in table 3.3 and section 3.4.2, this
method uses similar formula as static design for calculation of concrete shear capacity
and also simple addition method for calculation of ultimate shear capacity of member..
On the contrary, according to the section 3.4.1 and table 3.3, the FKR method
somehow consider the ultimate flexural resistance of element and ductility in the shear
design procedure and
In UFC method same as static design approach, the design shear force is calculated at
distance d from the support but in FKR approach, the design shear force is calculated
at distance that depends on the size of applied load, flexural stiffness and span length.
31
Chapter 4
FE Modelling of Dynamic Behaviour of Reinforced Concrete
In this research, the numerical simulations to study the structural response of blast
loaded RC beams and their failure mode have been performed by the FE-code
ABAQUS/Explicit version 6.11, which is suitable for high-speed dynamic events and
strong discontinuous geometrical or material responses, see Hibbitt et al. (2011). The
concrete damaged plasticity (CDP) and Johnson-Cook plasticity (J&C) material
models have been used to define the dynamic behaviour of concrete and reinforcing
steel respectively.
In this chapter, a brief description about the basics of selected constitutive material
models and their implementations is presented, followed by short explanation about
important features of explicit dynamic analysis. This chapter is intended for readers
familiar with the non-linear behaviour of concrete and also dynamic analysis. The
detailed description of material models and their background theory will not be given,
see Bangash (2001), Chen (1982), Chen and Han (1995), Karihaloo (2003) and Malm
(2006, 2009).
Unlike steel, concrete has different uniaxial behaviours in tension and compression and,
even at the static condition; there is still a great level of uncertainty associated with
material modelling of the uniaxial behaviours of concrete. Since the concrete properties
significantly affects the results of the numerical simulations, at the
4.1. UNIAXIAL BEHAVIOUR OF PLAIN CONCRETE
32
beginning of this chapter, some. recommendations for evaluating the concrete
properties and also appropriate uniaxial models of plain concrete is presented.
4.1 Uniaxial behaviour of plain concrete
As the uniaxial behaviour of material models defines the evolution of the yield criterion
in a FE-analysis, the definition of material parameters and uniaxial material behaviour
curves becomes more important. Although, the uniaxial behaviour of plain concrete is
associated with a great degree of uncertainty, there are some recommendations such as
expressions in MC90 (1993) for evaluation of the concrete parameters based on the
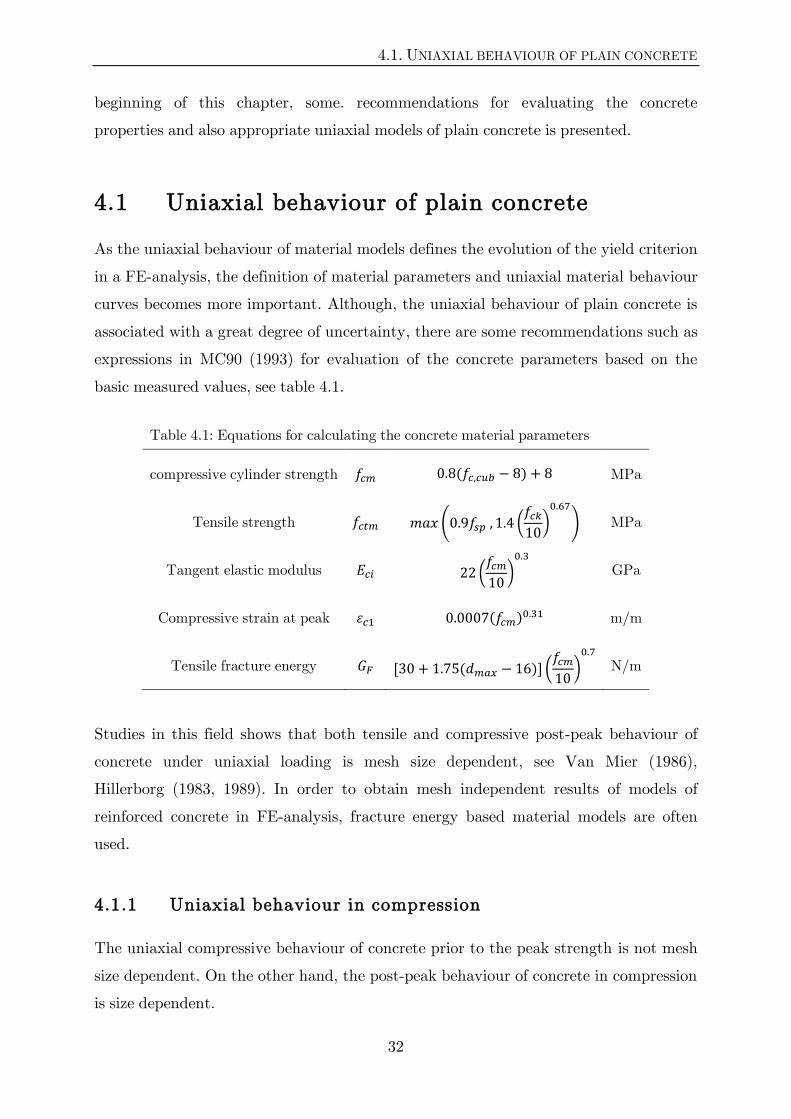
basic measured values, see table 4.1.
Table 4.1: Equations for calculating the concrete material parameters
compressive cylinder strength ( ) MPa
Tensile strength ( (
)
) MPa
Tangent elastic modulus (
)
GPa
Compressive strain at peak ( ) m/m
Tensile fracture energy ( ) (
)
N/m
Studies in this field shows that both tensile and compressive post-peak behaviour of
concrete under uniaxial loading is mesh size dependent, see Van Mier (1986),
Hillerborg (1983, 1989). In order to obtain mesh independent results of models of
reinforced concrete in FE-analysis, fracture energy based material models are often
used.
4.1.1 Uniaxial behaviour in compression
The uniaxial compressive behaviour of concrete prior to the peak strength is not mesh
size dependent. On the other hand, the post-peak behaviour of concrete in compression
is size dependent.

CHAPTER 4. FE MODELING OF DYNAMIC BEHAVIOR OF REINFORCED CONCRETE
33
Compression model before peak stress
The formula suggested by both MC90 (1993) and EC2 (2007) has been implemented
for the ascending branch of the concrete stress-strain law in compression, see fig. 4.1.
( )
(
)
(
)
( )
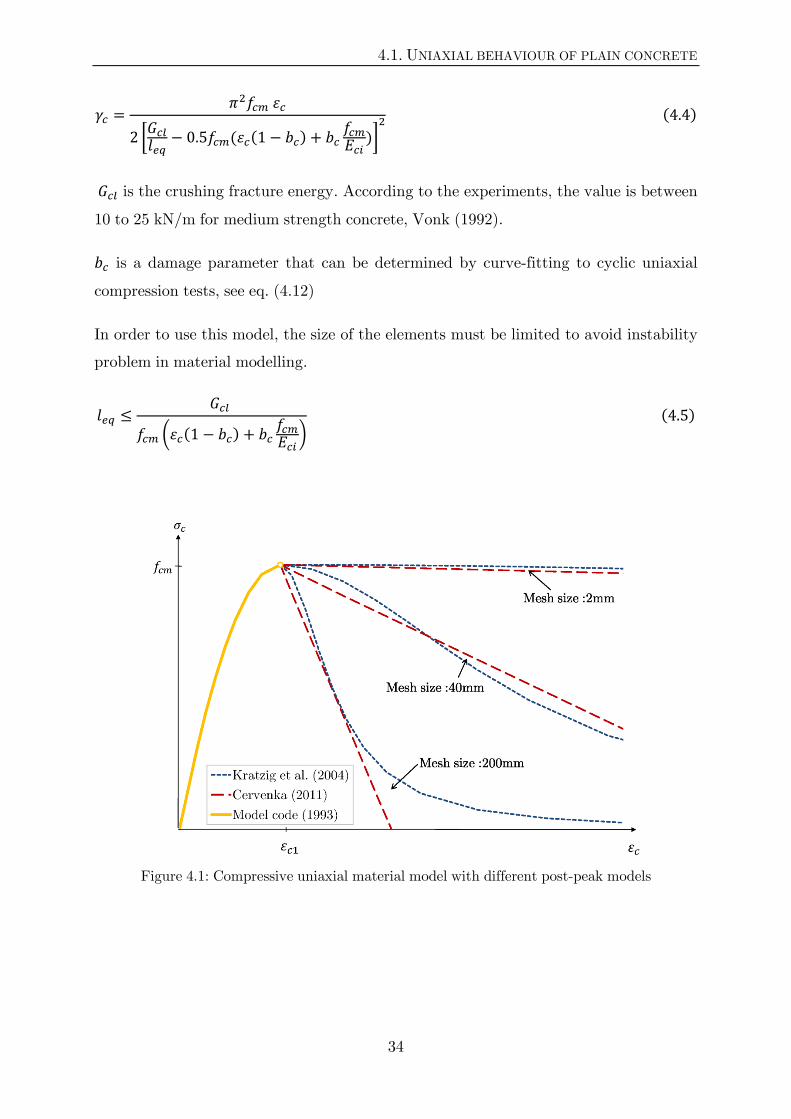
Post-peak compression model by Cervenka (2011)
In this model, the softening law in compression is linearly descending and can be
represents by eq. (4.2). The end point of the softening curve is defined by means of the
plastic displacement . In this way, the energy needed for generation of a unit area of
the failure plane is indirectly defined. From the experiments of Van Mier (1986), the
value of =0.5mm can be used for normal concrete. This model is used in the
commercial FE-code, ATENA for nonlinear analysis of concrete structures, see fig 4.1.
( ) (
( )) ( )
where is the characteristic length of the respective FE integration point and
depends on element geometry and formulation, see Feenstra and de Borst (1995).
Post-peak compression model based on Kratzig and Polling (2004)
Kratzig and Polling (2004) recommended a softening law in compression base on the
fracture energy same as the available models for tension, see eq. (4.3). This model is
not simple and practical as eq. (4.2) and contains more parameters but represents
better fitting with experimental results. However, the uncertainty associated to some
of the parameters must be reduced by using experimental investigations.
( ) (
)
( )
The parameter , controls the size dependency and defined as
4.1. UNIAXIAL BEHAVIOUR OF PLAIN CONCRETE
34
[
( ( )
)] ( )
is the crushing fracture energy. According to the experiments, the value is between
10 to 25 kN/m for medium strength concrete, Vonk (1992).
is a damage parameter that can be determined by curve-fitting to cyclic uniaxial
compression tests, see eq. (4.12)
In order to use this model, the size of the elements must be limited to avoid instability
problem in material modelling.
( ( )
) ( )
Figure 4.1: Compressive uniaxial material model with different post-peak models
CHAPTER 4. FE MODELING OF DYNAMIC BEHAVIOR OF REINFORCED CONCRETE
35
4.1.2 Uniaxial behaviour in tension
Tension model before cracking
The behaviour of concrete in tension without cracks is assumed linear elastic and can
be defined only by initial elastic modulus and peak tensile stress. The uniaxial tensile
behaviour of concrete prior to the peak stress is not dependent to the mesh size.
Tension softening models after cracking
The post-peak tension softening of concrete is very sensitive to the element size,
Hillerborg (1983). According to Hibbitt et. al (2011) and Cervenka et. al (2011), in FE
models that do not contain reinforcement in significant regions, the approach based on
the stress-strain relationship will introduce unreasonable mesh sensitivity in the
results. For such cases, same as the current research, it is recommended to define the
tension softening law as a stress-crack opening displacement curve.
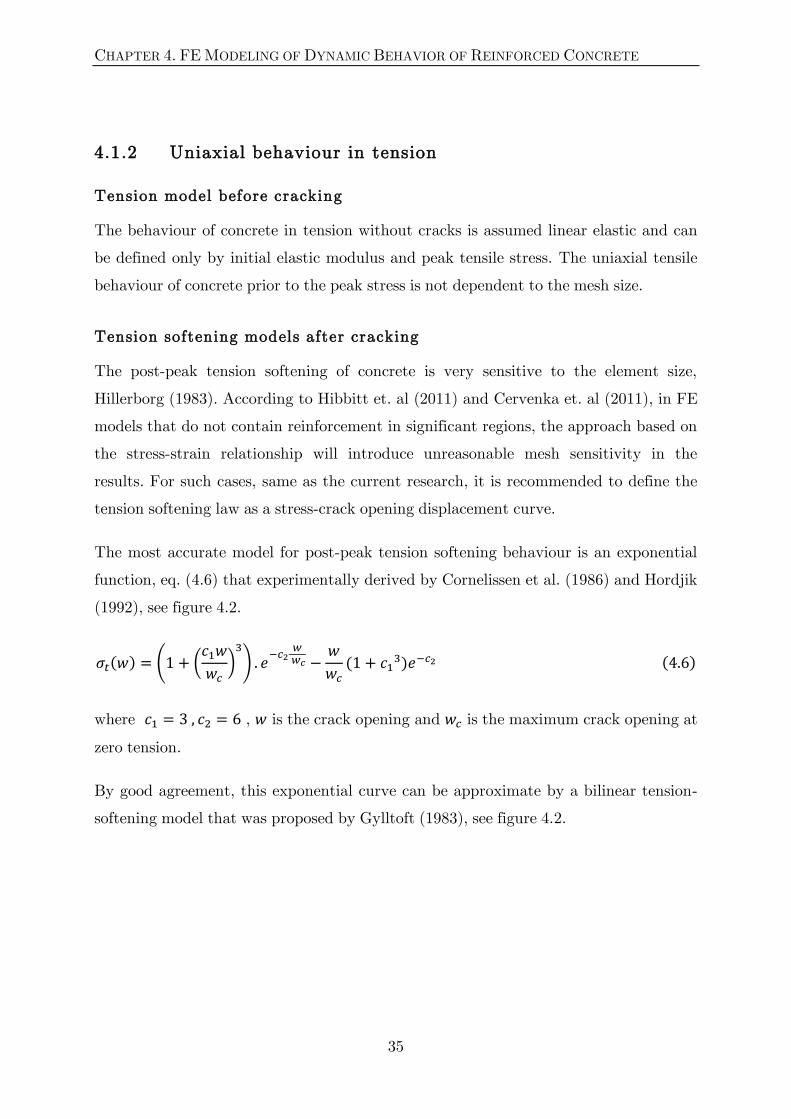
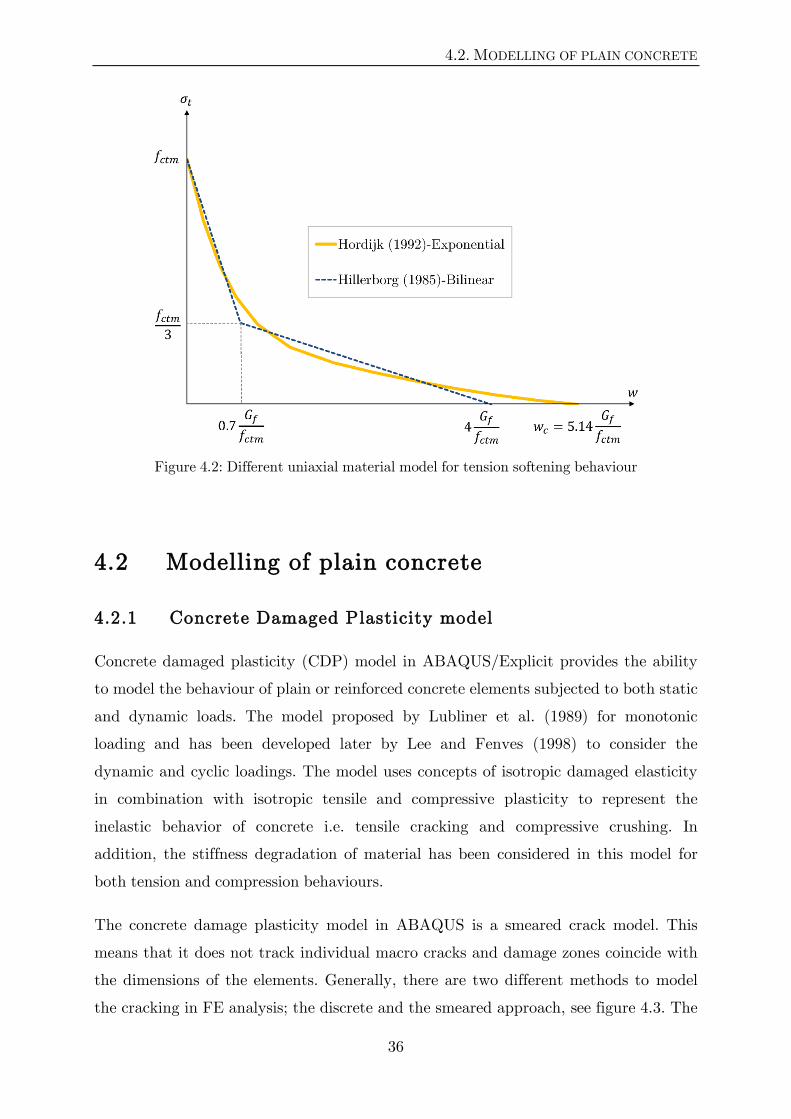
The most accurate model for post-peak tension softening behaviour is an exponential
function, eq. (4.6) that experimentally derived by Cornelissen et al. (1986) and Hordjik
(1992), see figure 4.2.
( ) ( (
)
)
(
) ( )
where , is the crack opening and is the maximum crack opening at
zero tension.
By good agreement, this exponential curve can be approximate by a bilinear tension-
softening model that was proposed by Gylltoft (1983), see figure 4.2.
4.2. MODELLING OF PLAIN CONCRETE
36
Figure 4.2: Different uniaxial material model for tension softening behaviour
4.2 Modelling of plain concrete
4.2.1 Concrete Damaged Plasticity model
Concrete damaged plasticity (CDP) model in ABAQUS/Explicit provides the ability
to model the behaviour of plain or reinforced concrete elements subjected to both static
and dynamic loads. The model proposed by Lubliner et al. (1989) for monotonic
loading and has been developed later by Lee and Fenves (1998) to consider the
dynamic and cyclic loadings. The model uses concepts of isotropic damaged elasticity
in combination with isotropic tensile and compressive plasticity to represent the
inelastic behavior of concrete i.e. tensile cracking and compressive crushing. In
addition, the stiffness degradation of material has been considered in this model for
both tension and compression behaviours.
The concrete damage plasticity model in ABAQUS is a smeared crack model. This
means that it does not track individual macro cracks and damage zones coincide with
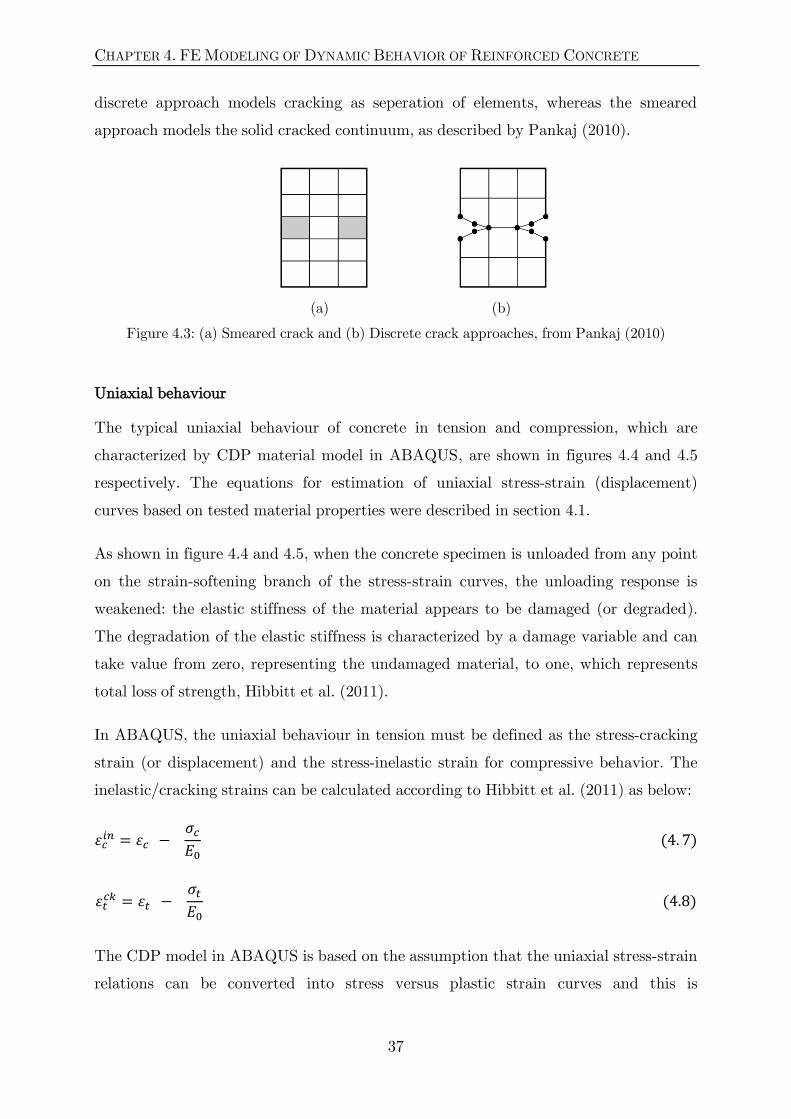
the dimensions of the elements. Generally, there are two different methods to model
the cracking in FE analysis; the discrete and the smeared approach, see figure 4.3. The
CHAPTER 4. FE MODELING OF DYNAMIC BEHAVIOR OF REINFORCED CONCRETE
37
discrete approach models cracking as seperation of elements, whereas the smeared
approach models the solid cracked continuum, as described by Pankaj (2010).
(a) (b)
Figure 4.3: (a) Smeared crack and (b) Discrete crack approaches, from Pankaj (2010)
Uniaxial behaviour
The typical uniaxial behaviour of concrete in tension and compression, which are
characterized by CDP material model in ABAQUS, are shown in figures 4.4 and 4.5
respectively. The equations for estimation of uniaxial stress-strain (displacement)
curves based on tested material properties were described in section 4.1.
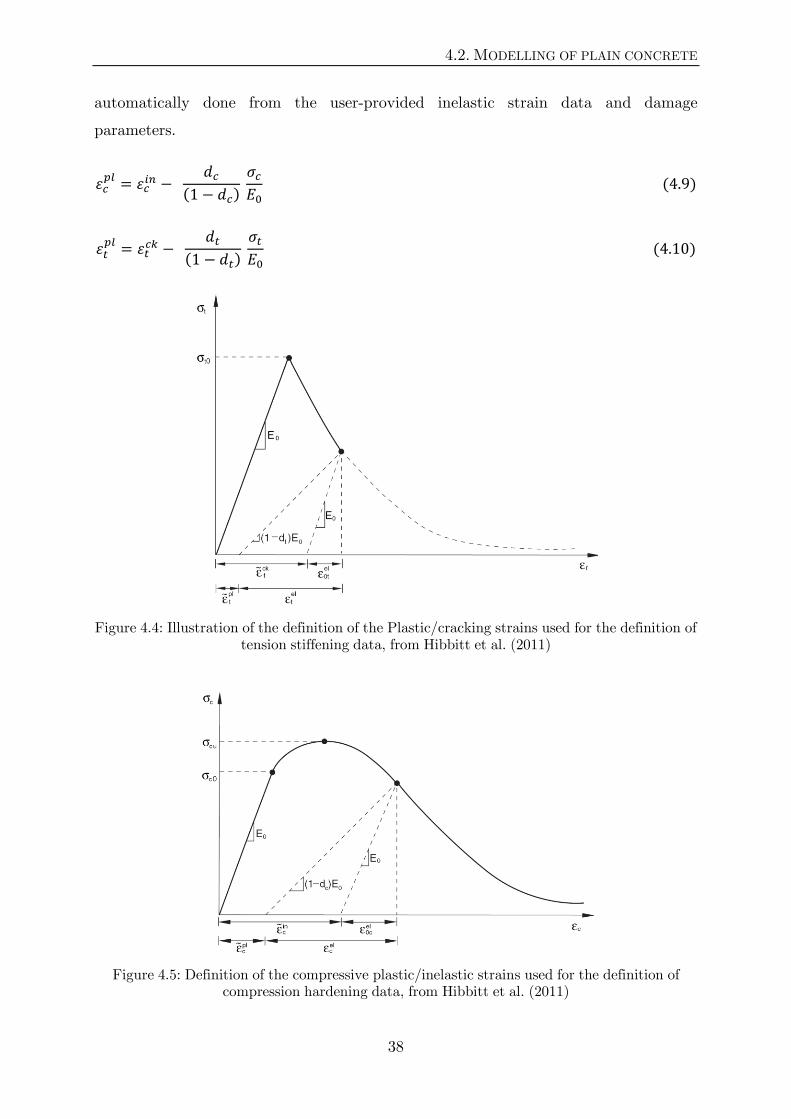
As shown in figure 4.4 and 4.5, when the concrete specimen is unloaded from any point
on the strain-softening branch of the stress-strain curves, the unloading response is
weakened: the elastic stiffness of the material appears to be damaged (or degraded).
The degradation of the elastic stiffness is characterized by a damage variable and can
take value from zero, representing the undamaged material, to one, which represents
total loss of strength, Hibbitt et al. (2011).
In ABAQUS, the uniaxial behaviour in tension must be defined as the stress-cracking
strain (or displacement) and the stress-inelastic strain for compressive behavior. The
inelastic/cracking strains can be calculated according to Hibbitt et al. (2011) as below:
( )
( )
The CDP model in ABAQUS is based on the assumption that the uniaxial stress-strain
relations can be converted into stress versus plastic strain curves and this is
4.2. MODELLING OF PLAIN CONCRETE
38
automatically done from the user-provided inelastic strain data and damage
parameters.
( )
( )
( )
( )
Figure 4.4: Illustration of the definition of the Plastic/cracking strains used for the definition of tension stiffening data, from Hibbitt et al. (2011)
Figure 4.5: Definition of the compressive plastic/inelastic strains used for the definition of compression hardening data, from Hibbitt et al. (2011)
CHAPTER 4. FE MODELING OF DYNAMIC BEHAVIOR OF REINFORCED CONCRETE
39
Damage evolution parameters and stiffness recovery
The stiffness degradation of concrete under dynamic loadings is taken into account by
defining two scalar parameters; tensile damage parameter, dt, and compressive damage
parameter, dc, according to figure 4.4 and 4.5. Eqs. (4.11) to (4.14) can be used to
calculate the variation of damage parameters versus inelastic/cracking strains (or
displacements) as below:
( ) ( )
( )
( ) ( )
( )
The factors bc and bt that represents the relation between plastic and inelastic strains
can be determined based on result of curve-fitting of cyclic tests, Sinha et al. (1964). In
the present simulations, the value bc=bt=0.7 is used.
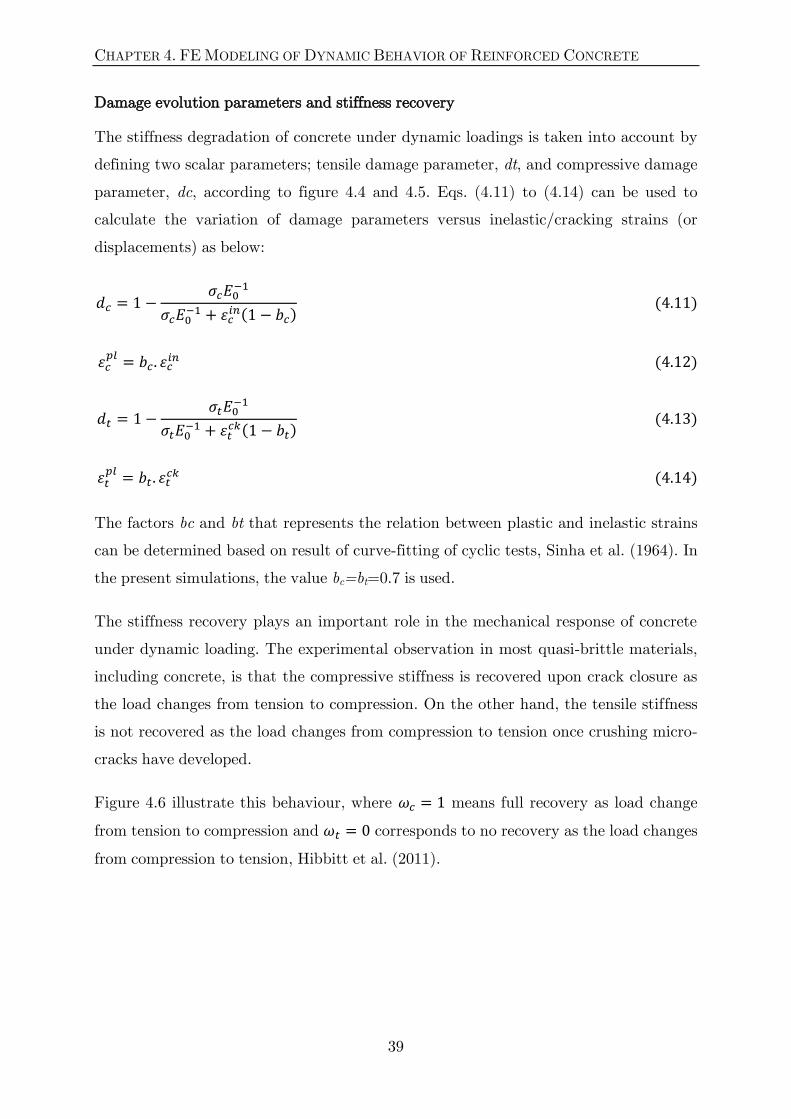
The stiffness recovery plays an important role in the mechanical response of concrete
under dynamic loading. The experimental observation in most quasi-brittle materials,
including concrete, is that the compressive stiffness is recovered upon crack closure as
the load changes from tension to compression. On the other hand, the tensile stiffness
is not recovered as the load changes from compression to tension once crushing micro-
cracks have developed.
Figure 4.6 illustrate this behaviour, where means full recovery as load change
from tension to compression and corresponds to no recovery as the load changes
from compression to tension, Hibbitt et al. (2011).
4.2. MODELLING OF PLAIN CONCRETE
40
Figure 4.6: Uniaxial load cycle (tension-compression-tension) assuming default values for the stiffness recovery factors , . from Hibbitt et al. (2011)
Yield Surface Definition
A Drucker-Prager criterion based yield function is implemented in the CDP model.
This function was developed by Lubliner et. al. (1989), with the modifications
proposed by Lee and Fenves (1998) and makes it possible to determine failure both by
normal and shear stress. It is a pressure dependent criterion based on the two stress
invariants of the effective stress tensor; the hydrostatic pressure, , and the Mises
equivalent stress, . Eq. (4.15) represents the implemented yield function in terms of
effective stresses, Hibbitt et al. (2011)
( ( ) ⟨ ⟩ ⟨ ⟩) (
) ( )
with
(
)
(
)
( )
(
)
( )
( ) ( ) ( )
CHAPTER 4. FE MODELING OF DYNAMIC BEHAVIOR OF REINFORCED CONCRETE
41
( )
( )
In this,
is the maximum principal effective stress; ⁄ is the user specified ratio of the
equibiaxial compressive yield stress to the uniaxial compressive yield stress, which per
default is set to 1.16. The expression 4.15, show that that the evolution of the yield
surface is controlled by the hardening variables
and
according to eq. 4.9 and
4.10.
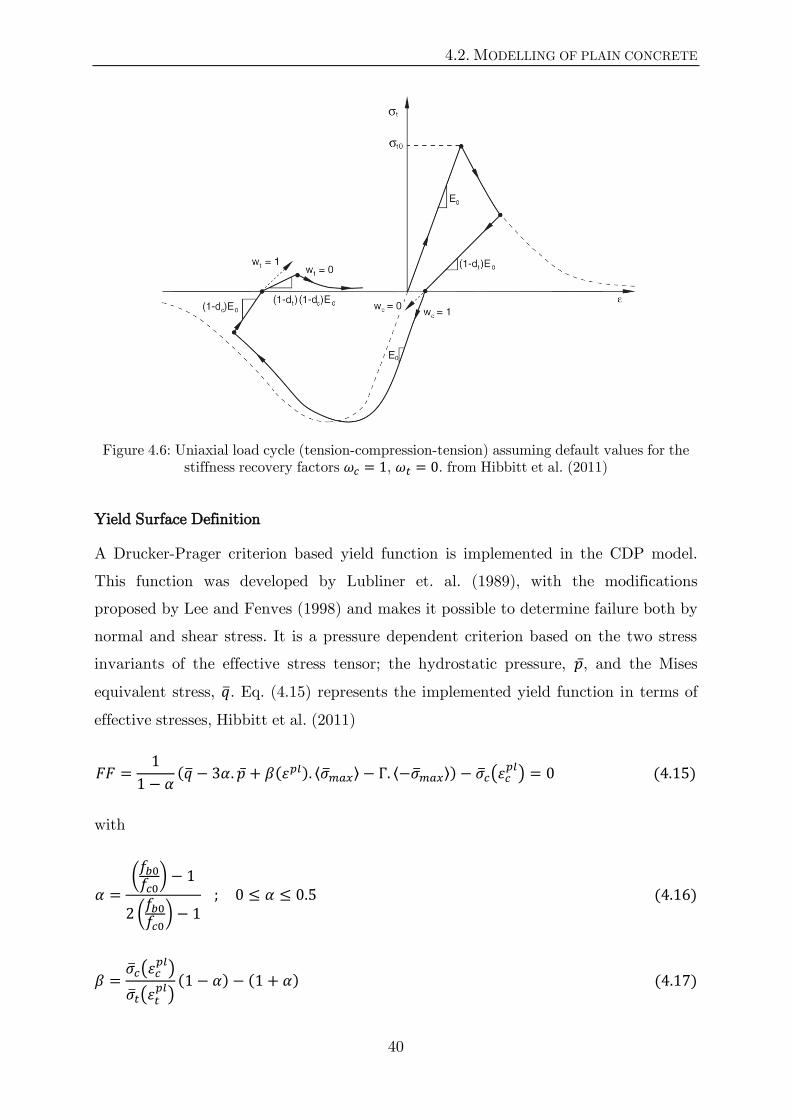
is a user defined parameter that depends on the stress invariants. It must be fulfilled
that and the factor is per default 2/3, making the yield criterion
approach Rankine’s formulation, Pankaj (2010). The difference of the yield surfaces in
the deviatoric plane for and is shown in Figure 4.7(a). For
comparison, the Rankine criterion is usually triangular whereas the Drucker-Prager
criterion is circular in the deviatoric plane.
(a) (b)
Figure 4.7: (a) Drucker-Prager yield criteria in the deviatoric plane for different Kc, Hibbitt et al. (2011) and (b) Yield surface in 3D for Pankaj (2010).
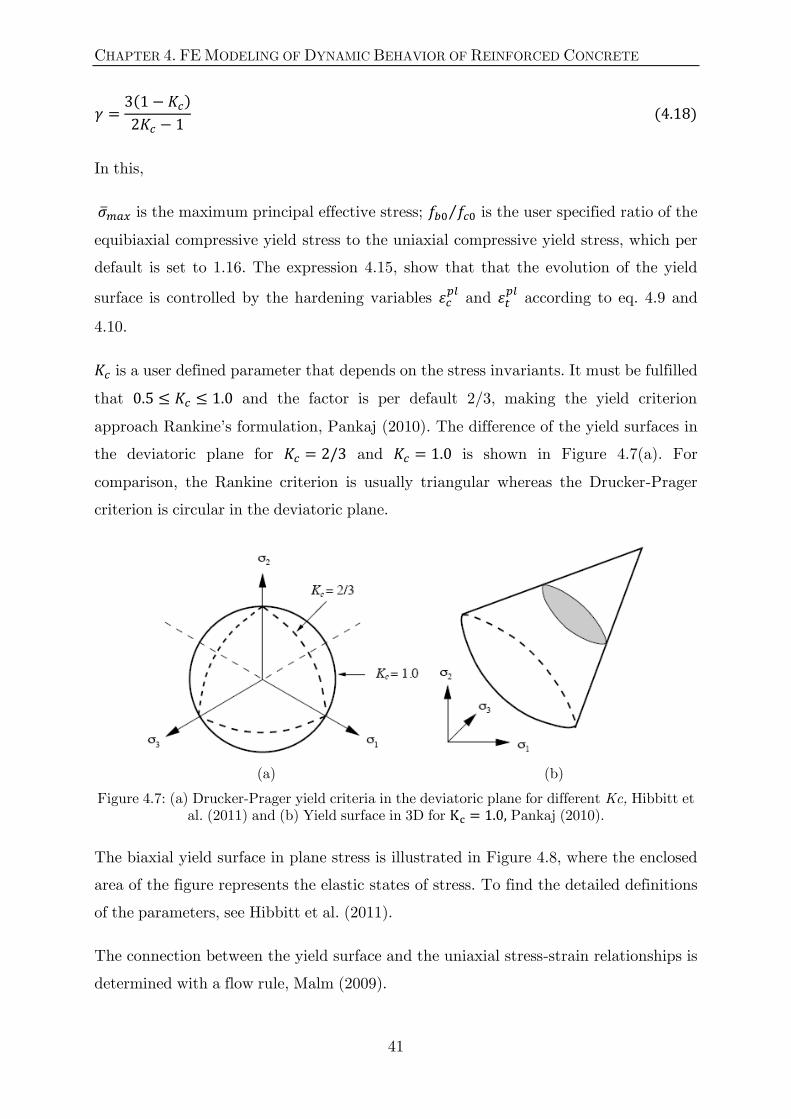
The biaxial yield surface in plane stress is illustrated in Figure 4.8, where the enclosed
area of the figure represents the elastic states of stress. To find the detailed definitions
of the parameters, see Hibbitt et al. (2011).
The connection between the yield surface and the uniaxial stress-strain relationships is
determined with a flow rule, Malm (2009).
4.2. MODELLING OF PLAIN CONCRETE
42
Figure 4.8: Yield surface in plane stress, from Hibbitt et al. (2011)
Plastic flow rule
In CDP model, the Drucker-Prager hyperbolic plastic potential function is used as
illustrated in figure 4.9 and equation 4.19.
( ) √( ) ( )
where is the uniaxial tensile stress at failure taken from user defined tension
stiffening data, see section 4.1.2.
is the dilation angle measured in the p-q plane at high confining pressure. This
parameter controls the amount of plastic volumetric strain developed during plastic
shearing and is assumed constant during plastic yielding. Typically, the dilation angle
value is selected between and , Malm (2009). The effects of dilation angle size
on the results are presented in the section 5.2.5.
is the eccentricity parameter, that defines the rate at which the function approaches
the asymptote (the flow potential tends to a straight line as the eccentricity tends to
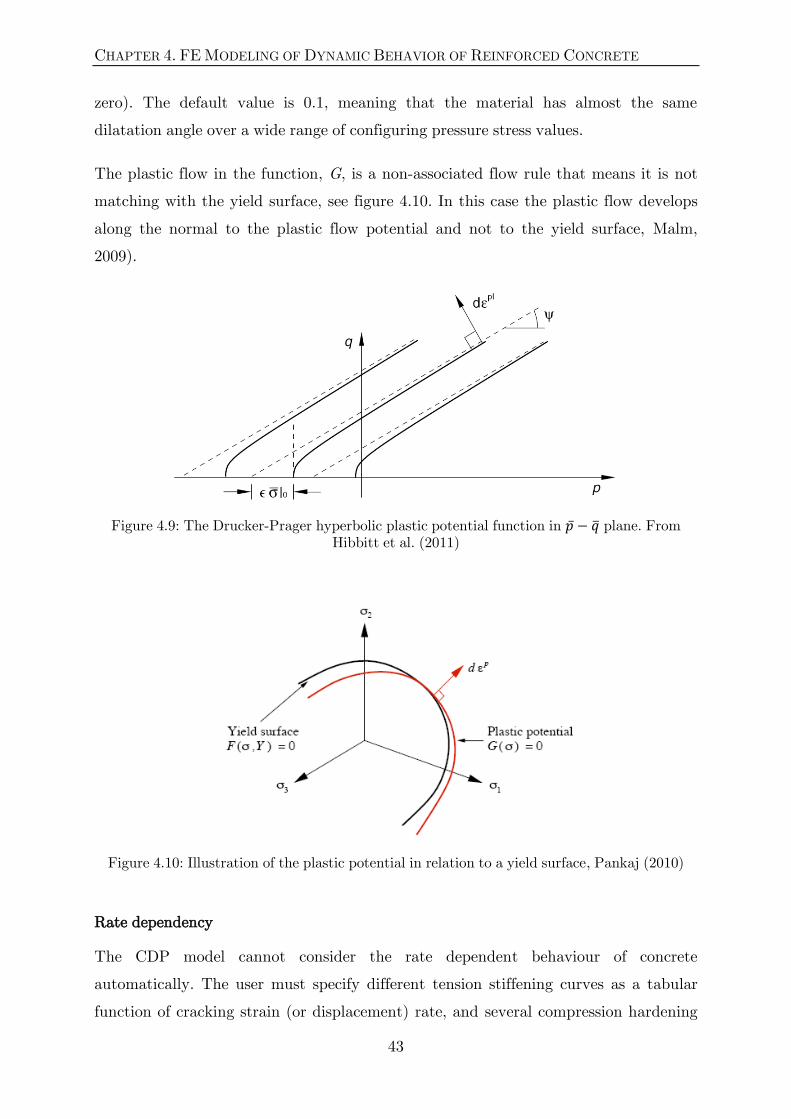
CHAPTER 4. FE MODELING OF DYNAMIC BEHAVIOR OF REINFORCED CONCRETE
43
zero). The default value is 0.1, meaning that the material has almost the same
dilatation angle over a wide range of configuring pressure stress values.
The plastic flow in the function, G, is a non-associated flow rule that means it is not
matching with the yield surface, see figure 4.10. In this case the plastic flow develops
along the normal to the plastic flow potential and not to the yield surface, Malm,
2009).
Figure 4.9: The Drucker-Prager hyperbolic plastic potential function in plane. From Hibbitt et al. (2011)
Figure 4.10: Illustration of the plastic potential in relation to a yield surface, Pankaj (2010)
Rate dependency
The CDP model cannot consider the rate dependent behaviour of concrete
automatically. The user must specify different tension stiffening curves as a tabular
function of cracking strain (or displacement) rate, and several compression hardening
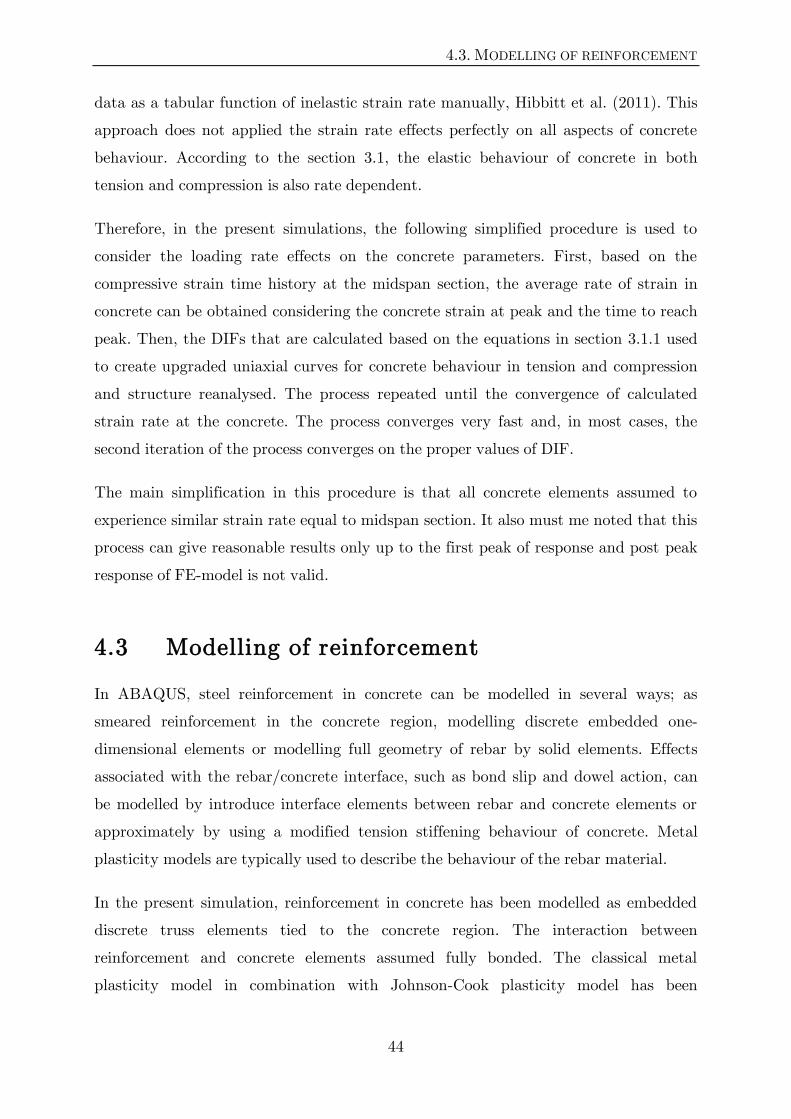
4.3. MODELLING OF REINFORCEMENT
44
data as a tabular function of inelastic strain rate manually, Hibbitt et al. (2011). This
approach does not applied the strain rate effects perfectly on all aspects of concrete
behaviour. According to the section 3.1, the elastic behaviour of concrete in both
tension and compression is also rate dependent.
Therefore, in the present simulations, the following simplified procedure is used to
consider the loading rate effects on the concrete parameters. First, based on the
compressive strain time history at the midspan section, the average rate of strain in
concrete can be obtained considering the concrete strain at peak and the time to reach
peak. Then, the DIFs that are calculated based on the equations in section 3.1.1 used
to create upgraded uniaxial curves for concrete behaviour in tension and compression
and structure reanalysed. The process repeated until the convergence of calculated
strain rate at the concrete. The process converges very fast and, in most cases, the
second iteration of the process converges on the proper values of DIF.
The main simplification in this procedure is that all concrete elements assumed to
experience similar strain rate equal to midspan section. It also must me noted that this
process can give reasonable results only up to the first peak of response and post peak
response of FE-model is not valid.
4.3 Modelling of reinforcement
In ABAQUS, steel reinforcement in concrete can be modelled in several ways; as
smeared reinforcement in the concrete region, modelling discrete embedded one-
dimensional elements or modelling full geometry of rebar by solid elements. Effects
associated with the rebar/concrete interface, such as bond slip and dowel action, can
be modelled by introduce interface elements between rebar and concrete elements or
approximately by using a modified tension stiffening behaviour of concrete. Metal
plasticity models are typically used to describe the behaviour of the rebar material.
In the present simulation, reinforcement in concrete has been modelled as embedded
discrete truss elements tied to the concrete region. The interaction between
reinforcement and concrete elements assumed fully bonded. The classical metal
plasticity model in combination with Johnson-Cook plasticity model has been
CHAPTER 4. FE MODELING OF DYNAMIC BEHAVIOR OF REINFORCED CONCRETE
45
implemented to define the nonlinear strain-rate dependent behaviour of reinforcing
steel, Hibbitt et al. (2011).
In the presence of material test results, it is logical to use the nominal stress-strain
curves obtained from the uniaxial static tests in the definition of material models. In
the present study, the results of material testing has been used. The details of test
results can be found in Magnusson and Hallgren (2000), see also appendix A.
4.3.1 Classic metal plasticity model
The classic metal plasticity model is used to define the uniaxial static behaviour of
reinforcing steel. In this model, the elastic behaviour of steel material is specified by
defining Young’s modulus and Poisson’s ratio. Plastic behaviour must be defined as a
linear piecewise plastic strain-true stress curve. For an isotropic material, the nominal
strain-stress curve can be converted to plastic strain-true stress curve according to Eqs.
(4.20) and (4.21), see Hibbitt et al. (2011).
( ) ( )
( )
( )
Density must be defined for dynamic analysis. It is assumed that the behaviour of the
reinforcing steel is equal in tension and in compression.
4.3.2 Johnson-Cook plasticity model
The Johnson-Cook (J&C) plasticity model has been used for modelling the rate
dependent nonlinear behaviour of reinforcing steel. This material model uses a Mises
yield surface with associated flow and is suitable for high-strain-rate deformation of
metals, see Johnson and Cook (1985) and Hibbitt et al. (2011). The static yield stress
is defined in the form of eq. (4.22):
( )( ) ( )
Then, the rate dependent dynamic yield stress is defined as below:
4.4. EXPLICIT DYNAMIC ANALYSIS
46
(
) ( )
A, B, C, n, u and are material definition’s parameters. is the non-dimensional
temperature parameter and set to zero as the behaviour of steel has been assumed
temperature independent. Eq. (4.22) represents the static strain-hardening behaviour
of the material. In the present analysis, this eq. directly replaced by the linear
piecewise plastic strain-true stress curve defined in classic metal plasticity model, see
figure A.3. Thus, the only parameters that have to be defined for J&C model are C
and .
Parameter C can be estimated based on the Malvar and Crawford (1998-b) proposed
formulation presented in section 3.1.2.
(
)(
)
( )
The J&C rate dependency formulation does not consider the reduction of DIF at
ultimate stress level. However, this effect is negligible because the strain rate usually
decreased at high plastic strains.
4.4 Explicit dynamic analysis
In this analysis, an explicit dynamic analysis was carried out based on the central
difference integration rule, which is suitable for high-speed dynamic events and strong
discontinuous geometrical or material responses. The remarkable advantage of the
explicit analysis compare to an implicit method is the absence of a global tangent
stiffness matrix and convergence problems; see Chopra (2007) and Hibbitt et al.
(2011). On the other hand, the explicit methods require very small time increment size
to satisfy the stability limits. Indeed, the most important factor in the explicit analysis
is the time increment size, see section 4.4.1.

CHAPTER 4. FE MODELING OF DYNAMIC BEHAVIOR OF REINFORCED CONCRETE
47
4.4.1 Time increment size
The central difference integration rule that was implemented in the explicit dynamic
analysis is conditionally stable and can give meaningless results if the time step chosen
is not short enough. Theoretically, the stability limit of an undamped system is defined
in terms of the highest frequency of the system max, Chopra (2007).
( )
In the case of high nonlinearity, it is not computationally feasible to calculate the exact
highest frequency of the system. Alternately, ABAQUS/Explicit use an automatic
estimation of stable time increment based on the shortest time interval necessary for
dilatational waves to pass the elements of the mesh, Hibbitt et al. (2011).
(
) ( )
where is the length of the element and the propagation velocity of dilatational
waves. P-wave velocity for a linear elastic material with Poisson’s ratio of zero can be
calculated by Eq. (4.27); Where E is modulus of elasticity and is material density.
√
( )
Usually, when a more accurate representation of the higher mode response of a system
is required or in problems with large deformations and/or nonlinear material response,
the automatically estimated time increment must be reduced.
4.4.2 Damping
Generally, damping plays an important role in the accurate prediction of dynamic
response of RC structures. Damping mechanism in a structure is very complex
phenomenon and there is no practical way to calculate the exact value of damping
ratio. However, the effect of damping can be neglected in the analysis of structures
subjected to blast/impact loading due to the following reasons, UFC (2008);
4.4. EXPLICIT DYNAMIC ANALYSIS
48
The effect of damping on the first peak of structural response is very small,
which is usually the only interesting cycle of response.
In the presence of high nonlinearity, the dissipated energy through plastic
deformation is much greater than that dissipated by normal structural
damping.
By choosing an appropriate constitutive material model, the majority of the energy
dissipating mechanisms in an RC structure, such as cracking and hysteresis behaviour
of concrete, can be included in the FE analysis, Saatci and Vecchio (2009). Concrete
Damaged Plasticity (CDP) material model in ABAQUS/Explicit considers
aforementioned energy dissipating mechanisms. Thus, the material model itself may
provide damping in the form of plastic dissipation. However, for numerical
considerations, ABAQUS/Explicit introduces a small amount of damping in the form
of bulk viscosity to limit the numerical oscillations, Hibbitt et al. (2011).
The CDP material model in ABAQUS/Explicit can be used in combination with
material (structural) damping through using Rayleigh damping. In this case, “if the
stiffness proportional damping is specified, ABAQUS calculates the damping stress
based on the undamaged elastic stiffness. This may introduce large artificial damping
forces on elements undergoing severe damage at high strain rates” and lead to
unrealistic results, see Hibbitt et al. (2011).
49
Chapter 5
Verification of FE model
In this chapter, the capability of ABAQUS/Explicit to model the behaviour of RC
elements subjected to blast loading, especially at shear failure, has been studied. The
FE-model has been verified and calibrated according to the results of the experimental
investigation that was conducted by Magnusson and Hallgren (2000), see section 2.2.
In the verification process, the results of the FE-model were compared to the measured
displacement and reaction force time histories as well as crack patterns. It is also
important to see if the same failure mode is obtained in the numerical analyses as in
the experiment. The obtained displacement time history from FE-model is also
compared to the SDOF calculation based on the procedure described in section 3.3.1
with considering the dynamic increase factors in table 3.2.
5.1 Description of FE-model
ABAQUS/Explicit version 6.11 was used to model the beams. A 2D plane stress FE-
model has been made based on the geometry of tested beam in figure 2.3. Figure 5.1
shows the geometry of model, arrangement of transverse and longitudinal
reinforcement and applied boundary conditions. Because of the symmetry, only half of
the beam modelled. In the modelling of roller support, no special element has been used
to relief the uplift forces during rebound. For this reason, the response of model is only
valid up to the maximum response. As it was discussed in section 4.3, in the present
analysis, no bond-slip model was considered.
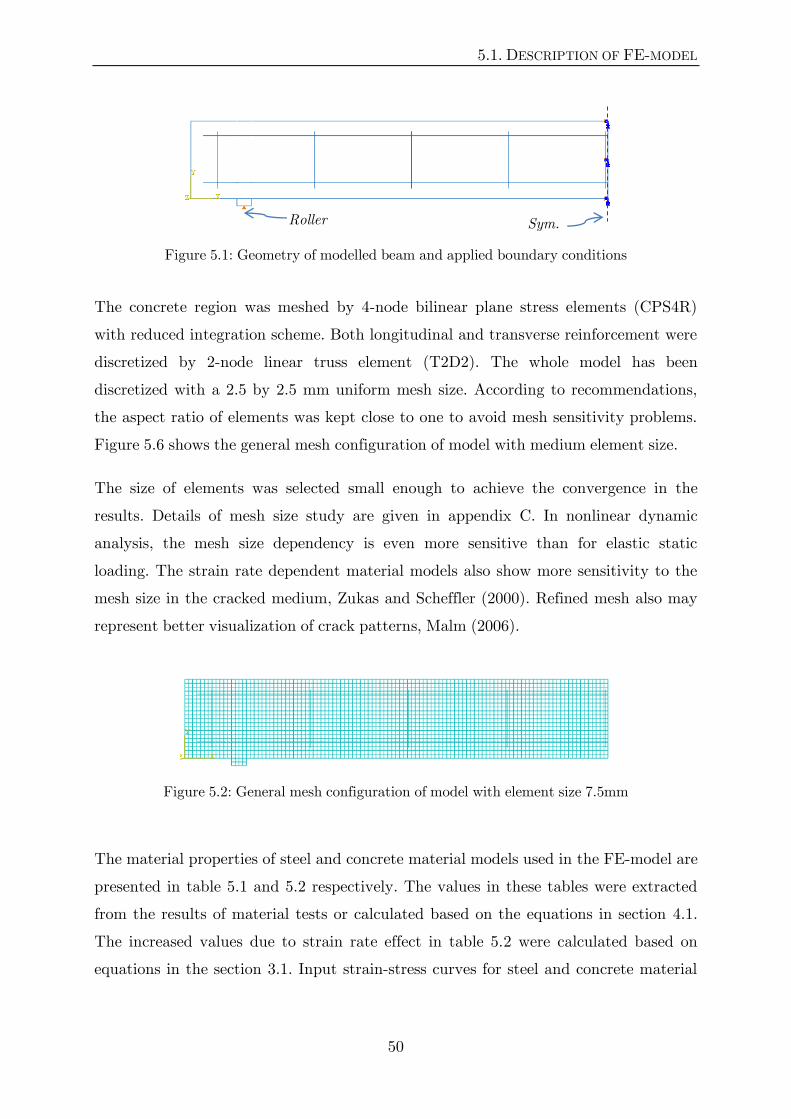
5.1. DESCRIPTION OF FE-MODEL
50
Figure 5.1: Geometry of modelled beam and applied boundary conditions
The concrete region was meshed by 4-node bilinear plane stress elements (CPS4R)
with reduced integration scheme. Both longitudinal and transverse reinforcement were
discretized by 2-node linear truss element (T2D2). The whole model has been
discretized with a 2.5 by 2.5 mm uniform mesh size. According to recommendations,
the aspect ratio of elements was kept close to one to avoid mesh sensitivity problems.
Figure 5.6 shows the general mesh configuration of model with medium element size.
The size of elements was selected small enough to achieve the convergence in the
results. Details of mesh size study are given in appendix C. In nonlinear dynamic
analysis, the mesh size dependency is even more sensitive than for elastic static
loading. The strain rate dependent material models also show more sensitivity to the
mesh size in the cracked medium, Zukas and Scheffler (2000). Refined mesh also may
represent better visualization of crack patterns, Malm (2006).
Figure 5.2: General mesh configuration of model with element size 7.5mm
The material properties of steel and concrete material models used in the FE-model are
presented in table 5.1 and 5.2 respectively. The values in these tables were extracted
from the results of material tests or calculated based on the equations in section 4.1.
The increased values due to strain rate effect in table 5.2 were calculated based on
equations in the section 3.1. Input strain-stress curves for steel and concrete material
Sym. Line
Roller
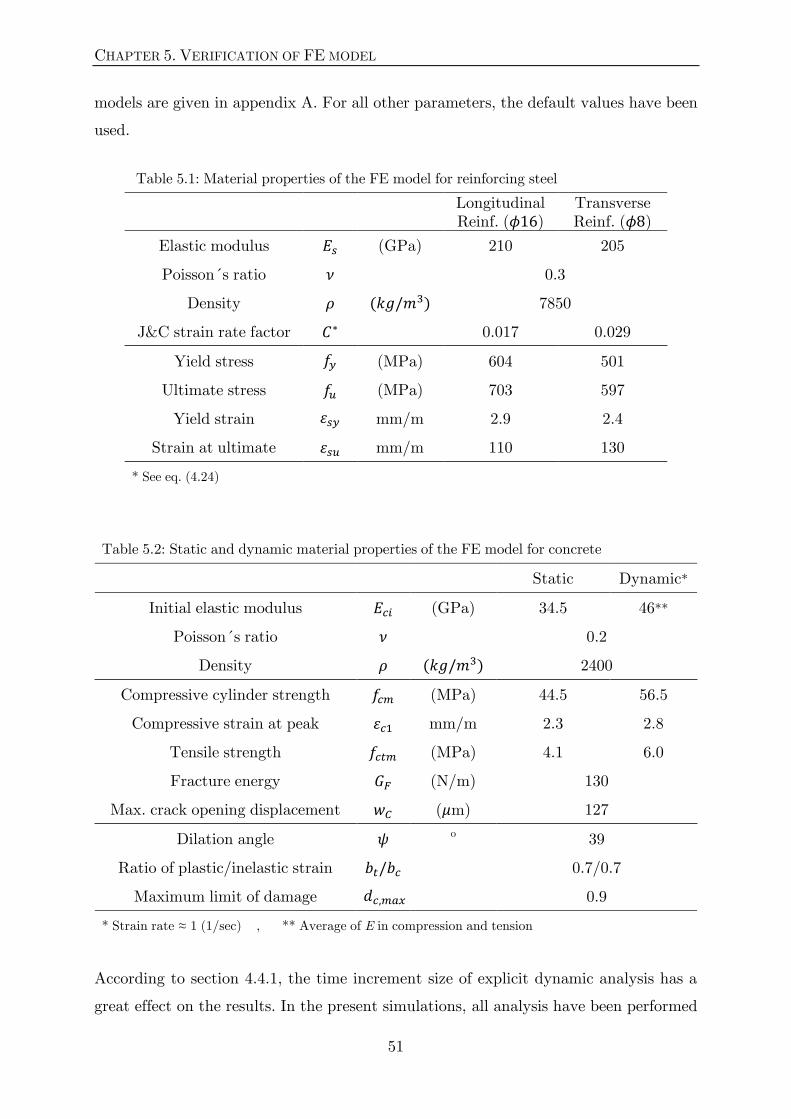
CHAPTER 5. VERIFICATION OF FE MODEL
51
models are given in appendix A. For all other parameters, the default values have been
used.
Table 5.1: Material properties of the FE model for reinforcing steel
Longitudinal Reinf. ( )
Transverse Reinf. ( )
Elastic modulus (GPa) 210 205
Poisson´s ratio 0.3
Density ( ) 7850
J&C strain rate factor 0.017 0.029
Yield stress (MPa) 604 501
Ultimate stress (MPa) 703 597
Yield strain mm/m 2.9 2.4
Strain at ultimate mm/m 110 130
* See eq. (4.24)
Table 5.2: Static and dynamic material properties of the FE model for concrete
Static Dynamic*
Initial elastic modulus (GPa) 34.5 46**
Poisson´s ratio 0.2
Density ( ) 2400
Compressive cylinder strength (MPa) 44.5 56.5
Compressive strain at peak mm/m 2.3 2.8
Tensile strength (MPa) 4.1 6.0
Fracture energy (N/m) 130
Max. crack opening displacement ( m) 127
Dilation angle o 39
Ratio of plastic/inelastic strain 0.7/0.7
Maximum limit of damage 0.9
* Strain rate ≈ 1 (1/sec) , ** Average of E in compression and tension
According to section 4.4.1, the time increment size of explicit dynamic analysis has a
great effect on the results. In the present simulations, all analysis have been performed
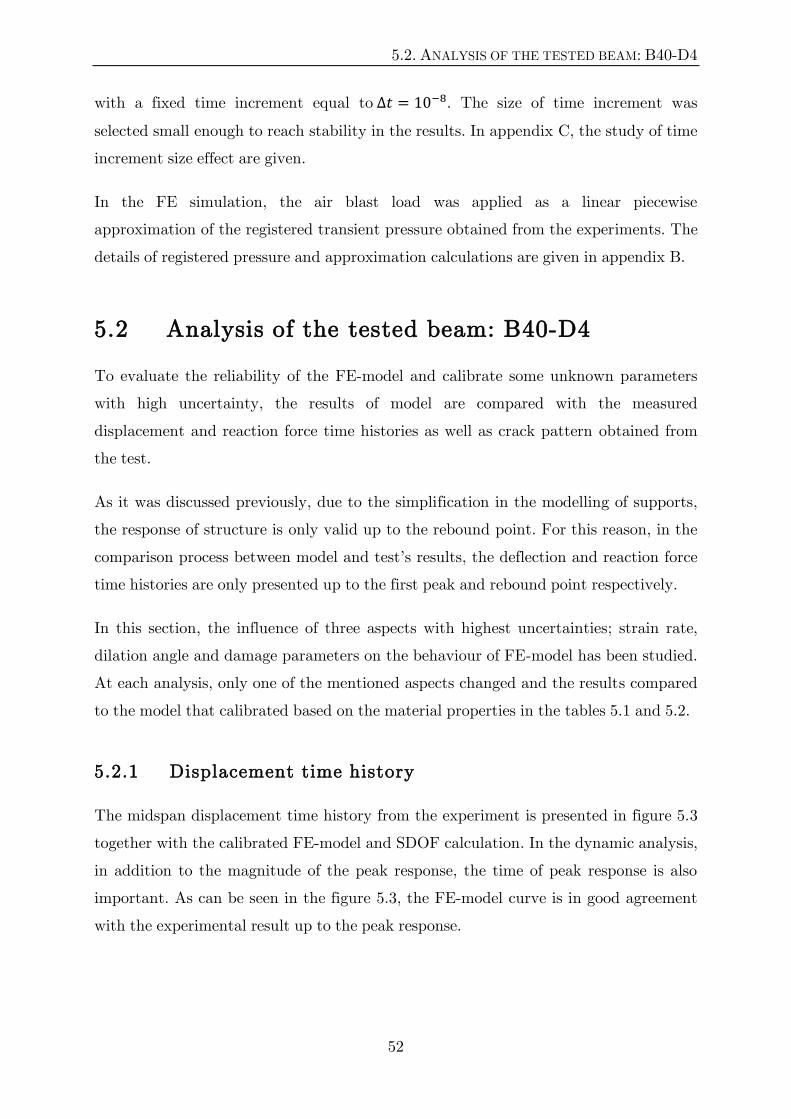
5.2. ANALYSIS OF THE TESTED BEAM: B40-D4
52
with a fixed time increment equal to . The size of time increment was
selected small enough to reach stability in the results. In appendix C, the study of time
increment size effect are given.
In the FE simulation, the air blast load was applied as a linear piecewise
approximation of the registered transient pressure obtained from the experiments. The
details of registered pressure and approximation calculations are given in appendix B.
5.2 Analysis of the tested beam: B40-D4
To evaluate the reliability of the FE-model and calibrate some unknown parameters
with high uncertainty, the results of model are compared with the measured
displacement and reaction force time histories as well as crack pattern obtained from
the test.
As it was discussed previously, due to the simplification in the modelling of supports,
the response of structure is only valid up to the rebound point. For this reason, in the
comparison process between model and test’s results, the deflection and reaction force
time histories are only presented up to the first peak and rebound point respectively.
In this section, the influence of three aspects with highest uncertainties; strain rate,
dilation angle and damage parameters on the behaviour of FE-model has been studied.
At each analysis, only one of the mentioned aspects changed and the results compared
to the model that calibrated based on the material properties in the tables 5.1 and 5.2.
5.2.1 Displacement time history
The midspan displacement time history from the experiment is presented in figure 5.3
together with the calibrated FE-model and SDOF calculation. In the dynamic analysis,
in addition to the magnitude of the peak response, the time of peak response is also
important. As can be seen in the figure 5.3, the FE-model curve is in good agreement
with the experimental result up to the peak response.
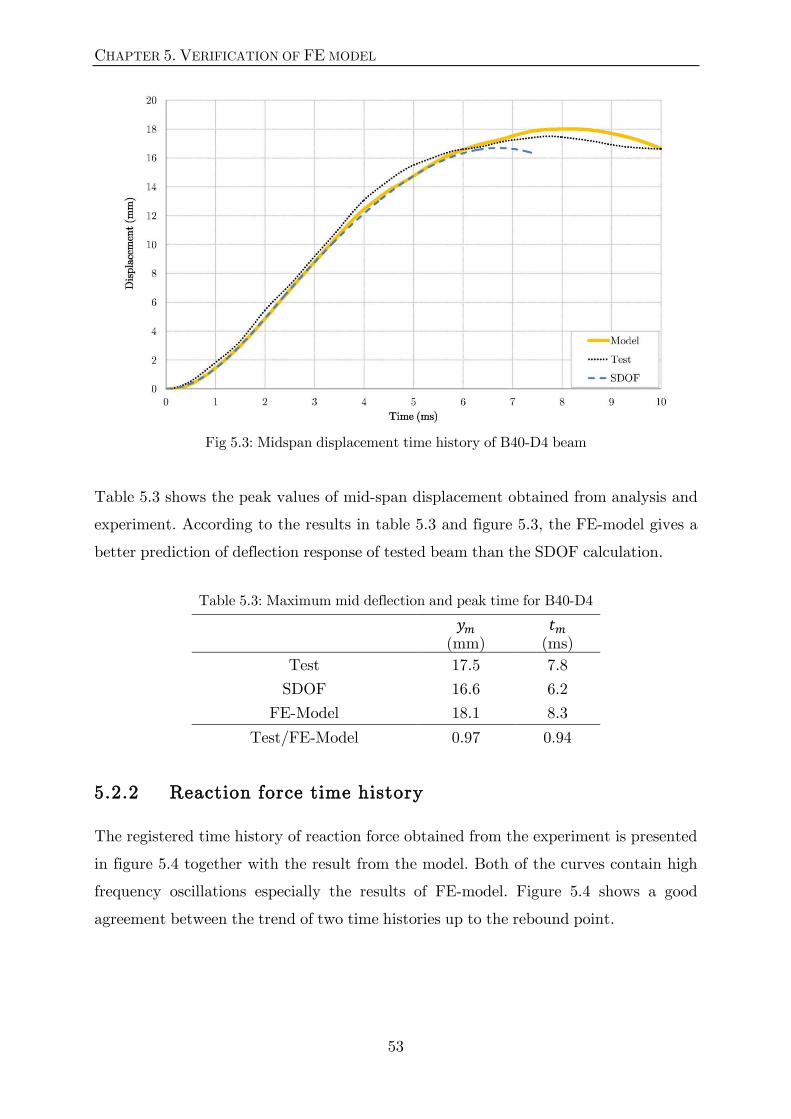
CHAPTER 5. VERIFICATION OF FE MODEL
53
Fig 5.3: Midspan displacement time history of B40-D4 beam
Table 5.3 shows the peak values of mid-span displacement obtained from analysis and
experiment. According to the results in table 5.3 and figure 5.3, the FE-model gives a
better prediction of deflection response of tested beam than the SDOF calculation.
Table 5.3: Maximum mid deflection and peak time for B40-D4
(mm)
(ms)
Test 17.5 7.8
SDOF 16.6 6.2
FE-Model 18.1 8.3
Test/FE-Model 0.97 0.94
5.2.2 Reaction force time history
The registered time history of reaction force obtained from the experiment is presented
in figure 5.4 together with the result from the model. Both of the curves contain high
frequency oscillations especially the results of FE-model. Figure 5.4 shows a good
agreement between the trend of two time histories up to the rebound point.

5.2. ANALYSIS OF THE TESTED BEAM: B40-D4
54
Fig 5.4: Unfiltered reaction force time history of B40-D4 beam
To achieve a better comparison, both curves have been filtered and the results are
presented in figure 5.5. The detailed information about filtration process is presented in
appendix D. As can be seen in the figure 5.5, the filtered peak response of both FE-
model and experiment are also close together.
Fig 5.5: Filtered reaction force time history of B40-D4 beam

CHAPTER 5. VERIFICATION OF FE MODEL
55
Table 5.4 represents the maximum reaction force and time of peak response obtained
from FE analysis and experiment.
Table 5.4: Maximum reaction force and peak time for B40-D4
(kN)
(ms)
Test 348 3.5
FE-Model 336 3.8
Test/FE-Model 1.04 0.92
5.2.3 Crack pattern
Figure 5.6 shows the induced damage pattern obtained from the FE analysis and the
observed crack pattern from experiment. As can be seen in figure 5.6 (a), a shear crack
that originates near the support and propagates towards up surface of beam at one-
fourth of its span caused shear failure in the B40-D4 experiment. In figure 5.6 (b) the
elements with induced damage from ABAQUS/Explicit model with maximum damage
of 0.9 is shown. Induced damages less than 0.2 are displayed as white in the figure.
Based on the figure 5.13, it can be said that the FE-model cannot represent the crack
patterns perfectly but at least can give a reasonable representation of induced damage
pattern and failure mode of beam.
(a)
(b)
Figure 5.6: Induced damage pattern in beam B40-D4 (a) Photo of the observed crack pattern from the experiment, (b) Elements with induced damage from ABAQUS/Explicit with max
damage 0.9 at peak time

5.2. ANALYSIS OF THE TESTED BEAM: B40-D4
56
5.2.4 Influence of strain rate effect
Figures 5.7 and 5.8, show the influence of strain rate effect on the
reaction/displacement time history response of FE model. As can be seen in these
figures, the model behaves very softer than the experiment in the absence of strain rate
effects.
Fig 5.7: Influence of strain rate effects on the mid deflection time history of model
Fig 5.8: Influence of strain rate effects on the reaction force time history of model

CHAPTER 5. VERIFICATION OF FE MODEL
57
5.2.5 Influence of dilation angle
In the calibration process, the effect of dilation angle on the behaviour of model was
studied. Figure 5.9 and 5.10 shows the influence of different values of dilation angle on
the displacement and reaction force time history of tested beam respectively. The
results show that in this model, to achieve a good agreement between the experimental
results and FE analysis, the dilation angle must be around 38 to 40 degrees. Larger
values of dilation angle lead to stiffer behaviour, however for smaller values the
behaviour become softer than the experimental results.
In figure 5.11 the induced damage patterns obtained from FE analysis for three values
of dilation angle size are illustrated. As can be seen in the figure 5.11, by increasing the
size of dilation angle, the failure mode changes from a brittle shear failure mode to
more ductile response and the intensity of shear damage reduced.
Fig 5.9: Influence of dilation angle size on the midspan displacement time history response of model
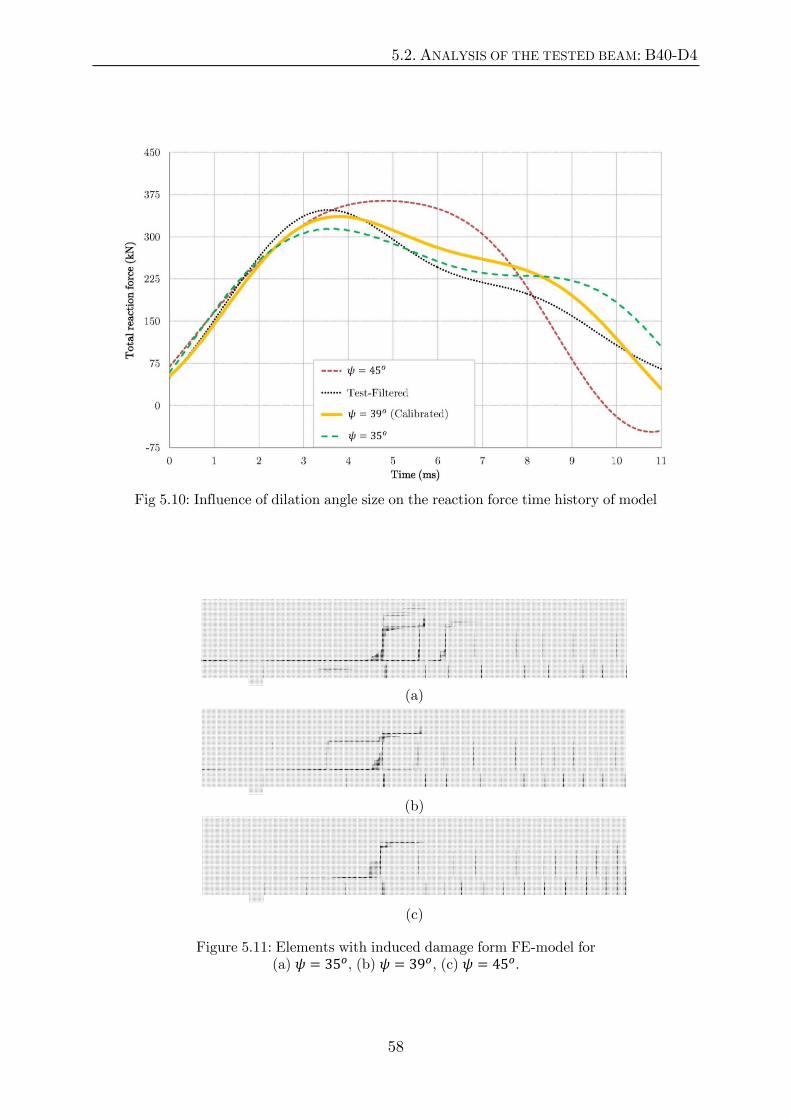
5.2. ANALYSIS OF THE TESTED BEAM: B40-D4
58
Fig 5.10: Influence of dilation angle size on the reaction force time history of model
(a)
(b)
(c)
Figure 5.11: Elements with induced damage form FE-model for (a) , (b) , (c) .

CHAPTER 5. VERIFICATION OF FE MODEL
59
5.2.6 Influence of damage parameters
The damage parameters in the CDP material model play an important role in the
dynamic response of RC structures subjected to cyclic loading. The initial impression
about the present analysed beam is that this beam is subjected to a monotonically
decreasing pressure load and overall behaviour of beam up to the peak is not cyclic.
The obtained stress time history of elements at mid-span supports this idea. In this
case, the definition of damage parameters is not necessary. On the contrary, by study
the stress time history especially shear stress at elements closer to the beam ends, it
can be seen that the stress variation is not monotonic. The reason may represent in the
terms of excitation of higher order vibration modes in the initial moments of response
and also significant effect of shear wave propagation. In this case, the definition of
damage parameters is necessary to consider the stiffness degradation of model.
In order to evaluate the influence of the damage parameters on the results of FE
analysis, the dynamic behaviour of FE-model with and without of damage parameters
has been simulated. Figure 5.12 and 5.13 illustrates the effect of damage parameters on
the displacement and reaction force time histories of analysed beam respectively. As
can be seen in these figures, the model without damage parameters, behaves stiffer
than the experiment.
Fig 5.12: Influence of damage parameters on the mid deflection time history of model
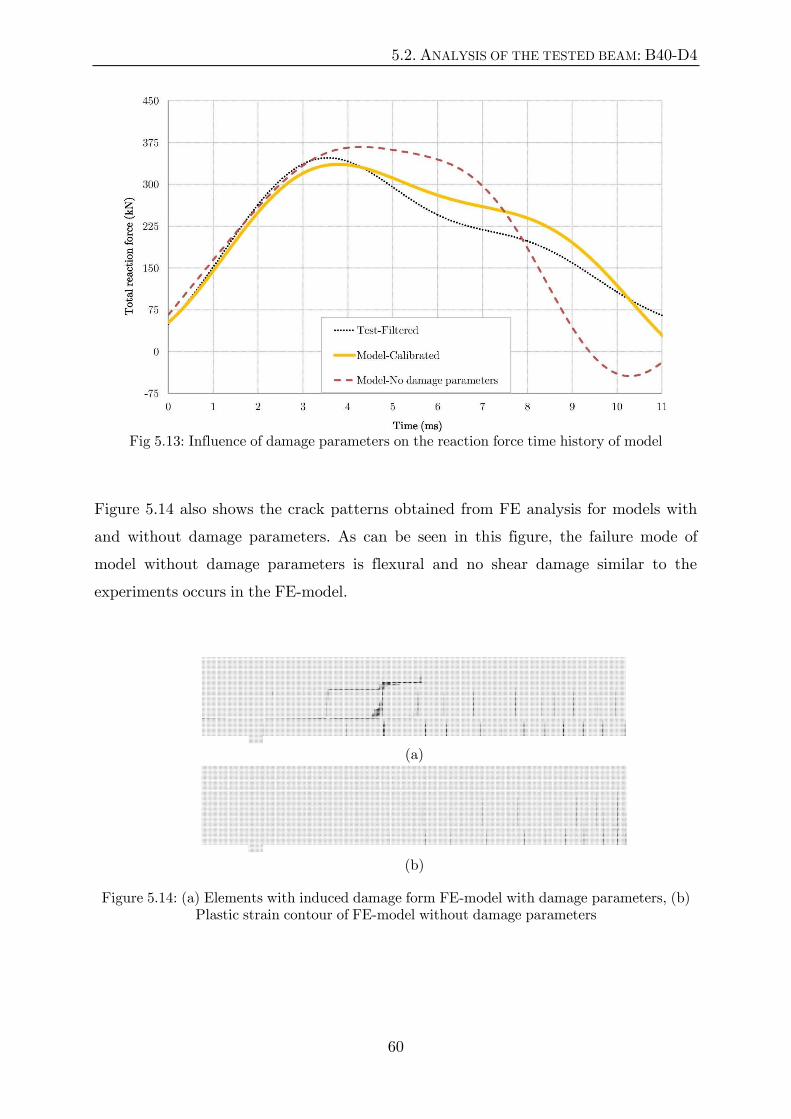
5.2. ANALYSIS OF THE TESTED BEAM: B40-D4
60
Fig 5.13: Influence of damage parameters on the reaction force time history of model
Figure 5.14 also shows the crack patterns obtained from FE analysis for models with
and without damage parameters. As can be seen in this figure, the failure mode of
model without damage parameters is flexural and no shear damage similar to the
experiments occurs in the FE-model.
(a)
(b)
Figure 5.14: (a) Elements with induced damage form FE-model with damage parameters, (b) Plastic strain contour of FE-model without damage parameters

CHAPTER 5. VERIFICATION OF FE MODEL
61
5.3 Analysis of the tested beam: B40-D3
The FE-model has been calibrated based on the results of B40-D4 beam. In this
section, in order to verify the accuracy of the FE-model, calibrated FE-model is used to
simulate the B40-D3 testes beam.
5.3.1 Displacement time history
The midspan displacement time history from the experiment is presented in figure 5.15
together with the calibrated FE-model and SDOF calculation. As can be seen in the
figure 5.15, both the FE-model and SDOF method behave stiffer than the
measurement, however the FE-model is in reasonable agreement with the experimental
result up to the peak response. Nevertheless, the possibility of the measurement error
in the test result cannot be neglected.
Fig 5.15: Midspan displacement time history of B40-D3 beam
Table 5.5 shows the peak values of mid-span displacement obtained from analysis and
experiment. According to the results in table 5.5 and figure 5.15, the FE-model gives a
better prediction of deflection response of tested beam than the SDOF calculation.
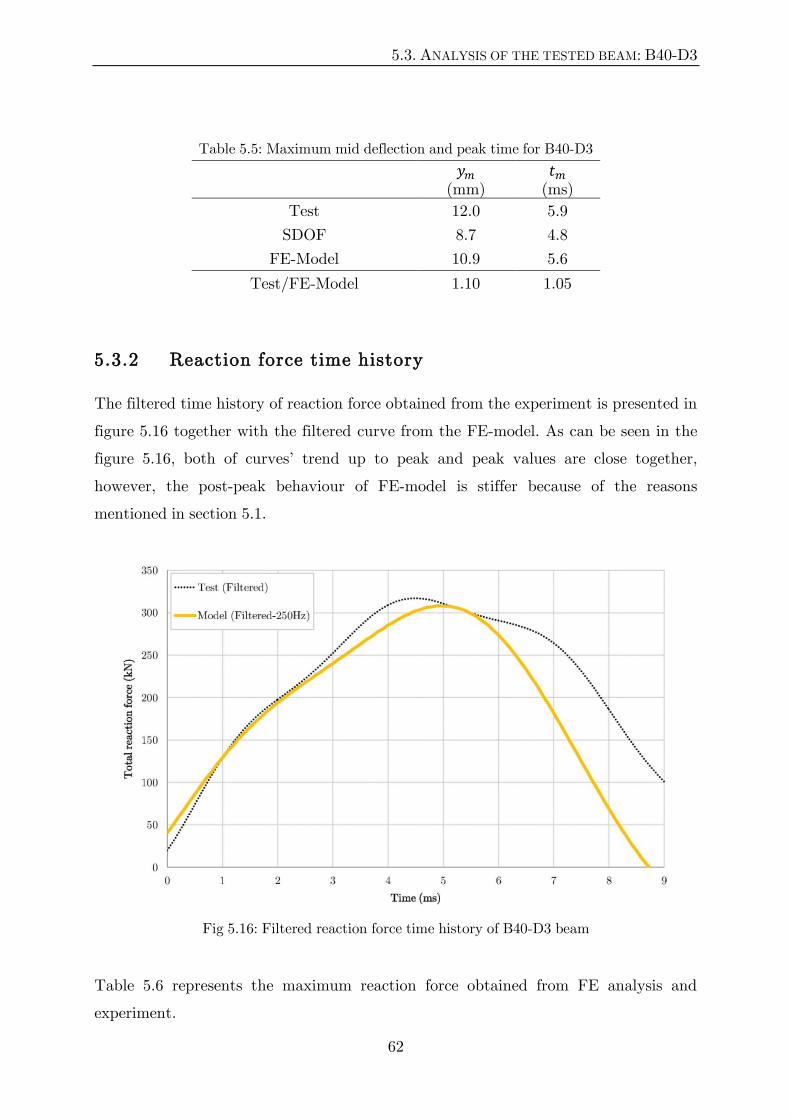
5.3. ANALYSIS OF THE TESTED BEAM: B40-D3
62
Table 5.5: Maximum mid deflection and peak time for B40-D3
(mm)
(ms)
Test 12.0 5.9
SDOF 8.7 4.8
FE-Model 10.9 5.6
Test/FE-Model 1.10 1.05
5.3.2 Reaction force time history
The filtered time history of reaction force obtained from the experiment is presented in
figure 5.16 together with the filtered curve from the FE-model. As can be seen in the
figure 5.16, both of curves’ trend up to peak and peak values are close together,
however, the post-peak behaviour of FE-model is stiffer because of the reasons
mentioned in section 5.1.
Fig 5.16: Filtered reaction force time history of B40-D3 beam
Table 5.6 represents the maximum reaction force obtained from FE analysis and
experiment.
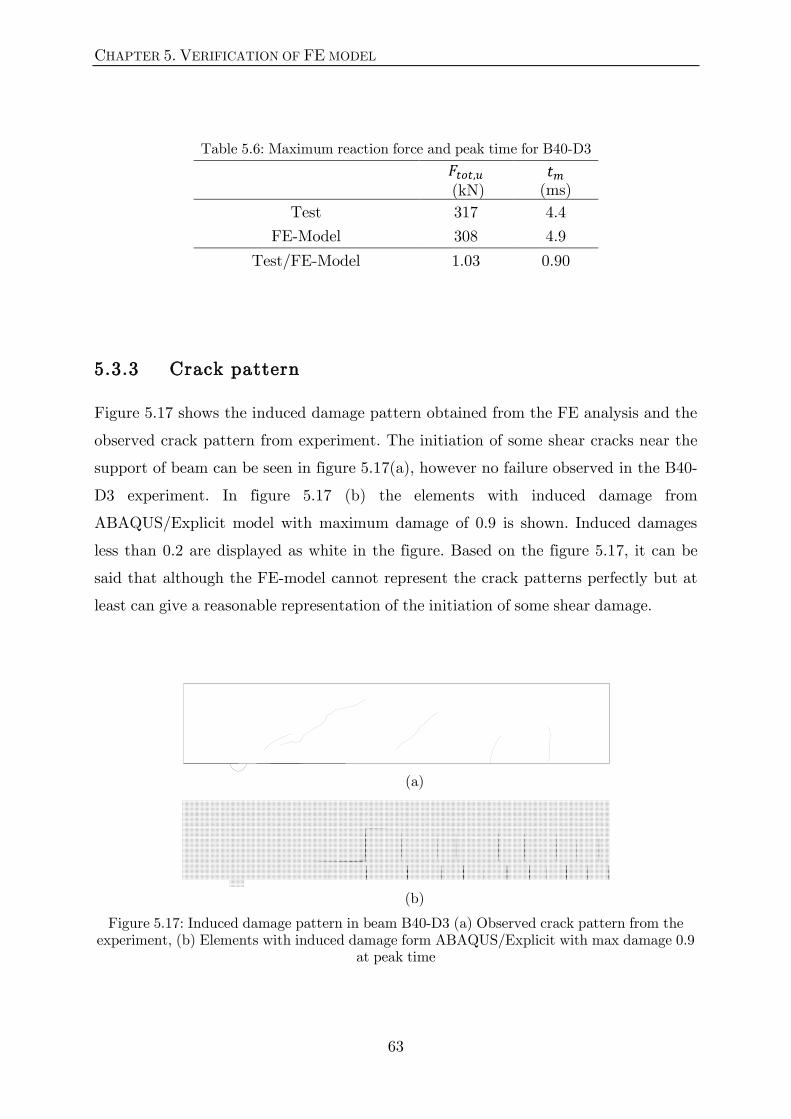
CHAPTER 5. VERIFICATION OF FE MODEL
63
Table 5.6: Maximum reaction force and peak time for B40-D3
(kN)
(ms)
Test 317 4.4
FE-Model 308 4.9
Test/FE-Model 1.03 0.90
5.3.3 Crack pattern
Figure 5.17 shows the induced damage pattern obtained from the FE analysis and the
observed crack pattern from experiment. The initiation of some shear cracks near the
support of beam can be seen in figure 5.17(a), however no failure observed in the B40-
D3 experiment. In figure 5.17 (b) the elements with induced damage from
ABAQUS/Explicit model with maximum damage of 0.9 is shown. Induced damages
less than 0.2 are displayed as white in the figure. Based on the figure 5.17, it can be
said that although the FE-model cannot represent the crack patterns perfectly but at
least can give a reasonable representation of the initiation of some shear damage.
(a)
(b)
Figure 5.17: Induced damage pattern in beam B40-D3 (a) Observed crack pattern from the experiment, (b) Elements with induced damage form ABAQUS/Explicit with max damage 0.9
at peak time

65
Chapter 6
Shear strength analysis of blast loaded RC beams
In the previous chapter, a nonlinear explicit FE-model has been calibrated and verified
based on the some experimental results. In the present chapter, this calibrated model is
used to study the effect of some important factors such as concrete quality,
longitudinal reinforcement ratio and beam’s depth on the shear strength of blast
loaded RC beams. The results can be used as a start-point to highlight the criteria
when there is a risk of shear failure modes appearing. Furthermore, the results of
simulations were used as a reference to preliminary study of the UFC and FKR design
approaches’ ability in predictions the shear strength of RC beams subjected to blast
loading. The Maximum displacement obtained from FE-model is also compared to the
SDOF calculation based on the procedure described in section 3.3.1 with considering
the dynamic increase factors in table 3.2. At each case, only one of the mentioned
aspects is changed. Detailed results of the simulations and calculations are presented in
appendix E. In the following simulations, all models are subjected to the same air blast
pressure as the tested beam B40-D4, see appendix B. The triangular load
approximation of this load is used in the SDOF calculations. The data of the pressure
loads are presented in the appendix B.
6.1 Effect of concrete property
According to the experimental investigation by Magnusson and Hallgren (2000), a
6.1. EFFECT OF CONCRETE PROPERTY
66
larger mass of explosive charge needed to cause a shear failure in a HSC beam compare
to a NSC beam. In other words, under the same load intensity, shear resistance of a
beam increased by using a higher concrete grade, although the ductility decreased. In
order to study the effect of concrete grade on the failure modes of air blast loaded
beam, several models with different material properties of concrete has been studied.
Table 6.1 indicates the variety of modelling with different concrete qualities. The
mechanical properties of different concrete qualities that used in the simulations can be
found in table 6.2. This must be noted that the present FE-model is not calibrated for
high strength concrete grades and the following results can be assumed as a
preliminary parametric study.
Table 6.1: Specification of models with various concrete qualities
Beam Type
Concrete Grade
h (mm)
(%)
⁄ (mm)
(mm)
⁄ **
⁄ **
C45R25* B45
160 2.45 0.54 200
1.1 1.7
C65R25 B65 1.05 1.6
C85R25 B85 1.0 1.6
* Calibrated model ** Based on UFC
Table 6.2: Mechanical properties of different concrete qualities
Concrete Grade
fcm (MPa)
fctm (MPa)
Ec (GPa)
GF* (N.m/m2)
B45 45 4.1 34.5 130
B65 65 5.1 38.6 170
B85 85 6.2 41.8 200
* Based on dmax=25mm
6.1.1 Ductility and failure mode
The induced damage pattern and dynamic reaction-deflection curves of models with
different concrete grades have been shown in figure 6.1 and 6.2 respectively. As can be
seen in the figure 6.1, by increasing the strength of concrete, the risk of shear failure
decreased. At the same time, figure 6.2 illustrates that the ductility of the beam
decreased when the concrete strength increased.
By using higher concrete strength, both of the shear and flexural capacities of beam
increased. Due to the decreasing of the ductility and no considerable change in the
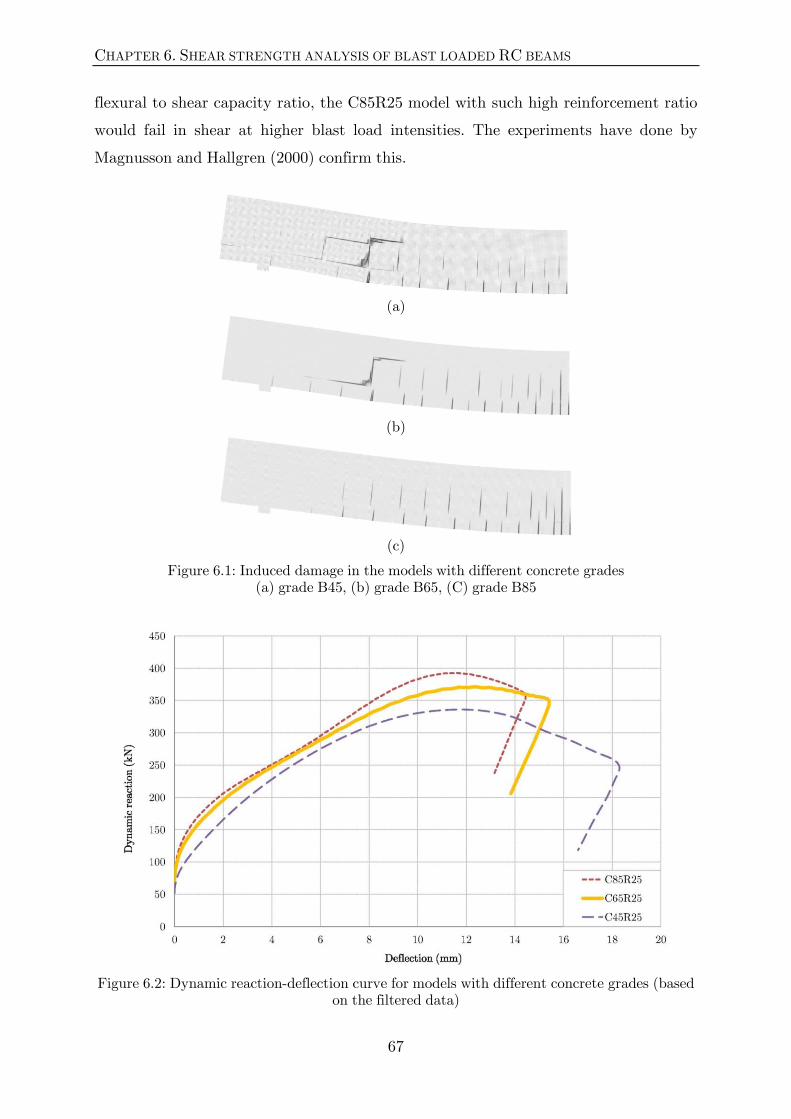
CHAPTER 6. SHEAR STRENGTH ANALYSIS OF BLAST LOADED RC BEAMS
67
flexural to shear capacity ratio, the C85R25 model with such high reinforcement ratio
would fail in shear at higher blast load intensities. The experiments have done by
Magnusson and Hallgren (2000) confirm this.
(a)
(b)
(c)
Figure 6.1: Induced damage in the models with different concrete grades (a) grade B45, (b) grade B65, (C) grade B85
Figure 6.2: Dynamic reaction-deflection curve for models with different concrete grades (based on the filtered data)
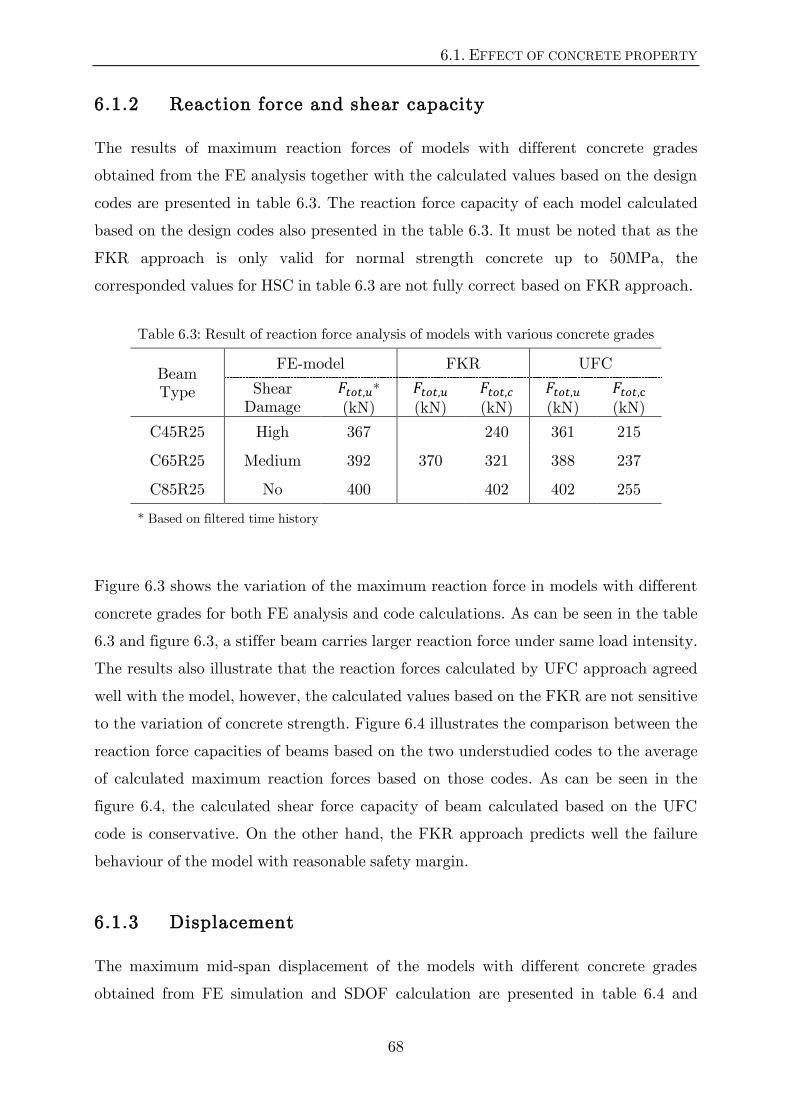
6.1. EFFECT OF CONCRETE PROPERTY
68
6.1.2 Reaction force and shear capacity
The results of maximum reaction forces of models with different concrete grades
obtained from the FE analysis together with the calculated values based on the design
codes are presented in table 6.3. The reaction force capacity of each model calculated
based on the design codes also presented in the table 6.3. It must be noted that as the
FKR approach is only valid for normal strength concrete up to 50MPa, the
corresponded values for HSC in table 6.3 are not fully correct based on FKR approach.
Table 6.3: Result of reaction force analysis of models with various concrete grades
Beam Type
FE-model FKR UFC
Shear Damage
*
(kN)
(kN)
(kN)
(kN)
(kN)
C45R25 High 367
370
240 361 215
C65R25 Medium 392 321 388 237
C85R25 No 400 402 402 255
* Based on filtered time history
Figure 6.3 shows the variation of the maximum reaction force in models with different
concrete grades for both FE analysis and code calculations. As can be seen in the table
6.3 and figure 6.3, a stiffer beam carries larger reaction force under same load intensity.
The results also illustrate that the reaction forces calculated by UFC approach agreed
well with the model, however, the calculated values based on the FKR are not sensitive
to the variation of concrete strength. Figure 6.4 illustrates the comparison between the
reaction force capacities of beams based on the two understudied codes to the average
of calculated maximum reaction forces based on those codes. As can be seen in the
figure 6.4, the calculated shear force capacity of beam calculated based on the UFC
code is conservative. On the other hand, the FKR approach predicts well the failure
behaviour of the model with reasonable safety margin.
6.1.3 Displacement
The maximum mid-span displacement of the models with different concrete grades
obtained from FE simulation and SDOF calculation are presented in table 6.4 and
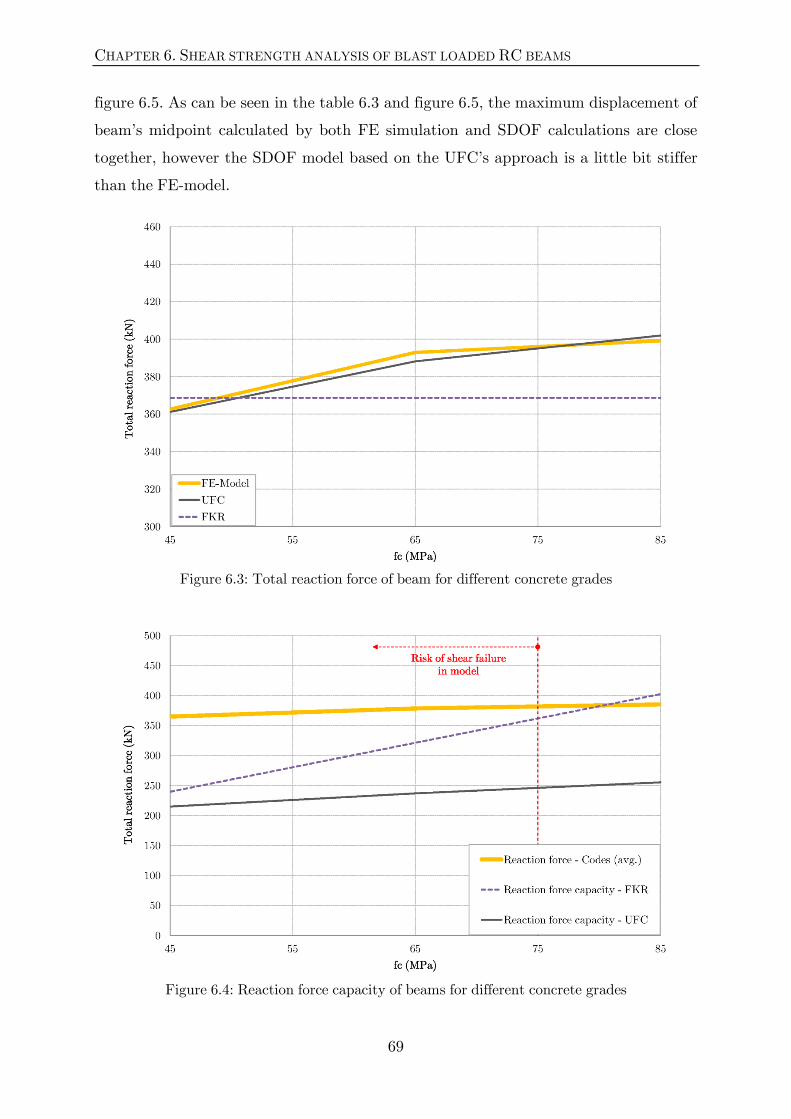
CHAPTER 6. SHEAR STRENGTH ANALYSIS OF BLAST LOADED RC BEAMS
69
figure 6.5. As can be seen in the table 6.3 and figure 6.5, the maximum displacement of
beam’s midpoint calculated by both FE simulation and SDOF calculations are close
together, however the SDOF model based on the UFC’s approach is a little bit stiffer
than the FE-model.
Figure 6.3: Total reaction force of beam for different concrete grades
Figure 6.4: Reaction force capacity of beams for different concrete grades
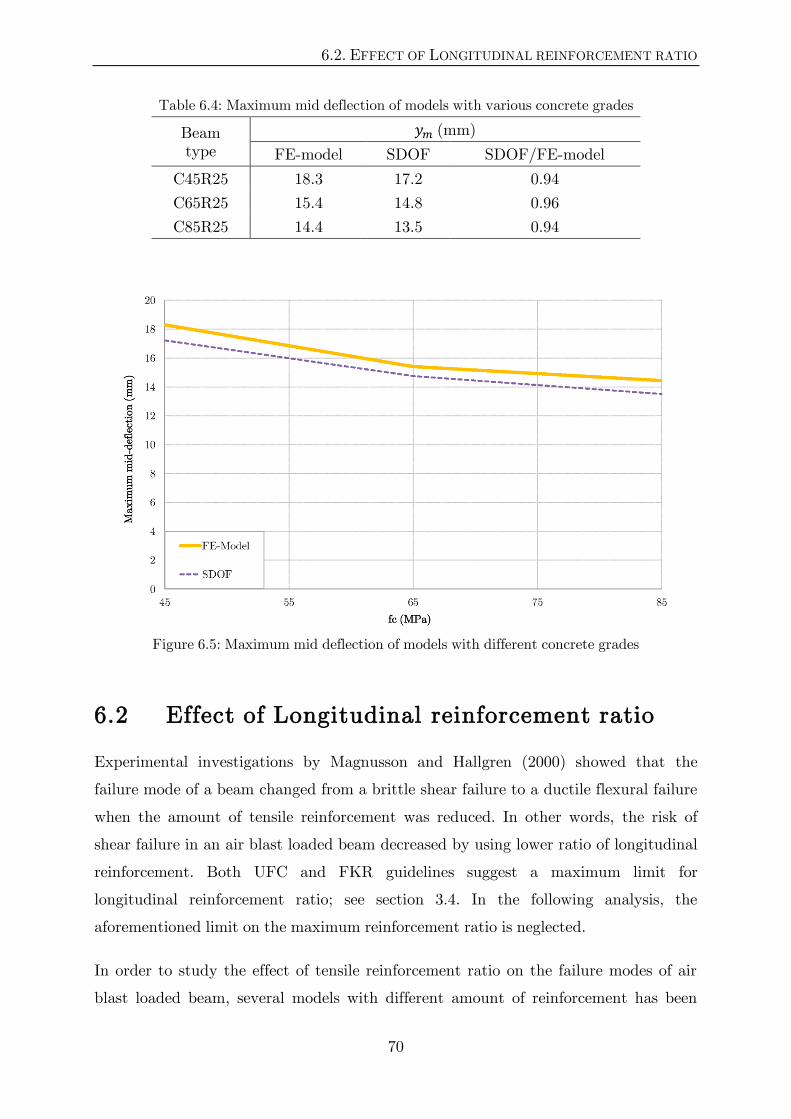
6.2. EFFECT OF LONGITUDINAL REINFORCEMENT RATIO
70
Table 6.4: Maximum mid deflection of models with various concrete grades
Beam type
(mm)
FE-model SDOF SDOF/FE-model
C45R25 18.3 17.2 0.94
C65R25 15.4 14.8 0.96
C85R25 14.4 13.5 0.94
Figure 6.5: Maximum mid deflection of models with different concrete grades
6.2 Effect of Longitudinal reinforcement ratio
Experimental investigations by Magnusson and Hallgren (2000) showed that the
failure mode of a beam changed from a brittle shear failure to a ductile flexural failure
when the amount of tensile reinforcement was reduced. In other words, the risk of
shear failure in an air blast loaded beam decreased by using lower ratio of longitudinal
reinforcement. Both UFC and FKR guidelines suggest a maximum limit for
longitudinal reinforcement ratio; see section 3.4. In the following analysis, the
aforementioned limit on the maximum reinforcement ratio is neglected.
In order to study the effect of tensile reinforcement ratio on the failure modes of air
blast loaded beam, several models with different amount of reinforcement has been
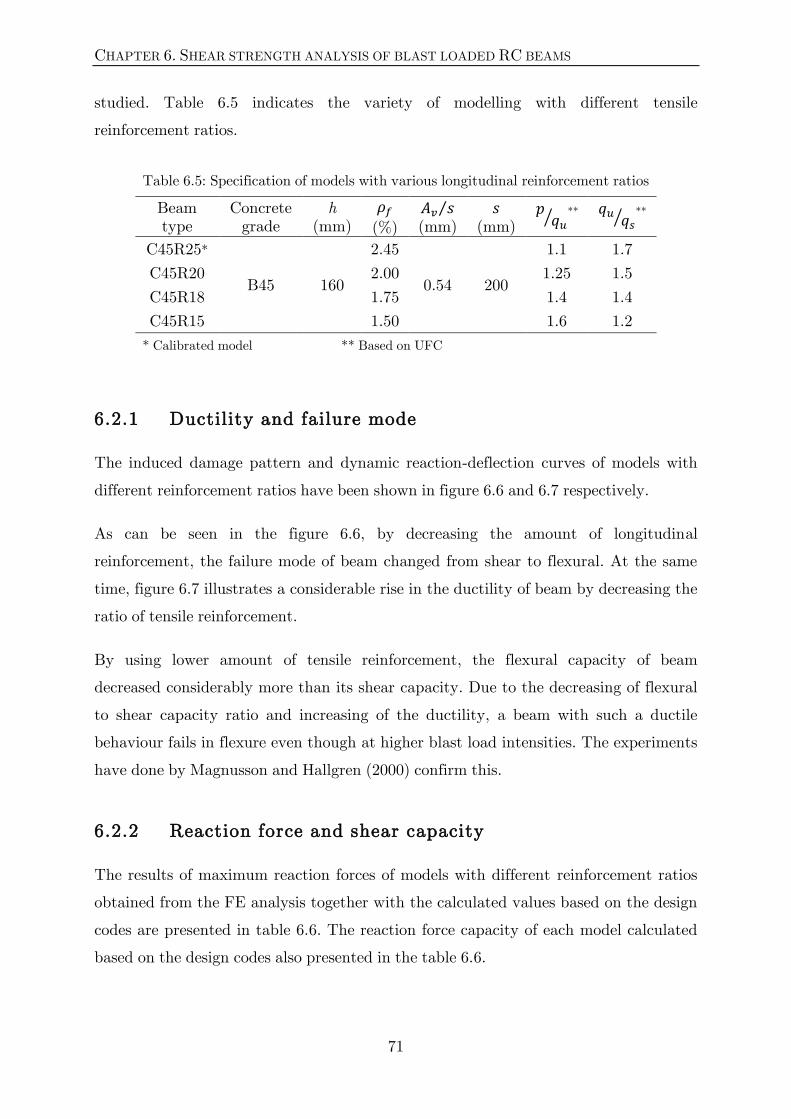
CHAPTER 6. SHEAR STRENGTH ANALYSIS OF BLAST LOADED RC BEAMS
71
studied. Table 6.5 indicates the variety of modelling with different tensile
reinforcement ratios.
Table 6.5: Specification of models with various longitudinal reinforcement ratios
Beam type
Concrete grade
h (mm)
(%)
⁄ (mm)
(mm)
⁄ **
⁄ **
C45R25*
B45 160
2.45
0.54 200
1.1 1.7
C45R20 2.00 1.25 1.5
C45R18 1.75 1.4 1.4
C45R15 1.50 1.6 1.2
* Calibrated model ** Based on UFC
6.2.1 Ductility and failure mode
The induced damage pattern and dynamic reaction-deflection curves of models with
different reinforcement ratios have been shown in figure 6.6 and 6.7 respectively.
As can be seen in the figure 6.6, by decreasing the amount of longitudinal
reinforcement, the failure mode of beam changed from shear to flexural. At the same
time, figure 6.7 illustrates a considerable rise in the ductility of beam by decreasing the
ratio of tensile reinforcement.
By using lower amount of tensile reinforcement, the flexural capacity of beam
decreased considerably more than its shear capacity. Due to the decreasing of flexural
to shear capacity ratio and increasing of the ductility, a beam with such a ductile
behaviour fails in flexure even though at higher blast load intensities. The experiments
have done by Magnusson and Hallgren (2000) confirm this.
6.2.2 Reaction force and shear capacity
The results of maximum reaction forces of models with different reinforcement ratios
obtained from the FE analysis together with the calculated values based on the design
codes are presented in table 6.6. The reaction force capacity of each model calculated
based on the design codes also presented in the table 6.6.

6.2. EFFECT OF LONGITUDINAL REINFORCEMENT RATIO
72
(a)
(b)
(c)
(d)
Figure 6.6: Induced damage in the models with different tensile reinforcement ratios (a) , (b) , (c) , (d)
Figure 6.7: Dynamic reaction-deflection curve for models with different tensile reinforcement ratios (based on the filtered data)
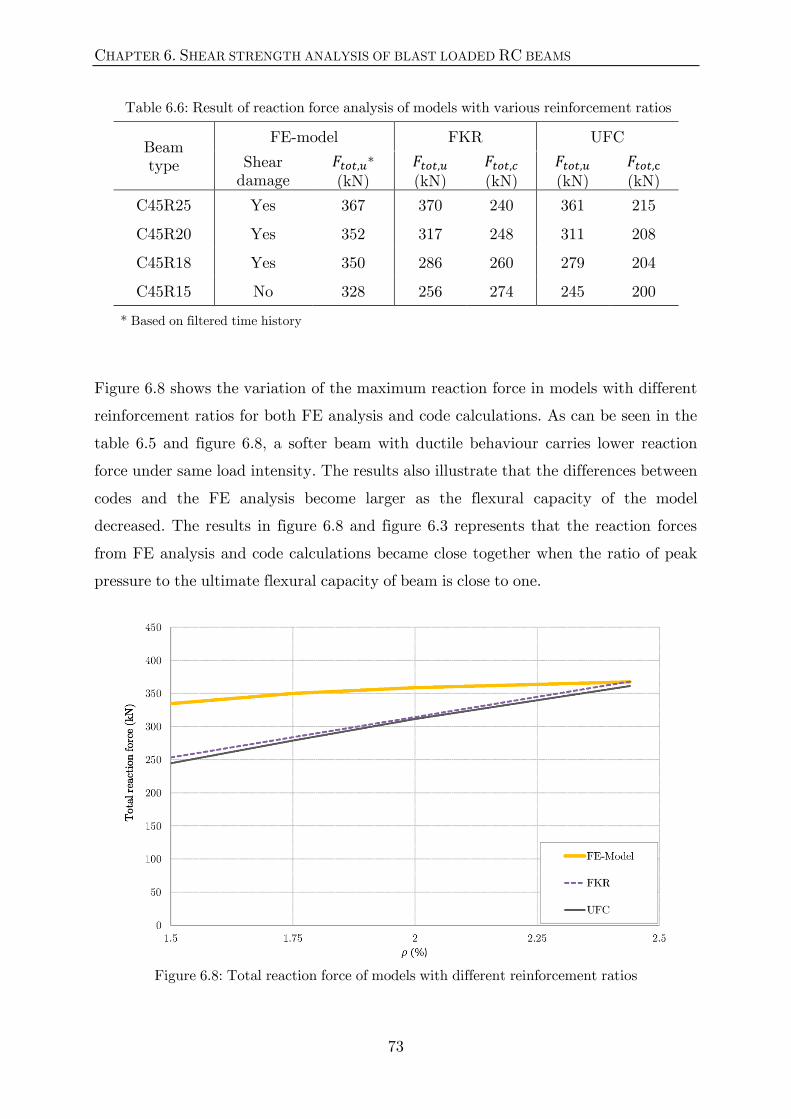
CHAPTER 6. SHEAR STRENGTH ANALYSIS OF BLAST LOADED RC BEAMS
73
Table 6.6: Result of reaction force analysis of models with various reinforcement ratios
Beam type
FE-model FKR UFC
Shear damage
*
(kN)
(kN)
(kN)
(kN)
(kN)
C45R25 Yes 367 370 240 361 215
C45R20 Yes 352 317 248 311 208
C45R18 Yes 350 286 260 279 204
C45R15 No 328 256 274 245 200
* Based on filtered time history
Figure 6.8 shows the variation of the maximum reaction force in models with different
reinforcement ratios for both FE analysis and code calculations. As can be seen in the
table 6.5 and figure 6.8, a softer beam with ductile behaviour carries lower reaction
force under same load intensity. The results also illustrate that the differences between
codes and the FE analysis become larger as the flexural capacity of the model
decreased. The results in figure 6.8 and figure 6.3 represents that the reaction forces
from FE analysis and code calculations became close together when the ratio of peak
pressure to the ultimate flexural capacity of beam is close to one.
Figure 6.8: Total reaction force of models with different reinforcement ratios
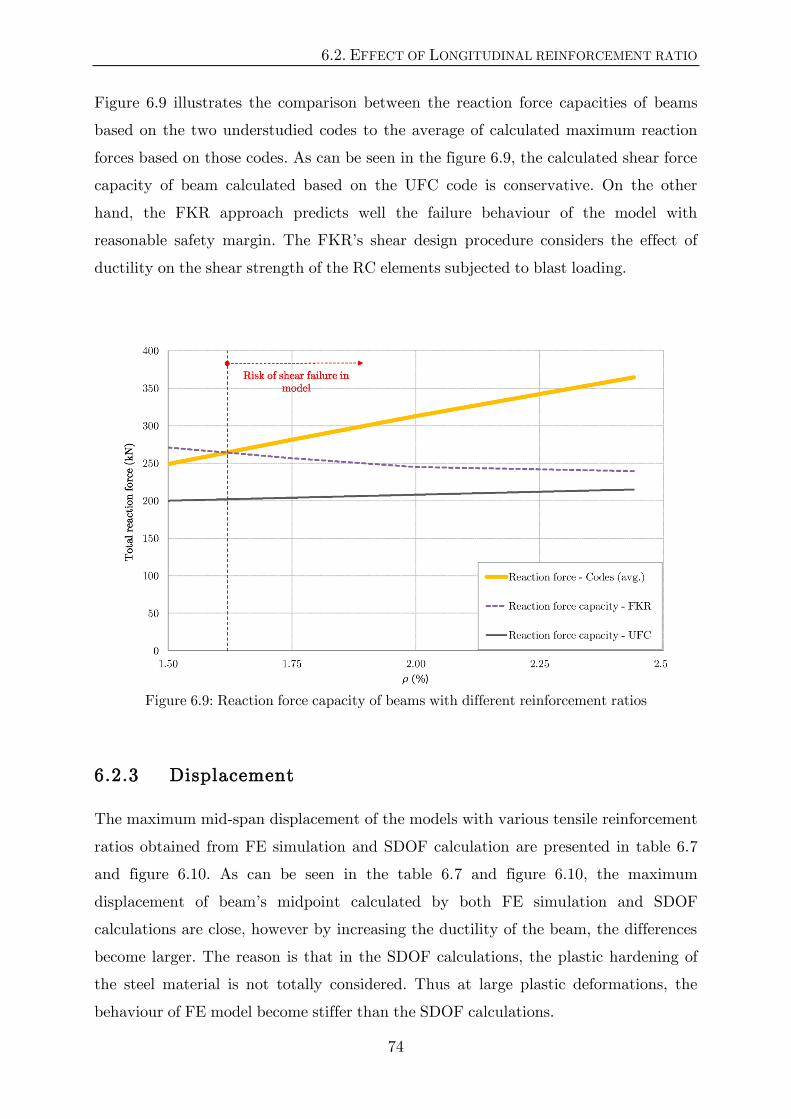
6.2. EFFECT OF LONGITUDINAL REINFORCEMENT RATIO
74
Figure 6.9 illustrates the comparison between the reaction force capacities of beams
based on the two understudied codes to the average of calculated maximum reaction
forces based on those codes. As can be seen in the figure 6.9, the calculated shear force
capacity of beam calculated based on the UFC code is conservative. On the other
hand, the FKR approach predicts well the failure behaviour of the model with
reasonable safety margin. The FKR’s shear design procedure considers the effect of
ductility on the shear strength of the RC elements subjected to blast loading.
Figure 6.9: Reaction force capacity of beams with different reinforcement ratios
6.2.3 Displacement
The maximum mid-span displacement of the models with various tensile reinforcement
ratios obtained from FE simulation and SDOF calculation are presented in table 6.7
and figure 6.10. As can be seen in the table 6.7 and figure 6.10, the maximum
displacement of beam’s midpoint calculated by both FE simulation and SDOF
calculations are close, however by increasing the ductility of the beam, the differences
become larger. The reason is that in the SDOF calculations, the plastic hardening of
the steel material is not totally considered. Thus at large plastic deformations, the
behaviour of FE model become stiffer than the SDOF calculations.

CHAPTER 6. SHEAR STRENGTH ANALYSIS OF BLAST LOADED RC BEAMS
75
Table 6.7: Maximum mid deflection of models with various concrete grades
Beam type
(mm)
FE-model SDOF SDOF/FE-model
C45R25 18.3 17.2 0.94
C45R20 21.2 22 1.04
C45R18 26.0 27.8 1.07
C45R15 32.6 36.7 1.12
Figure 6.10: Midspan displacement of models with different reinforcement ratios
6.3 Effect of beam’s depth
It is well known that the formal shear strength of a reinforced concrete beam is reduced
with an increased beam height. The effect when the shear strength of a beam is
reduced as the height is increased is commonly referred to the size effect. In order to
study the effect of beam size on the shear strength of air blast loaded beam, several
models with different depth size has been studied. Table 6.8 indicates the variety of
modelling with different beam’s height.
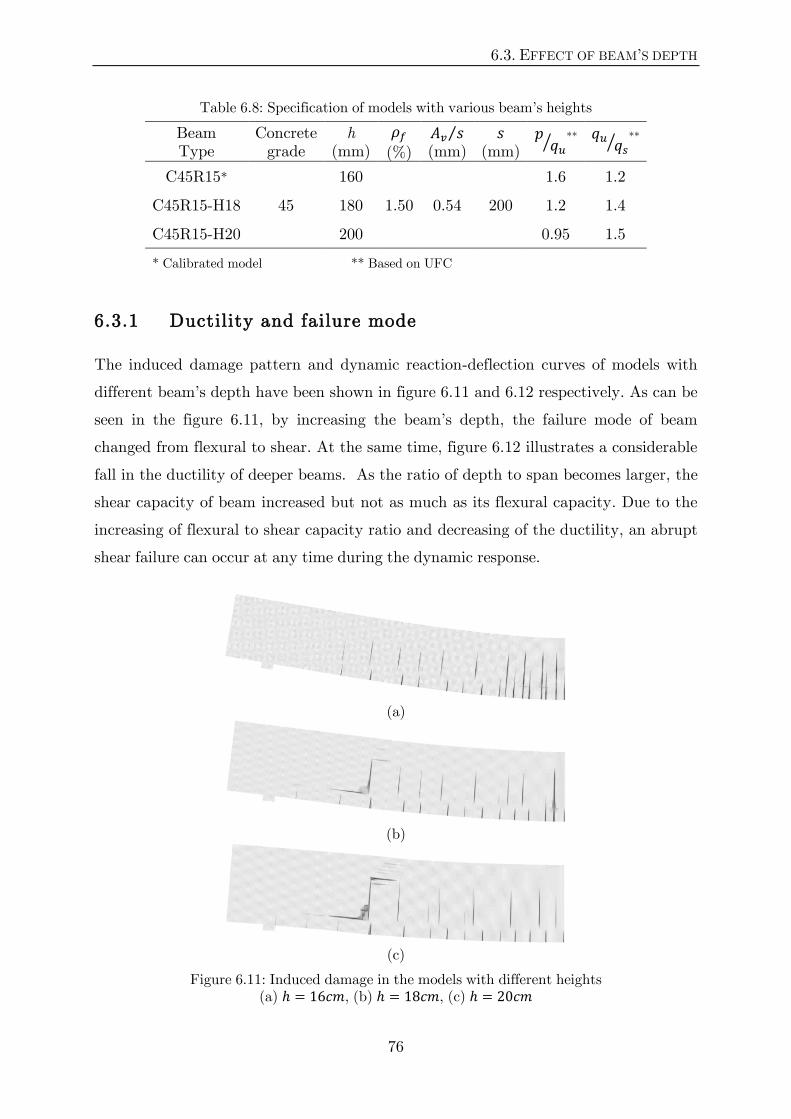
6.3. EFFECT OF BEAM’S DEPTH
76
Table 6.8: Specification of models with various beam’s heights
Beam Type
Concrete grade
h (mm)
(%)
⁄ (mm)
(mm)
⁄ **
⁄ **
C45R15*
45
160
1.50 0.54 200
1.6 1.2
C45R15-H18 180 1.2 1.4
C45R15-H20 200 0.95 1.5
* Calibrated model ** Based on UFC
6.3.1 Ductility and failure mode
The induced damage pattern and dynamic reaction-deflection curves of models with
different beam’s depth have been shown in figure 6.11 and 6.12 respectively. As can be
seen in the figure 6.11, by increasing the beam’s depth, the failure mode of beam
changed from flexural to shear. At the same time, figure 6.12 illustrates a considerable
fall in the ductility of deeper beams. As the ratio of depth to span becomes larger, the
shear capacity of beam increased but not as much as its flexural capacity. Due to the
increasing of flexural to shear capacity ratio and decreasing of the ductility, an abrupt
shear failure can occur at any time during the dynamic response.
(a)
(b)
(c)
Figure 6.11: Induced damage in the models with different heights (a) , (b) , (c)
CHAPTER 6. SHEAR STRENGTH ANALYSIS OF BLAST LOADED RC BEAMS
77
Figure 6.12: Dynamic reaction-deflection curve for models with different beam’s depth (based on the filtered data)
6.3.2 Reaction force and shear capacity
The results of maximum reaction forces of models with different beam’s depth obtained
from the FE analysis together with the calculated values based on the design codes are
presented in table 6.9. The reaction force capacity of each model calculated based on
the design codes also presented in the table 6.9.
Table 6.9: Result of reaction force analysis of models with various beam’s depth
Beam type
FE-model FKR UFC
Shear damage
*
(kN)
(kN)
(kN)
(kN)
(kN)
C45R15 ** No 328 253 270 244 198
C45R15-H18 Yes 375 315 317 336 233
C45R15-H20 Yes 425 388 390 419 274
*Based on filtered time history **h=16cm (see section 6.2)
6.3. EFFECT OF BEAM’S DEPTH
78
Figure 6.13 shows the variation of the maximum reaction force in models with different
depths for both FE analysis and code calculations. As can be seen in the table 6.9 and
figure 6.13, a softer beam with ductile behaviour carries lower reaction force under
same load intensity. The results also illustrate that the differences between codes and
the FE analysis become larger as the flexural capacity of the model decreased. The
results in figure 6.13 also confirm that the reaction forces from FE analysis and code
calculations became close together when the ratio of peak pressure to the ultimate
flexural capacity of beam is close to one.
Figure 6.13: Total reaction force of models with different beam’s heights
Figure 6.14 illustrates the comparison between the reaction force capacities of beams
based on the two understudied codes to the average of calculated maximum reaction
forces based on those codes. As can be seen in this figure, the calculated shear force
capacity of beam calculated based on the UFC code is more conservative. On the other
hand, the FKR approach can predict the failure behaviour of the model with
reasonable safety margin. Same as previous sections, the results in figure 6.14 show
that the FKR’s shear design procedure considers the effect of ductility on the shear
strength of blast loaded RC elements.
CHAPTER 6. SHEAR STRENGTH ANALYSIS OF BLAST LOADED RC BEAMS
79
Figure 6.14: Reaction force capacity of beams with different beam’s heights
6.3.3 Displacement
The maximum mid-span displacement of the models with various depths obtained
from FE simulation and SDOF calculation are presented in table 6.10 and figure 6.15.
As can be seen in the table 6.10 and figure 6.15, the maximum displacement of beam’s
midpoint calculated by both FE simulation and SDOF calculations are close, however
by increasing the ductility of the beam, the differences become larger. The reason is
that in the SDOF calculations, the plastic hardening of the steel material is not totally
considered. Thus at large plastic deformations, the behaviour of FE model is stiffer
than the SDOF calculations.
Table 6.10: Maximum mid deflection of models with various concrete grades
Beam type
(mm)
FE-model SDOF SDOF/FE-model
C45R15 32.6 36.7 1.12
C45R15-H18 16.0 15.2 0.95
C45R15-H20 9.1 8.5 0.93
6.4. EFFECT OF SHEAR REINFORCEMENT RATIO
80
Figure 6.15: Midspan displacement of models with different beam’s heights
6.4 Effect of shear reinforcement ratio
It is clear that by providing sufficient shear reinforcement in a stiff model, the risk of
an abrupt shear failure can be decreased. In order to control the effect of transverse
reinforcement ratio on the shear strength of air blast loaded beam, several models with
different amount of shear reinforcement has been studied. Table 6.11 indicates the
variety of modelling with different shear reinforcement ratios.
Table 6.11: Specification of models with various shear reinforcement ratios
Beam Type
Concrete grade
h (mm)
(%)
⁄ (mm)
(mm)
⁄ **
⁄ **
C45R25-S0
B45 160 2.45
0.0 --
1.1
2.5
C45R25* 0.54 200 1.7
C45R25-S13 0.83 130 1.4
C45R25-S6 1.66 65 1.0
* Calibrated model ** Based on UFC
CHAPTER 6. SHEAR STRENGTH ANALYSIS OF BLAST LOADED RC BEAMS
81
The results of the analysis with different amount of shear reinforcement are presented
in table 6.12. In this table, the results of simulation of the model can be compared to
the results obtained from design codes. As the shear reinforcement ratio, do not affect
the results of SDOF calculation, no SDOF calculation has been done in this section.
Table 6.12: Results of analysis with various shear reinforcement ratios
Beam type
FE-model FKR UFC
Shear Damage
(mm)
*
(kN)
(kN)
(kN)
(kN)
(kN)
C45R25-S0 Yes-Instability >85 361
370
181
361
144
C45R25 Yes 18.3 367 240 215
C45R25-S13 Yes 17.6 373 268 253
C45R25-S6 No 17.4 378 346 362
* Based on the filtered time history
As can be seen in the table 6.12, the effect of shear reinforcement ratio on the
calculated maximum deflection and reaction force of beams is not considerable.
Consequently, the ductility of model does not change. It must be noted that for model
with high risk of shear failure, a minimum amount of shear reinforcement is needed to
avoid instability in the results.
The induced damage pattern of models with different shear reinforcement ratios have
been shown in figure 6.16. As can be seen in this figure, by increasing the amount of
transverse reinforcement, the failure mode of beam changed from shear to flexural. By
using higher ratio of shear reinforcement, the ductility of model does not change,
however the ratio of flexural to shear capacity become smaller.
Figure 6.17 illustrates the comparison between the reaction force capacities of beams
based on the two understudied codes to the average of calculated maximum reaction
forces based on those codes. As can be seen in this figure, both design codes can predict
the failure behaviour of the model with reasonable safety margin.

6.4. EFFECT OF SHEAR REINFORCEMENT RATIO
82
(a)
(b)
(c)
(d)
Figure 6.16: Induced damage in the models with different shear reinforcement ratios (a) , (b) , (c) , (d)
Figure 6.17: Reaction force capacity of beams with different shear reinforcement ratios
83
Chapter 7
Conclusions and further research
7.1 Conclusions
7.1.1 Finite element analysis
The results of the present study show that it is possible to predict the response of
dynamically loaded simply supported RC beams as well as their failure modes by using
an explicit FE analysis. The numerical analyses of tested beams in chapter 5 shows
that the implemented FE-model successfully simulates the dynamic responses
including displacement/reaction force time histories and induced damage patterns with
reasonable accuracy.
To make as accurate calculation as possible, the material properties must be defined
based on the actual behaviour of concrete and reinforcing steel. To get a reasonable
estimation of induced damage, rather small element size should be used in all analyses.
The time increment size of explicit dynamic analysis has a great effect on the results.
In the present simulations, the size of time increment was selected small enough to
reach stability in the results. The results also showed that the strain rate effects
considerably affect the dynamic response of structure.
As it was discussed in chapter 5, due to the some limitations of CDP model in
considering the strain rate effects on concrete behaviour, simplified modelling of
supports and neglecting the damping effects, the post peak response of current
7.1. CONCLUSIONS
84
FE-model is not accurate and model need to be developed. In addition, the
representation of the inclined crack pattern in the case of shear failure is not fully
correct and must be improved.
In the case of brittle shear failure mode in FE-model, a minimum shear reinforcement
needed to avoid instability in the results.
7.1.2 Shear strength of air blast loaded RC beams
The results of parametric study in chapter 6 showed that the longitudinal
reinforcement ratio has a great effect on the failure behaviour of a blast loaded RC
beam. Based on the results, by decreasing the amount of tensile reinforcement in a
beam at the same load intensity, the risk of shear failure decreased as the ductility and
ratio of shear to flexural capacity of element increased.
A high strength concrete beam exhibited higher resistance against blast loading
compared to NSC beam. By using higher concrete grade in a beam, the risk of shear
failure under same load intensity decreases, however due to no considerable change in
flexural to shear capacity ratio and also decreasing the ductility of beam, it may fail in
shear at higher load intensities.
The results of analysis on the beams with different depth sizes illustrate that under the
same load intensity, the risk of shear failure increased as the size of a beam increased.
The reason may be that by increasing the depth of beam, both the ductility and shear
to flexural capacity decreased.
At higher ratio of flexural to shear capacity, the risk of shear failure become larger. An
abrupt shear failure can occur at early stages of the flexural response if the flexural
capacity of an element exceeds its shear capacity. For this reason, sufficient shear
capacity must be afforded by the concrete alone or in combination with shear
reinforcement in order to develop the flexural capacity of a stiff element.
The ductility plays an important role in the failure behaviour of a blast loaded RC
beam. The dynamic response of a soft element is more ductile than the stiffer one and
the shear forces are thereby limited. Thus, although a soft element fails by large
CHAPTER 7. CONCLUSIONS AND FURTHER RESEARCH
85
deformations in flexure, a stiff element may experience a brittle shear failure mode for
the same load intensity.
7.1.3 Design codes
The results of parametric studies on the various models show that the maximum
displacement of beam’s midpoint obtained from FE simulations are in good agreement
with SDOF calculations; except for models with large plastic deformations. The reason
may be describe in this way that the SDOF calculation neglect the effect of plastic
hardening of steel and consider a plastic perfectly plastic resistance function.
The comparisons between the results of numerical analysis and simplified calculation
based on the codes show that the calculated dynamic reaction forces based on the
codes are underestimated for beams with ductile behaviour. For stiffer beams, the
calculated reaction forces are in reasonable agreement with FE analysis, especially if
the peak load is close to the ultimate flexural capacity of the beam.
The results of analysis in chapter 6 show that the UFC’s procedure in shear design of
RC elements subjected to blast loading is conservative. It also must be noted that the
principal of UFC’s shear design approach is based on the quasi-static loading and do
not consider the ductility and flexural to shear capacity ratio effects on the failure
behaviour of the model. On the other hand, FKR suggests a procedure in shear design
that can predict the risk of shear failure in the models with reasonable safety margin.
This procedure somehow considers the effect of ductility and ratio of flexural to shear
capacity on the shear strength of RC elements subjected to impulsive loads.
7.2 Further research
The presented FE-model can be used as a powerful tool in order to theoretically study
the dynamic response of blast loaded RC elements and their failure modes especially in
shear. A comprehensive study on the influence of different parameters such as various
boundary conditions, amount and placement of reinforcement, concrete grades,
element sizes and various load intensities can be done. The results of FE analysis can
be used as a reference to derive simplified computational methods for practical design

7.2. FURTHER RESEARCH
86
purposes. It is also interesting to highlight a criterion when there is a risk of shear
failure modes appearing.
In the present research, several simplifications had been introduced in the implemented
FE-model. In the further research, the following modifications should be applied on the
model to increase its reliability and accuracy:
Development of the CDP material model in ABAQUS to consider the strain
rate effects perfectly in the concrete
Detailed modelling of the support such as using compression-only elements to
avoid any artificial tensile stresses in the concrete during the rebound and better
representation of post peak behaviour
Modelling the interaction between concrete and the reinforcement and study the
effect of bond-slip model one the dynamic behaviour, especially crack patterns
of FE-model
Study the improvement of crack pattern representations in model by study the
effect of different aspects such as using very finer mesh size or creating a
detailed full 3D model
Verification of the FE-model based on the results of more experimental
investigations with various boundary conditions, concrete grades and different
sizes
Consider the effect of damping to improve the post peak behaviour of model
Investigate the effect of symmetry boundary condition on the crack pattern
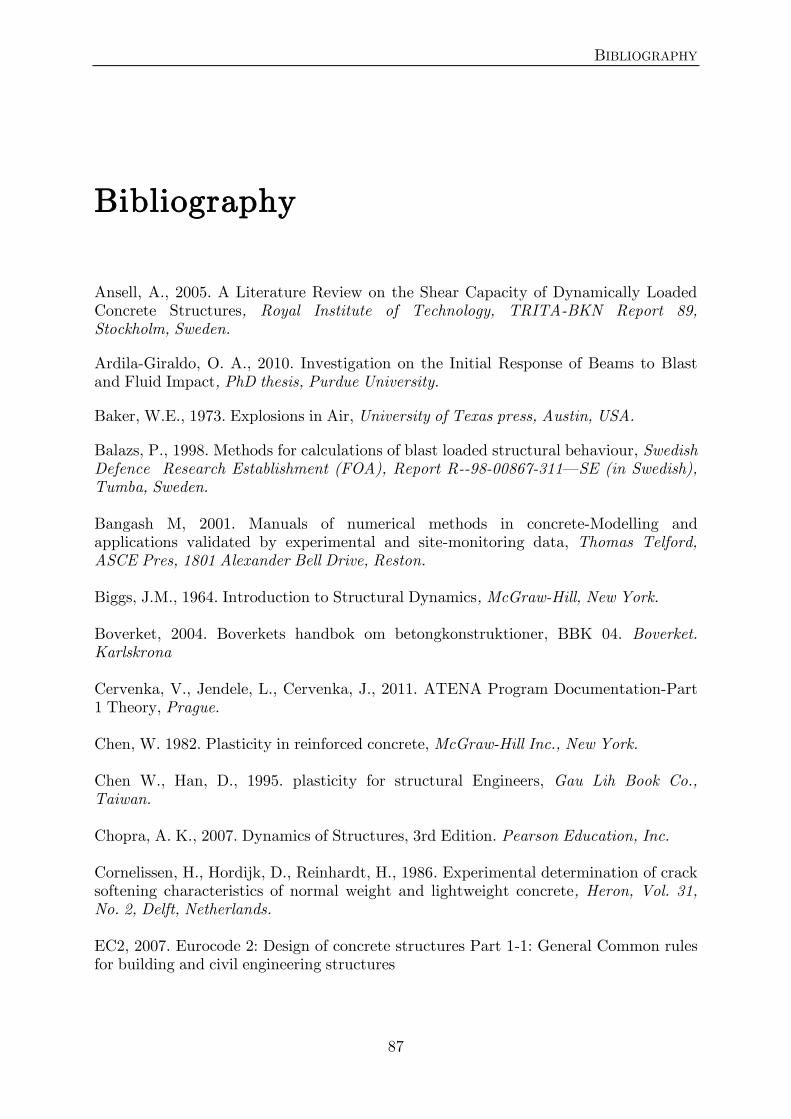
BIBLIOGRAPHY
87
Bibliography
Ansell, A., 2005. A Literature Review on the Shear Capacity of Dynamically Loaded Concrete Structures, Royal Institute of Technology, TRITA-BKN Report 89, Stockholm, Sweden.
Ardila-Giraldo, O. A., 2010. Investigation on the Initial Response of Beams to Blast and Fluid Impact, PhD thesis, Purdue University.
Baker, W.E., 1973. Explosions in Air, University of Texas press, Austin, USA.
Balazs, P., 1998. Methods for calculations of blast loaded structural behaviour, Swedish Defence Research Establishment (FOA), Report R--98-00867-311—SE (in Swedish), Tumba, Sweden. Bangash M, 2001. Manuals of numerical methods in concrete-Modelling and applications validated by experimental and site-monitoring data, Thomas Telford, ASCE Pres, 1801 Alexander Bell Drive, Reston. Biggs, J.M., 1964. Introduction to Structural Dynamics, McGraw-Hill, New York. Boverket, 2004. Boverkets handbok om betongkonstruktioner, BBK 04. Boverket. Karlskrona Cervenka, V., Jendele, L., Cervenka, J., 2011. ATENA Program Documentation-Part 1 Theory, Prague. Chen, W. 1982. Plasticity in reinforced concrete, McGraw-Hill Inc., New York. Chen W., Han, D., 1995. plasticity for structural Engineers, Gau Lih Book Co., Taiwan. Chopra, A. K., 2007. Dynamics of Structures, 3rd Edition. Pearson Education, Inc. Cornelissen, H., Hordijk, D., Reinhardt, H., 1986. Experimental determination of crack softening characteristics of normal weight and lightweight concrete, Heron, Vol. 31, No. 2, Delft, Netherlands. EC2, 2007. Eurocode 2: Design of concrete structures Part 1-1: General Common rules for building and civil engineering structures
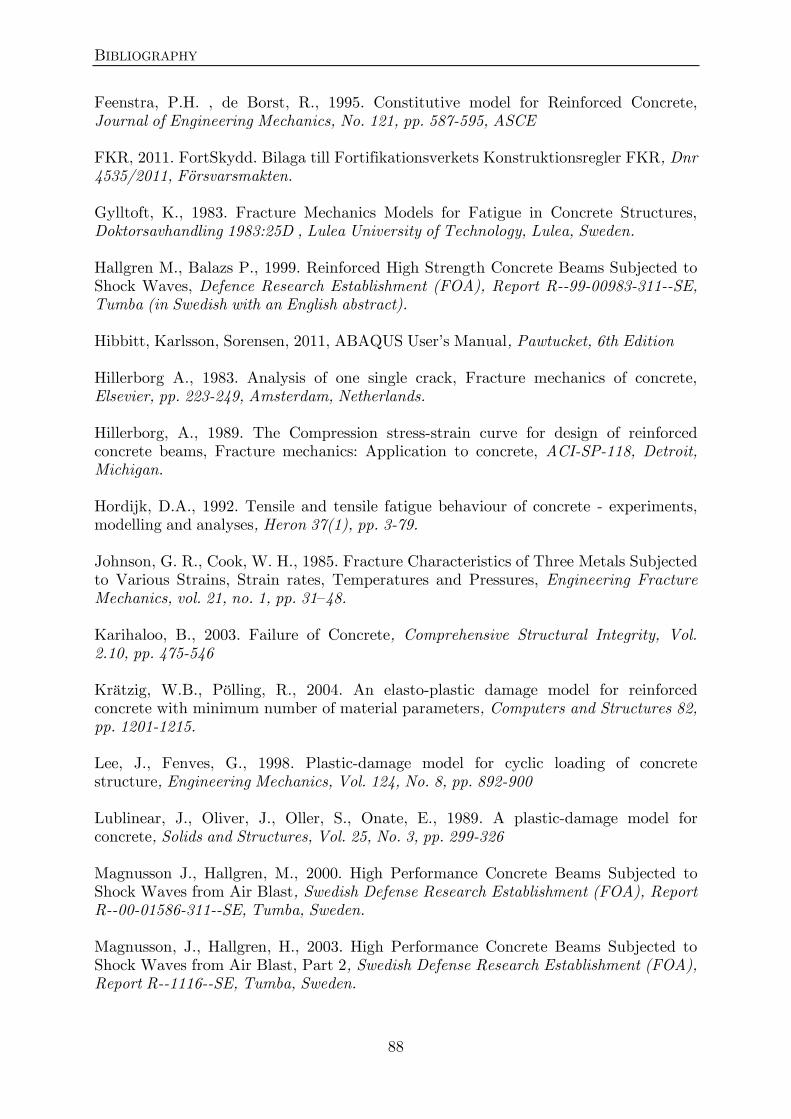
BIBLIOGRAPHY
88
Feenstra, P.H. , de Borst, R., 1995. Constitutive model for Reinforced Concrete, Journal of Engineering Mechanics, No. 121, pp. 587-595, ASCE FKR, 2011. FortSkydd. Bilaga till Fortifikationsverkets Konstruktionsregler FKR, Dnr 4535/2011, Försvarsmakten. Gylltoft, K., 1983. Fracture Mechanics Models for Fatigue in Concrete Structures, Doktorsavhandling 1983:25D , Lulea University of Technology, Lulea, Sweden. Hallgren M., Balazs P., 1999. Reinforced High Strength Concrete Beams Subjected to Shock Waves, Defence Research Establishment (FOA), Report R--99-00983-311--SE, Tumba (in Swedish with an English abstract). Hibbitt, Karlsson, Sorensen, 2011, ABAQUS User’s Manual, Pawtucket, 6th Edition Hillerborg A., 1983. Analysis of one single crack, Fracture mechanics of concrete, Elsevier, pp. 223-249, Amsterdam, Netherlands. Hillerborg, A., 1989. The Compression stress-strain curve for design of reinforced concrete beams, Fracture mechanics: Application to concrete, ACI-SP-118, Detroit, Michigan. Hordijk, D.A., 1992. Tensile and tensile fatigue behaviour of concrete - experiments, modelling and analyses, Heron 37(1), pp. 3-79. Johnson, G. R., Cook, W. H., 1985. Fracture Characteristics of Three Metals Subjected to Various Strains, Strain rates, Temperatures and Pressures, Engineering Fracture Mechanics, vol. 21, no. 1, pp. 31–48. Karihaloo, B., 2003. Failure of Concrete, Comprehensive Structural Integrity, Vol. 2.10, pp. 475-546 Krätzig, W.B., Pölling, R., 2004. An elasto-plastic damage model for reinforced concrete with minimum number of material parameters, Computers and Structures 82, pp. 1201-1215. Lee, J., Fenves, G., 1998. Plastic-damage model for cyclic loading of concrete structure, Engineering Mechanics, Vol. 124, No. 8, pp. 892-900 Lublinear, J., Oliver, J., Oller, S., Onate, E., 1989. A plastic-damage model for concrete, Solids and Structures, Vol. 25, No. 3, pp. 299-326 Magnusson J., Hallgren, M., 2000. High Performance Concrete Beams Subjected to Shock Waves from Air Blast, Swedish Defense Research Establishment (FOA), Report R--00-01586-311--SE, Tumba, Sweden. Magnusson, J., Hallgren, H., 2003. High Performance Concrete Beams Subjected to Shock Waves from Air Blast, Part 2, Swedish Defense Research Establishment (FOA), Report R--1116--SE, Tumba, Sweden.

BIBLIOGRAPHY
89
Magnusson, J., Hansson, H., 2005. Simulations of Air Blast Loaded Structural Reinforced Concrete Elements, Swedish Defense Research Agency (FOI), Report R1764, Sweden. Magnusson, J., 2007. Structural Concrete Elements subjected to Air Blast Loading, Licentiate thesis, Royal Institute of Technology, Division of Concrete Structures, Stockholm, Sweden. Malm, R., 2006. Shear Cracks in Concrete Structures Subjected to in-plane stresses, Licentiate thesis, Royal Institute of Technology, Division of Structural Design and Bridges, Stockholm, Sweden. Malm, R., 2009. Predicting Shear Type Cracks Initiation and Growth in Concrete with Nonlinear Finite Elements Methods, PhD thesis, Royal Institute of Technology, Division of Structural Design and Bridges, Stockholm, Sweden. Malvar, L.J., Crawford, J.E., 1998a. Dynamic increase factors for concrete, Department of Defence Explosives Safety Seminar (DDESB), Orlando FL, USA. Malvar, L.J., Crawford, J.E, , 1998b. Dynamic increase factors for steel reinforcing bars, Department of Defence Explosives Safety Seminar (DDESB), Orlando FL, USA. Mays, G.C., Smith, P.D., 1995. Blast Effects on Buildings, Thomas Telford Publications, London. MC90, 1993. CEB-FIP Model Code 1990, Design Code, 6th edition, Thomas Telford, Lausanne, Switzerland. MC2010, 2010. CEB-FIP Model Code 2010, Design Code, 1st draft, Thomas Telford, Lausanne, Switzerland. Ngo T., Mendis, P., Gupta, A., Ramsay, J., 2007. Blast Loading and Blast Effects on Structures, Int., J. Struc Eng., Australia, pp.76-91. Pankaj, P. 2010. Real Structural Behavior and Its Analysis - Material Nonlinearity, Lecture Note(Accessed 2010.11.22). URL www.see.ed.ac.uk/pankaj/real structural behaviour/ Saatci, S., and Vecchio, F. J., 2009a. Effects of Shear Mechanisms on Impact Behavior of Reinforced Concrete Beams, ACI Structural Journal, V. 106, No. 1, pp. 78-86. Saatci, S., and Vecchio, F. J., 2009b. Nonlinear Finite Element Modeling of Reinforced Concrete Structures under Impact Loads, ACI Structural Journal, V. 106, No. 5, pp. 717-725. Sinha BP, Gerstle KH, Tulin LG, 1964. Stress–strain relations for concrete under cyclic loading, ACI Journal, 61:195, 211. UFC, 2008. Structures to Resist the Effects of Accidental Explosions, Unified Facilities Criteria 3-340-02, US. Army Corps of Engineers, Washington, D.C.

BIBLIOGRAPHY
90
Van Mier JGM., 1984. Strain-Softening of Concrete Under Multiaxial Loading Conditions. PhD thesis, Delft University of Technology. Van Mier JGM., 1986. Multiaxial Strain-Softening of Concrete, Mater. & Struc. (RILEM) ,19(111), pp. 179-200 Van Wees, R.M.M., Peters, D-J., 1995. Accuracy and range of applicability of the single degree-of-freedom method, Proceeding of the 7th Int. Symp. on Interaction of the Effects of Munitions with Structures, pp. 371-380, Mannheim. Vonk, RA. 1992. Softening of concrete loaded in compression, PhD thesis, Delft University of Technology. Weerheijm, J., Van Doormaal J.C.A.M, 2007. Tensile failure of concrete at high loading rates; new test data on strength and fracture energy from instrumented spalling tests. Impact Engineering, Vol. 34, p.609 - 626.
Zielinski, A.J, 1984. Concrete Structures under Impact Loading Rate Effects, Delft University of Technology, Report 5-84-14, Delft, the Netherlands, 1984. Zukas, J. A. and Scheffler, D. R., 2000. Practical aspects of numerical simulations of dynamic events: Effects of meshing. International Journal of Impact Engineering, Vol. 24, No. 9, October, pp. 925-945.
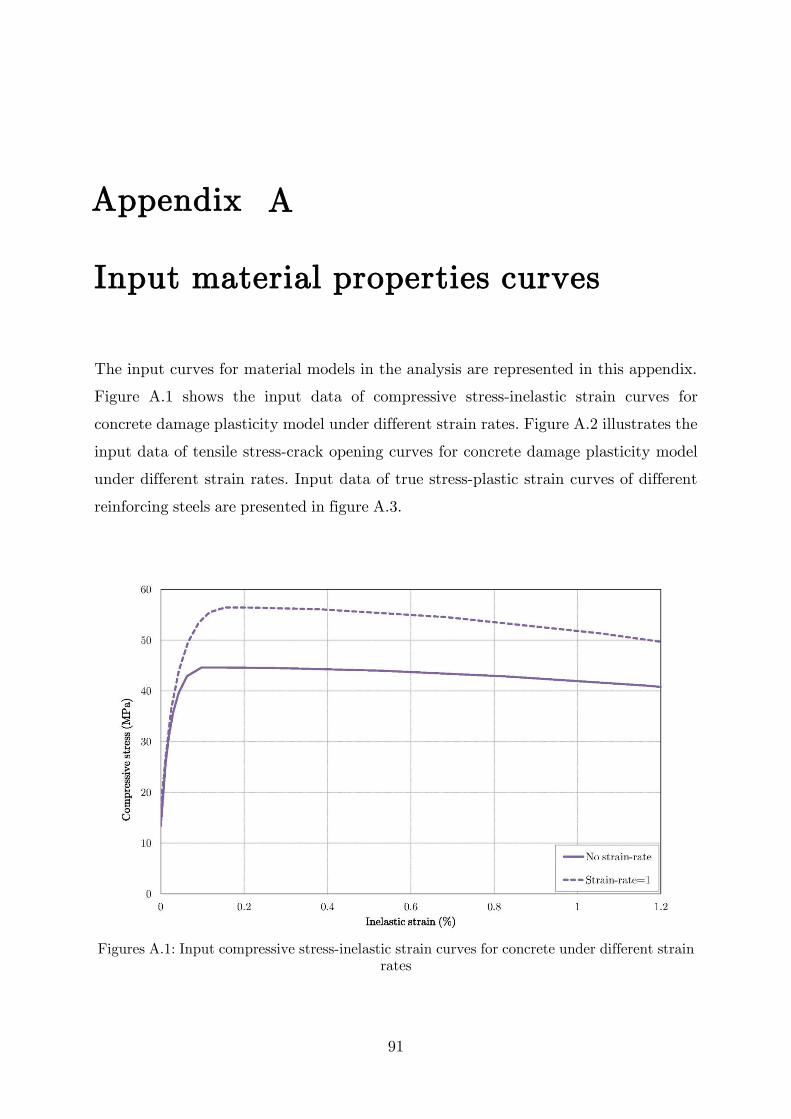
91
A Input material properties curves
The input curves for material models in the analysis are represented in this appendix.
Figure A.1 shows the input data of compressive stress-inelastic strain curves for
concrete damage plasticity model under different strain rates. Figure A.2 illustrates the
input data of tensile stress-crack opening curves for concrete damage plasticity model
under different strain rates. Input data of true stress-plastic strain curves of different
reinforcing steels are presented in figure A.3.
Figures A.1: Input compressive stress-inelastic strain curves for concrete under different strain rates
Appendix
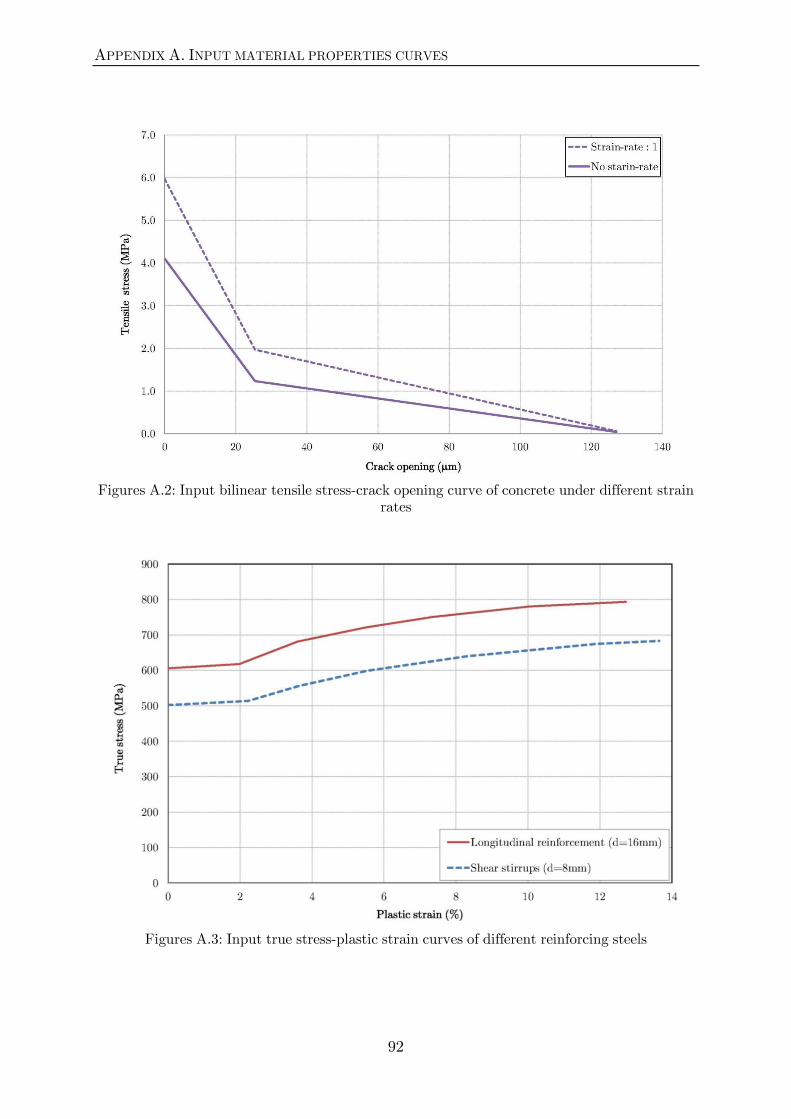
APPENDIX A. INPUT MATERIAL PROPERTIES CURVES
92
Figures A.2: Input bilinear tensile stress-crack opening curve of concrete under different strain rates
Figures A.3: Input true stress-plastic strain curves of different reinforcing steels

93
B Approximation of pressure loads
The registered pressure-time function of the air blast tests needed to be approximated
into linear piecewise pressure-time functions in order to use in the numerical analysis.
A simple triangular approximation is also done in order to compare the results of FE-
model and SDOF calculations. In the approximations of the pressure loads it was
necessary to compare the respective impulse densities. Figure B.1 shows the
approximation of pressure time history obtained from B40-D4 test and corresponding
variations in the impulse densities. The linear piecewise function shows good fit to the
registered pressure curve, whereas the impulse density of the triangular load shows
good agreement with the real registration up to the time about 10 ms, which is just the
point of time beyond maximum deflection. Table B.1 and B.2 represents the data of
approximated linear piecewise and triangular pressure loads for B40-D4 analysis,
respectively.
Figure B.2 shows the approximation of pressure time history obtained from B40-D3
test and corresponding variations in the impulse densities. The linear piecewise
function shows good fit to the registered pressure curve, whereas the impulse density of
the triangular load shows good agreement with the real registration up to the time
about 8 ms, which is just the point of time beyond maximum deflection. Table B.3 and
B.4 represents the data of approximated linear piecewise and triangular pressure loads
for B40-D3 analysis, respectively.
Appendix

APPENDIX B. APPROXIMATION OF PRESSURE LOADS
94
Figure B.1: Linearly piecewise approximation of pressure time history of tested beam B40-D4
APPENDIX B. APPROXIMATION OF PRESSURE LOADS
95
Figure B.2: Linearly piecewise approximation of pressure time history of tested beam B40-D3
APPENDIX B. APPROXIMATION OF PRESSURE LOADS
96
Table B.1: Piecewise pressure of B40-D4
Table B.2: Triangular pressure of B40-D4
t (ms) p (kPa) t (ms) p (kPa)
0 0 0 870
0.07 1170 12 0
1.97 610
2.87 710
4.77 410
5.42 500
7.47 250
8.17 380
9.47 210
15 100
20 45
25 0
Table B.3: Piecewise pressure of B40-D3
Table B.4: Triangular pressure of B40-D3
t (ms) p (kPa) t (ms) p (kPa)
0 0 0 645
0.07 800 10.5 0
1.66 520
2.3 380
3.1 490
4.29 320
4.66 380
5.85 240
6.4 330
7.5 200
11 140
15 75
22 35
29.5 0
97
C Convergence study
C.1 Mesh size
In order to find the maximum acceptable element size, the static behaviour of modelled
beam with elastic material property subjected to a uniform pressure has been studied.
Figure C.1 shows the mesh size convergence study of elastic beam. As can be seen in
this figure, for an elastic beam subjected to static pressure, by choosing the mesh size
about 7.5 millimetres, the estimated error in shear, displacement and moment is about
1, 2 and 4 percent respectively.
Figure C.1: Mesh convergence study for elastic beam under uniformly static pressure
Appendix
APPENDIX C. CONVERGENCE STUDY
98
In nonlinear dynamic analysis, the mesh size dependency is even more sensitive than
for elastic static loading. The strain rate dependent material models also show more
sensitivity to the mesh size in the cracked medium, Zukas and Scheffler (2000). Refined
mesh also may represent better visualization of crack pattern, Malm (2006). Figure C.2
shows the mid-span displacement time history resulted from nonlinear explicit
dynamic analysis of B40-D4 test for different element size. As can be seen in figure C.1,
under static loading, the difference between maximum displacement of elastic models
with element size 7.5mm and 2.5mm is negligible. On the contrary, figure C.2 shows
that in the case of nonlinear dynamic analysis, the difference between maximum
displacements of models with mentioned element sizes is about 40%.
Figure C.2: Convergence of displacement time history of B40-D4 test based on different element size
C.2 Time increment size
Figures C.3 shows the convergence of mid-span deflection of model for different time
increment sizes. As can be seen in this figure, in order to obtain a stable output, time
increment must be at several times smaller than the original value estimated
automatically. Thus, in this report all analysis have been performed with a fixed time
increment equal to . For smallest element size in use, this value is about 20
times smaller than the automatic estimation by ABAQUS.
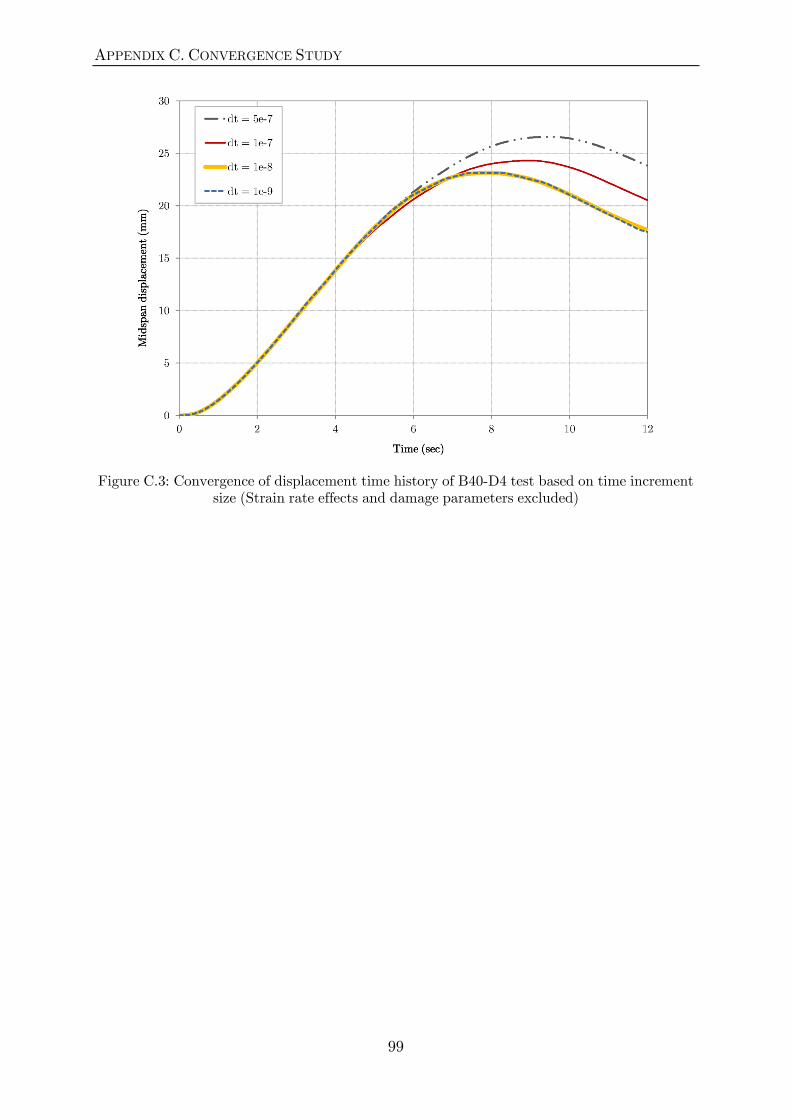
APPENDIX C. CONVERGENCE STUDY
99
Figure C.3: Convergence of displacement time history of B40-D4 test based on time increment size (Strain rate effects and damage parameters excluded)

101
D Filtration of output curves
As it mentioned in the chapter 5, due to the neglecting the damping effects, the
reaction force time histories obtained from FE analysis contain high frequency
oscillations. In this analysis for better comparison of results and find a smoother
curves, the reaction force time history curves have been filtered by using MATLAB.
For calibration and verification of FE-model based on some tests’ results in chapter 5,
the frequencies higher than 250-300 Hz have been filtered to get the smoothest curve
and make it comparable with the filtered curves from the tests.
In chapter 6 for comparison the maximum reaction force calculated by FE-model with
the Codes’ calculations, the obtained FE-curves filtered in such a way that give an
average of oscillations in the unfiltered curve. Figures D1 and D2 show the unfiltered
and filtered curves of reaction force time histories obtained from B40-D4 and B40-D3
analysis respectively.
Appendix
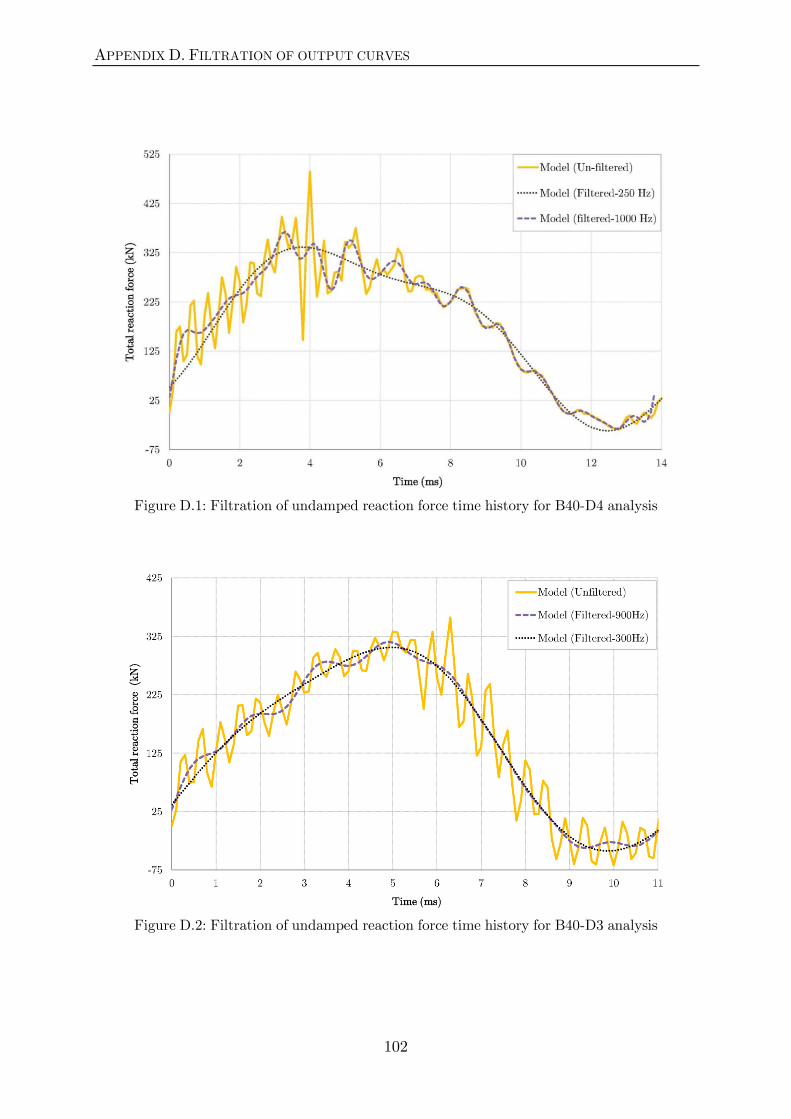
APPENDIX D. FILTRATION OF OUTPUT CURVES
102
Figure D.1: Filtration of undamped reaction force time history for B40-D4 analysis
Figure D.2: Filtration of undamped reaction force time history for B40-D3 analysis
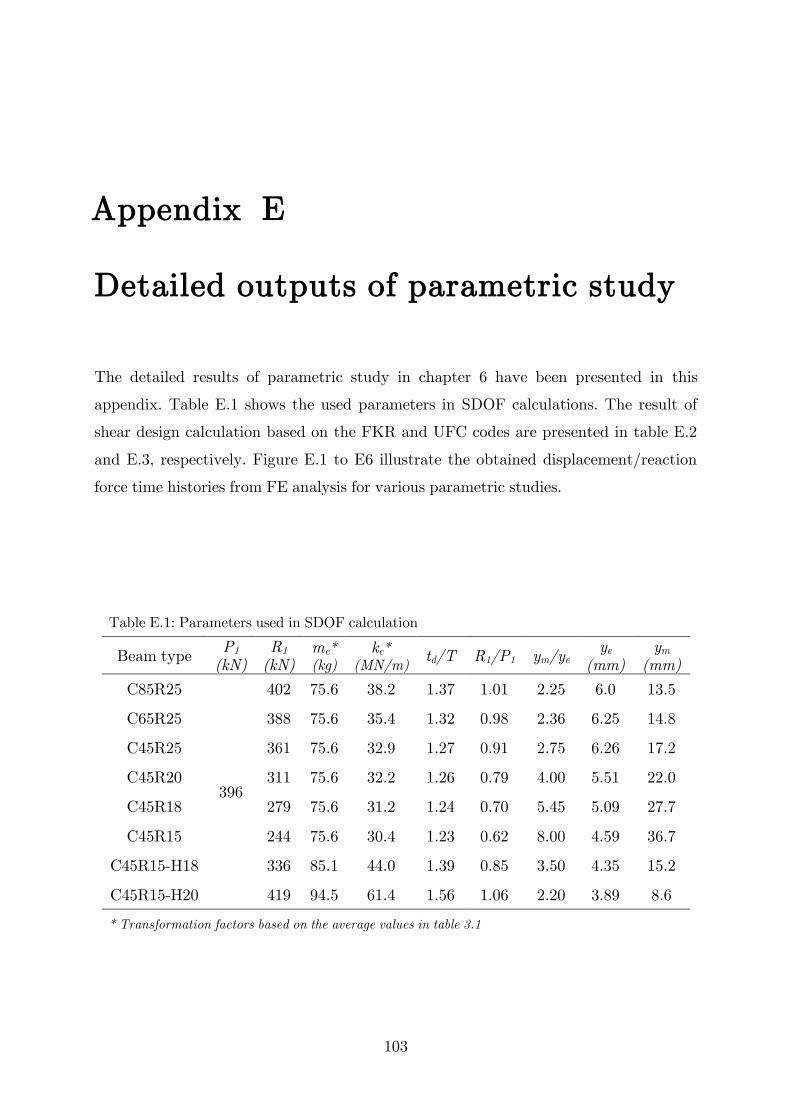
103
E Detailed outputs of parametric study
The detailed results of parametric study in chapter 6 have been presented in this
appendix. Table E.1 shows the used parameters in SDOF calculations. The result of
shear design calculation based on the FKR and UFC codes are presented in table E.2
and E.3, respectively. Figure E.1 to E6 illustrate the obtained displacement/reaction
force time histories from FE analysis for various parametric studies.
Table E.1: Parameters used in SDOF calculation
Beam type P1
(kN) R1
(kN) me*
(kg) ke*
(MN/m) td/T R1/P1 ym/ye
ye (mm)
ym (mm)
C85R25
396
402 75.6 38.2 1.37 1.01 2.25 6.0 13.5
C65R25 388 75.6 35.4 1.32 0.98 2.36 6.25 14.8
C45R25 361 75.6 32.9 1.27 0.91 2.75 6.26 17.2
C45R20 311 75.6 32.2 1.26 0.79 4.00 5.51 22.0
C45R18 279 75.6 31.2 1.24 0.70 5.45 5.09 27.7
C45R15 244 75.6 30.4 1.23 0.62 8.00 4.59 36.7
C45R15-H18 336 85.1 44.0 1.39 0.85 3.50 4.35 15.2
C45R15-H20 419 94.5 61.4 1.56 1.06 2.20 3.89 8.6
* Transformation factors based on the average values in table 3.1
Appendix
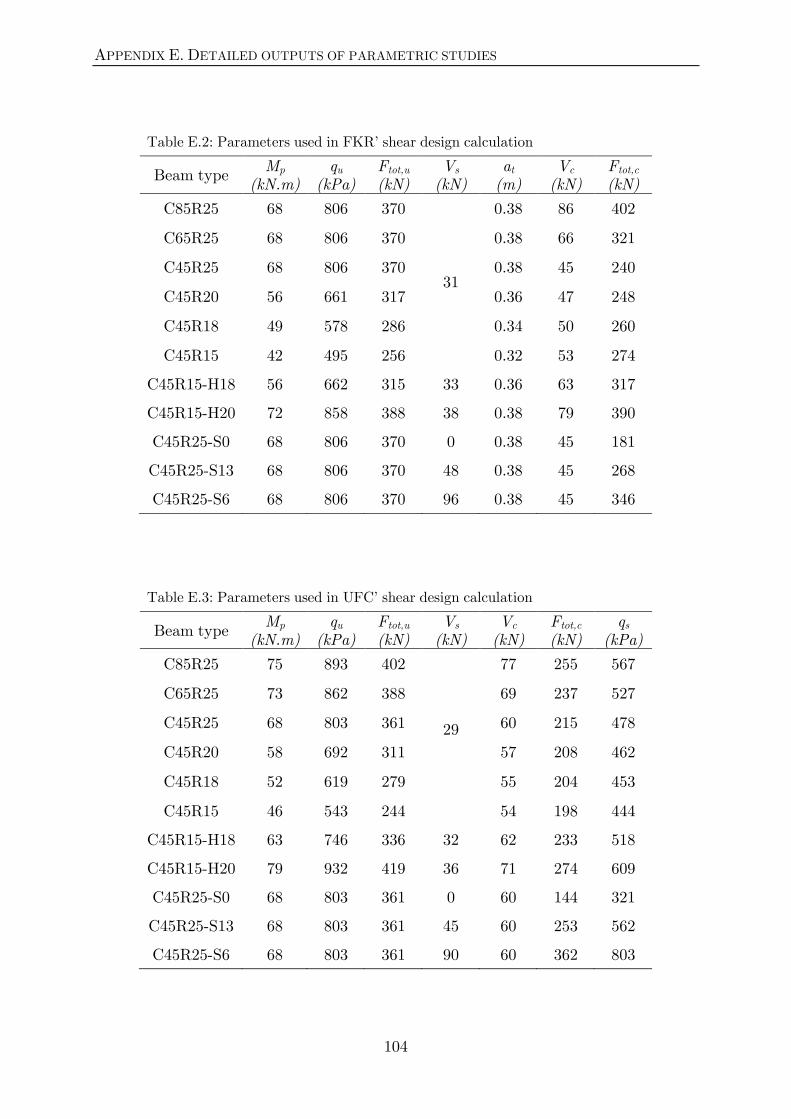
APPENDIX E. DETAILED OUTPUTS OF PARAMETRIC STUDIES
104
Table E.2: Parameters used in FKR’ shear design calculation
Beam type Mp
(kN.m) qu
(kPa) Ftot,u (kN)
Vs (kN)
at (m)
Vc (kN)
Ftot,c (kN)
C85R25 68 806 370
31
0.38 86 402
C65R25 68 806 370 0.38 66 321
C45R25 68 806 370 0.38 45 240
C45R20 56 661 317 0.36 47 248
C45R18 49 578 286 0.34 50 260
C45R15 42 495 256 0.32 53 274
C45R15-H18 56 662 315 33 0.36 63 317
C45R15-H20 72 858 388 38 0.38 79 390
C45R25-S0 68 806 370 0 0.38 45 181
C45R25-S13 68 806 370 48 0.38 45 268
C45R25-S6 68 806 370 96 0.38 45 346
Table E.3: Parameters used in UFC’ shear design calculation
Beam type Mp
(kN.m) qu
(kPa) Ftot,u (kN)
Vs (kN)
Vc (kN)
Ftot,c (kN)
qs (kPa)
C85R25 75 893 402
29
77 255 567
C65R25 73 862 388 69 237 527
C45R25 68 803 361 60 215 478
C45R20 58 692 311 57 208 462
C45R18 52 619 279 55 204 453
C45R15 46 543 244 54 198 444
C45R15-H18 63 746 336 32 62 233 518
C45R15-H20 79 932 419 36 71 274 609
C45R25-S0 68 803 361 0 60 144 321
C45R25-S13 68 803 361 45 60 253 562
C45R25-S6 68 803 361 90 60 362 803
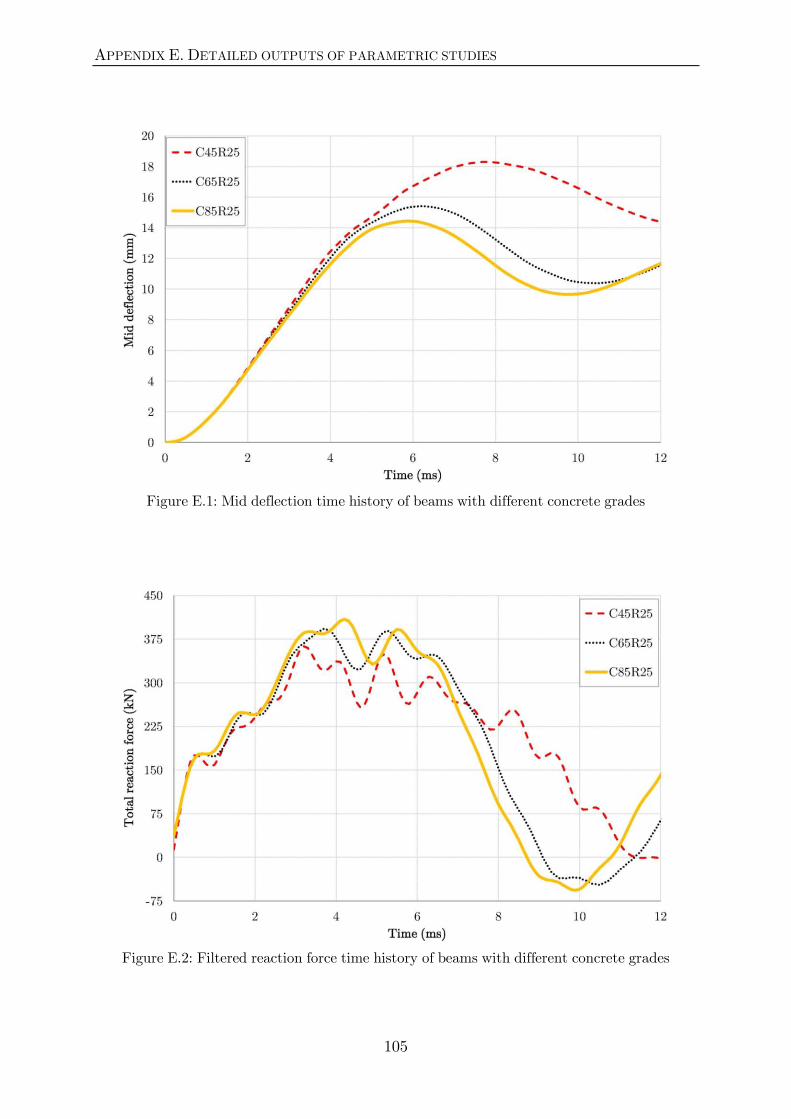
APPENDIX E. DETAILED OUTPUTS OF PARAMETRIC STUDIES
105
Figure E.1: Mid deflection time history of beams with different concrete grades
Figure E.2: Filtered reaction force time history of beams with different concrete grades
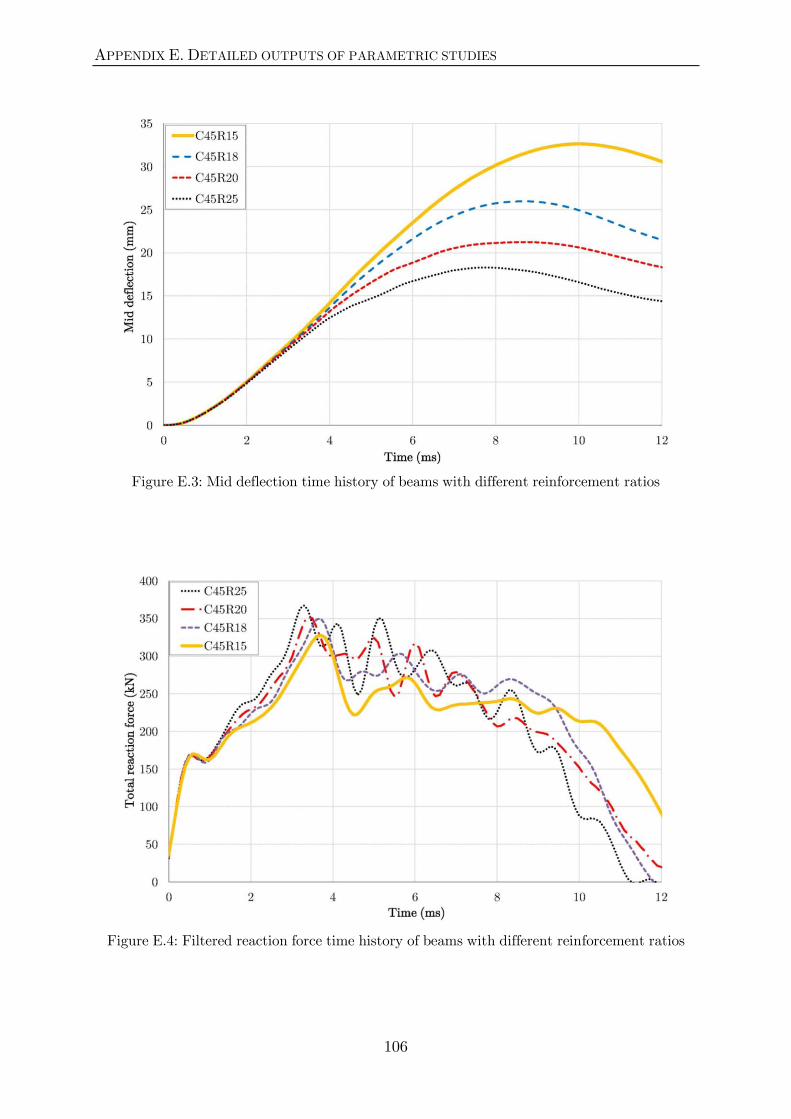
APPENDIX E. DETAILED OUTPUTS OF PARAMETRIC STUDIES
106
Figure E.3: Mid deflection time history of beams with different reinforcement ratios
Figure E.4: Filtered reaction force time history of beams with different reinforcement ratios
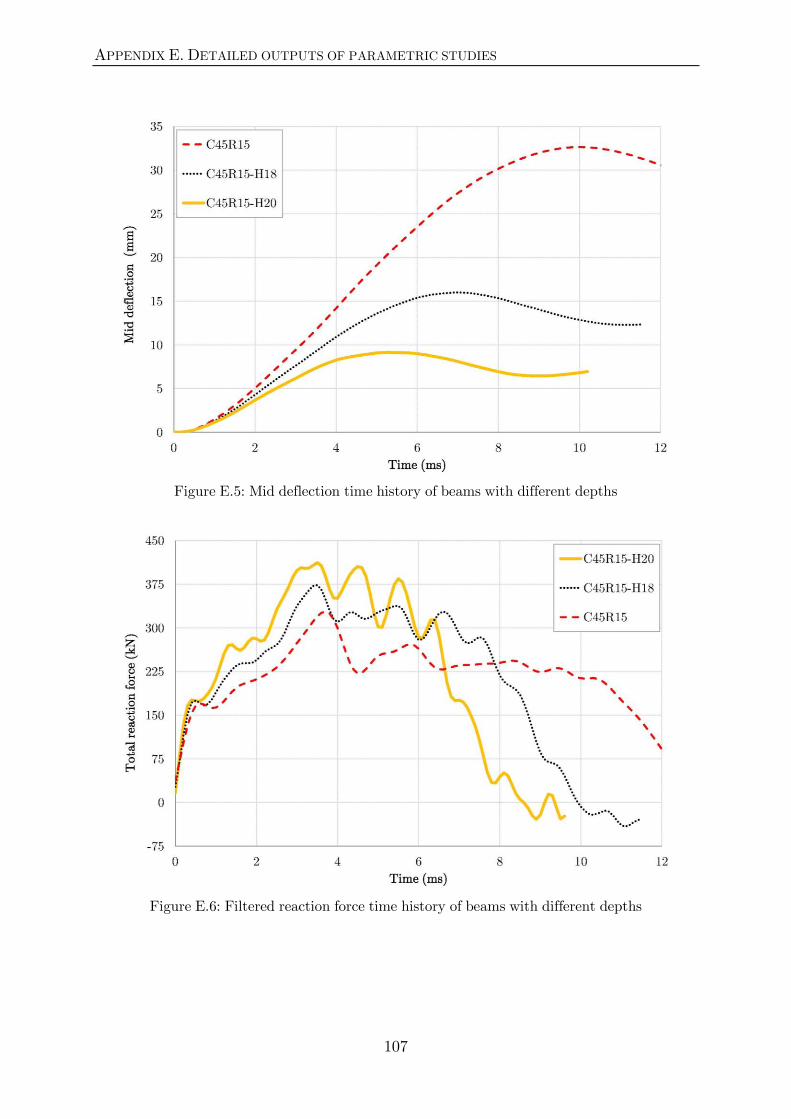
APPENDIX E. DETAILED OUTPUTS OF PARAMETRIC STUDIES
107
Figure E.5: Mid deflection time history of beams with different depths
Figure E.6: Filtered reaction force time history of beams with different depths


109
F Static analysis
Before dynamic analysis, the model have been calibrated and verified according to the
results of static test. A displacement control quasi-static explicit analysis has been
done and results presented in figures F.1 to F.3. In the static analysis, the dilation
angle was assumed and the damage parameters were neglected.
The results show that the FE-model can successfully predict the static responses of
beam such as load-deflection curve and load-strain measurement curves. Due to the
local stress concentration problem under loading plates, the static analysis has been
done with the coarser element size (20mm). For this reason, the crack pattern obtained
from FE-analysis is not accurate but figure F.1 shows that the FE-model at least can
represent the failure mode of beam.
(a)
(b)
Figure F.1: (a) Observed crack pattern in beam under 4-point static loading failed due to the concrete crushing, (b) Compressive plastic strain contour in the FE-model
Appendix

APPENDIX F. STATIC ANALYSIS
110
Figure F.2: Load-Deflection curve of beam in static test compare to the FE-model
Figure F.3: Load-Strain curve of beam in static test compare to the FE-model


TRITA-BKN. Master Thesis 368,
Structural Engineering and Bridges 2012
ISSN 1103-4297
ISRN KTH/BKN/EX-368-SE
www.kth.se